

Sample Category Title
EUR/USD Daily Outlook
Daily Pivots: (S1) 1.0772; (P) 1.0842; (R1) 1.0926; More...
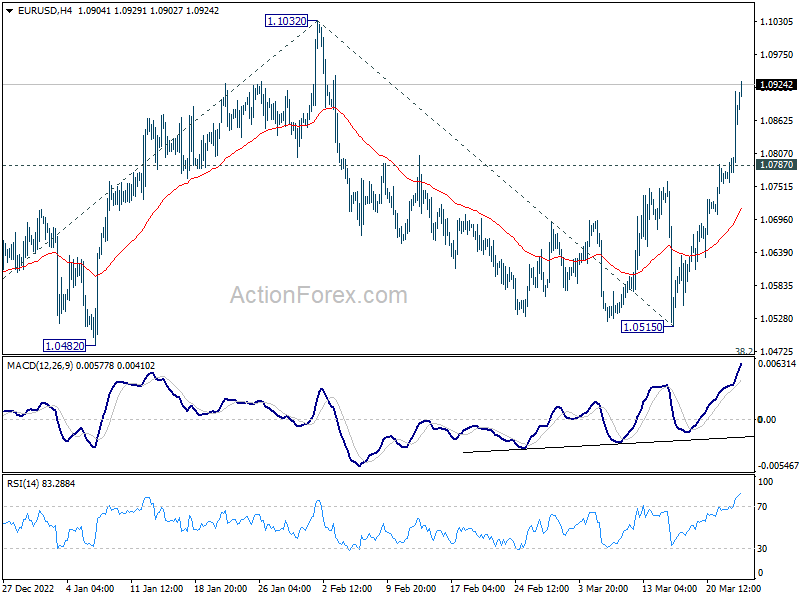
EUR/USD's rise from 1.0515 accelerates higher and intraday bias stays on the upside for retesting 1.1032 high. Decisive break there will resume whole up trend from 0.9534 and target 1.1273 fibonacci level next. On the downside, below 1.0787 minor support will turn intraday bias neutral and bring consolidations first, before staging another rally.
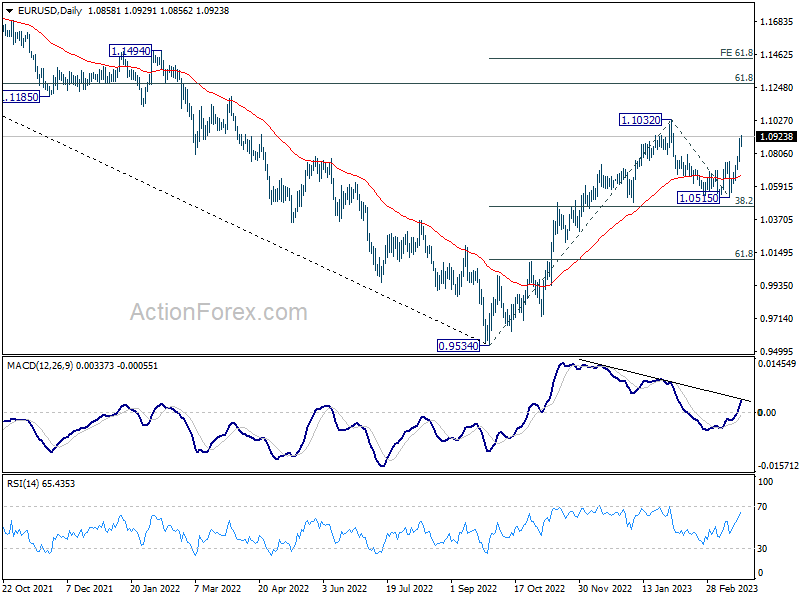
In the bigger picture, rise from 0.9534 (2022 low) is in progress with 38.2% retracement of 0.9534 to 1.1032 at 1.0460 intact. The strong support from 55 week EMA (now at 1.0623) was also a medium term bullish sign. Next target is 61.8% retracement of 1.2348 (2021 high) to 0.9534 at 1.1273. Sustained break there will solidity the case of bullish trend reversal and target 1.2348 resistance next (2021 high).
Euro Leads Gains as Dollar Struggles Post-FOMC; BoE and SNB Decisions Take Center Stage
Dollar faced broad sell-off overnight after the less hawkish than expected Fed rate hike and press conference, with Euro emerging as the biggest winner against the greenback. Sterling and Swiss Franc followed suit, while Australian and New Zealand dollars also strengthened but lagged on a weekly basis.
Attention now shifts to BoE and SNB rate decisions. Both are expected to continue their rate hike cycles, but uncertainties remain about the path ahead. Any outcome perceived as less hawkish could push Euro further up, aided by an extended rally in EUR/CHF and a stronger rebound in EUR/GBP.
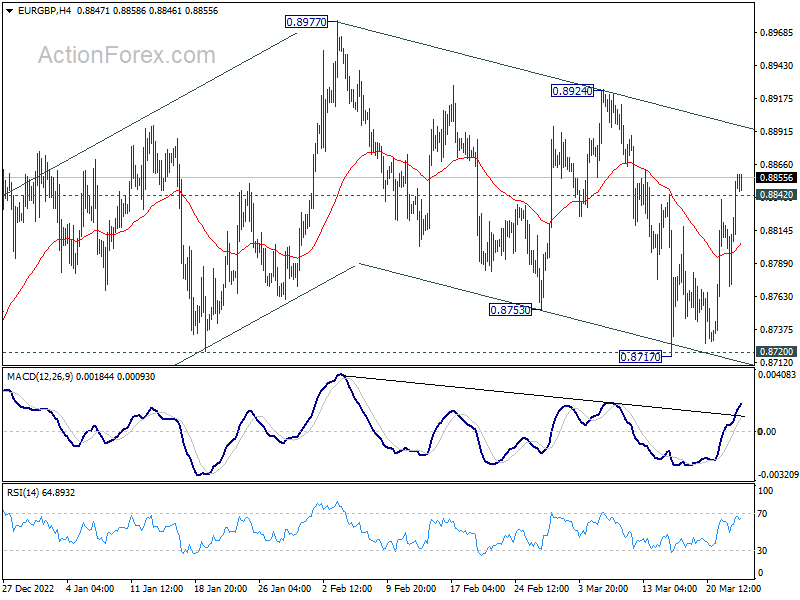
Technically, EUR/GBP's break of 0.8842 minor resistance affirm the case that corrective fall from 0.8977 has completed with three waves down to 0.8717, after drawing support from 0.8720. Further break of 0.8924 resistance will send the cross through 0.8977 to resume whole rise from 0.8545 (2022 low).
In Asia, Nikkei closed down -0.17%. Hong Kong HSI is up 1.74%. China Shanghai SSE is up 0.48%. Singapore Strait Times is down -0.14%. Japan 10-year JGB yield is down -0.0295 at 0.305. Overnight, DOW dropped -1.63%. S&P 500 dropped -1.65%. NASDAQ dropped -1.60%. 10-year yield dropped -0.106 to 3.500
S&P 500 down, reacted more to Yellen than Powell?
US markets experienced a complex development overnight due to simultaneous reactions to two events. Initially, the markets responded bullishly to the Fed's less hawkish than expected rate hike and press conference. However, just an hour before the close, sellers jumped in, and the three major indexes closed -1.6% lower.
The selloff might be more attributed to Treasury Secretary Janet Yellen's comments at a Senate committee. She explicitly stated, "I have not considered or discussed anything having to do with blanket insurance or guarantees of deposits."
Yellen further elaborated, "when a bank failure is deemed to create systemic risk, which I think of as the risk of a contagious bank run...we are likely to invoke the systemic risk exception, which permits the FDIC to protect all depositors, and that would be a case-by-case determination."
Meanwhile, Asian markets have remained sluggish and mixed today, without any apparent signs of bearishness carried over. It may take some more time to understand the unfolding situation fully.
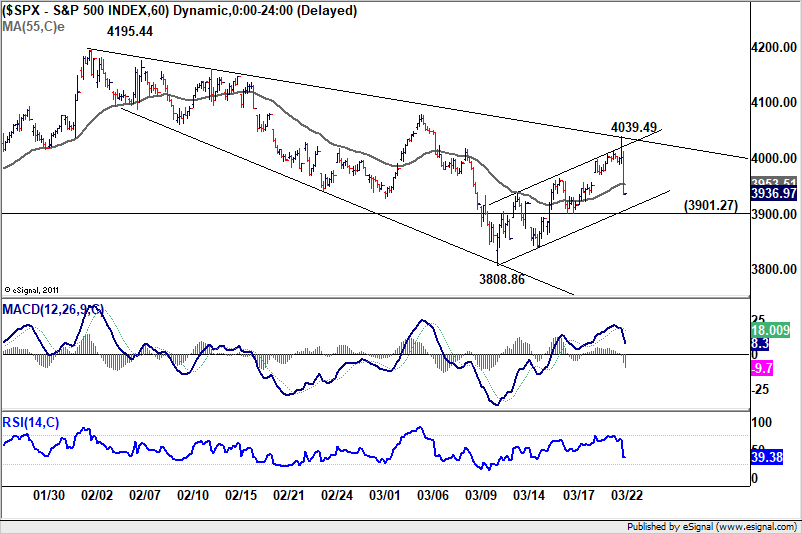
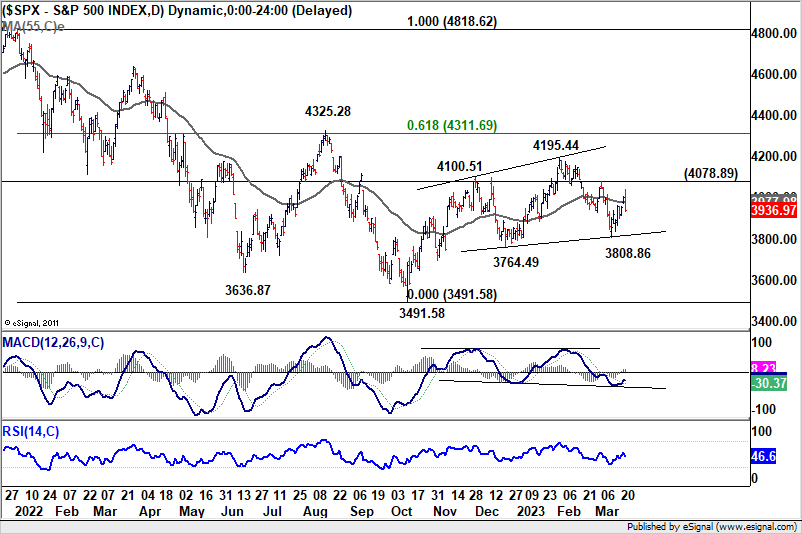
Technically, near term outlook in S&P 500 isn't too bearish yet given it's holding inside a near term channel. However, break of 3901.27 support will argue that the corrective rebound from 3808.85 has completed at 4039.49, after hitting falling trend line resistance. Deeper selloff would then follow through 3808.86 to resume whole decline from 4195.44.
Fed softened hawkish tone, but not dovish
In light of the Fed announcement and press conference overnight, it appears that another 25bps rate hike is likely in May, followed by a prolonged pause with no rate cut expected until next year. The overall picture remains hawkish, albeit not as much as after Fed Chair Jerome Powell's earlier testimony this month.
As anticipated, Fed raised interest rates by 25bps to 4.75-5.00%. While the tightening bias was maintained, the statement softened its tone, stating, "some additional policy firming may be appropriate." Despite recent market turmoil, median projections still indicated an interest rate peak of 5.1% this year, suggesting one more 25bps hike before pausing until next year. The median projection for 2024 interest rate increased from 4.1% to 4.3%, signaling a slower path of rate cuts.
During the post-meeting press conference, Powell acknowledged that "financial conditions seem to have tightened" recently, adding that if the situation persists, it could "easily have a significant macroeconomic effect, and we would factor that into our policy decisions." While he admitted that a pause was considered during the meeting, he emphasized that a rate cut this year was "not our baseline expectation," stating, "the key is we have to have policies tight enough to bring inflation down to 2%."
Suggested readings on Fed:
- FOMC's Fight Against Inflation Finely Balanced
- FOMC Hikes Rates, But End of Tightening Cycle Coming Into View
- Suderman Says: Rates Up as Expected, But Peak in Sight?
- FOMC Hikes Policy Rate by 25 Basis Points, Cautions on Bank Stress
- Fed hikes 25 bps, terminal rate forecast unchanged at 5.1%
- (FED) Federal Reserve Issues FOMC Statement
GBP/CHF extending range trading ahead of BoE and SNB
BoE and SNB are both expected to raise interest rates today. A 25bps hike by BoE to 4.25% is widely anticipated, though the case for a subsequent pause has been shaken by the reacceleration of consumer inflation in February. The Monetary Policy Committee is known for its divided outlook on the amount of tightening needed, and today's voting should continue to reflect this pattern.
An explicit indication of a pause could put downward pressure on Sterling, but such a signal is unlikely to emerge. Instead, BoE is more likely to adopt a non-committal stance, waiting for incoming data and the next economic projections in May before making a firm judgment.
Concurrently, SNB is expected to hike by 50bps to 1.50%. Market expectations suggest a possible 25bps hike in June to a terminal rate of 1.75%, followed by a pause. However, the SNB's comments and projections could reshape these expectations.
Here are some previews for BoE and SNB:
- UK Inflation Will Strengthen the Hawks
- BoE Rate Decision: One Last Hike Before Hitting Pause?
- BoE Preview: 25 bps Hike and Done?
- Bank of England Preview – Final Hike in Store
- Bank of England & Swiss National Bank Both Set to Hike
- Will the SNB Roil Markets With a Hike Amid Credit Suisse Crisis?
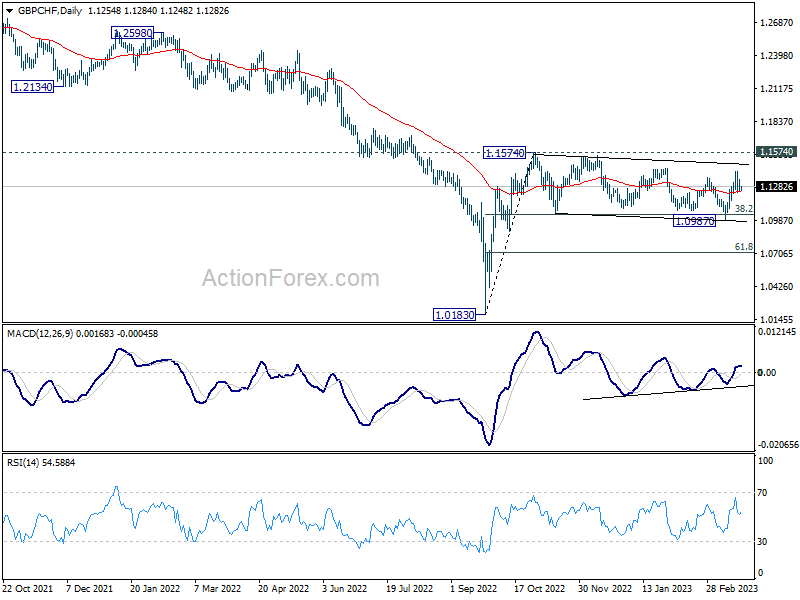
GBP/CHF is still bounded in medium term sideway consolidation from 1.1574. Outlook is kept bullish as the crosses quickly recovered after breaching 38.2% retracement of 1.0183 to 1.1574 at 1.1043 briefly. A break through 1.1574 resistance to resume the rise form 1.0184 is expected. But that might not happen today, unless there is some drastic surprise from BoE or SNB.
EUR/USD Daily Outlook
Daily Pivots: (S1) 1.0772; (P) 1.0842; (R1) 1.0926; More...
EUR/USD's rise from 1.0515 accelerates higher and intraday bias stays on the upside for retesting 1.1032 high. Decisive break there will resume whole up trend from 0.9534 and target 1.1273 fibonacci level next. On the downside, below 1.0787 minor support will turn intraday bias neutral and bring consolidations first, before staging another rally.
In the bigger picture, rise from 0.9534 (2022 low) is in progress with 38.2% retracement of 0.9534 to 1.1032 at 1.0460 intact. The strong support from 55 week EMA (now at 1.0623) was also a medium term bullish sign. Next target is 61.8% retracement of 1.2348 (2021 high) to 0.9534 at 1.1273. Sustained break there will solidity the case of bullish trend reversal and target 1.2348 resistance next (2021 high).
Economic Indicators Update
| GMT | Ccy | Events | Actual | Forecast | Previous | Revised |
|---|---|---|---|---|---|---|
| 08:30 | CHF | SNB Interest Rate Decision | 1.50% | 1.00% | ||
| 12:00 | GBP | BoE Rate Decision | 4.25% | 4.00% | ||
| 12:00 | GBP | MPC Official Bank Rate Votes | 7--0--2 | 7--0--2 | ||
| 12:30 | USD | Current Account (USD) Q4 | -217B | |||
| 12:30 | USD | Initial Jobless Claims (Mar 17) | 195K | 192K | ||
| 14:00 | USD | New Home Sales Feb | 650K | 670K | ||
| 14:30 | USD | Natural Gas Storage | -58B |
Technical Outlook and Review
DXY:
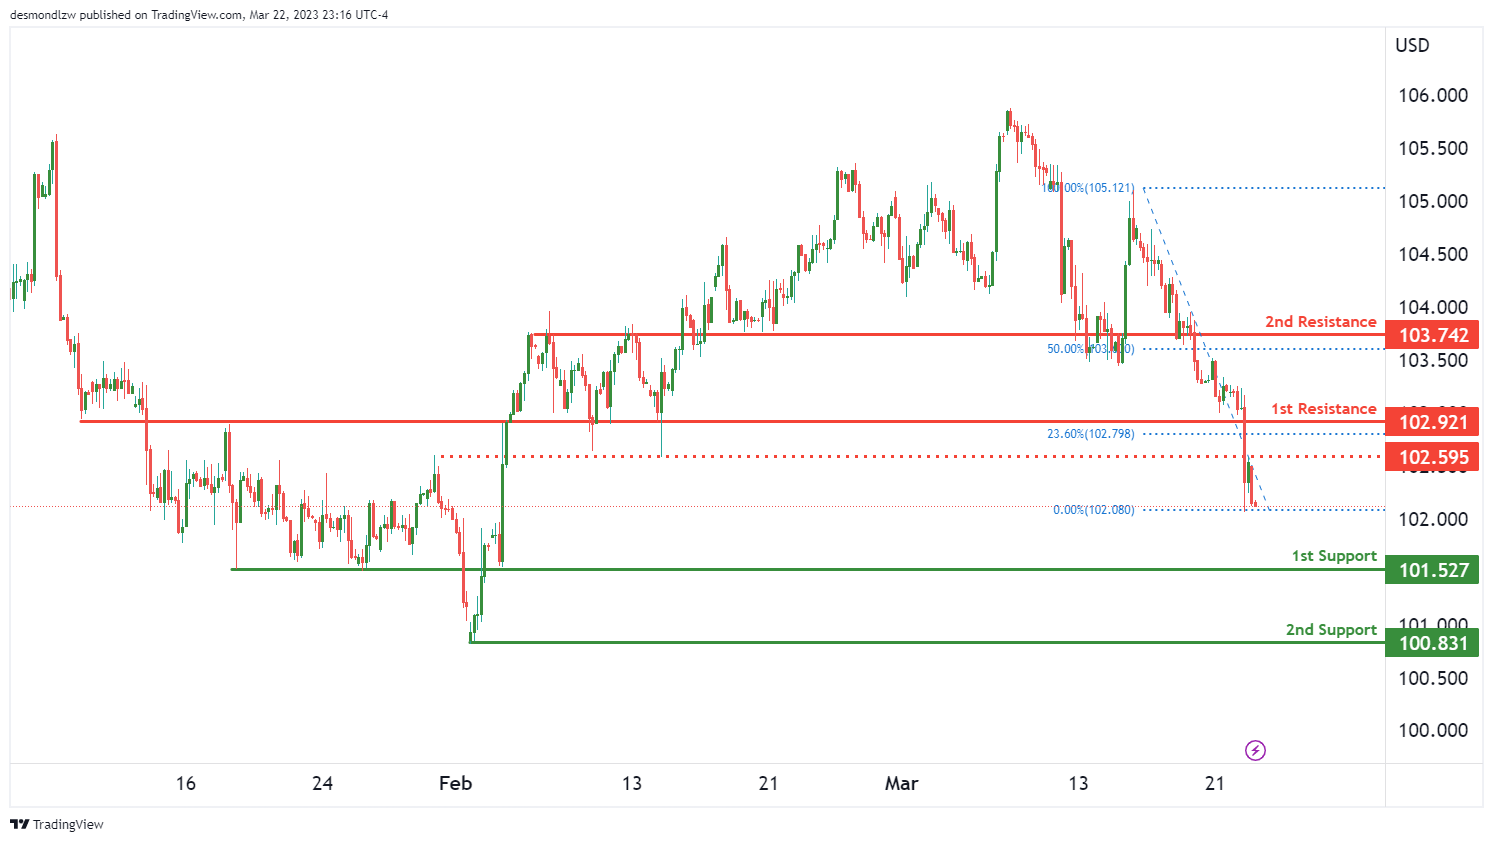
Looking at the DXY chart, the overall momentum of the chart is bearish, indicating a potential bearish continuation in the short term. Price is currently at a level where it could potentially drop to the 1st support at 101.52. This support level is an overlap support, which means that it has been tested several times in the past and has shown to be a strong level of support.
If prices break below the 1st support, it could drop further towards the 2nd support at 100.83, which is a swing low support level. On the other hand, if prices manage to rebound from the current level, it could potentially move up towards the 1st resistance at 102.92. This resistance level is an overlap resistance and has a 23.60% Fibonacci retracement lining up with it, making it a strong level of resistance.
If prices break above the 1st resistance, it could potentially continue to move up towards the 2nd resistance at 103.74. This level is a swing high resistance and coincides with a 50% Fibonacci retracement level, providing additional resistance. It’s worth noting that there is also an intermediate resistance at 102.59 that could potentially halt the bullish momentum.
Overall, the DXY chart shows a bearish bias, with potential for prices to drop towards the 1st support at 101.52. However, a break above the 1st resistance at 102.92 could potentially trigger a bullish reversal towards the 2nd resistance at 103.74.
EUR/USD:
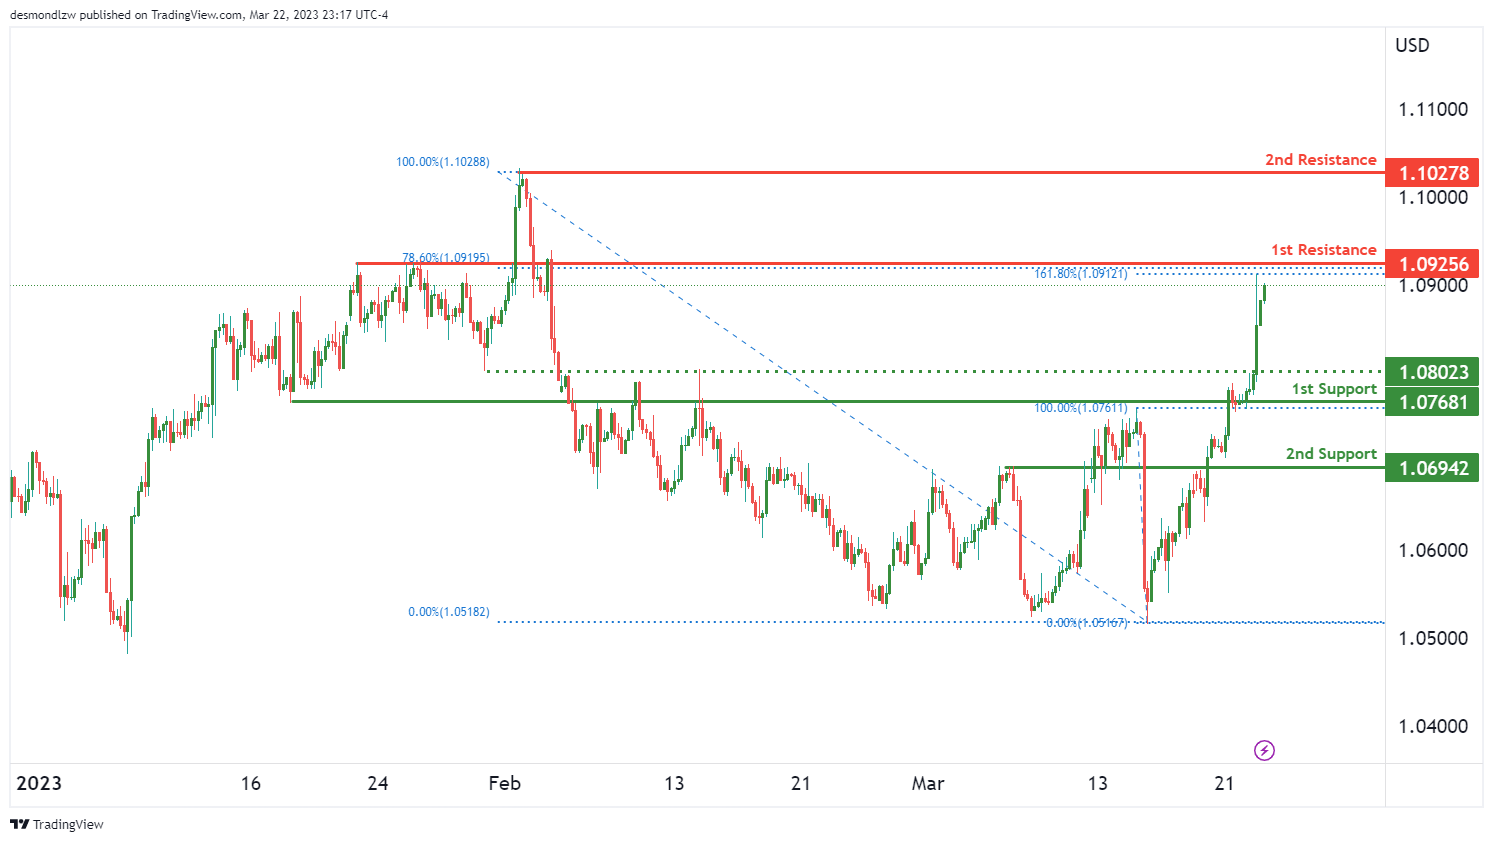
Looking at the EURUSD chart, the overall momentum of the chart is bearish. However, in the short term, the price could potentially rise towards the 1st resistance level at 1.093 before reversing off it and dropping towards the 1st support level at 1.077.
The 1st support level at 1.077 is a strong level of support, being an overlap support. The 2nd support level at 1.069 is also an overlap support, making it another strong level of support.
On the resistance side, the 1st resistance level at 1.093 is also an overlap level and coincides with a 161.80% Fibonacci Extension, making it a significant level of resistance. The 2nd resistance level at 1.103 is a swing high resistance level and may provide additional resistance if prices break through the 1st resistance level.
There is also an intermediate support level at 1.080, which is between where price is currently and the 1st support level. If price were to break this intermediate support, it could trigger a stronger bearish acceleration towards our 1st support.
It is worth noting that the overall momentum of the chart is bearish, with prices expected to drop towards the 1st support level in the longer term.
GBP/USD:
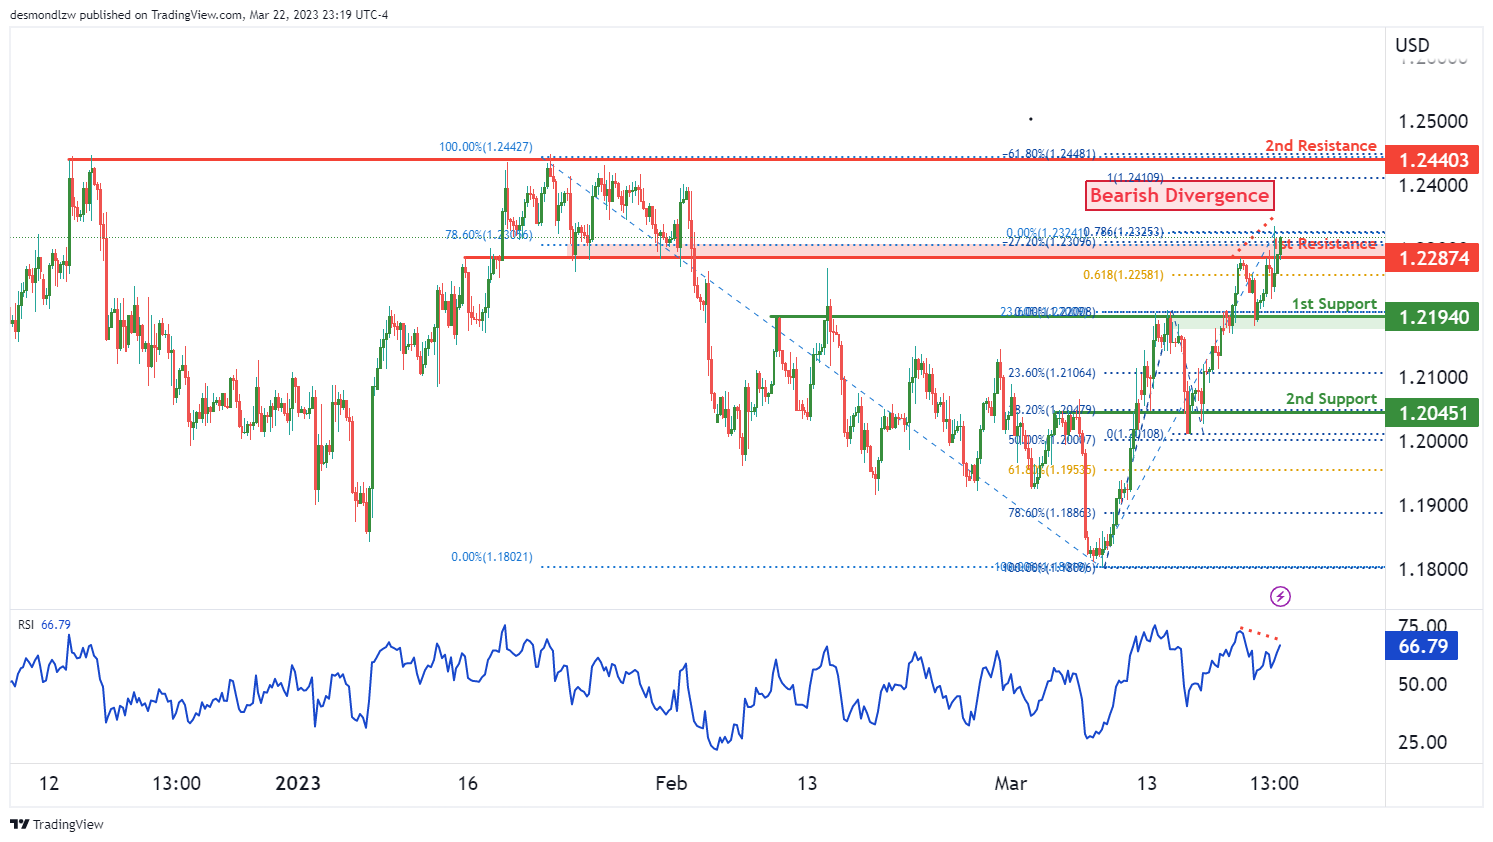
the GBP/USD chart, the overall momentum is bearish. There’s a potential for price to have a bearish reaction off the 1st resistance level and drop to the 1st support level. The 1st support level at 1.2194 is an overlap support and has a 23.60% Fibonacci retracement lining up with it, making it a strong support level. The 2nd support level at 1.2045 is also an overlap support and has a 38.20% Fibonacci retracement lining up with it, further adding to its strength.
On the resistance side, the 1st resistance level at 1.2287 is an overlap resistance and has a 78.60% Fibonacci retracement lining up with it, making it a strong resistance level. The 2nd resistance level at 1.2440 is a swing high resistance and has a 161.80% Fibonacci extension lining up with it, making it an even stronger resistance level.
Additionally, the RSI is displaying bearish divergence versus price, which suggests that a reversal might occur soon. Overall, the bearish momentum of the chart, combined with the strong support and resistance levels, suggests that we could potentially see a bearish reaction off the 1st resistance level and a drop towards the 1st support level.
USD/CHF:
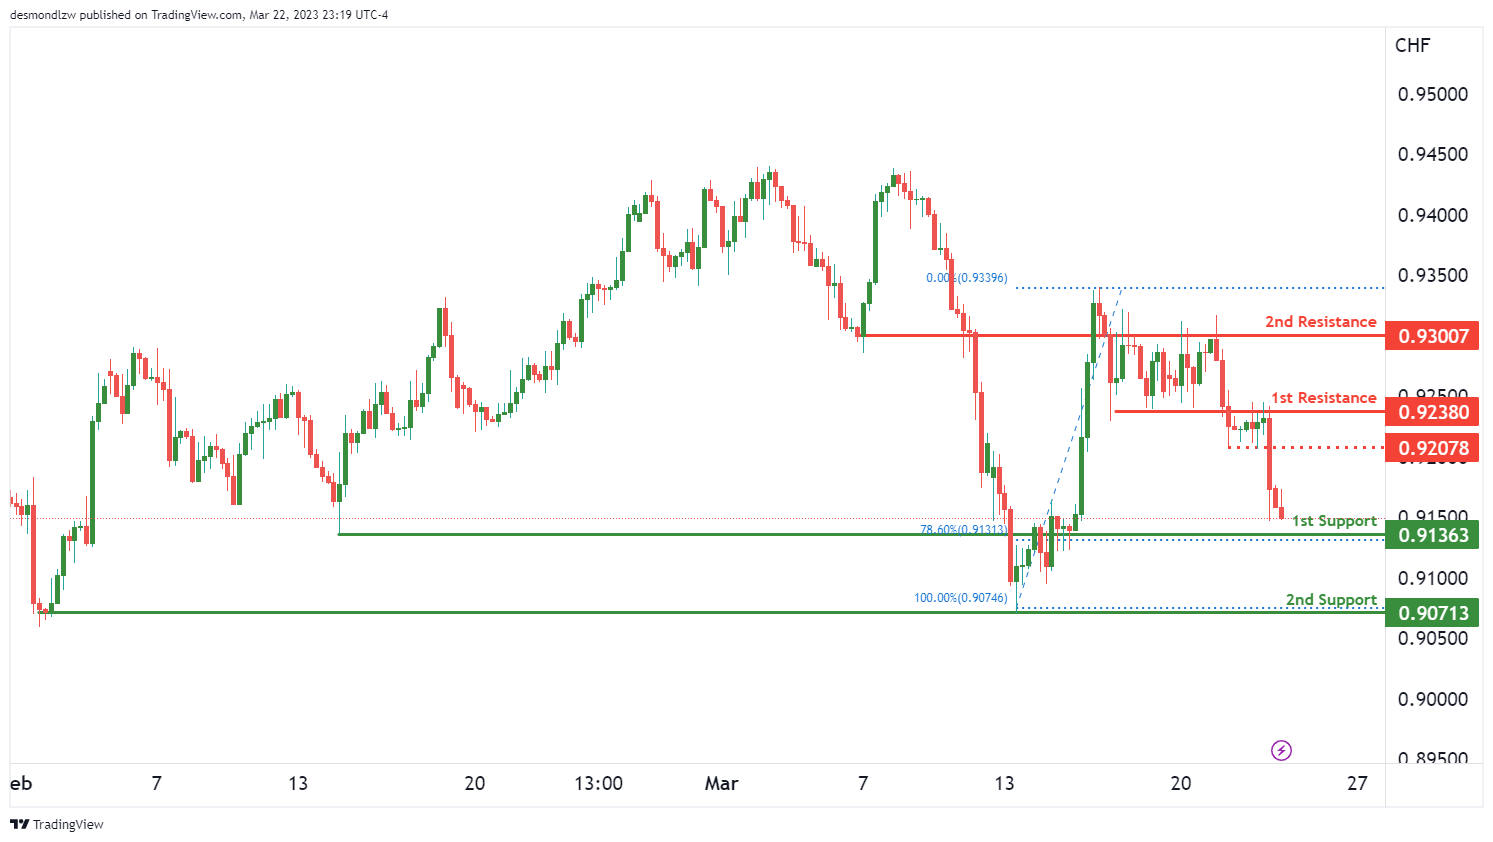
Looking at the USD/CHF chart, the overall momentum is currently bearish. However, price could potentially drop further to the 1st support level at 0.9136 in the short term before bouncing from there and rising to the 1st resistance level at 0.9238.
The 1st support level is a good level as it is an overlap support and also has a 78.60% Fibonacci retracement lining up with it. Additionally, the 2nd support level at 0.9071 is a multi-swing low support, making it another good level of support.
On the resistance side, the 1st resistance level at 0.9238 is an overlap resistance. The 2nd resistance level at 0.9300 is another overlap resistance. Finally, there is an intermediate resistance level at 0.9207, which is between the current price and the 1st resistance.
USD/JPY:
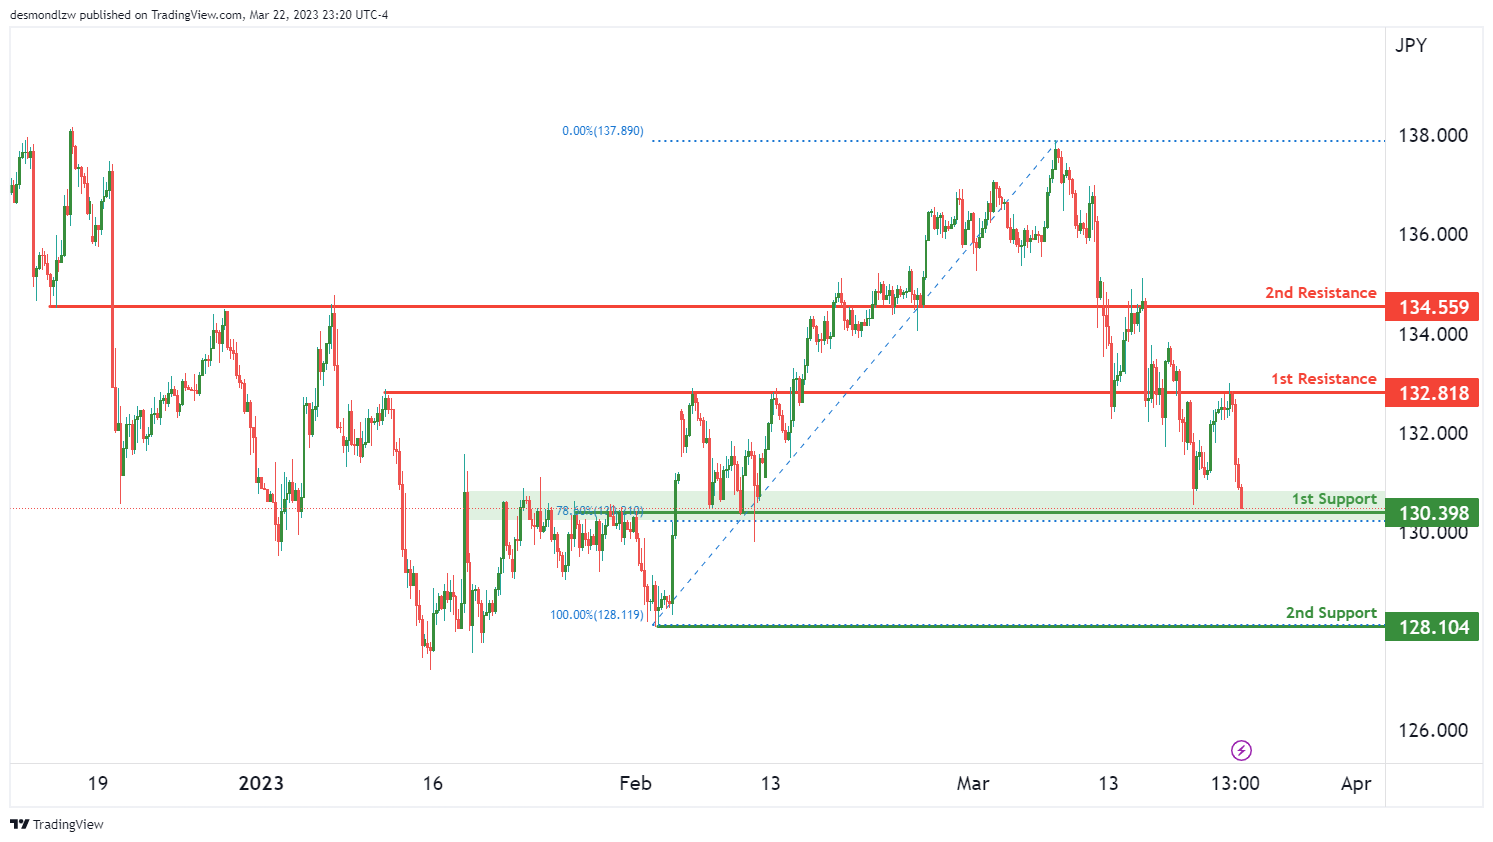
The USD/JPY chart is showing overall bullish momentum, with potential for a bullish bounce off the 1st support level towards the 1st resistance. The 1st support level is located at 130.39 and is an overlap support level, with a 78.60% Fibonacci retracement lining up with it. The 2nd support level is at 128.10 and is a multi-swing low support. On the resistance side, the 1st resistance level is at 132.81 and is an overlap resistance level. The 2nd resistance level is at 134.55 and is also an overlap resistance level.
Traders should keep an eye on the price action around these levels, as a bounce from the 1st support level towards the 1st resistance level could provide a bullish opportunity. However, a break below the 1st support level could signal a potential change in momentum towards a bearish direction.
AUD/USD:
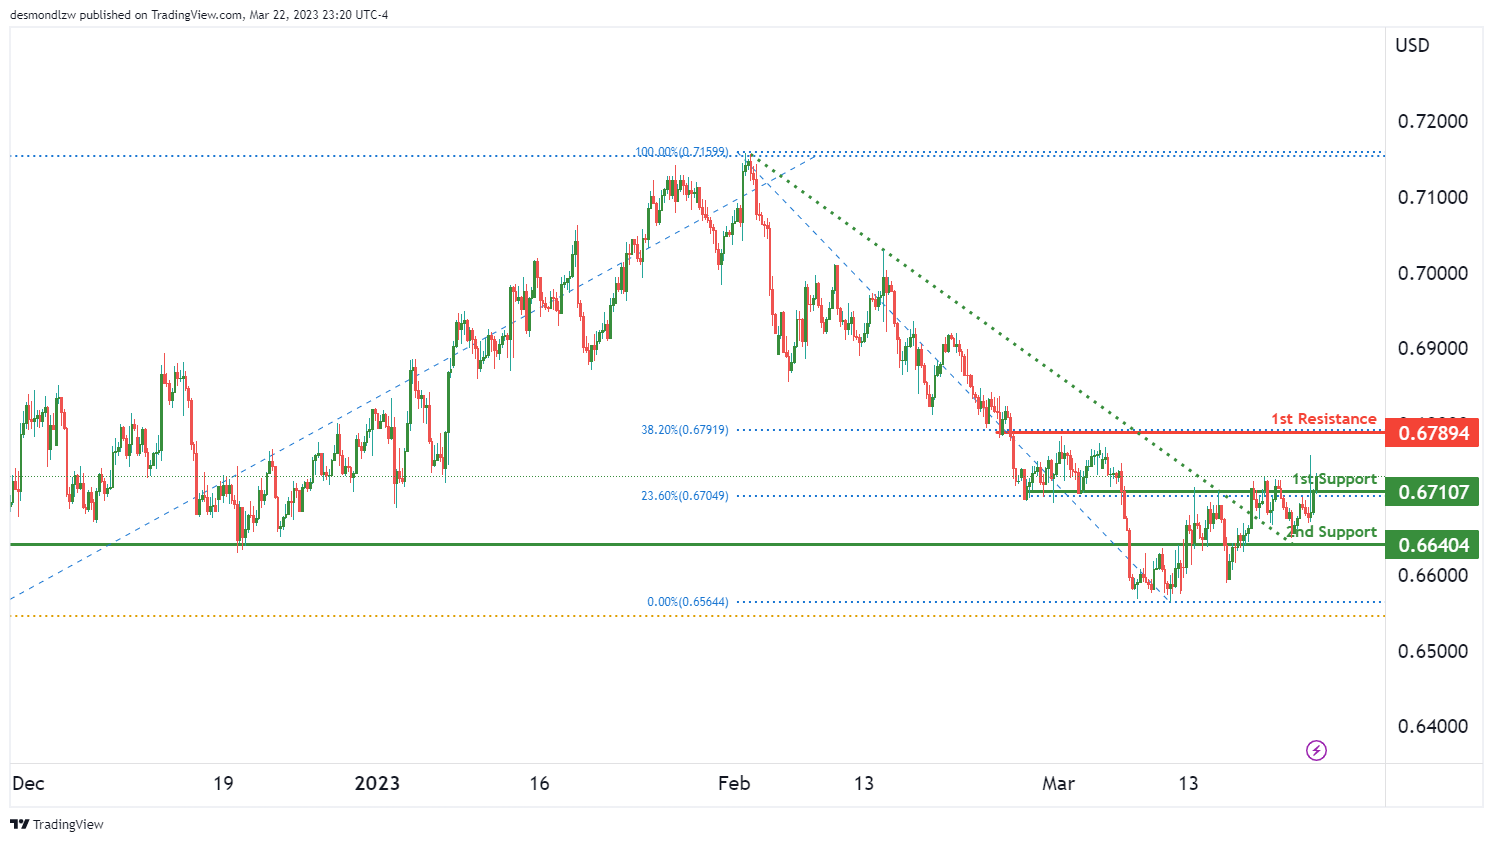
The AUD/USD chart is showing bullish momentum, with the potential for price to continue rising towards the first resistance level. The first support level is at 0.6710, which is an overlap support and also coincides with a 23.60% Fibonacci retracement. If price were to bounce off this level, it could potentially rise towards the first resistance level at 0.6789, which is a pullback resistance.
There is a second support level at 0.6640, which is also an overlap support. This level could potentially provide additional support if price were to drop below the first support.
Overall, the bullish momentum of the chart suggests that there is a higher probability for prices to continue rising towards the first resistance level.
NZD/USD:
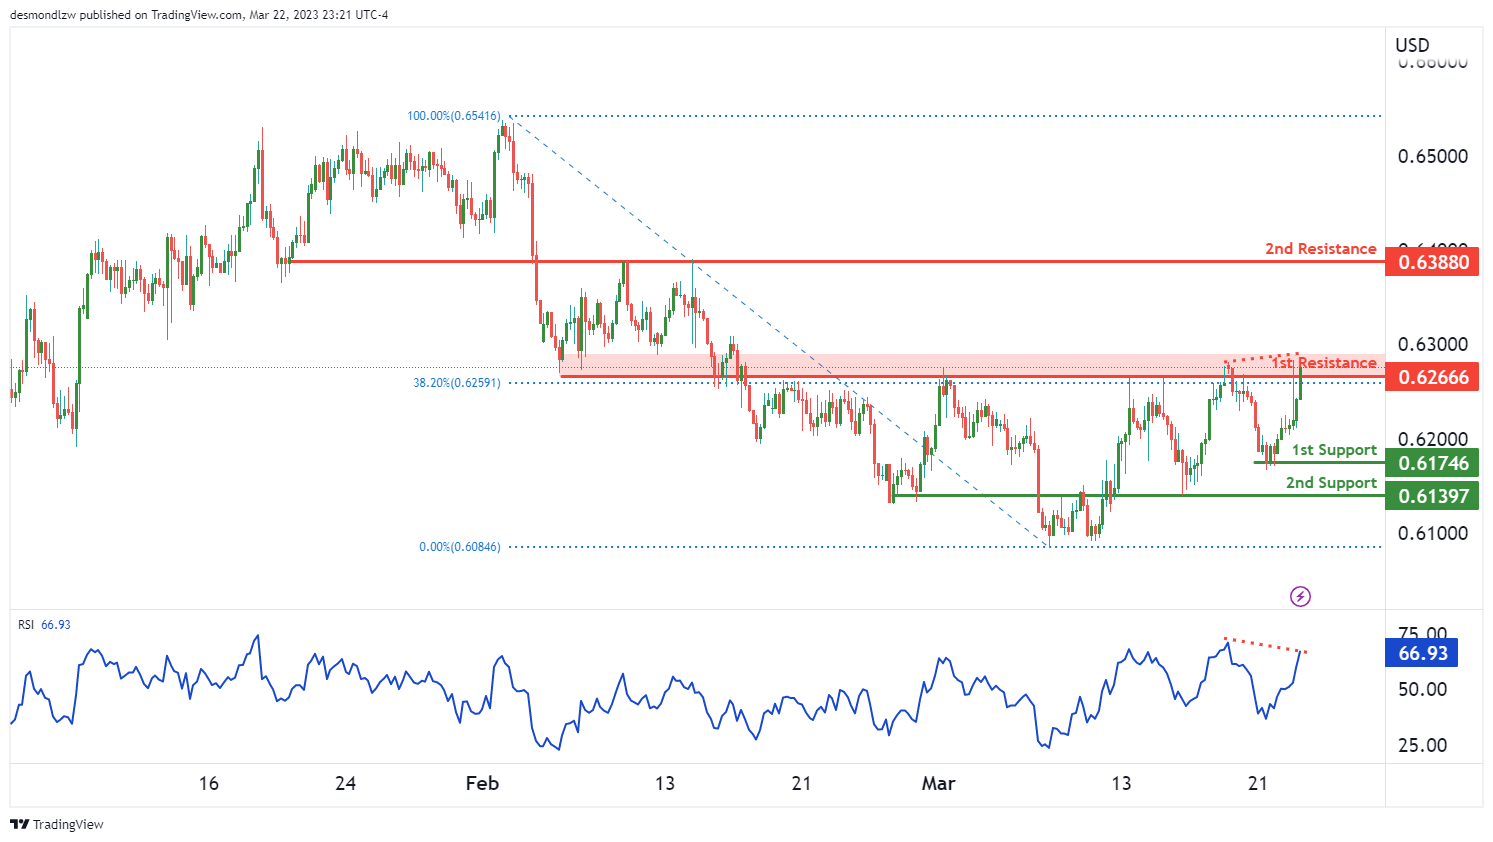
The NZD/USD chart has a bearish overall momentum, which means prices are expected to move lower. The current price movement could potentially lead to a bearish reaction off the 1st resistance level, which is at 0.6266. This level is a strong overlap resistance and also has a 38.20% Fibonacci retracement lining up with it. A drop towards the 1st support at 0.6174 could be seen if the resistance level holds.
If the 1st support level fails to hold, the next level to watch is the 2nd support at 0.6139, which is also an overlap support. On the other hand, if the price manages to break above the 1st resistance, the next level to watch is the 2nd resistance at 0.6388, which is also an overlap resistance.
It’s important to note that the RSI is displaying bearish divergence versus price, which suggests that a reversal might occur soon. This means that traders need to be cautious and consider the possibility of a trend reversal
USD/CAD:
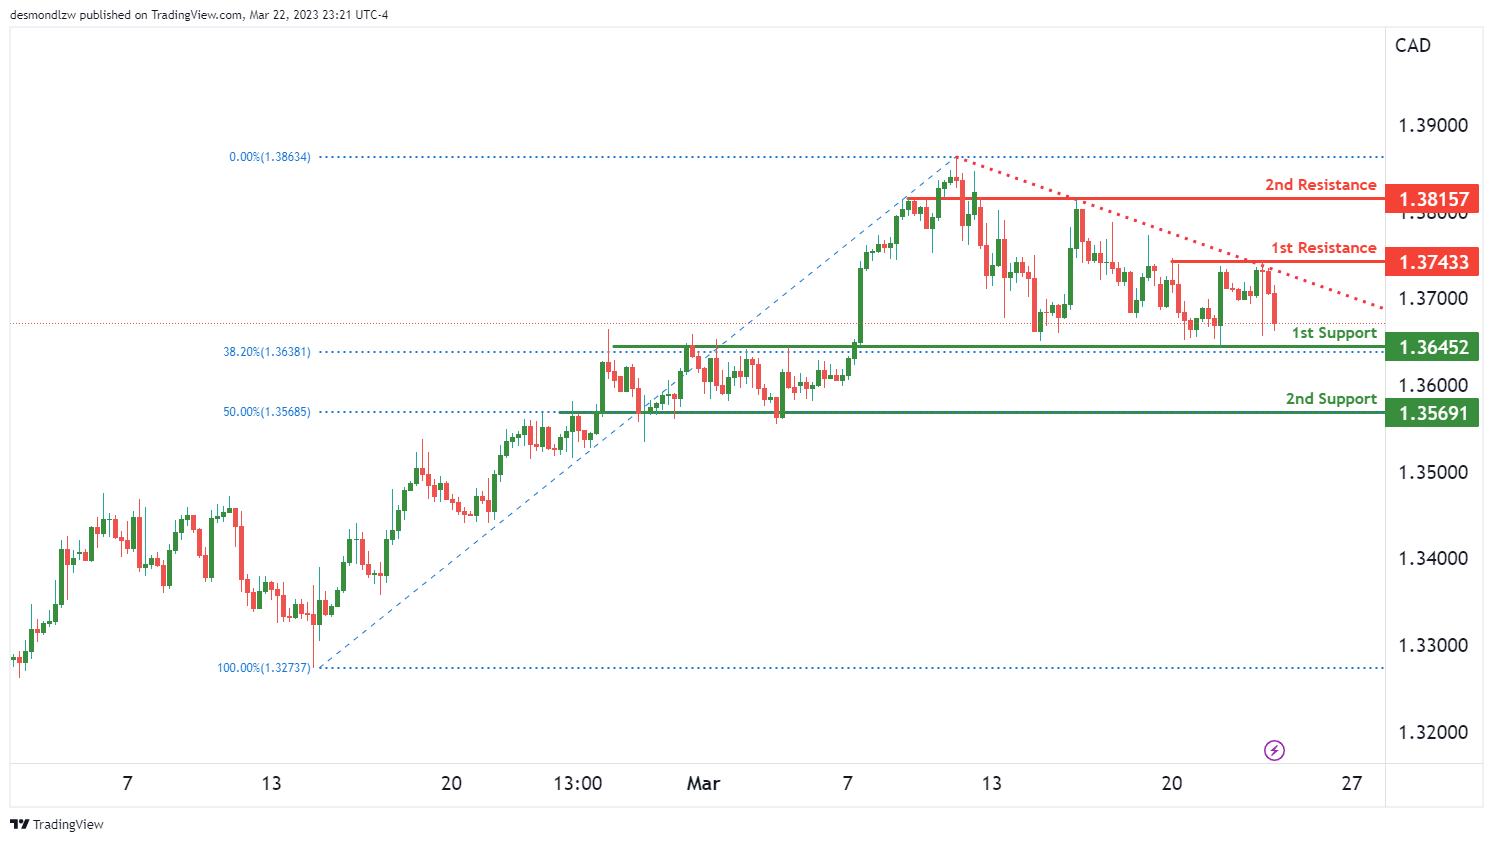
The USD/CAD currency pair has been showing bearish momentum on the charts. Price is currently below a major descending trend line, indicating that a continuation of the bearish trend is likely. There are two potential support levels that price could reach, with the first being at 1.3645. This level is an overlap support and is also located at the 38.20% Fibonacci retracement level, making it a strong support level. The second support level is at 1.3569 and is an overlap support as well as being located at the 50% Fibonacci retracement level.
On the other hand, there are two potential resistance levels that price could encounter. The first is at 1.3743 and is a multi-swing high resistance level. The second resistance level is at 1.3815 and is an overlap resistance level.
DJ30:
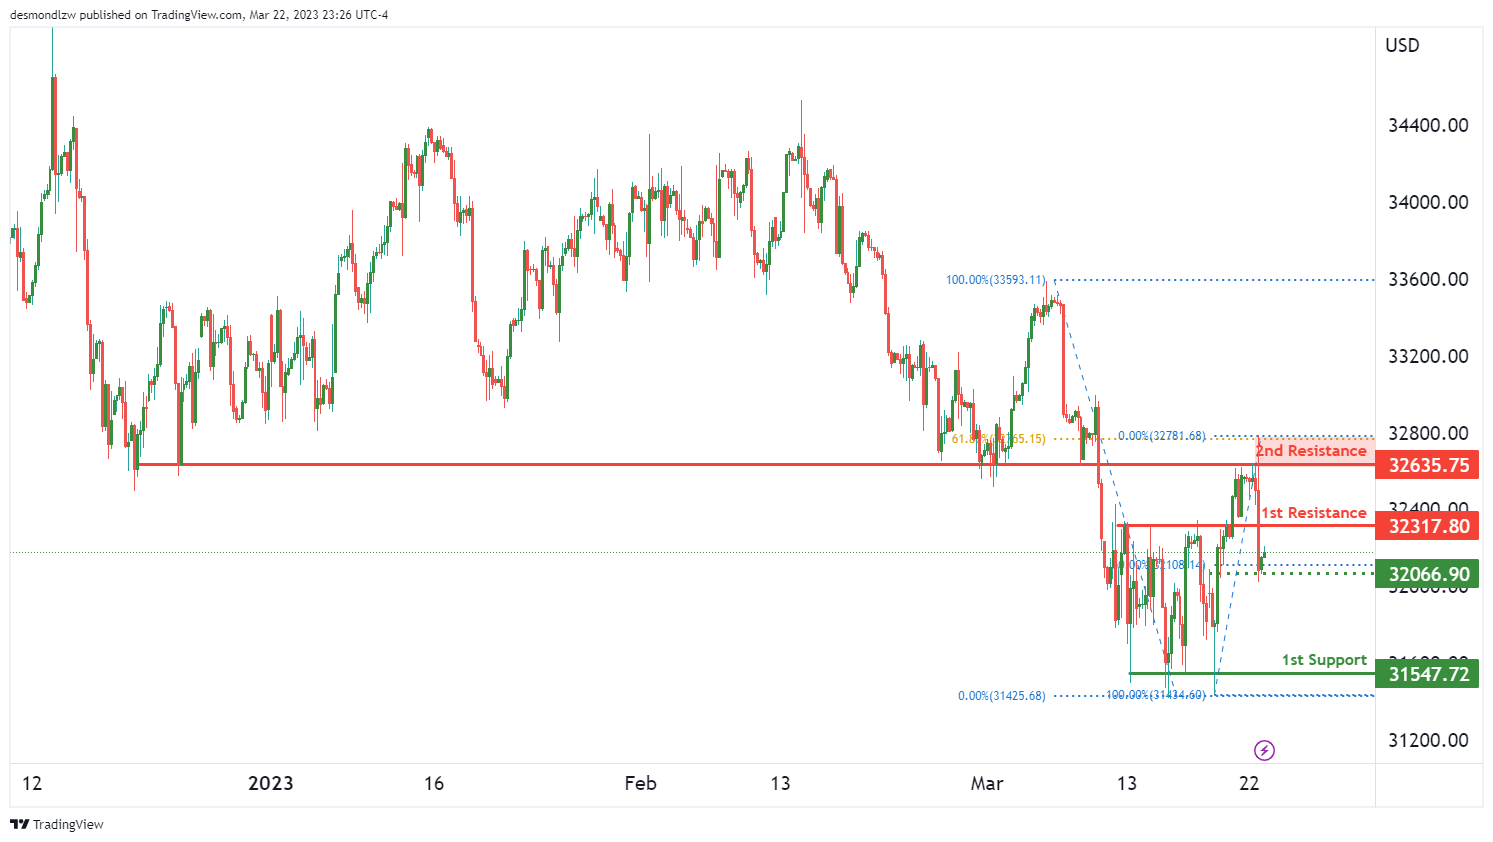
The DJ30 is currently exhibiting bearish momentum on the chart, and there could be a potential continuation of this bearish trend towards the first support level. The first support level is located at 31547 and is considered a multi-swing low support, making it a good level to watch.
The intermediate support level is located at 32066, which is a swing low support and a 50% Fibonacci retracement level. This level could also act as a support for the price, should it drop further.
On the other hand, there are two resistance levels to watch out for, the first being at 32317. This level is considered an overlap resistance and could act as a potential resistance for any bullish move. The second resistance level is at 32635, which is also an overlap resistance and coincides with the 61.80% Fibonacci retracement level.
GER30:
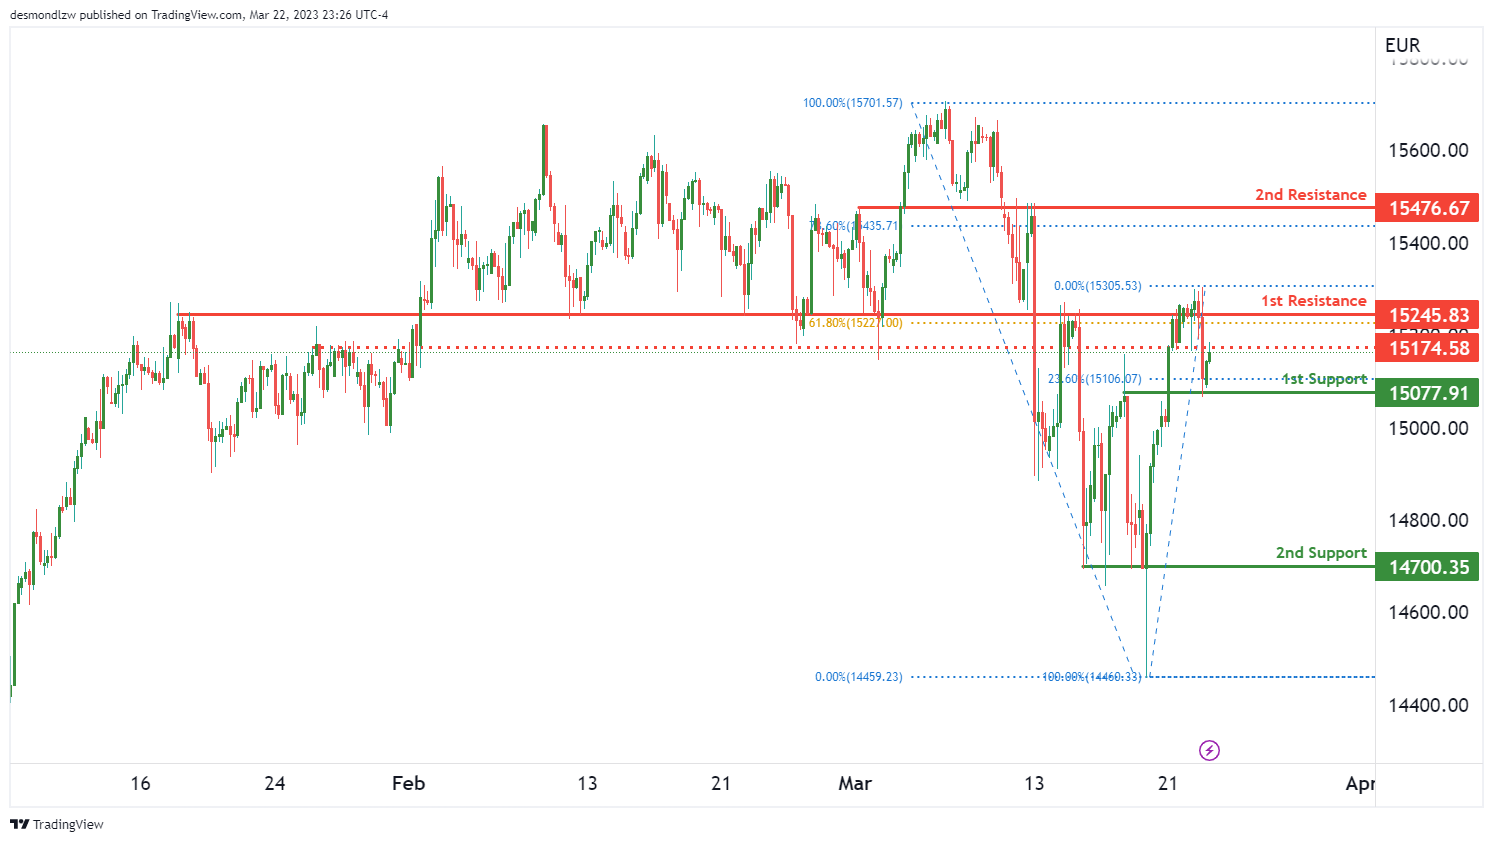
GER30 is currently exhibiting a bullish momentum as price is above the Ichimoku cloud and an ascending support line. There is a potential for a bullish continuation towards the 1st resistance at 15245. The 1st support at 15077 is a strong overlap support level with a 23.60% Fibonacci retracement, which adds to the strength of the support level. Another support level to watch out for is the intermediate support at 14700, which has acted as a multi-swing low support level in the past.
On the resistance side, the 1st resistance level is a strong overlap resistance with a 61.80% Fibonacci retracement. A breakout from this level could push the price towards the 2nd resistance level at 15476, which is also an overlap resistance with a 78.60% Fibonacci retracement. There is also an intermediate resistance level at 15174 that price could encounter on the way up. The overall bias of the GER30 chart is bullish, which suggests that price could rise from support to resistance.
BTC/USD:
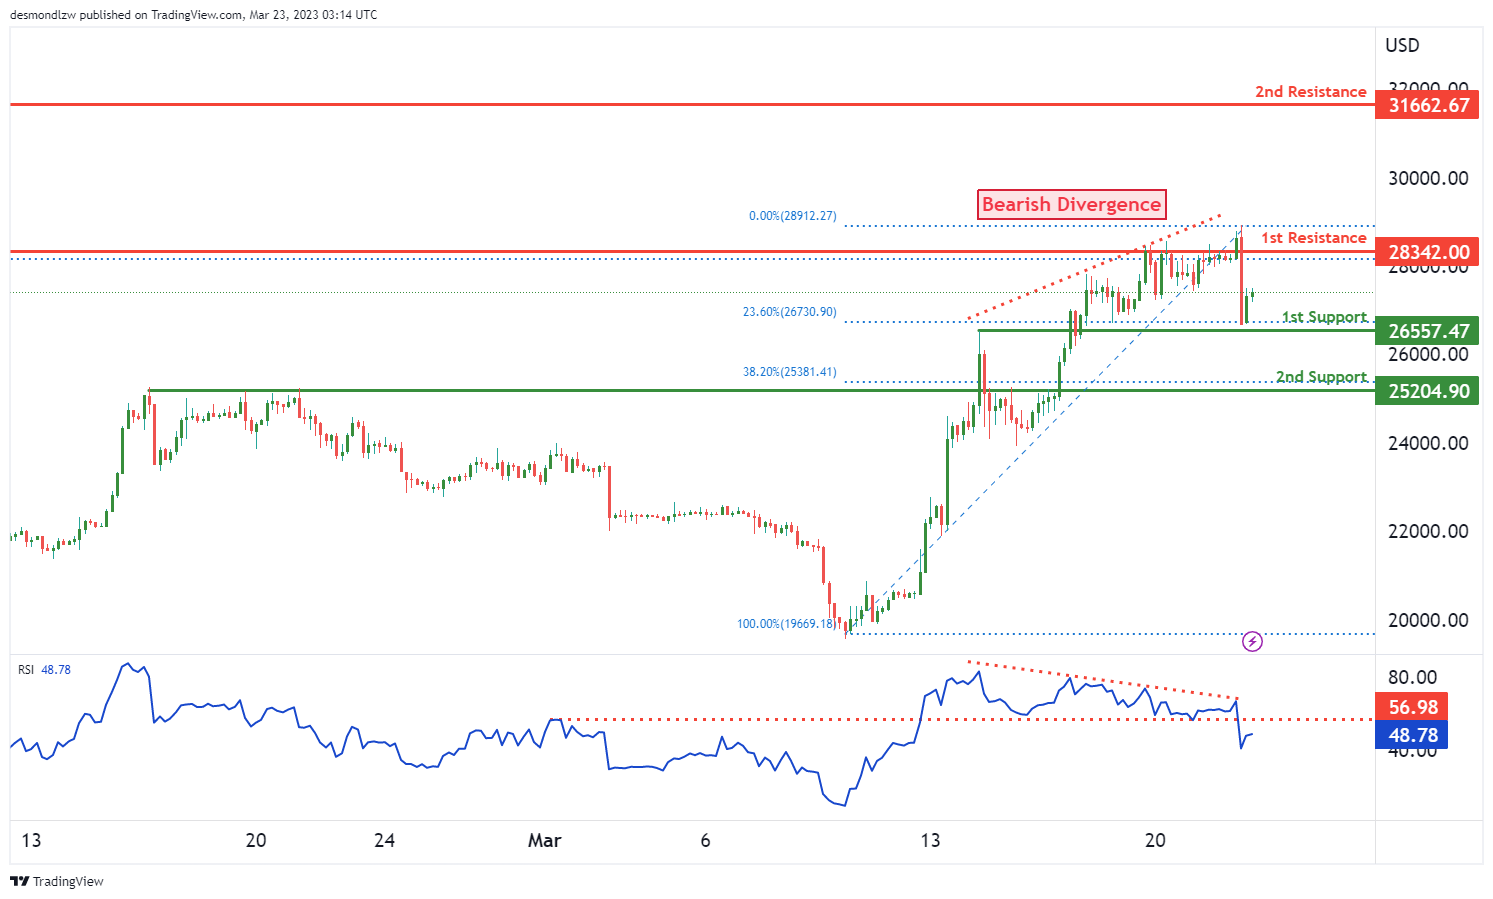
The overall momentum of the BTC/USD chart is bearish, with the price potentially making a bearish break off the first support level and dropping towards the second support level. It is important to note that the price is currently below the Ichimoku cloud, which suggests bearish momentum.
The first support level is at 26557, and it is a strong overlap support with a 23.60% Fibonacci retracement lining up with it. However, if the price breaks below this level, it could drop towards the second support level at 25204, which is another overlap support with a 38.20% Fibonacci retracement.
On the resistance side, the first resistance level is at 28342, which is a multi-swing high resistance. If the price were to rise and break above this level, it could potentially reach the second resistance level at 31662, which is a swing high resistance.
US500
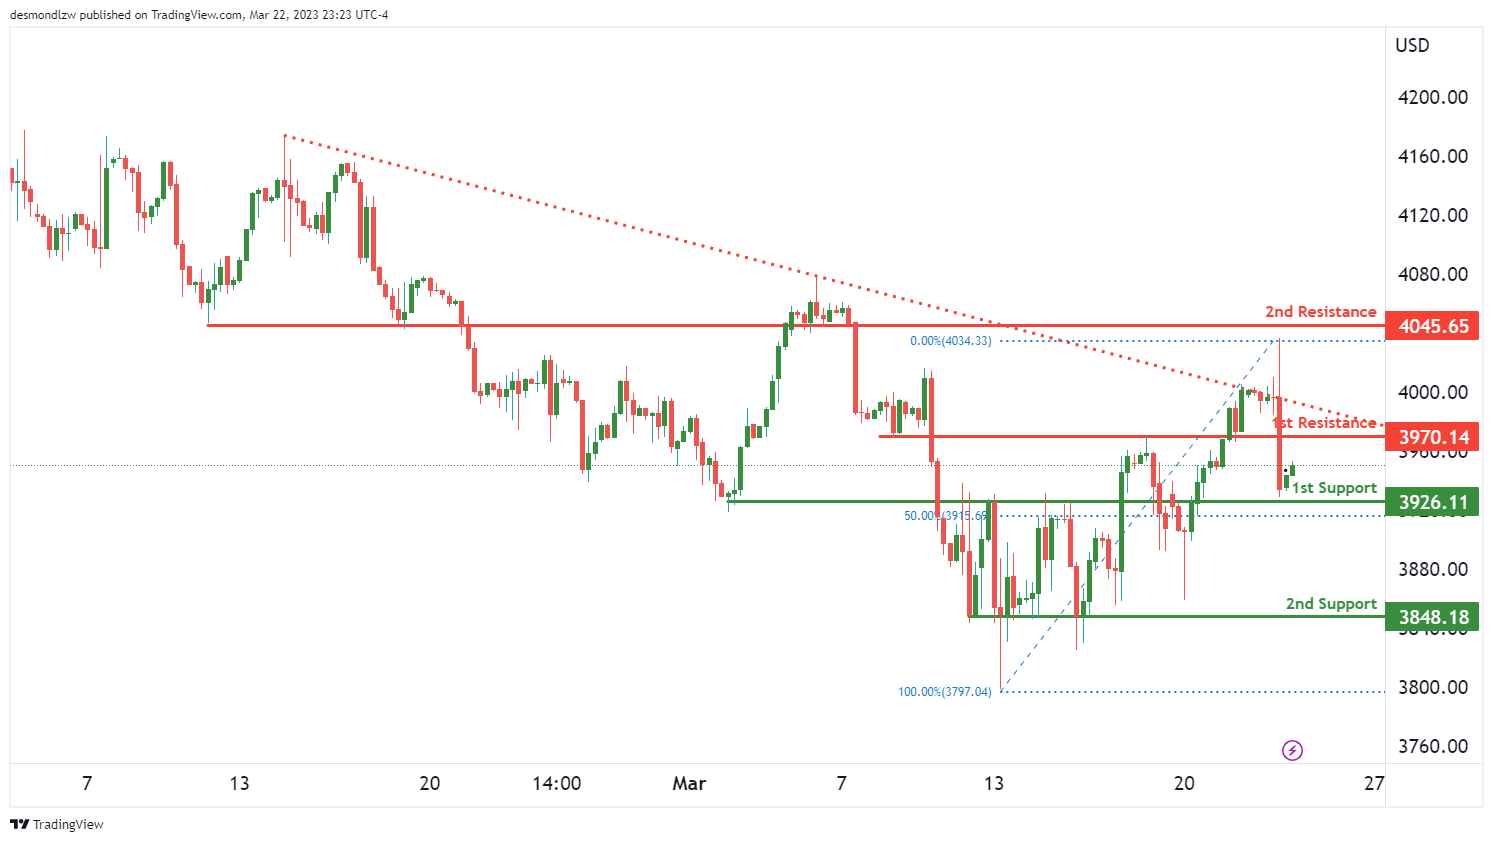
The US500 chart is currently showing bearish momentum, as price is below a major descending trend line. As such, a potential bearish break off the 1st support level may occur, leading to a drop towards the 2nd support level.
The 1st support level is located at 3926 and is an overlap support with the 50% Fibonacci retracement. If price were to break this support level, it could potentially drop towards the 2nd support at 3848, which is a multi-swing low support.
On the resistance side, the 1st resistance level is at 3970 and is an overlap resistance. If price were to break this resistance level, it could potentially rise towards the 2nd resistance at 4046, which is also an overlap resistance.
Overall, the chart is currently showing a bearish bias and the descending trend line is suggesting that bearish momentum is still present. If the 1st support level is broken, it may trigger further selling pressure towards the 2nd support level
ETH/USD:
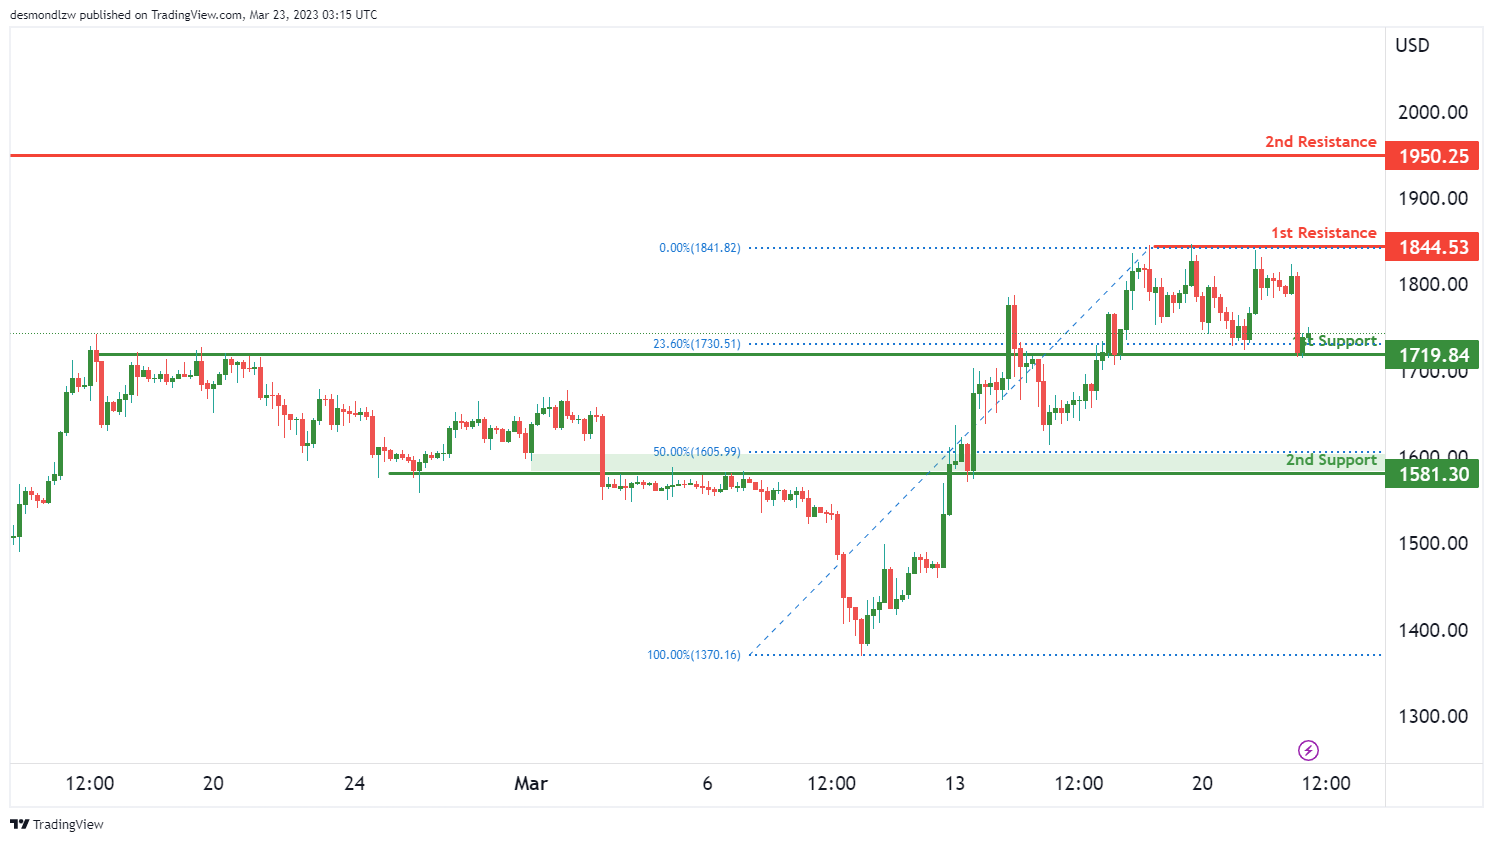
Based on the overall bullish momentum of the ETH/USD chart, the price could potentially bounce off the first support level at 1719.84, which is a strong overlap support level and is also in line with a 23.6% Fibonacci retracement. If the price successfully rebounds from this support level, it could potentially head towards the first resistance level at 1844.53, which is a multi-swing high resistance level.
It’s also worth noting that there is a second support level at 1518.30, which is also a strong overlap support level and coincides with a 50% Fibonacci retracement.
In the event of a strong bullish breakout, the price may potentially reach the second resistance level at 1950.25, which is a swing high resistance level.
WTI/USD:
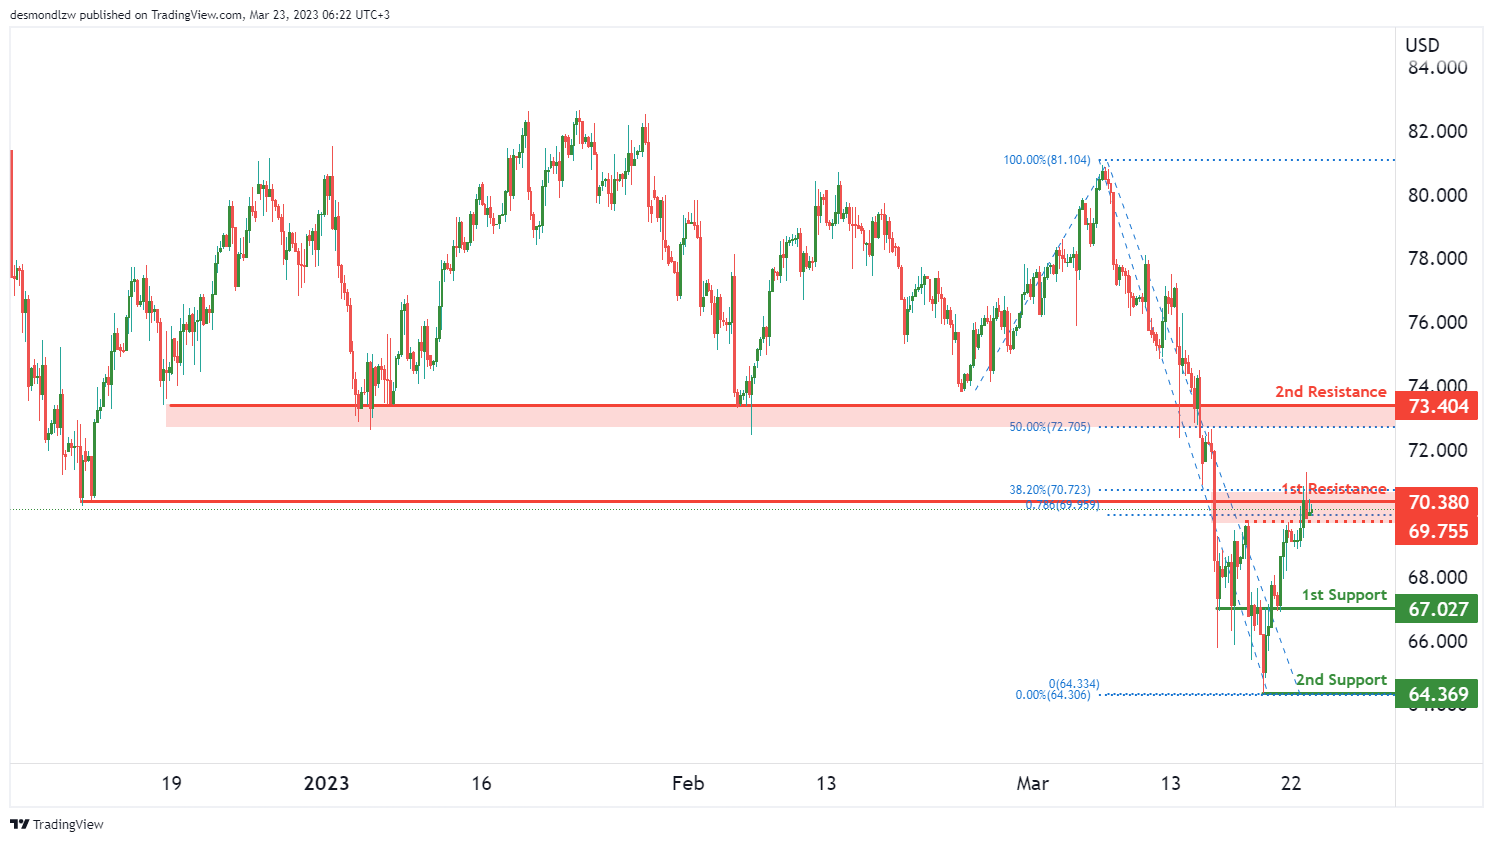
The overall momentum of the WTI chart is bearish. The price could potentially make a bearish reaction off the first resistance and drop to the first support. The first support level is at 67.02 and it’s a good level because it’s an overlap support. The second support level is at 64.36 and it’s a swing low support.
On the other hand, the first resistance level is at 70.38 and it’s a pullback resistance that lines up with a 38.20% Fibonacci retracement. If the price were to break above this level, it could potentially rise towards the second resistance level at 73.40, which is a pullback resistance and coincides with a 50% Fibonacci retracement.
It’s worth noting that the current momentum of the chart is bearish, and the price is expected to react bearishly off the first resistance level and drop towards the first support level. However, if the price were to break above the first resistance level, it could potentially trigger a bullish reversal towards the second resistance level.
XAU/USD (GOLD):
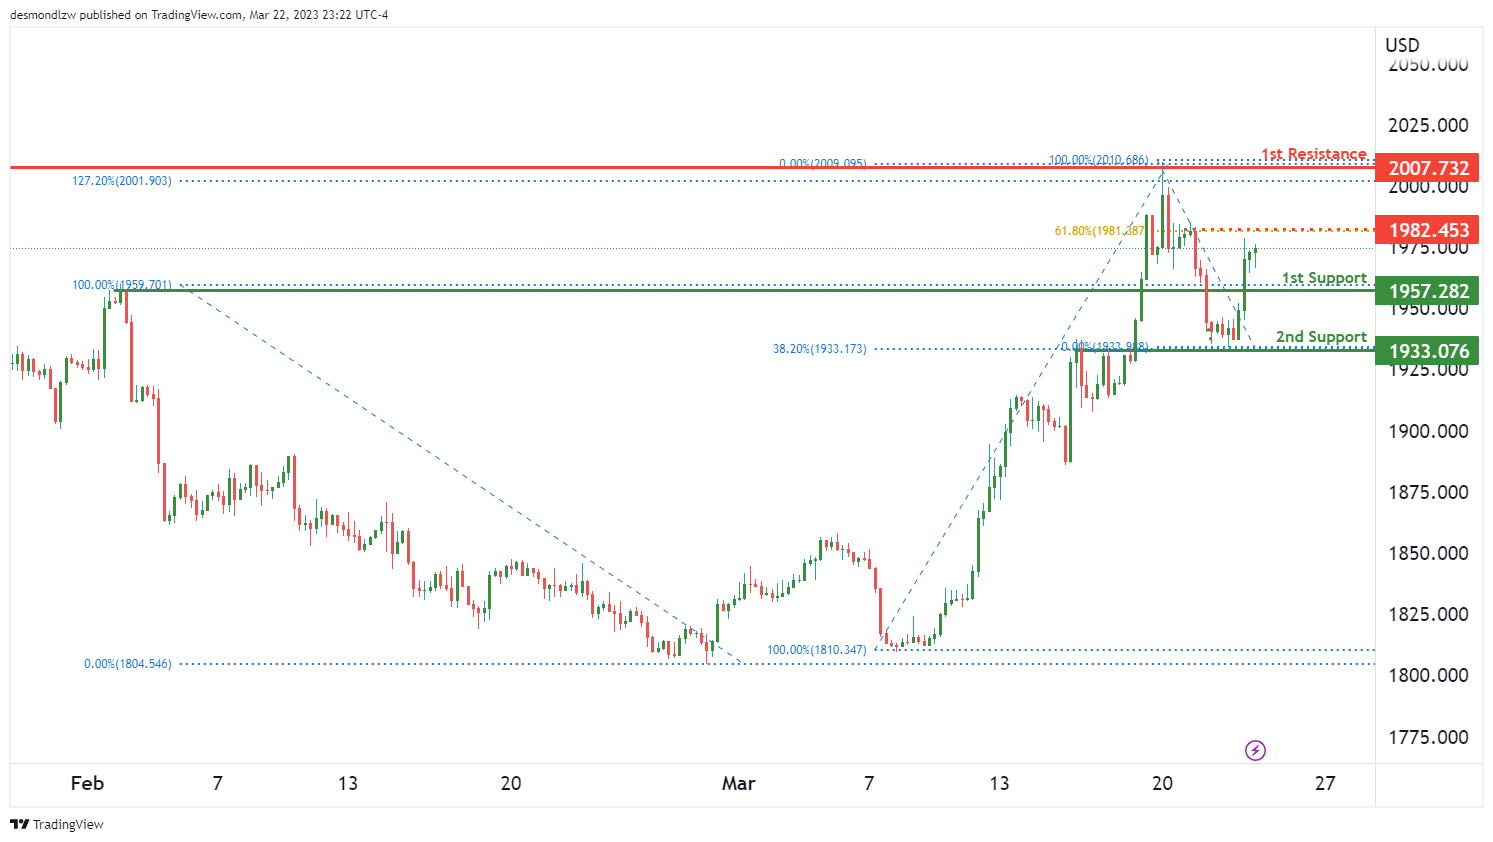
The XAU/USD chart shows a bullish momentum, and price could potentially continue to rise towards the 1st resistance level at 2007.00, which is a swing high resistance level.
The 1st support level at 1957.00 is a strong overlap support level, which could provide a bounce if price were to drop. The 2nd support level at 1933.00 coincides with the 38.20% Fibonacci retracement level, which could act as another support level.
If price were to break through the 1st resistance level, it could potentially continue to rise towards the intermediate resistance level at 1982.00, which is also an overlap resistance level and coincides with the 61.80% Fibonacci retracement level.
GBP/CHF extending range trading ahead of BoE and SNB
BoE and SNB are both expected to raise interest rates today. A 25bps hike by BoE to 4.25% is widely anticipated, though the case for a subsequent pause has been shaken by the reacceleration of consumer inflation in February. The Monetary Policy Committee is known for its divided outlook on the amount of tightening needed, and today's voting should continue to reflect this pattern.
An explicit indication of a pause could put downward pressure on Sterling, but such a signal is unlikely to emerge. Instead, BoE is more likely to adopt a non-committal stance, waiting for incoming data and the next economic projections in May before making a firm judgment.
Concurrently, SNB is expected to hike by 50bps to 1.50%. Market expectations suggest a possible 25bps hike in June to a terminal rate of 1.75%, followed by a pause. However, the SNB's comments and projections could reshape these expectations.
Here are some previews for BoE and SNB:
- UK Inflation Will Strengthen the Hawks
- BoE Rate Decision: One Last Hike Before Hitting Pause?
- BoE Preview: 25 bps Hike and Done?
- Bank of England Preview – Final Hike in Store
- Bank of England & Swiss National Bank Both Set to Hike
- Will the SNB Roil Markets With a Hike Amid Credit Suisse Crisis?
GBP/CHF is still bounded in medium term sideway consolidation from 1.1574. Outlook is kept bullish as the crosses quickly recovered after breaching 38.2% retracement of 1.0183 to 1.1574 at 1.1043 briefly. A break through 1.1574 resistance to resume the rise form 1.0184 is expected. But that might not happen today, unless there is some drastic surprise from BoE or SNB.
S&P 500 down, reacted more to Yellen than Powell?
US markets experienced a complex development overnight due to simultaneous reactions to two events. Initially, the markets responded bullishly to the Fed's less hawkish than expected rate hike and press conference. However, just an hour before the close, sellers jumped in, and the three major indexes closed -1.6% lower.
The selloff might be more attributed to Treasury Secretary Janet Yellen's comments at a Senate committee. She explicitly stated, "I have not considered or discussed anything having to do with blanket insurance or guarantees of deposits."
Yellen further elaborated, "when a bank failure is deemed to create systemic risk, which I think of as the risk of a contagious bank run...we are likely to invoke the systemic risk exception, which permits the FDIC to protect all depositors, and that would be a case-by-case determination."
Meanwhile, Asian markets have remained sluggish and mixed today, without any apparent signs of bearishness carried over. It may take some more time to understand the unfolding situation fully.
Technically, near term outlook in S&P 500 isn't too bearish yet given it's holding inside a near term channel. However, break of 3901.27 support will argue that the corrective rebound from 3808.85 has completed at 4039.49, after hitting falling trend line resistance. Deeper selloff would then follow through 3808.86 to resume whole decline from 4195.44.
Fed softened hawkish tone, but not dovish
In light of the Fed announcement and press conference overnight, it appears that another 25bps rate hike is likely in May, followed by a prolonged pause with no rate cut expected until next year. The overall picture remains hawkish, albeit not as much as after Fed Chair Jerome Powell's earlier testimony this month.
As anticipated, Fed raised interest rates by 25bps to 4.75-5.00%. While the tightening bias was maintained, the statement softened its tone, stating, "some additional policy firming may be appropriate." Despite recent market turmoil, median projections still indicated an interest rate peak of 5.1% this year, suggesting one more 25bps hike before pausing until next year. The median projection for 2024 interest rate increased from 4.1% to 4.3%, signaling a slower path of rate cuts.
During the post-meeting press conference, Powell acknowledged that "financial conditions seem to have tightened" recently, adding that if the situation persists, it could "easily have a significant macroeconomic effect, and we would factor that into our policy decisions." While he admitted that a pause was considered during the meeting, he emphasized that a rate cut this year was "not our baseline expectation," stating, "the key is we have to have policies tight enough to bring inflation down to 2%."
Suggested readings on Fed:
- FOMC's Fight Against Inflation Finely Balanced
- FOMC Hikes Rates, But End of Tightening Cycle Coming Into View
- Suderman Says: Rates Up as Expected, But Peak in Sight?
- FOMC Hikes Policy Rate by 25 Basis Points, Cautions on Bank Stress
- Fed hikes 25 bps, terminal rate forecast unchanged at 5.1%
- (FED) Federal Reserve Issues FOMC Statement
AUD/USD Could Recover Higher, Fed Raised Rates Again
Key Highlights
- AUD/USD started an upside correction above the 0.6640 resistance.
- It broke a major bearish trend line with resistance at 0.6670 on the 4-hours chart.
- EUR/USD and GBP/USD extended gains above key hurdles.
- The fed increased interest rates from 4.75% to 5%.
AUD/USD Technical Analysis
The Aussie dollar tested the 0.6565 zone before it started an upside correction against the US dollar. AUD/USD cleared the 0.6620 resistance to move into a short-term positive zone.
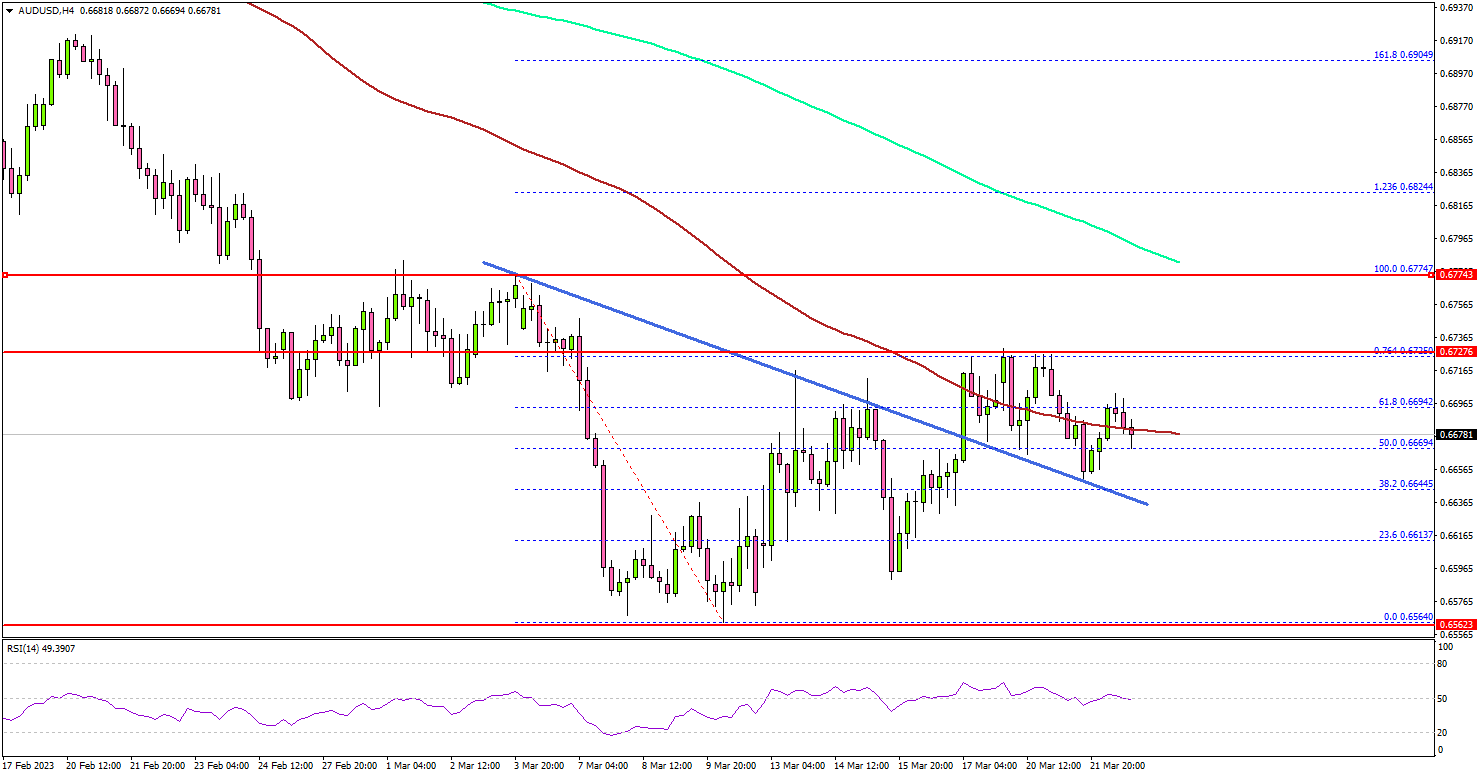
Looking at the 4-hours chart, the pair was able to clear the 0.6650 resistance zone. Besides, it broke a major bearish trend line with resistance at 0.6670.
The bulls were able to push the pair above the 50% Fib retracement level of the downward move from the 0.6774 swing high to 0.6564 low. However, the bears were active near the 0.6750 resistance zone.
It seems like AUD/USD struggled near the 76.4% Fib retracement level of the downward move from the 0.6774 swing high to 0.6564 low. The next major resistance is near the 0.6775. A clear move above the 0.6775 resistance might send the pair towards the 0.6820 zone.
Any more gains might send the pair towards 0.6850 or even 0.6880. On the downside, an immediate support is near the 0.6640.
The next major support is near the 0.66220 level, below which there is a risk of a move towards the 0.6565 level or the last swing low.
Looking at EUR/USD, the pair spiked above the key 1.0750 resistance zone and might attempt more gains in the near term.
Economic Releases
- BoE Interest Rate Decision - Forecast 4.25%, versus 4.0% previous.
- US Initial Jobless Claims - Forecast 201K, versus 192K previous.
Elliott Wave Suggests Ethereum (ETHUSD) at the Support Zone
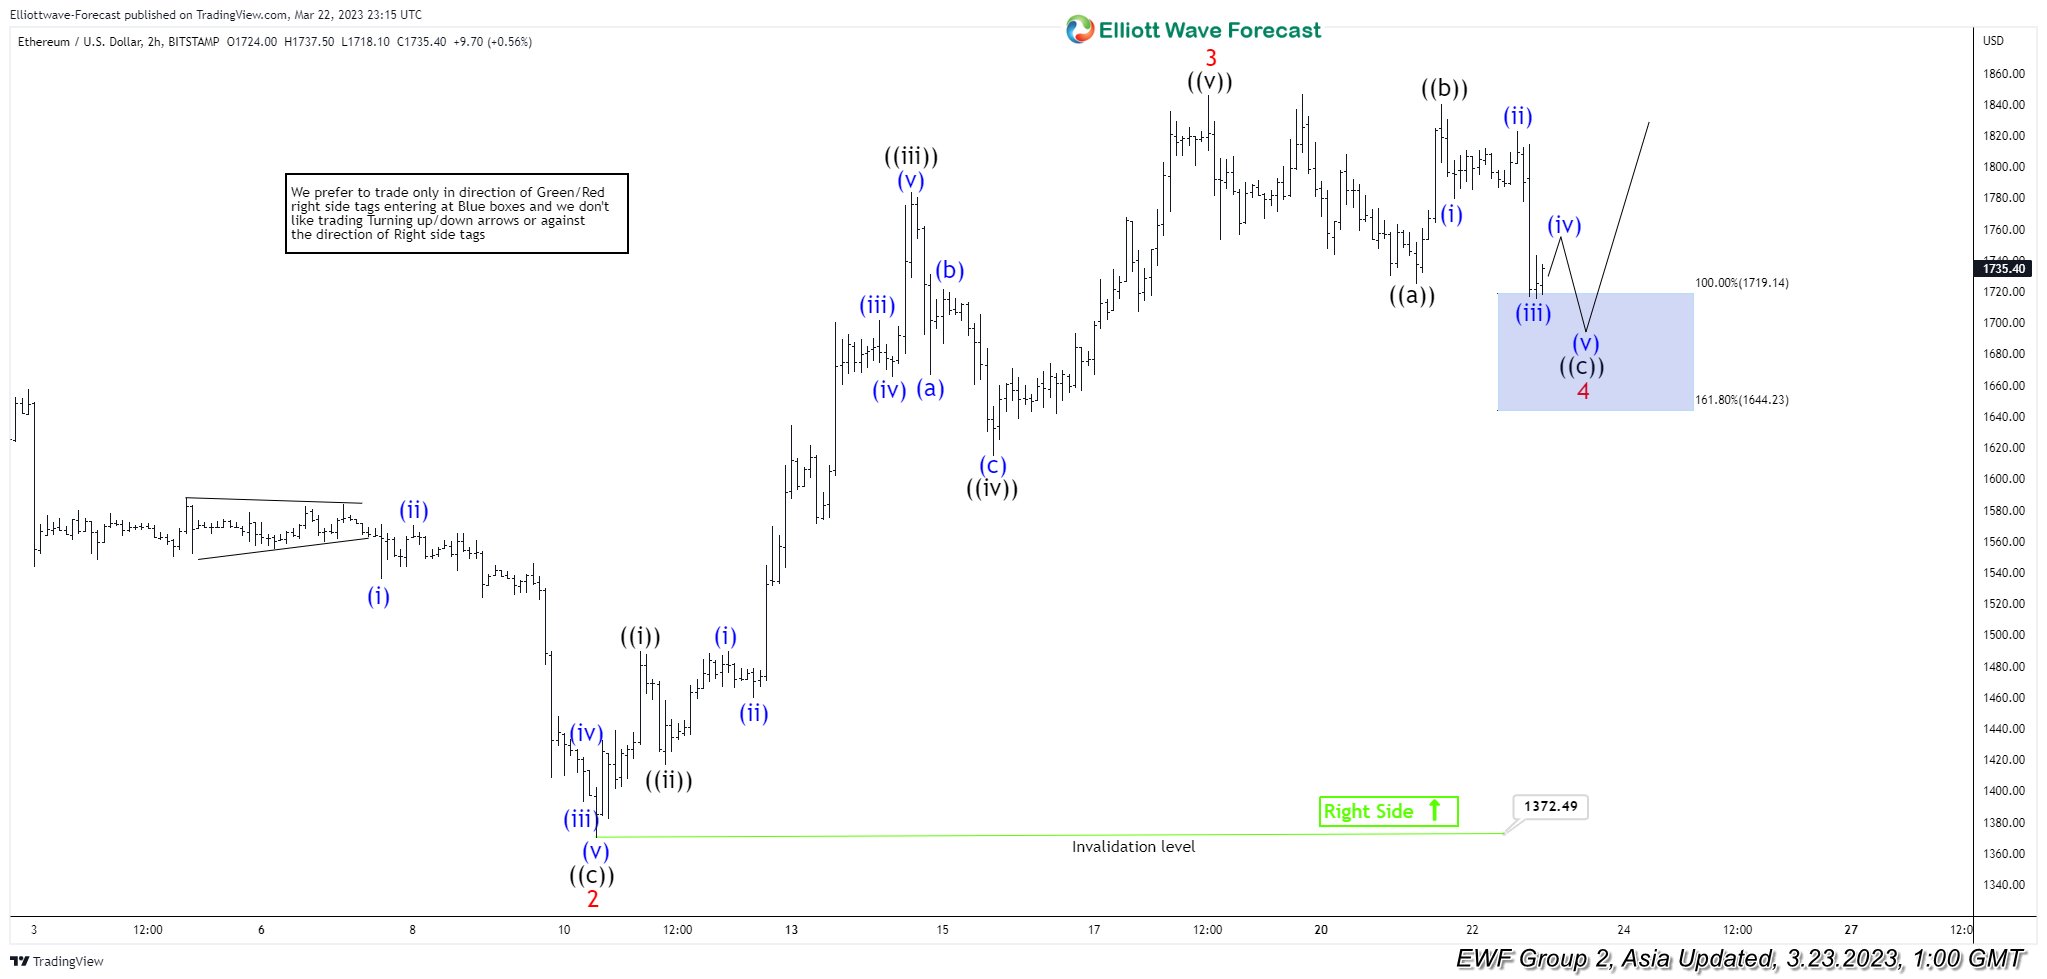
Cycle from November 9, 2022 low in Ethereum (ETHUSD) is in progress as a 5 waves impulse Elliott Wave structure. Up from Nov 9, 2022 low, wave 1 ended at 1742 and wave 2 pullback ended at 1372.49 as the chart below shows. Ethereum has extended higher in wave 3 with internal subdivision as an impulse in lesser degree. Up from wave 2, wave ((i)) ended at 1489.50 and dips in wave ((ii)) ended at 1416.80. The crypto currency extended higher in wave ((iii)) towards 1784.1 and pullback in wave ((iv)) ended at 1614.80. Final leg higher wave ((v)) ended at 1846 which completed wave 3.
Wave 4 pullback is now in progress to correct cycle from March 10, 2023 low before the rally resumes. Internal subdivision of wave 4 is taking the form of a zigzag Elliott Wave structure. Down from wave 3, wave ((a)) ended at 1725 and rally in wave ((b)) ended at 1839.90. Expect wave ((c)) to end soon and Ethereum to extend higher. Potential target for wave ((c)) is 100% – 161.8% Fibonacci extension of wave ((a)). This area comes at 1644.2 – 1719.1 as denoted with the blue box on the chart below. From this area, Ethereum should extend higher or rally in 3 waves at least.
ETHUSD 2 Hour Elliott Wave Chart
Ethereum (ETHUSD) Elliott Wave Video
https://www.youtube.com/watch?v=nR1ivXYdeqQ
FOMC’s Fight Against Inflation Finely Balanced
March’s 25bp hike is likely to be the last for this cycle as banking sector uncertainty tightens financial conditions and weighs on growth.
At their March meeting, the FOMC kept the immediate focus on the fight against inflation by hiking 25bps to a mid-point of 4.875% while also recognising the tightening of financial conditions to come as a result of this month’s Silicon Valley Bank and Signature Bank failures.
While uncertain in time and scale, the inclusion of “Recent developments are likely to result in tighter credit conditions for households and businesses and to weigh on economic activity, hiring, and inflation” makes clear the Committee’s expectation that the cost to the economy from this crisis of confidence in US regional banks will prove significant.
The FOMC go on in the statement to note that “some additional policy firming may be appropriate”, a much more dovish forward view on monetary policy than February’s “ongoing increases in the target range will be appropriate”. Further highlighting the significance of the change in circumstances, the press conference consequently made clear that these views are held by the FOMC despite Inflation being too high and recent data stronger than expected.
The immediate outlook for US monetary policy is therefore uncertain. The FOMC could certainly justify hiking once more in May to a peak of 5.125%. However, given the risks around financial conditions and confidence, holding off to assess would be the more prudent course, particularly given policy is already contractionary and forward indicators for inflation and the labour market were pointing down ahead of this shock, while the impact of these recent developments in the banking system is likely to be substantial for credit availability and economic activity.
Accordingly, we confirm our view that the federal funds rate has now peaked for this tightening cycle.
We also confirm our view that the federal funds rate is likely to remain on hold through the remainder of 2023. Apparent in the FOMC’s projections, and our own forecasts, is a need to keep policy on hold at a contractionary level for an extended period as inflation pressures abate and labour market slack increases. This is necessary to make sure the return to target inflation we forecast for late-2023 is sustainable. It is only once this goal is achieved that policy can be eased.
In contrast to current market pricing which sees 3-4 rate cuts by January 2024, Westpac anticipates rate cuts will not begin until March 2024. It appears that the Committee’s own expectation for policy is similarly timed to ours, with the median forecast of 5.1% at end-2023 followed by 80bps of cuts to end-2024 (surprisingly revised down from 100bps at the December meeting).
The cumulative scale of rate cuts from 2024 will clearly be dictated not only by the persistence of inflation, but also the cost to growth of contractionary monetary policy and banking sector uncertainty. We expect the loss of momentum to be more material in late-2023 than forecast by the FOMC (i.e. annual growth at December 2023 at or below zero versus the FOMC’s 0.4% median), and so anticipate a more aggressive pace of policy easing in 2024 than the Committee (200bps in 2024 from 4.875% versus 80bps from 5.1%).
This abrupt change in the stance of policy should create a robust turn in growth, allowing the FOMC to end the easing cycle in mid-2025 at a neutral level of 2.125%, well ahead of their timing (the FOMC’s end-2025 median forecast is 3.1%) but only marginally below the Committee’s longer-run estimate of 2.5%.
It is important to emphasise, as Chair Powell did in the press conference, that there are now multiple financial condition dynamics to assess in real time, each with their own timeline and risk profile. While term interest rates have fallen sharply, the 10-year yield from a recent peak of 4.06% to 3.50% currently, the economy is unlikely to receive benefit outside of a possible repricing of equities given the uncertainty surrounding the banking system, particularly the regional banks.
As the FOMC goes on hold, then begins to cut in 2024, term interest rates will fall further and general uncertainty over the health of the banking sector should subside; but a tighter regulatory focus on regional banks with less than $250bn in assets (which, until now, have had less onerous requirements) will likely continue to constrain lending and consequently investment and employment.
It is only after the regulatory regime is reset and confidence fully restored that easier policy will bring growth back above trend on a sustainable basis. This is unlikely before late-2024, at the earliest.
FOMC Hikes Rates, But End of Tightening Cycle Coming Into View
Summary
- The FOMC raised its target range for the federal funds rate by 25 bps at today's policy meeting. Fed policymakers have raised rates by 475 bps over the course of the past 12 months, the fastest pace of tightening since the early 1980s.
- The FOMC continues to have a relatively upbeat assessment of the current state of the economy. That said, it noted that "recent developments are likely to result in tighter credit conditions." This credit tightening likely will "weigh on economic activity," although "the extent of these effects is uncertain."
- Previously, the FOMC thought that "ongoing increases" in the fed funds rate would be needed to bring inflation back to the Committee's 2% target. Now the FOMC thinks that "some additional policy firming may be appropriate." In short, it appears that the end of the current tightening cycle is coming into view.
- The median 2023 dot in the "dot plot" lies between 5.00% and 5.25%, which is only 25 bps higher than the current target range for the federal funds rate. We look for the FOMC to hike rates by 25 bps at its May 3 before going on an extended pause in future meetings in 2023.
FOMC Hikes Rates By 25 bps Again
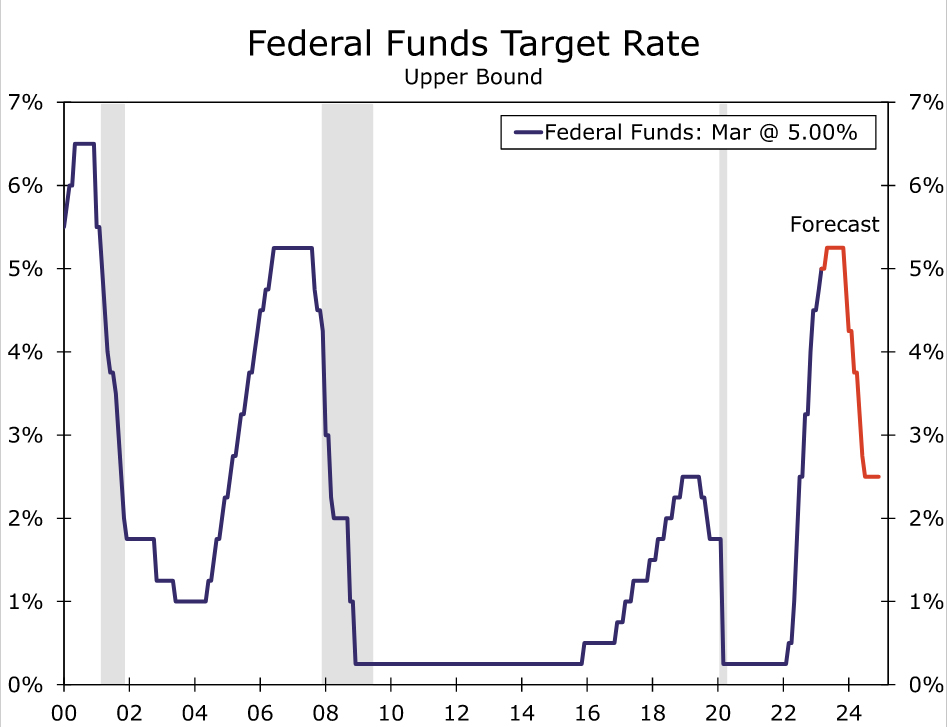
The Federal Open Market Committee (FOMC) voted unanimously today to hike rates by 25 bps, bringing the target range for the federal funds rate to 4.75%-5.00% (Figure 1). The Committee has now hiked rates by 475 bps over the course of the past 12 months, the fastest pace of tightening since the early 1980s. Furthermore, the FOMC decided to maintain the current pace of quantitative tightening, allowing up to $60 billion of Treasury securities and $35 billion of mortgage-backed securities to continue to roll off its balance sheet every month. The decision was more or less expected by financial markets.
The FOMC continues to characterize the current state of the economy in favorable terms. The statement noted that "recent indicators point to modest growth in spending and production," and that job gains "are running at a robust pace." According to the FOMC, "inflation remains elevated." The Committee also noted the strains that have appeared in the banking system recently. In the FOMC's view, these strains "are likely to result in tighter credit conditions for households and businesses and to weigh on economic activity, hiring and inflation," although "the extent of these effects is uncertain."
Accordingly, the FOMC backed off somewhat on its forward guidance regarding further tightening. Previously, the statement said that "ongoing increases (emphasis ours) in the target range will be appropriate in order to attain a stance of monetary policy that is sufficiently restrictive to return inflation to 2 percent over time." The FOMC now judges that "some additional policy firming may be appropriate." In short, the uncertainty that the present banking system turmoil has engendered, along with the "tighter credit conditions" that likely will result, means that the end of the current tightening cycle is coming into view. In that regard, Chair Powell acknowledged in his post-meeting press conference that the FOMC considered a pause in its tightening cycle at this meeting.
The FOMC updated its Summary of Economic Projections (SEP), as it normally does once per quarter, in which it specifies its macroeconomic forecasts. The SEP contains the so-called "dot plot" that shows each individual FOMC member's assessment on the appropriate level of the fed funds rate over the next few years (Figure 2). The median dot for the end of this year lies in the middle of the 5.00%-5.25% range. Although this median dot is unchanged from the last dot plot in December, it likely would have been higher if banking system strains had never occurred. Relative to the projection that it released in December, the FOMC shaved 0.4 percentage points from its GDP growth forecast for 2024 and now looks for 1.2% GDP growth next year. This downward revision is consistent with the Committee's view that the current strains in the banking system will lead to "tighter credit conditions" that likely will have consequences for the real economy.
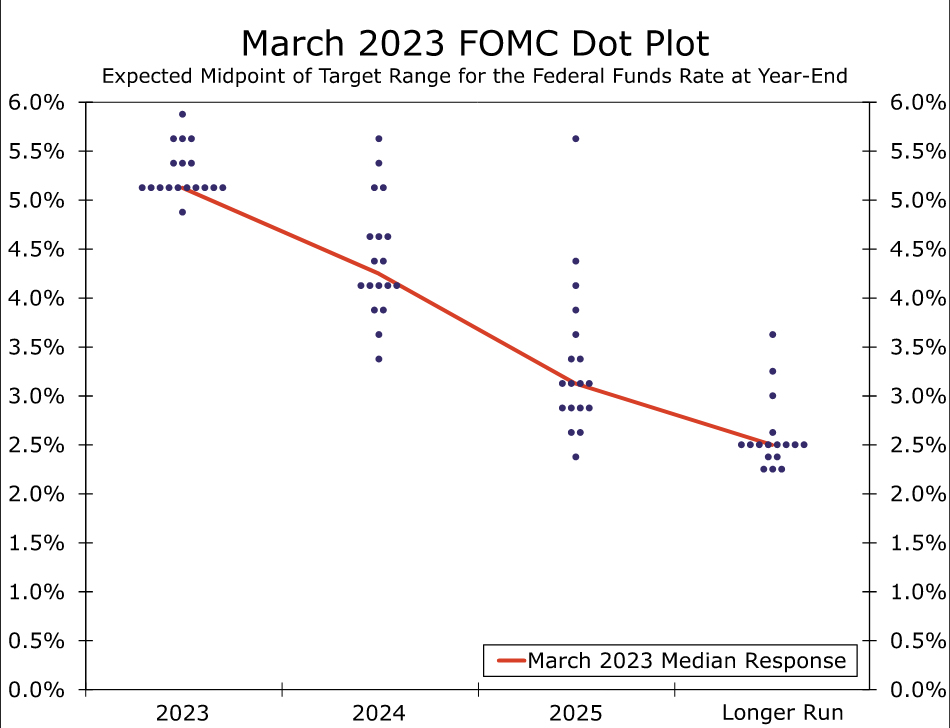
As we wrote in our recent U.S. Economic Outlook in which we updated our forecasts, we are explicitly assuming that authorities take the necessary steps in coming days and weeks to keep the current turmoil in the banking system more or less contained. If this assumption proves to be valid, then we anticipate that the Committee will increase the target range for the federal funds rate by another 25 bps at its next meeting on May 3, which we believe will be the last rate hike in this cycle. We think the FOMC will refrain from hiking the fed funds rate at the June 14 meeting in order to assess the effects that tighter monetary policy and credit conditions are having on the economy. That said, we would judge the risks to our fed funds forecast to be skewed to the upside. That is, we judge the probability of another 25 bps rate hike at the June 14 meeting to be higher than a pause at the May 3 meeting, assuming that authorities are successful in stabilizing the recent turmoil. We expect the Committee will remain on hold for most of the rest of 2023 as economic activity weakens and inflation recedes further. If our forecast of a modest recession beginning in the third quarter comes to pass, then we look for the FOMC to cut rates significantly next year.