Sample Category Title
Gold: Top-down Technical Analysis
During tumultuous times like the current Credit Suisse-bailout period, the top-down technical analysis could be the compass for market investors/traders. Focusing on multiple timeframes can protect from decisions based purely on the very short-term periods examined. This process tends to be more time-consuming and ignored by most traders, but the benefits clearly outweigh the negatives. In this report, we analyse gold, which along with other financial instruments continue to feel the banking sector crisis aftershocks, starting from the longer-term and gradually moving to the lower time periods.
Starting point: Weekly timeframe
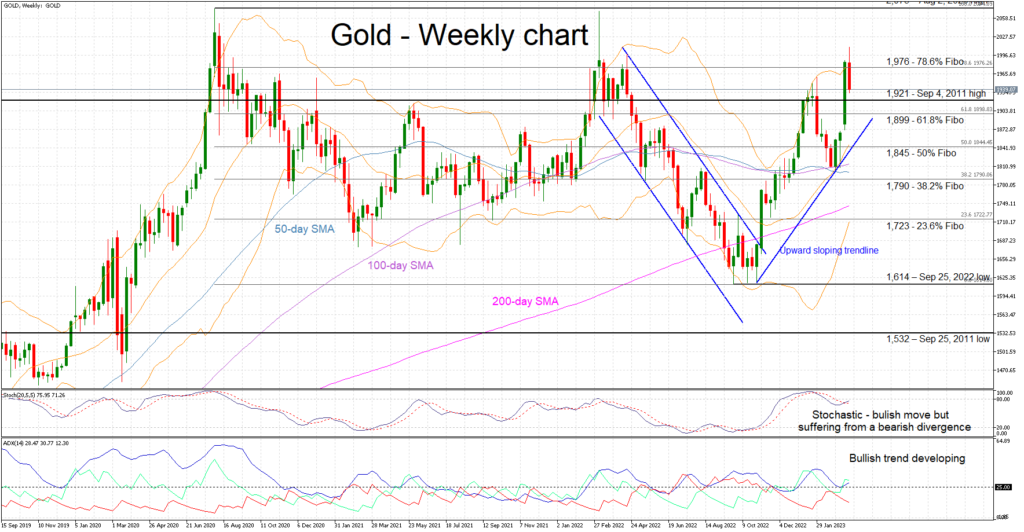
We start from the weekly chart and the aim is to find the long-term trend and key support/resistance levels. Gold has made an impressive rally since the September 2022 low of 1,614 and has traded again above the 2,000 threshold. This is the third time that gold has penetrated this key psychologically important area since August 2020. This is not unexpected considering the grave developments both economically and financially that the world has been going through since the Covid pandemic and more recently the soaring inflation phase.
The current price level remains above the various simple moving averages (SMAs) employed here and a key upward sloping trendline. In the meantime, the Average Directional Movement Index (ADX) is trading above the 25 level threshold, signaling a trending market. While the technical picture is still pointing to a bullish trend, the stochastic oscillator is trying to contradict it. The higher high in gold has been met with lower high by the stochastic oscillator. This bearish divergence could allow the bears to push the gold price lower, with the September 4, 2011 high of 1,921 being their first target.
Next step: Daily timeframe
The daily chart is the favorite among traders and attracts the biggest interest. In addition to key levels, we focus on local peaks and troughs, and start to pay more attention to the SMAs and Fibonacci retracement levels.
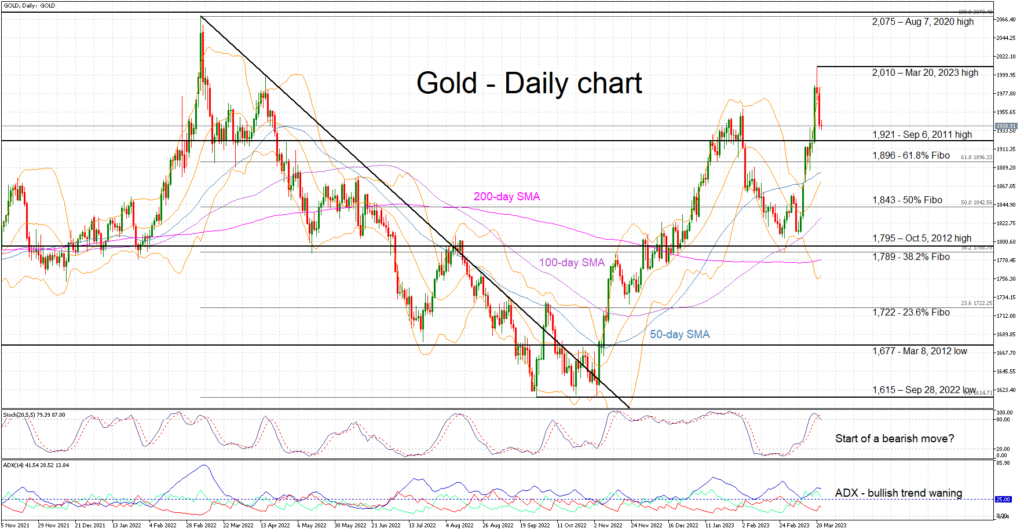
The strong rally seen since March 8 has pushed to 2,010, the highest level since March 9, 2022. Gold has been dropping in the past three sessions, as the overall market sentiment appears to have improved somewhat from last week. This is depicted in the ADX where the bullish trend appears to top out. Similarly, the stochastic oscillator is trying to break below its overbought territory. Such a move could provoke a bearish reaction with the September 6, 2011 high of 1,921 standing nearby. This area appears to trouble the bears when examining gold’s performance during the March-April 2022 and January 2023 period respectively. Such a correction though could even suit the bulls considering the aggressive rally last week, provided that the next local trough is above the 1,800 area.
Third step: 4-hour timeframe
Long-term investors would be content with the weekly and daily analysis while very short-term trades would look at the 4-hour chart very briefly before delving into the 1-hour and 15-minute timeframes. For our purpose, the 4-hour seems sufficient to understand the shorter-term dynamics, identify the key levels for potential entry and exit in the market.
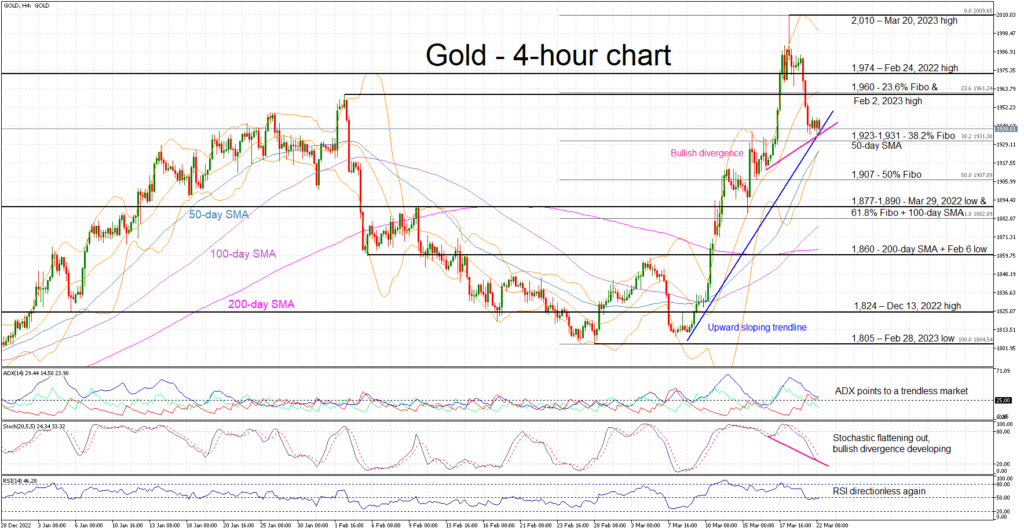
Gold has recorded an impressive move since the March 8 lows, pushing above the 2,000 psychological level. A correction has occurred in the three daily sessions as the market is trying to find a new balance around the 1,840 area. The overall technical picture is pointing to a more balanced market, potentially preparing for the next move. The ADX is just above its “trendless” territory and the RSI is hovering around its 50-midpoint. In addition, the stochastic oscillator appears to be flattening out just above its oversold area.
However, the bulls might be able to find courage from the courage for a developing bullish divergence (pink line at the 4-hour chart). The higher low in gold’s price action has been met by a lower low in the stochastic. The next resistance would come at 1,960, the 23.6% Fibonacci retracement of the February 28 – March 23 uptrend and the February 2 high. On the other hand, the bears would have to battle with the March 9 upward sloping trendline and eventually the combination of the 38.2% Fibonacci retracement and the 50-day SMA at the 1,923-1,931 range.
Putting everything together
The process of examining multiple timeframes tends to be time-consuming, but it remains a better way of analyzing the market. The timeframes examined can be adjusted to the profile of each trader, but we believe that the above top-down process should feature in every traders’ armory. Regarding gold analysed here:
- In the weekly chart, the bullish trend remains in place. Bears need a break below the 1,850 to change the market’s fate.
- The correction appears to have legs considering the current momentum indicators and provided that the bears manage to break the 1,920 area.
- The overall picture points to balanced market although a bullish divergence and a weakening bullish trend could reignite the bulls’ appetite.
AUD/USD Gains Ground, All Eyes on Federal Reserve
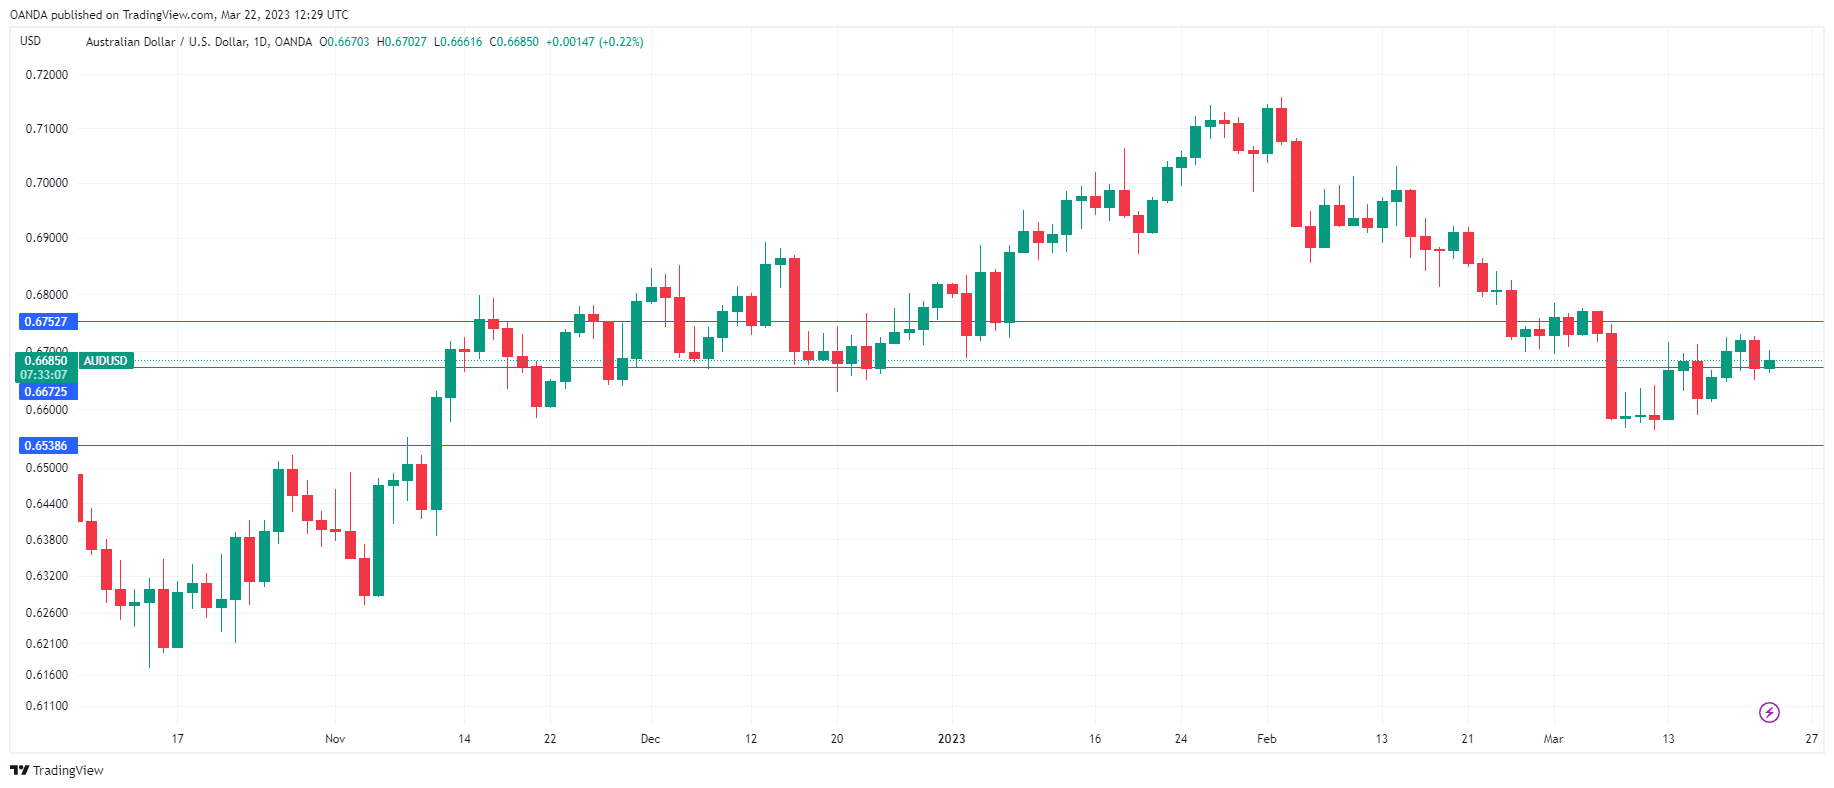
The Australian dollar is in positive territory on Wednesday, ahead of the Federal Reserve’s rate announcement. In the European session, AUD/USD is trading at 0.6681, up 0.16%.
Fed expected to deliver 25 bp hike
The Federal Reserve winds up its policy meeting later today and anything other than a 25 basis point hike would be a massive surprise. The Fed is meeting against the backdrop of a banking crisis in which four US banks as well as Credit Suisse have failed, stunning the financial markets. Investors will be listening carefully to Fed Chair Powell who is expected to address the banking crisis. Today’s hike is a foregone conclusion, but a key element of this meeting will be the Fed’s updated rate projections for the first time since December. Will the projections call for more hikes or will the Fed signal that cuts are coming later this year? The rate path that the Fed outlines could have a significant impact on the movement of the US dollar, especially with investors jittery after the recent market mayhem.
The US has responded quickly to the banking crisis, which has eased the fears which gripped the markets last week. The Fed and other central banks coordinated action to boost liquidity and 11 major lenders have pledged $30 billion to rescue First Republic Bank. This may not be enough though and First Republic could require federal assistance in order to stay afloat.
Treasury Secretary Yellen sought to calm nervous markets on Tuesday, saying that the banking system was stabilizing and that the government would intervene to protect depositors of small banks if needed. This is a clear message that Yellen is prepared to do what she can to prevent the contagion from spreading further.
In Australia, the Reserve Bank of Australia was quick to reassure the markets and the public about the strength of the Australian banking system. RBA Assistant Governor Kent said on Monday that Australian banks are “unquestionably strong” in the midst of the “strained” conditions in the global financial markets. The RBA minutes on Tuesday were on the dovish side, stating that the central bank only considered a 25-bp hike at the March meeting. This Australian dollar responded with sharp losses of 0.72% in response.
AUD/USD Technical
- AUD/USD is testing resistance at 0.6672. Above, there is resistance at 0.6753
- 0.6618 and 0.6537 are providing support
UK Inflation Will Strengthen the Hawks
UK consumer prices rose by 1.1% in February. Instead of the expected slowdown in annual inflation from 10.1% to 9.9%, we saw an acceleration to 10.4%. The core CPI returned to 6.2% y/y.
This is an essential signal of continuing inflationary pressure. It clearly shows that the Bank of England’s work to contain inflation is far from over.
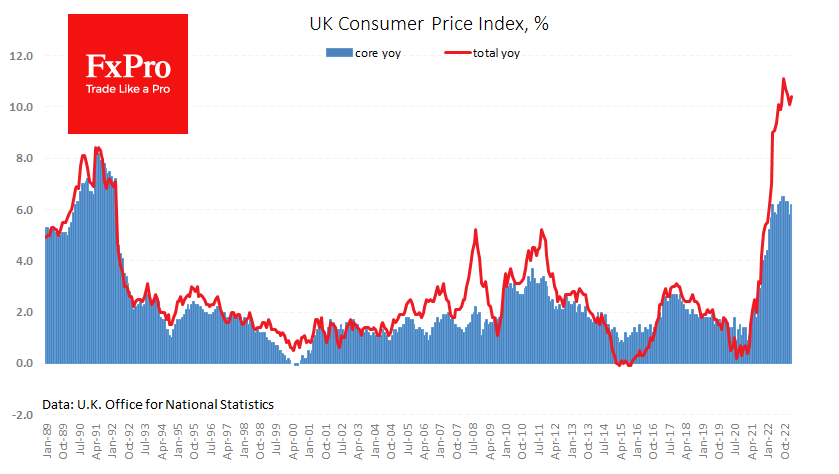
As it turns out, it is still too early to say that inflation in the UK is on a sustained downward path. In the US and Canadian data, we have also previously pointed out that monthly price growth remains strong while annual inflation is falling due to a high base effect, as the first half of 2022 was the peak inflationary period.
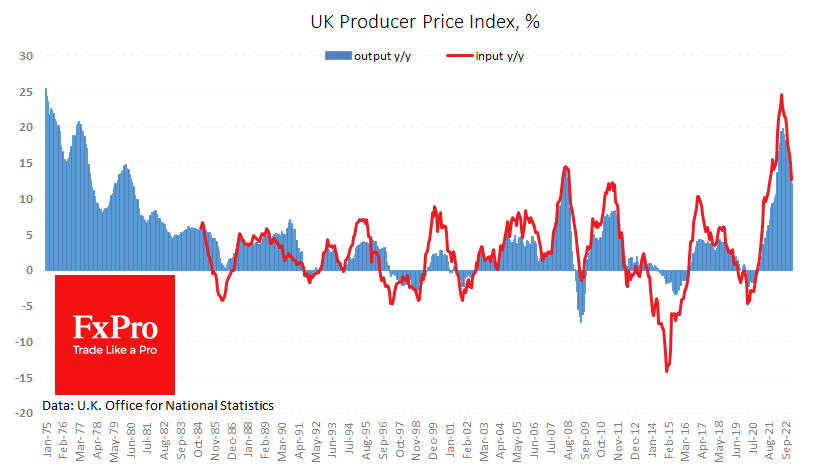
Final prices are now rising mainly due to increasing labour and service costs, as raw material and energy prices are decreasing. Input and Output producer prices fell by 0.2% last month to 12.7% and 12.1%, respectively.
The Bank of England is set to announce its interest rate decision on Thursday. An increase of 25 points to 4.25% is expected. Today’s data should be in the hands of the hawks on the committee, increasing the chances of a 50-point hike or at least a more hawkish signal on the next steps.
The big question is the health of the banking sector, but so far, the problems of UK banks have yet to make the headlines, leaving the central bank free to continue fighting inflation, supporting interest in the Pound.
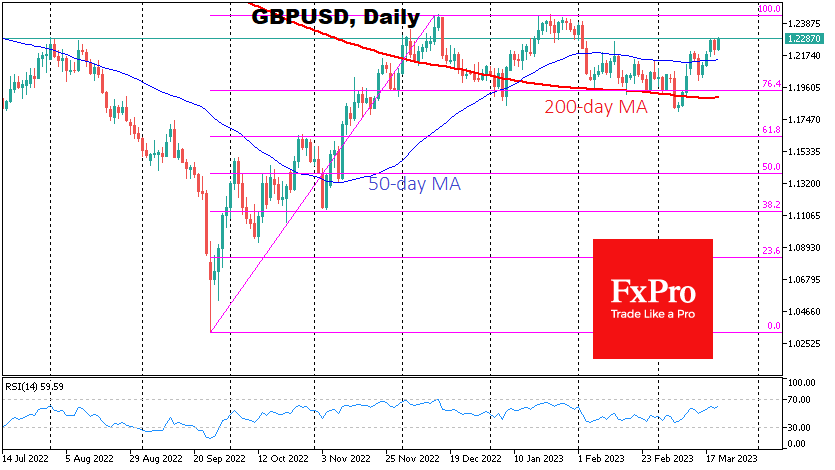
The GBPUSD is approaching 1.23 after a brief dip to 1.18 earlier this month, which we see as a tactical retreat ahead of fresh upside momentum. There is now a direct path to the December-January highs above 1.24. But this will only encourage the bulls and reinforce their belief that 1.3000 is within reach before mid-year.
Sterling Rises on Strong UK CPI Data and BoE Expectations, But FOMC Next First
Sterling is performing strongly after the release of stronger than expected UK CPI data, indicating a rise in inflation rather than a slow-down in February. As a result, it is highly likely that the BoE will hike interest rates by another 25bps during their meeting tomorrow. However, there is now speculation on whether there will be a pause in May, making tomorrow's vote split more important than ever.
Dollar, on the other hand, is softer in comparison to most currencies, with the exception of Yen, as investors await the FOMC rate decision. The consensus is that there will be a 25bps rate hike, but what comes next is highly uncertain. Due to recent market turmoil, Fed may also delay the publication of new economic projections, leaving investors unsure of what to expect.
Elsewhere in the forex markets, Yen is the worst performer of the day due to rising US and European benchmark treasury yields, while Swiss Franc is the second worst. On the other hand, Euro, Aussie and Kiwi have been on the firmer side.
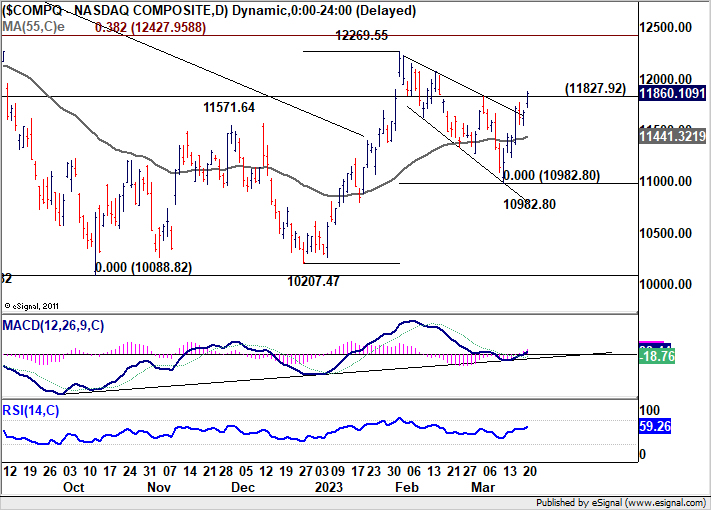
Technically, one major focus today is the stock markets' reaction to Fed. NASDAQ's break of 11827.92 resistance yesterday was a near term bullish signal, affirming the view the corrective pull back from 12269.55 has completed at 10982.80 already. That is, rise from 10207.47 should be resuming. Another day of rally and close above 11827.92 will likely set the base for at least a take on 12269.55 soon.
In Europe, at the time of writing, FTSE is up 0.11%. DAX is up 0.51%. CAC is up 0.35%. Germany 10-year yield is up 0.096 at 2.392. Earlier in Asia, Nikkei rose 1.93%. Hong Kong HSI rose 1.73%. China Shanghai SSE rose 0.31%. Singapore Strait Times rose 1.48%. Japan 10-year JGB yield rose 0.0879 to 0.334.
Some suggested readings on Fed:
- Fed expected to hike 25bps, divided opinion on future path
- Suderman Says: To Raise Rates or Not, Fed Walks a Tightrope
- Fed Faces Dilemma, Hit Pause or Keep Raising Rates?
- Fed Meeting Preview: Dollar Index at 1-month Low ahead of Tight Decision
- Fed to Go Ahead with 25 bp Hike; Canadian CPI Growth to Slow
- Fed Preview – Rate Hikes Continue Despite the Volatility
- March Flashlight for the FOMC Blackout Period: The Flashlight Needs Fresh Batteriess Too Dovish?">
ECB President Lagarde Stresses Robust Strategy Amid High Inflation and Market Uncertainty
In a speech today, ECB President Christine Lagarde highlighted the challenges posed by persistent high inflation and increasing uncertainty. She noted, "Since July last year we have raised interest rates by 350 basis points. However, inflation is still high, and uncertainty around its path ahead has increased. This makes a robust strategy going forward essential."
Lagarde outlined a three-pronged strategy to tackle these issues:
- Data-dependent rate path: Emphasizing the importance of data dependency in times of high uncertainty, Lagarde stated, "This means, ex ante, that we are neither committed to raise further nor are we finished with hiking rates."
- Liquidity support amidst market volatility: Acknowledging recent financial market turbulence, she assured, "We are ready to act and provide liquidity support to the financial system if needed." Lagarde emphasized the ECB's proven ability to "set the appropriate policy stance to control inflation and at the same time use other instruments to address risks to monetary policy transmission."
- Clear reaction function: The third element focuses on continuous monitoring of three key inputs – inflation outlook, underlying inflation, and policy transmission. Lagarde explained, "The future calibration of the rate path will be determined by – and will require continuous monitoring of – these three key inputs."
Bundesbank Nagel insists fight against inflation continues
In an Financial Times interview, Bundesbank President Joachim Nagel expressed that the fight against inflation is far from over, despite the ECB's efforts to curb it. He stated, "Our fight against inflation is not over. There's certainly no mistaking that price pressures are strong and broad-based across the economy."
Nagel emphasized the need for persistence in combating inflation, suggesting that "If we are to tame this stubborn inflation, we will have to be even more stubborn."
He also highlighted the progress made by ECB, mentioning that they are "approaching restrictive territory." However, he warned against the potential pitfalls of stopping rate hikes too soon and succumbing to calls for rate cuts. According to Nagel, doing so would risk a repeat of the 1970s, when "inflation flared up again" following the oil supply shocks.
As for concerns surrounding the recent banking crisis, Nagel dismissed comparisons to the 2008 financial crisis. He confidently asserted, "We are not facing a repeat of the financial crisis we saw in 2008. We can manage this with the Eurozone's "resilient" banking system.
UK CPI rose back to 10.4% yoy in Feb, core CPI up to 6.2% yoy
UK CPI accelerated from 10.1% yoy to 10.4% yoy in February, well above expectation of slowing to 9.8% yoy. The reading was still below recent peak of 11.1% yoy in October 2022, the highest since 1981. CPI excluding food, energy, alcohol and tobacco (core CPI) jumped from 5.8% yoy to 6.2% yoy, above expectation of 5.7% yoy. On a monthly basis, CPI rose 1.1% mom, more than reversing January's -0.6% mom decline, above expectation of 0.6% mom.
Also released, RPI came in at 1.2% mom, 13.8% yoy, above expectation of 0.8% mom, 13.2% yoy. PPI input was at -0.1% mom, 12.1% yoy, versus expectation of 0.8% mom, 12.5% yoy. PPI core output was at -0.2% mom, 10.4% yoy, versus expectation of 0.4% mom, 9.9% yoy.
Australia Westpac leading index remains negative, indicating further slowdown
Australia's Westpac Leading Index rose slightly from -1.04% to -0.94% in February, but it still marks the seventh consecutive month of negative growth rate, pointing to below-trend growth over the next 3-9 months. This is in line with Westpac's forecast that growth in the Australian economy will be only 1% in 2023.
The slowdown reflects the lagged effects of rising interest rates, a deep shock to real wages, a bottoming out of the savings rate, and falling house prices. Westpac also expects the weakness to extend into 2024, with more negative readings likely.
RBA indicated in its March minutes that the board intends to consider a pause at its April meeting. However, Westpac does not expect that a decision to pause in April will mark the end of the cycle. It expects new information for the May meeting to indicate the need for a further response from the board, with a final 0.25% increase in the cash rate in May marking the end of the tightening cycle.
NZ consumer confidence rose slightly to 77.7, but well below long-term average
New Zealand's Westpac McDermott Miller Consumer Confidence Index rose slightly by 2.1 points to 77.7 in March, but still remains well below the long-term average of 108.8. The President Conditions Index and the Expected Conditions Index also increased, but are still far below their long-term averages of 106.1 and 100.6, respectively.
Despite the slight uptick in confidence, Westpac notes that households across the country continue to grapple with the increasing costs of living, higher mortgage rates, and a downturn in the housing market. The Expected financial situation has improved, but remains negative at -3.8, while the 1-year economic outlook has only slightly improved to -41.1, and the 5-year economic outlook has dropped to -10.8.
The mounting financial pressures are already affecting household spending, and as they become more pronounced, Westpac expects to see an increasing number of households winding back their spending over the next year. This weakness in consumer confidence could have significant implications for the overall economy, as household spending is a major driver of economic growth.
GBP/USD Mid-Day Outlook
Daily Pivots: (S1) 1.2170; (P) 1.2226; (R1) 1.2274; More...
GBP/USD's rally from 1.1801 resumed after brief retreat and intraday bias is back on the upside. Further rally should be seen to 2.2445/6 resistance zone. Decisive break there will resume larger rise from 1.0351, and target 1.2759 fibonacci level. However, break of 1.2177 minor support will now argue that corrective pattern from 1.2445 is extending with another falling leg, and turn bias to the downside.
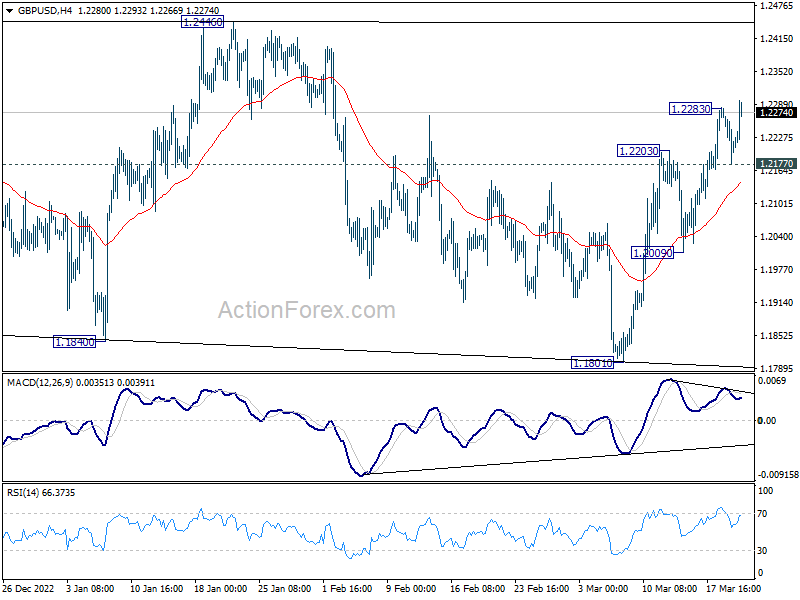
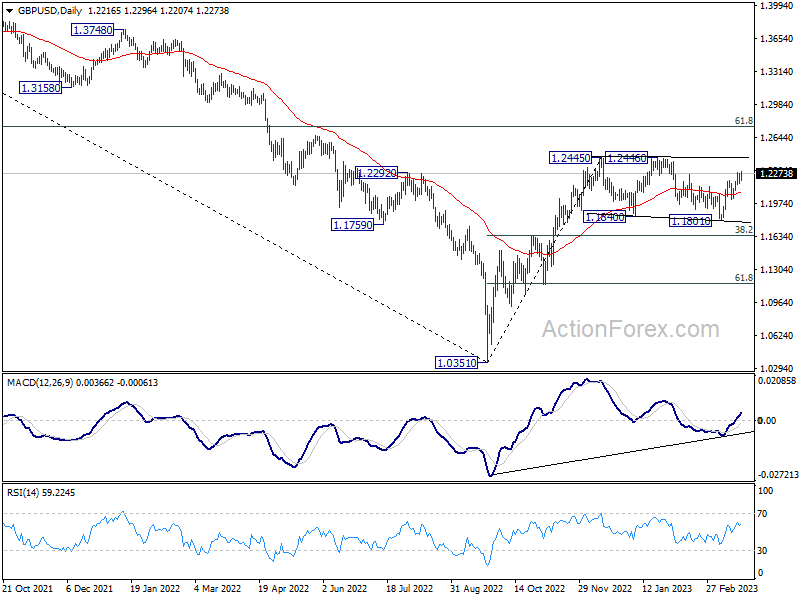
In the bigger picture, price action from 1.2445 are seen as a corrective pattern to rise from 1.0351 medium term bottom (2022 low). Resumption is expected as a later stage and firm break of 1.2446 will target 61.8% retracement of 1.4248 (2021 high) to 1.0351 at 1.2759. This will remain the favored case as long as 38.2% retracement of 1.0351 to 1.2445 at 1.1645 holds.
Economic Indicators Update
| GMT | Ccy | Events | Actual | Forecast | Previous | Revised |
|---|---|---|---|---|---|---|
| 23:30 | AUD | Westpac Leading Index M/M Feb | -0.10% | -0.10% | ||
| 07:00 | GBP | CPI M/M Feb | 1.10% | 0.60% | -0.60% | |
| 07:00 | GBP | CPI Y/Y Feb | 10.40% | 9.80% | 10.10% | |
| 07:00 | GBP | Core CPI Y/Y Feb | 6.20% | 5.70% | 5.80% | |
| 07:00 | GBP | RPI M/M Feb | 1.20% | 0.80% | 0.00% | |
| 07:00 | GBP | RPI Y/Y Feb | 13.80% | 13.20% | 13.40% | |
| 07:00 | GBP | PPI Input M/M Feb | -0.10% | 0.70% | -0.10% | 0.40% |
| 07:00 | GBP | PPI Input Y/Y Feb | 12.70% | 10.80% | 14.10% | 13.50% |
| 07:00 | GBP | PPI Output M/M Feb | -0.20% | 0.80% | 0.50% | |
| 07:00 | GBP | PPI Output Y/Y Feb | 12.10% | 12.50% | 13.50% | |
| 07:00 | GBP | PPI Core Output M/M Feb | -0.20% | 0.40% | 0.60% | 0.70% |
| 07:00 | GBP | PPI Core Output Y/Y Feb | 10.40% | 9.90% | 11.10% | 11.20% |
| 09:00 | EUR | Eurozone Current Account (EUR) Jan | 17.0B | 16.5B | 15.9B | |
| 12:30 | CAD | New Housing Price Index M/M Feb | -0.20% | -0.10% | -0.20% | |
| 14:30 | USD | Crude Oil Inventories | -1.7M | 1.6M | ||
| 18:00 | USD | Fed Interest Rate Decision | 5.00% | 4.75% | ||
| 18:30 | USD | FOMC Press Conference |
EUR/USD Mid-Day Outlook
Daily Pivots: (S1) 1.0720; (P) 1.0754; (R1) 1.0804; More...
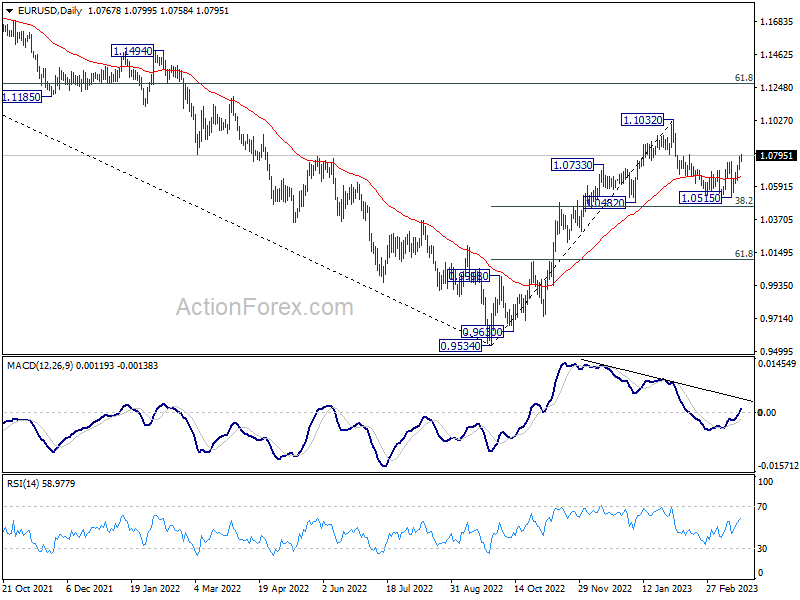
EUR/USD's rally from 1.0515 is still in progress and intraday bias stays on the upside. As noted before, corrective fall from 1.1032 should have completed at 1.0515 already. That came after defending both 1.0482 support and 38.2% retracement of 0.9534 to 1.1032 at 1.0258. Further rise should be seen for retesting 1.1032 high next. On the downside, below 1.0703 minor support will turn intraday bias neutral again first.
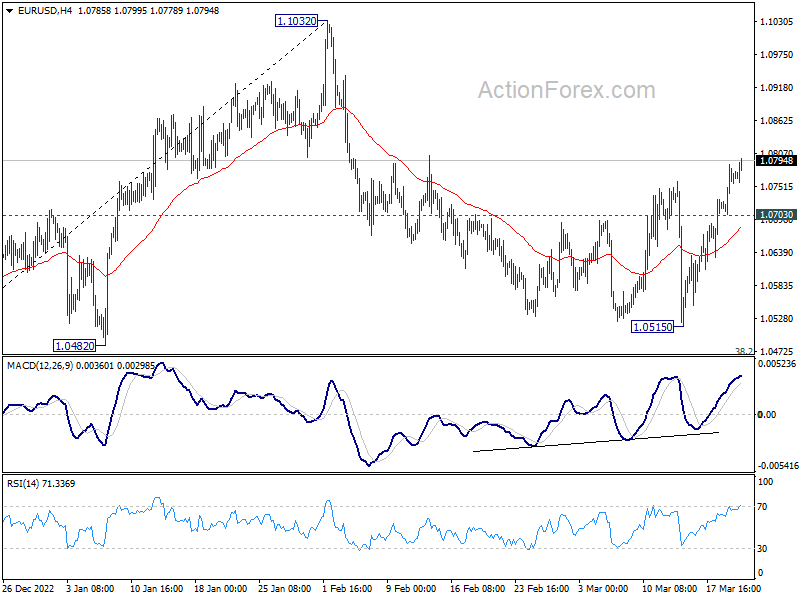
In the bigger picture, as long as 1.0482 support holds, rise from 0.9534 (2022 low) should continue to 61.8% retracement of 1.2348 (2021 high) to 0.9534 at 1.1273. However, sustained break of 1.0482 will bring deeper fall to 61.8% retracement of 0.9534 to 1.1032 at 1.0106, with risk of breaking through 0.9534 eventually.
USD/JPY Mid-Day Outlook
Daily Pivots: (S1) 131.45; (P) 132.04; (R1) 133.04; More...
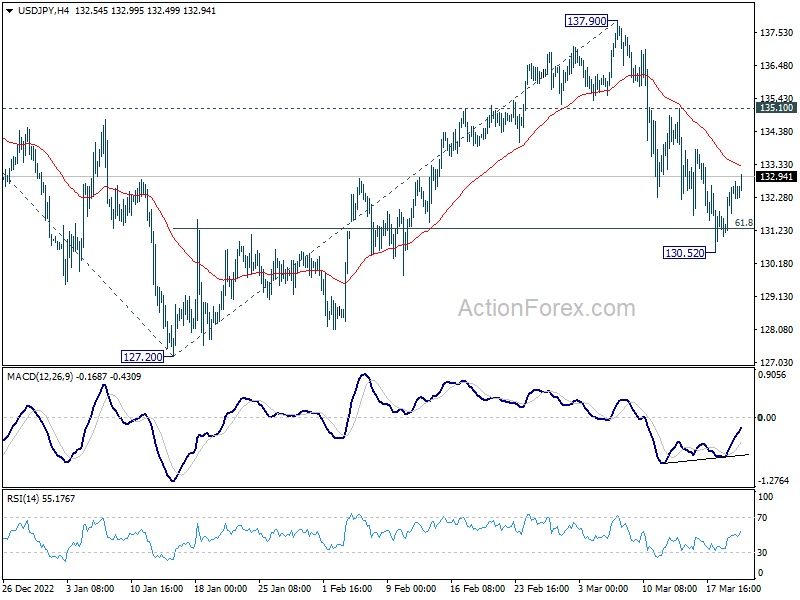
Intraday bias in USD/JPY stays neutral at this point. Further decline is expected as long as 135.10 resistance holds. The current favored case is that rebound from 127.20 has completed at 137.90 already. Sustained trading below 61.8% retracement of 127.20 to 137.90 at 131.28 will pave the way to retest 127.20 low next. However, break of 135.10 will turn bias back to the upside for 137.90 instead.
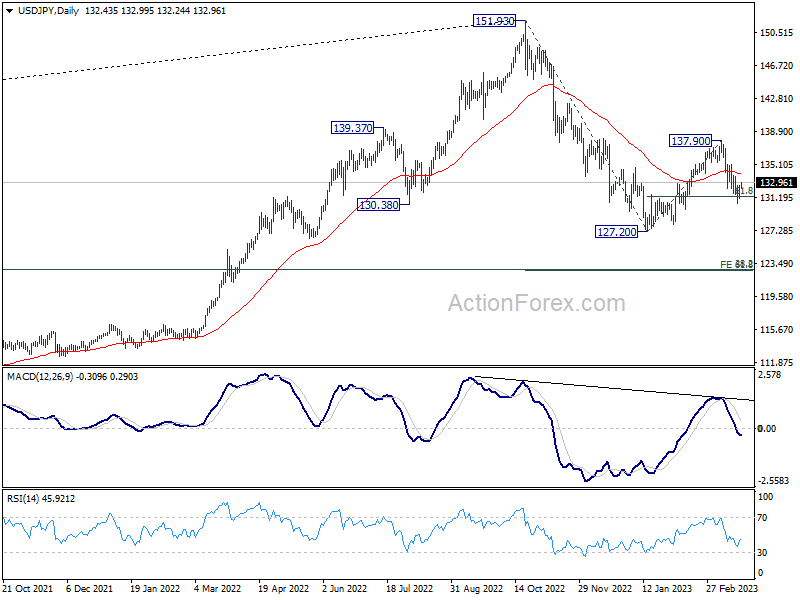
In the bigger picture, rebound from 127.20 should have completed at 137.90 as a corrective move, with strong break of 55 day EMA. The down trend from 151.93 (2022 high) is not over yet. Break of 127.20 will resume this down trend and target 61.8% projection of 151.93 to 127.20 from 137.90 at 122.61. This will now be the favored case as long as 137.90 resistance holds.
USD/CHF Mid-Day Outlook
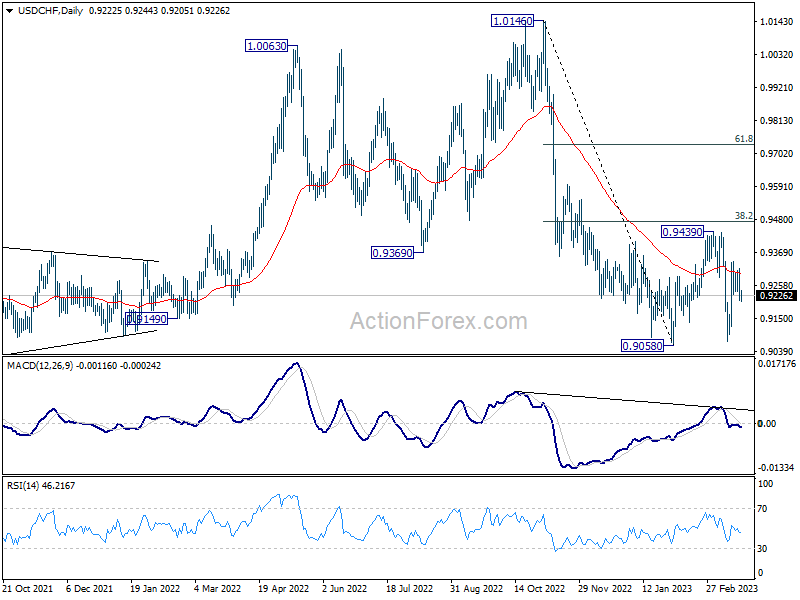
Daily Pivots: (S1) 0.9184; (P) 0.9250; (R1) 0.9291; More...
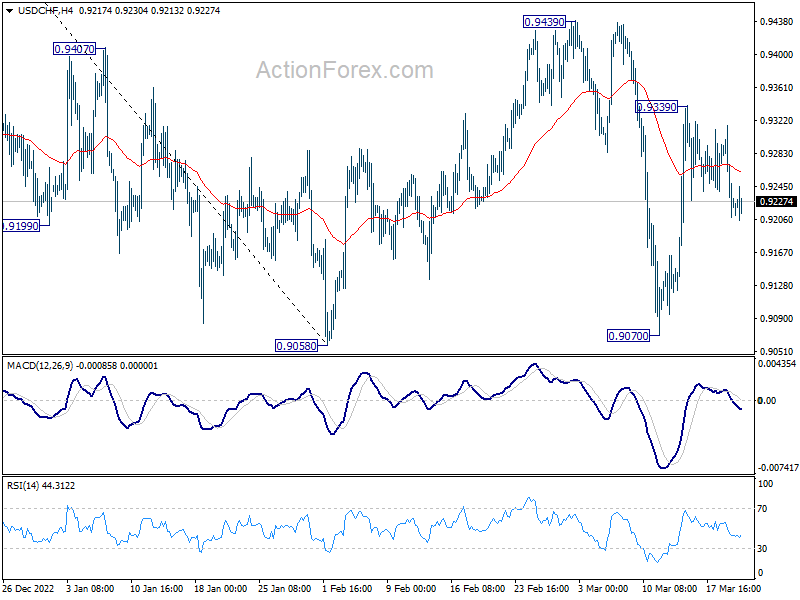
Outlook in USD/CHF remains unchanged and intraday bias stays neutral. Corrective pattern from 0.9058 low should still be in progress with rise from 0.9070 as the third leg. Above 0.9339 will target 0.9439 resistance and possibly above. But overall, outlook will stay bearish as long as 0.9474 fibonacci level holds, and another decline through 0.9058 is expected at a later stage.
In the bigger picture, fall from 1.1046 (2022 high) should still be in progress with 38.2% retracement of 1.0146 to 0.9058 at 0.9474 intact. Rejection by 55 week EMA was a medium term bearish sign. Break of 0.9058 will resume such decline towards 0.8756 support (2021 low). But overall, such fall is still as a leg in the long term range pattern from 1.0342 (2016 high). So, downside should be contained by 0.8756 to bring reversal.
GBP/USD Mid-Day Outlook
Daily Pivots: (S1) 1.2170; (P) 1.2226; (R1) 1.2274; More...
GBP/USD's rally from 1.1801 resumed after brief retreat and intraday bias is back on the upside. Further rally should be seen to 1.2445/6 resistance zone. Decisive break there will resume larger rise from 1.0351, and target 1.2759 fibonacci level. However, break of 1.2177 minor support will now argue that corrective pattern from 1.2445 is extending with another falling leg, and turn bias to the downside.
In the bigger picture, price action from 1.2445 are seen as a corrective pattern to rise from 1.0351 medium term bottom (2022 low). Resumption is expected as a later stage and firm break of 1.2446 will target 61.8% retracement of 1.4248 (2021 high) to 1.0351 at 1.2759. This will remain the favored case as long as 38.2% retracement of 1.0351 to 1.2445 at 1.1645 holds.
Bitcoin’s Bullish Triangle
Market Picture
Bitcoin has gained 2.6% over the past 24 hours to $28.3K. Meanwhile, demand for other cryptocurrencies was revived as the total crypto market capitalisation rose 3.4% to $1.18 trillion. Ethereum gained 4% overnight, reaching $1800.
Crypto Fear and Greed Index reached 68 (Greed), its highest level since November 2021.
A series of higher local lows is forming on the intraday charts of bitcoin, indicating players’ interest in buying on dips. At the same time, local resistance is almost horizontal.
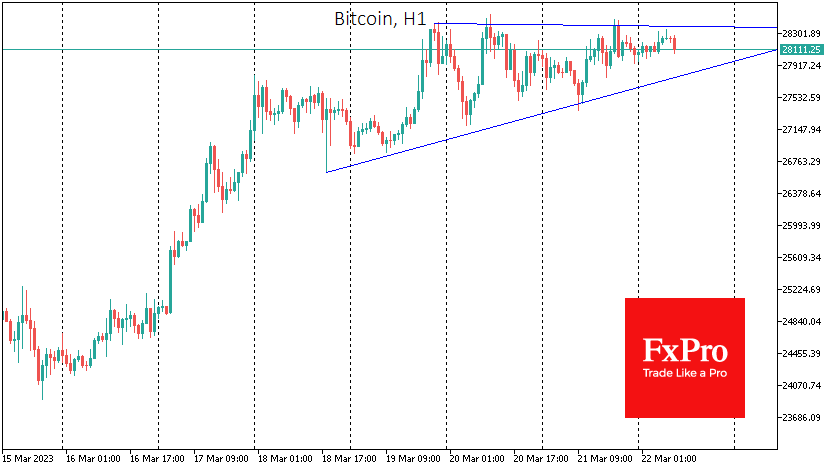
From a tactical perspective, a break above $28.5K could have a dam-breaking effect and quickly take the price to $30K. A break below $27.5K would negate the bullish technical signal and open the way for a deeper correction.
This is likely to be resolved later this evening after the Fed decision. The reaction of all markets could be vital as the range of expectations is incredibly wide.
News Background
The turmoil in the banking system has led to a shift in investors’ perception of safe haven assets. According to Caitlin Long, CEO of Custodia, more and more market participants see bitcoin as such.
Mastercard, a payment giant, has partnered with the Australian stablecoin platform Stables. The partnership will see the issuance of a card that allows direct payment with stablecoins.
Tron founder Justin Sun is willing to pay $1.5 billion for Credit Suisse, one of Europe’s largest investment banks, to “integrate it into the Web3 world”.
USD/JPY Probes Through Key Barrier – Fed Decision Likely to Define Near-Term Direction
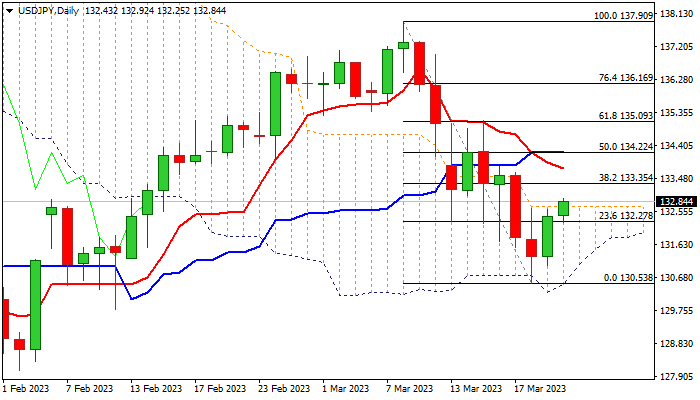
The USDJPY keeps positive tone on Wednesday after bounce by nearly 0.9% on Tuesday revived bulls and generated initial signal of formation of reversal pattern on daily chart, with the notion being supported by strong downside rejection at daily cloud base and a bear-trap at Fibo support at 131.30 (61.8% of 127.22/137.90).
Fresh advance cracks the key barrier at 132.70 (top of daily Ichimoku cloud), but requires firm break here to signal further gains, with violation of next pivot at 133.35 (Fibo 38.2% of 137.90130.53, reinforced by falling 10DMA) to boost bullish signals and confirm reversal.
Daily studies are still mixed (most of moving averages are in bearish configuration and negative momentum is rising, while RSI and stochastic are heading north) lacking clearer near-term direction signal, with focus turning towards Fed.
The FOMC will announce its policy decision later today, following a two-day meeting, with two scenarios being on the table.
Markets expect 25 basis points hike, which will push interest rate to 4.75%/5.00% range and keep the dollar supported, though the situation of increased banking stress may prompt Fed to pause hikes this time, in order not to deepen developing crisis.
If the US central bank surprises by staying on hold in March, the dollar would come under pressure, while fresh bulls are likely to remain in play if Fed delivers widely expected 25 basis points, though markets will also closely watch the signals about Fed’s action in the near future.
Res: 132.92; 133.35; 133.76; 134.22.
Sup: 132.70; 132.27; 131.55; 131.06.