Sample Category Title
Canadian Dollar at Extremums
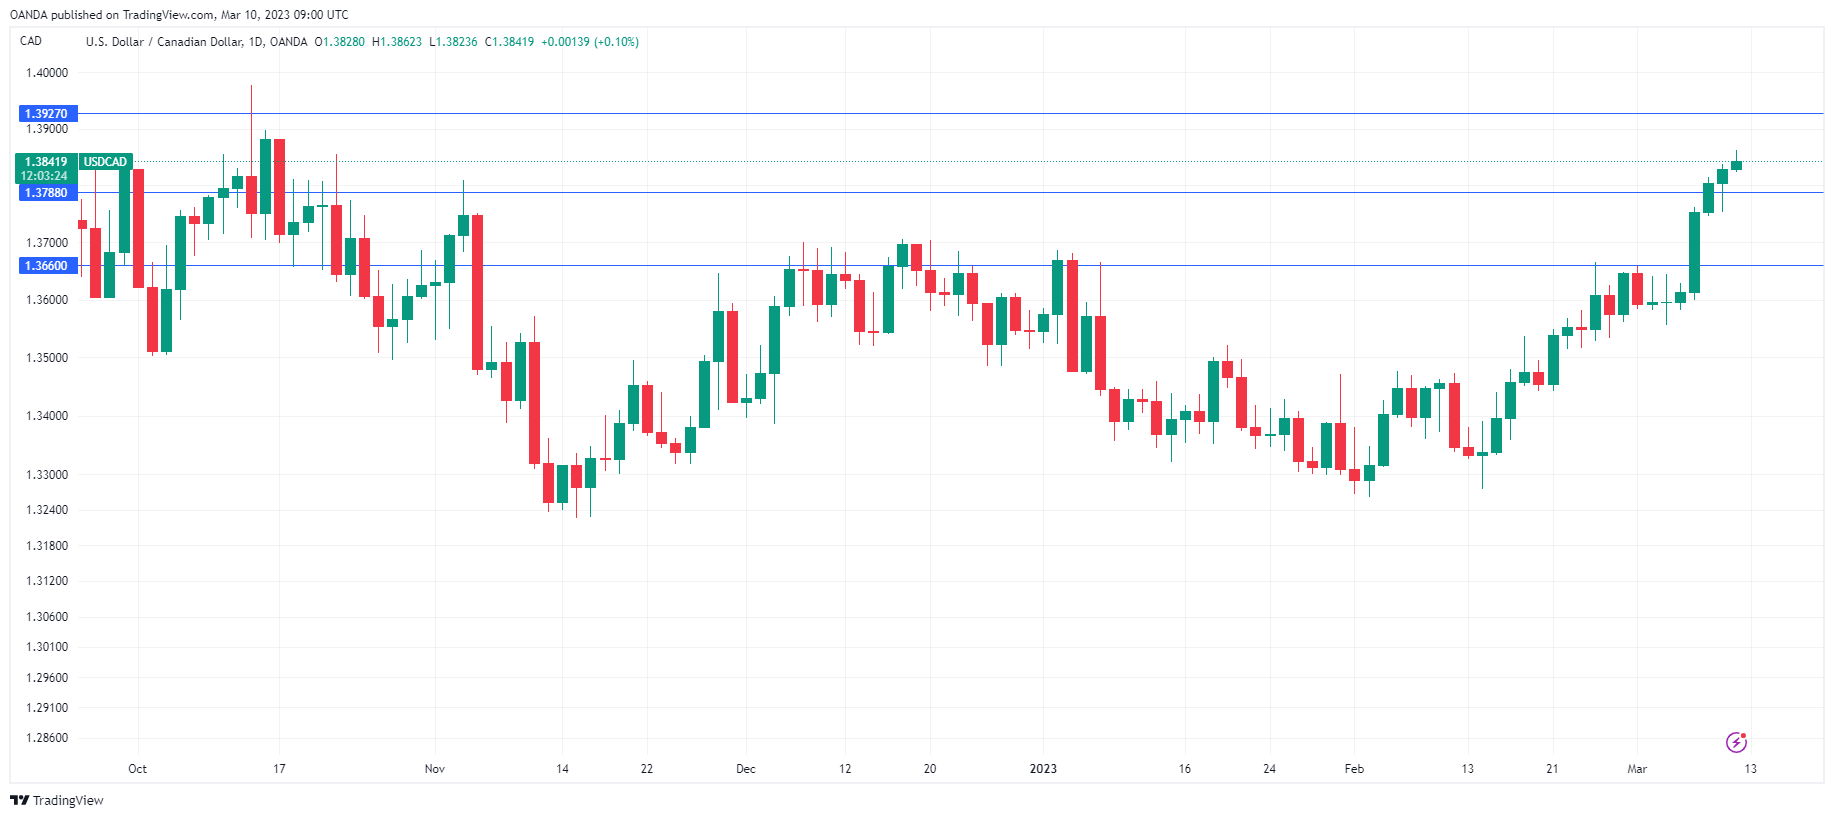
USDCAD has been rallying this week, gaining 1.7% since Tuesday and testing the five-month high of 1.3850. The pair looks vulnerable to both a short-term correction and the potential for a longer-term reversal.
The US Dollar has enjoyed gains after Powell’s hawkish rhetoric forced the markets to consider a 50-point rate hike on 22 March seriously. This is significant because the markets were pricing in 2-3 more 50-point hikes before that. And even earlier in the year, they were already pricing in a rate cut before the end of the year.
Almost simultaneously, the Bank of Canada avoided surprises by leaving its policy rate unchanged, as it had warned in its commentary on the January decision. This starkly contrasts the Fed’s stance, which changed after strong reports on employment and consumer spending inflation.
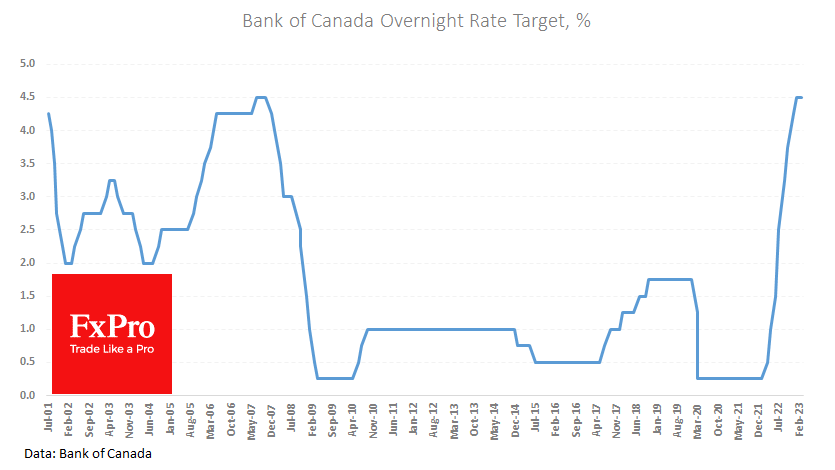
The only change the Bank of Canada decided to make was to warn at the end of the commentary on the decision that further hikes from the current 4.5% were possible. Canada’s reluctance is easy to understand as it has only been at the current rate since 2001, from July to October 2007, when it was cut to 0.25%.
The acceleration of rate hikes in the US and the pause after the slowdown in Canada is a major driver for the USD against the CAD. This difference promises to be unprecedented in modern history, with the G7 central banks acting almost in sync and moving in the same direction.
The divergence may exist only in the minds of currency speculators, not central bankers. Powell’s speech contained the typical caveats used by the Fed since Greenspan, leaving the door open for future action. The actual actions of the US and Canadian central banks have been at least in the same direction, if not identical.
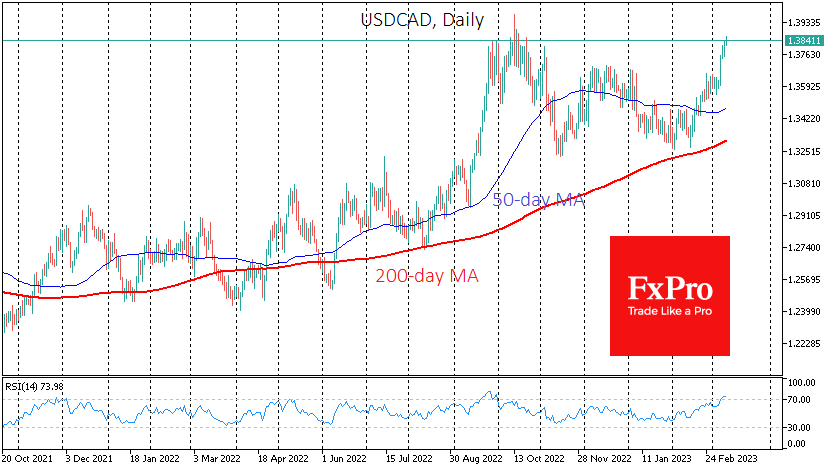
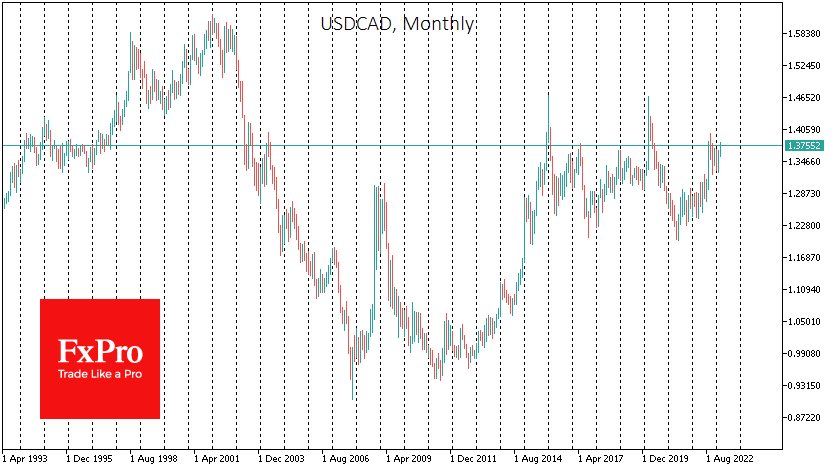
The USDCAD has reached overbought territory in the currency market on the daily RSI. The exchange rate has now reached levels where selling intensified in October and November last year. The pair have not traded consistently above 1.40 in the past 20 years. Short rallies have only been associated with periods of extreme market volatility and plunging oil prices, which is not the case here.
A pullback from current levels means the pair could slide as low as 1.36, completely erasing the latest growth impulse. However, it is unlikely that the pair will stop there, as it will be a move from the top of the multi-year trading range to its bottom around 1.20–1.25.
Canadian Dollar Eyes US, Canadian Job Reports
The Canadian dollar continues to sag and has dropped 1.9% this week. Hold onto your hats, as we could have some further volatility from USD/CAD in the North American session, with the release of the US and Canadian employment reports.
All eyes on NFP
The highlight of the day is the US nonfarm payrolls report, which is expected to head back to earth after a blowout gain of 517,000 in January. The consensus for February stands at 205,000 and a wide miss of this figure on either side will likely shake up the US dollar. A weak reading would fuel speculation of a Fed pivot and likely weigh on the US dollar, while a strong figure would support the Fed’s hawkish stance and should be bullish for the greenback.
The ADP payroll report, which precedes the nonfarm payroll release, improved to 242,000, up from an upwardly revised 119,000 and above the estimate of 200,000. The ADP reading is not considered all that reliable at forecasting the nonfarm payrolls report so I wouldn’t read too much into it. Still, the US labour market remains strong despite the Fed’s tightening, and I would not be surprised to see nonfarm payrolls follow the ADP’s lead and beat the estimate.
In addition to nonfarm payrolls, the Fed will also be keeping a close eye on wage growth. Average hourly earnings is expected to rise to 4.7% y/y in February, up from 4.4% y/y in January. The Fed is focussed on lowering inflation and an acceleration in wage growth could prompt the Fed to be more aggressive with its pace of rate increases.
Canada also recorded a sharp gain in new jobs in January, with a reading of 150,000, up from 104,000 prior. The markets are braced for a small gain of 10,000 in February, and a soft print of 5,000 or lower would likely weigh on the Canadian dollar. The unemployment rate is expected to tick up to 5.1%, up from 5.0%.
USD/CAD Technical
- There is support at 1.3787 and 1.3660
- 1.3927 and 1.4190 are the next resistance lines
Yen Slips after BoJ Maintains Policy Settings, US Nonfarm Payrolls Loom
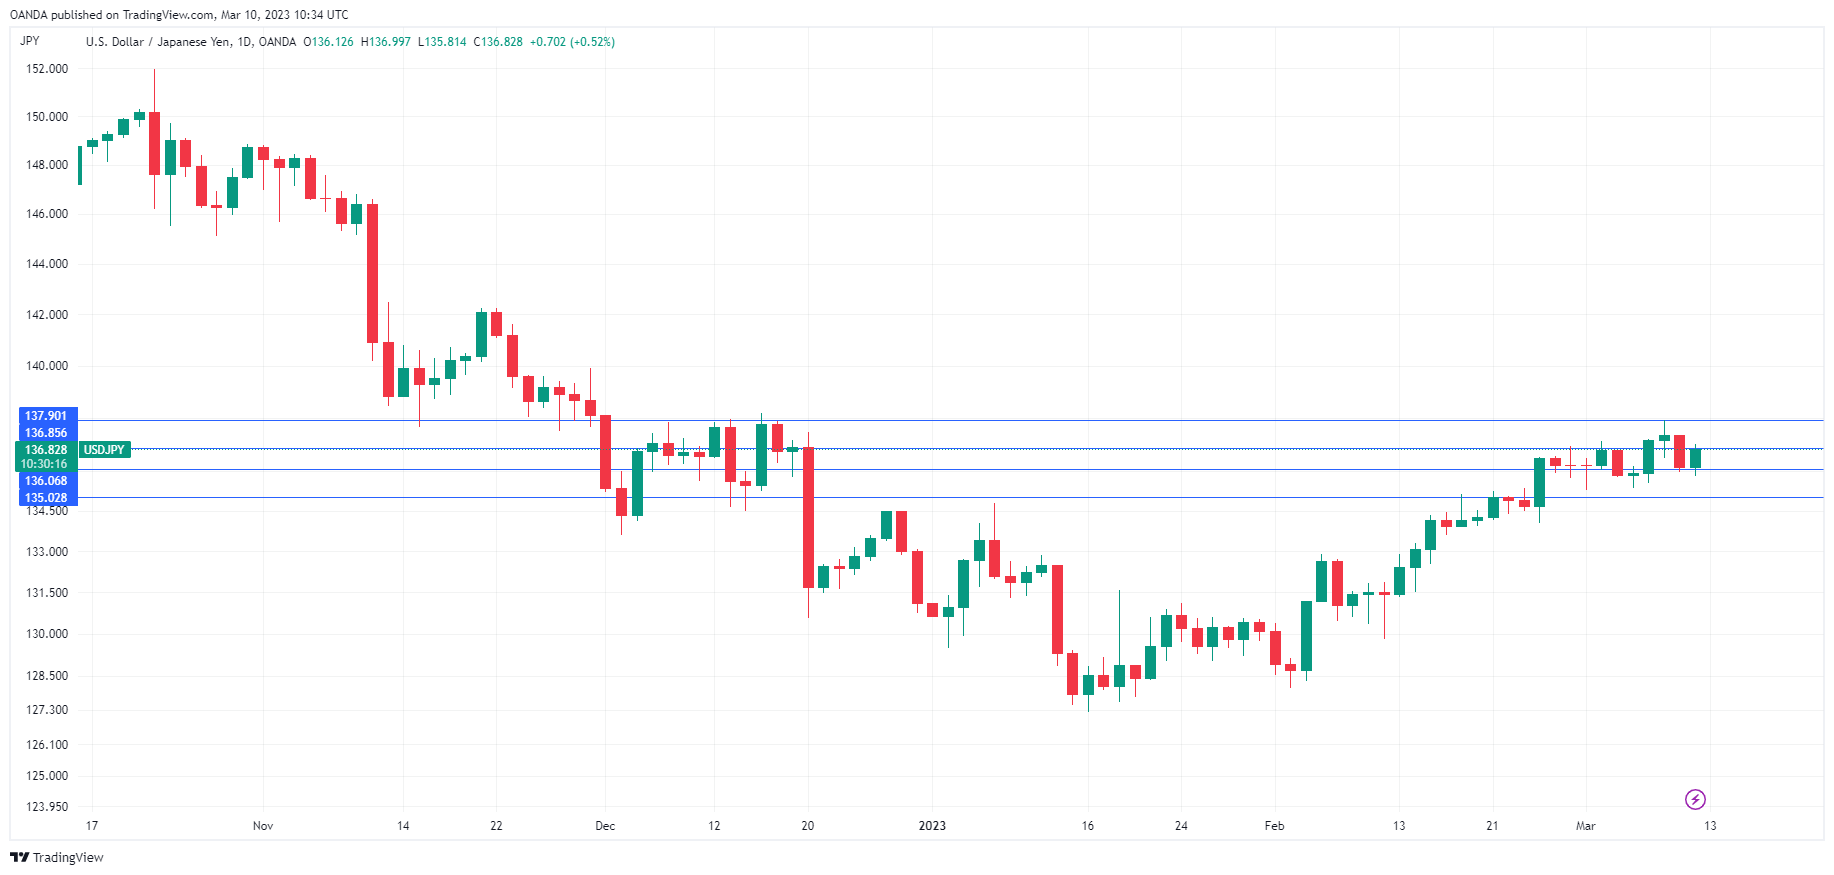
The Japanese yen is trading at 1.36.83 in the European session, down 0.52%. USD/JPY fell 0.90% on Thursday but has recovered much of those losses today.
Kuroda exits with a whimper
Bank of Japan Governor Kuroda didn’t fire any final shots at his final meeting today. The BoJ maintained interest rates at -0.1%, where they have been pegged since 2016, and didn’t make any changes to its to yield curve control (YCC) policy. Traditionally, BoJ governors do not make waves at their final meeting, but there was an outside chance that Kuroda might buck the trend. Kuroda has surprised the markets in the past, most notably when he widened the yield curve band in December and jolted the markets. This time, Kuroda stayed on the sidelines and the yen responded with losses as some investors were disappointed that he didn’t tweak the YCC.
Kazuo Ueda takes over as BoJ Governor next month, and there is growing speculation that Ueda will change forward guidance and tweak or even abandon YCC, as distortions in the yield curve are damaging the bond markets. Ueda may not press the trigger when he chairs his first meeting in April but is expected to shift policy in the coming months.
The US releases its February employment report, highlighted by nonfarm payrolls, later today. The blowout January reading of 517,000 is widely seen as a blip, although the labour market remains surprisingly resilient, despite the bite of rising interest rates. The estimate for February stands at 205,000 and a wide miss of this figure on either side will likely shake up the US dollar. A weak reading would fuel speculation of a Fed pivot and likely weigh on the US dollar, while a strong figure would support the Fed’s hawkish stance and should be bullish for the greenback.
The Fed will also be keeping a close eye on wage growth, in addition to nonfarm payrolls. Average hourly earnings are expected to rise to 4.7% y/y in February, up from 4.4% y/y in January. Higher wages drive inflation higher and an acceleration in wage growth would complicate the Fed’s battle to curb inflation.
USD/JPY Technical
- 136.06 is under pressure in support. 13502 is next
- 136.86 and 1.37.90 are the next resistance lines
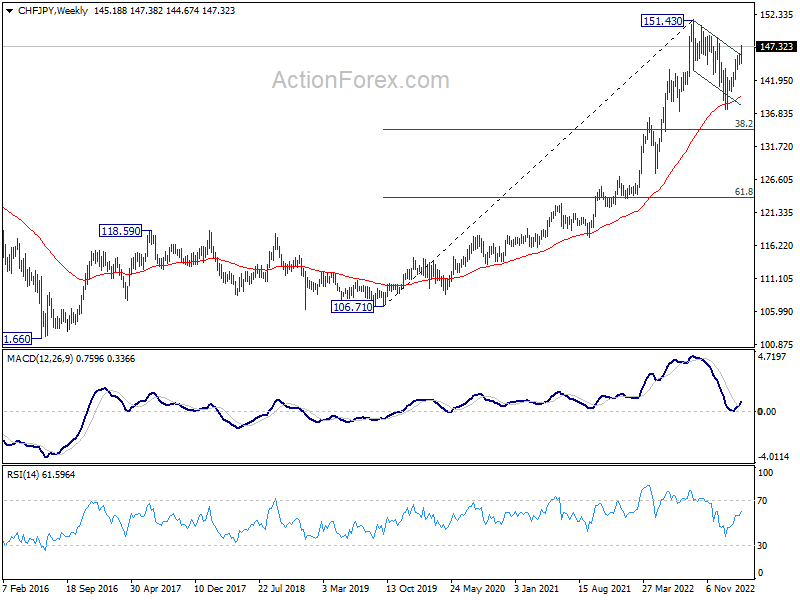
CHF/JPY powers through channel resistance on strong Franc
Swiss Franc is surprisingly the strongest one for the week for now, ahead of NFP. In the background, expectations for another 50bps rate hike by SNB on March 23 solidified after data earlier this week showed consumer inflation reaccelerated in February. Tightening could also continue in June if high inflation persists.
Additional boost was seen as on safe haven flow after the US stock markets tumbled overnight while risk off sentiment carried on today. Besides, steep decline in US and European benchmark treasury yields also helped.
On the other hand, Yen is pressured after BoJ left monetary policy unchanged, and indicated it's in no rush to alter the ultra-loose stance.
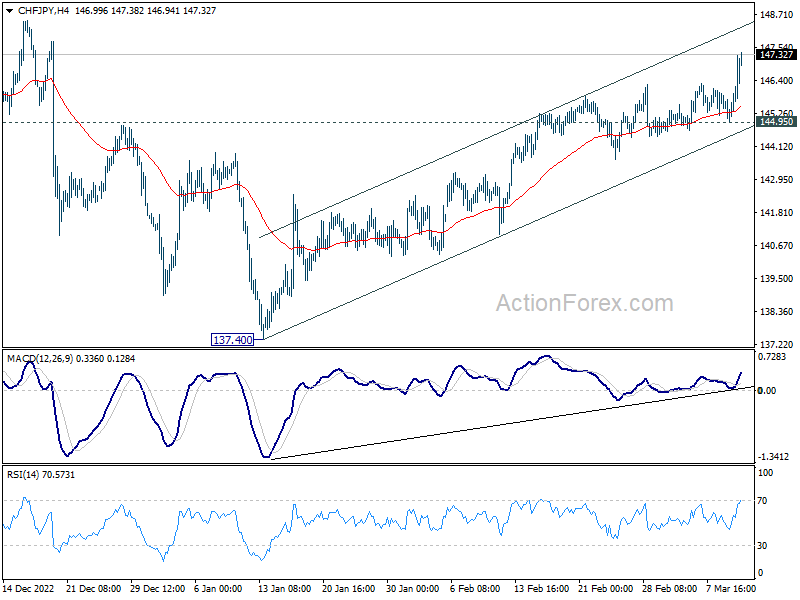
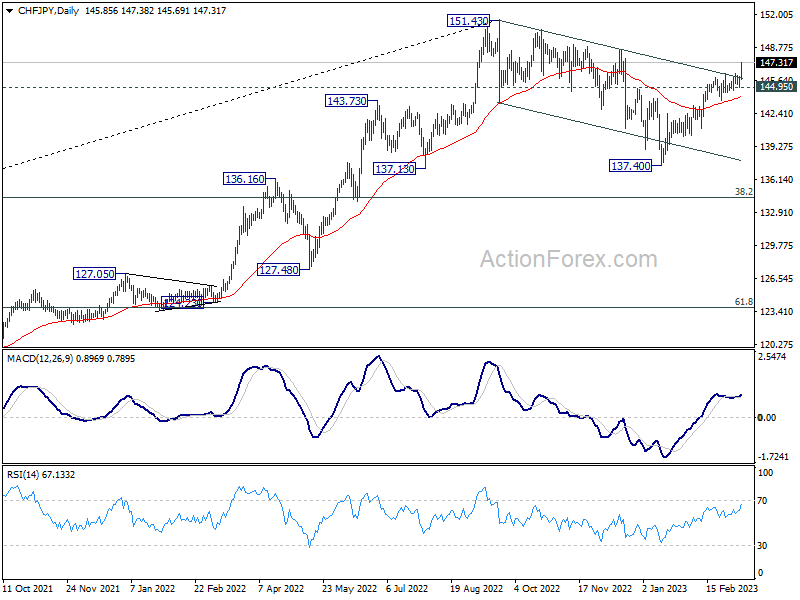
CHF/JPY finally break through the medium term channel resistance with some conviction today, and hit as high as 145.69. The development affirms the case that correction from 151.43 has completed at 137.40 already after drawing support from 55 week EMA. , Larger up trend is probably ready to resume. For the near term, outlook will stay bullish as long as 144.95 support holds. Retest of 151.43 high should be seen next.
EUR/USD: Technical Studies Warn of Fresh Weakness But US Jobs Data Seen as a Key Driver
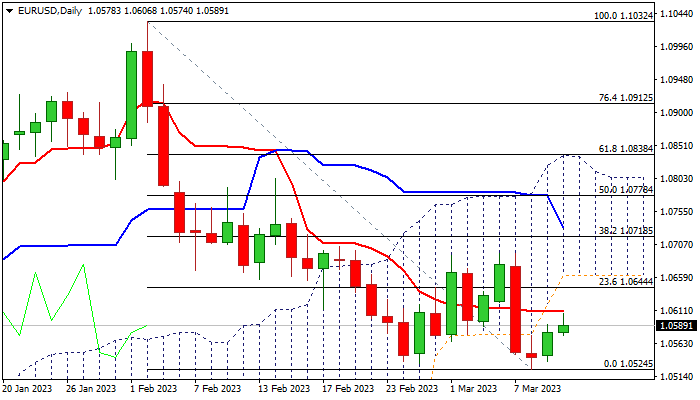
The Euro remains at the front foot in European session on Friday and extends recovery into second straight day, retracing almost 50% of post Powell’s sharp fall.
Bounce from Wednesday’s two-month low (1.0524) is struggling at the first obstacle at 1.0609 (daily Tenkan-sen), as daily studies are still weak (momentum remain negative, price action stays below thick daily cloud) warning that fresh bulls may run out of steam and keeping the downside vulnerable.
Fundamentals are again going to be the key driver and markets await release of US February jobs data for fresh direction signals.
The latest hawkish comments from Fed Chair Powell, who said that policy tightening cycle is likely to extend and push interest rates beyond initial estimations, with possible acceleration of the pace of rate hikes, in efforts to bring stubbornly high inflation under control, put the euro under increased pressure as traders increased dollar longs on expectations of further rise of the borrowing cost.
US non-farm payrolls data are in focus as the second key event this week, as markets look for more evidence about the situation in the US labor market, one of crucial factors which will influence Fed’s decisions in the near future.
Markets were a bit concerned after US weekly jobless claims rose last week, seeing possibility that this may not be just isolated case, but initial signal that the US labor sector started to weaken.
If NFP (Feb f/c 205K vs Jan 517K) come above expectations, this will be positive signal for the dollar and bring the single currency under fresh pressure, risking test of key support at 1.0460 (Fibo 38.2% of 0.9535/1.1032 / 55WMA).
Conversely, disappointing NFP numbers would spark fresh bullish acceleration and lift the EURUSD pair through pivotal barriers at 1.0661/94 (daily Ichimoku cloud base / early Mar lower platform).
Res: 1.0609; 1.0644; 1.0661; 1.0694.
Sup: 1.0574; 1.0546; 1.0524; 1.0483.
NZD/USD: Decline in the Final Impulse of the Zigzag Ⓑ
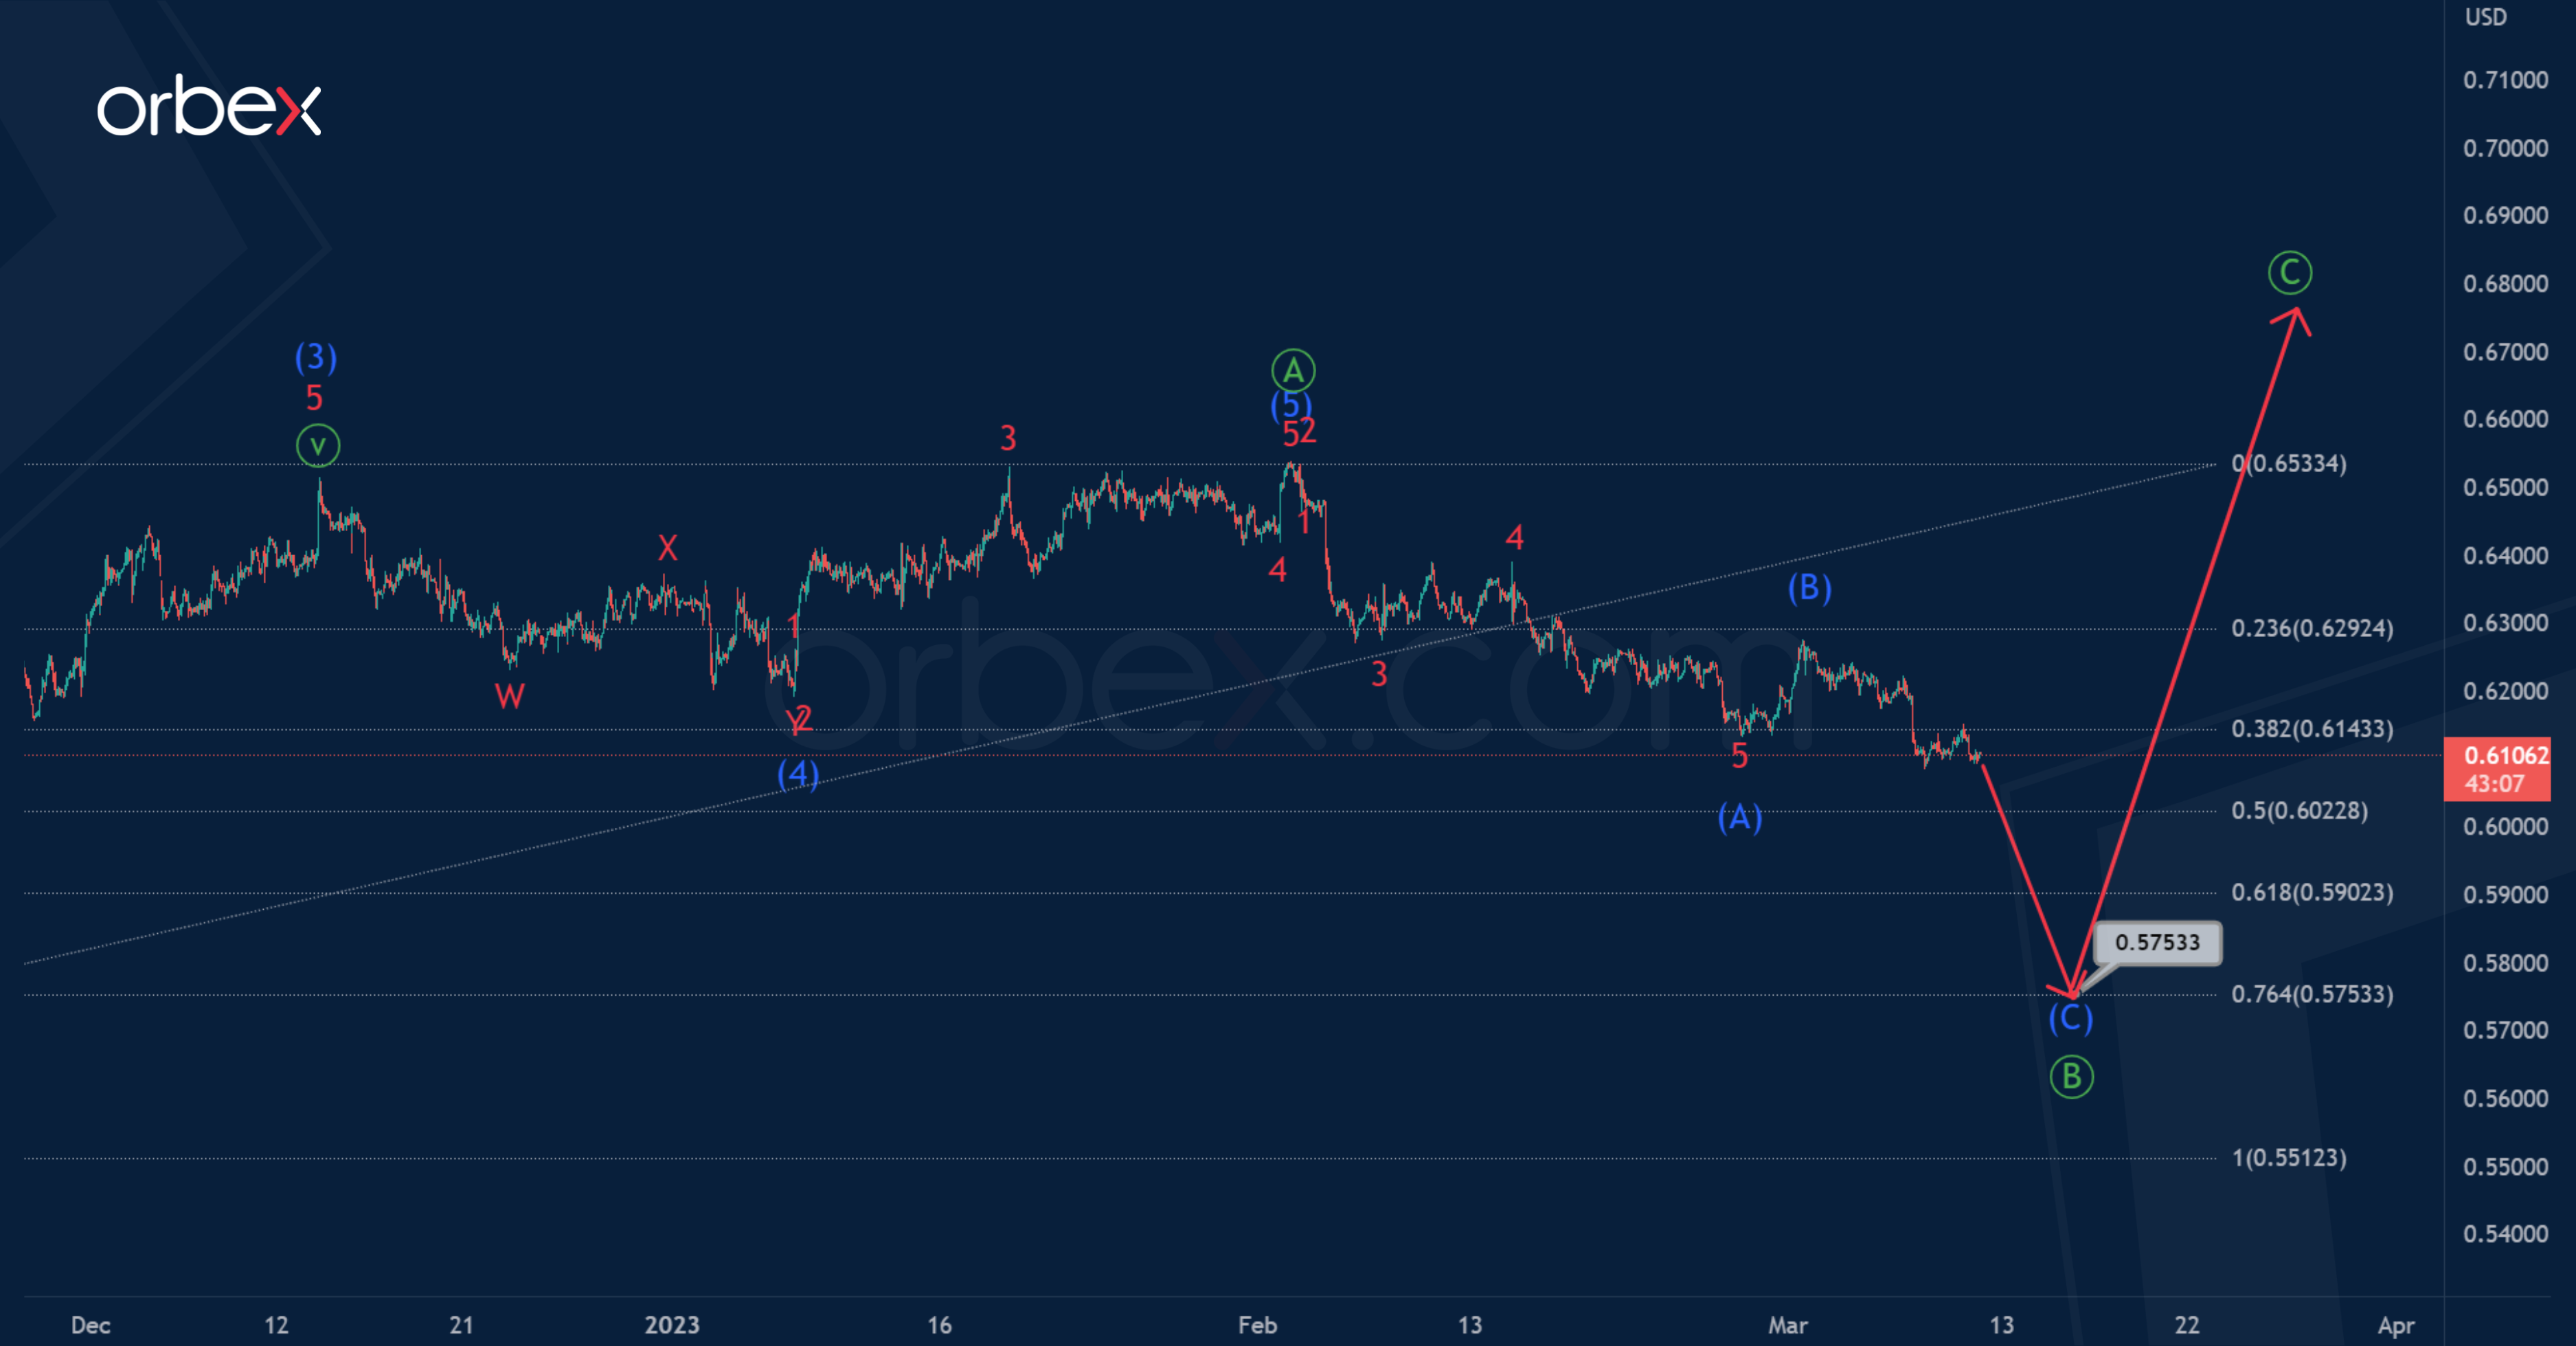
The NZDUSD currency pair may form a correction zigzag pattern Ⓐ-Ⓑ-Ⓒ in the long term.
The first impulse wave Ⓐ is completed. A bearish correction Ⓑ is under development, the internal structure of which is similar to a zigzag (A)-(B)-(C). The impulse (A) and correction (B) can be considered successfully completed.
In the near future, the price may drop in the intermediate impulse (C) to 0.575. At that level, primary correction will be at 76.4% of actionary wave Ⓐ.
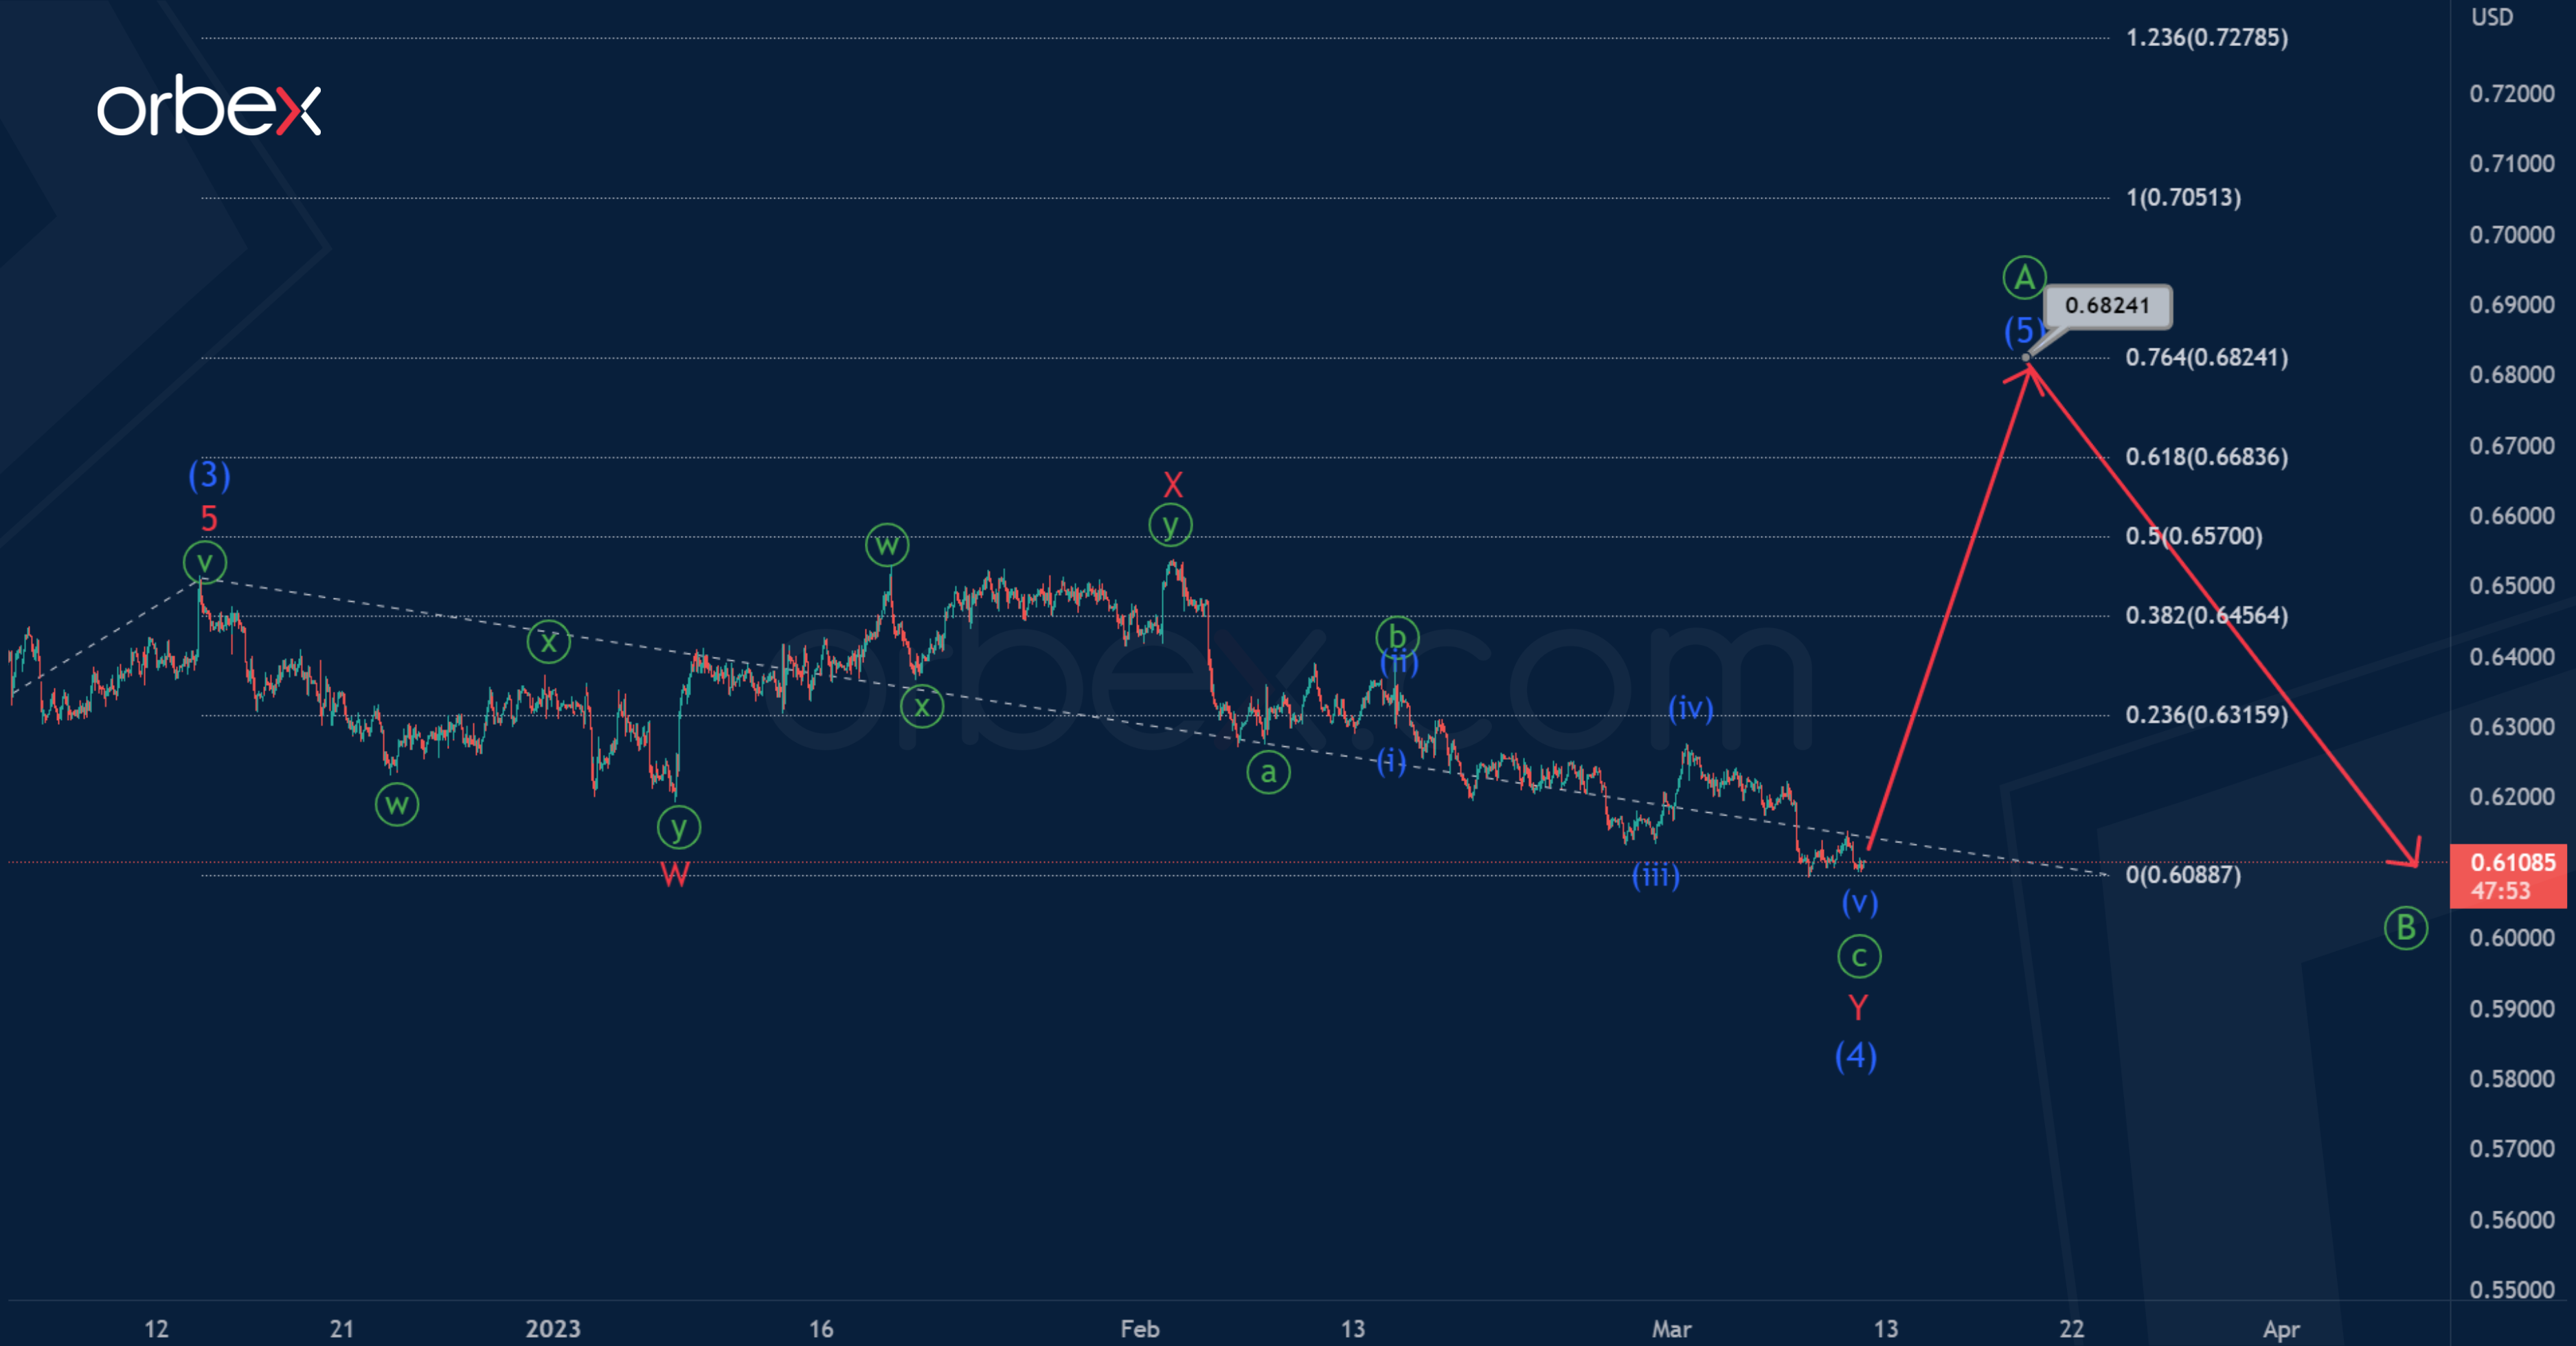
However, the primary wave Ⓐ may continue its development, and end slightly higher than in the main version. It is an intermediate impulse (1)-(2)-(3)-(4)-(5).
It seems that the correction wave (4) has come to an end, it has an internal structure of a double zigzag.
If this scenario is confirmed, market participants will see bullish growth in the intermediate wave (5), approximately to 0.682. At that level, wave (5) will be at 76.4% of impulse (3).
AUDUSD in a Bearish Configuration
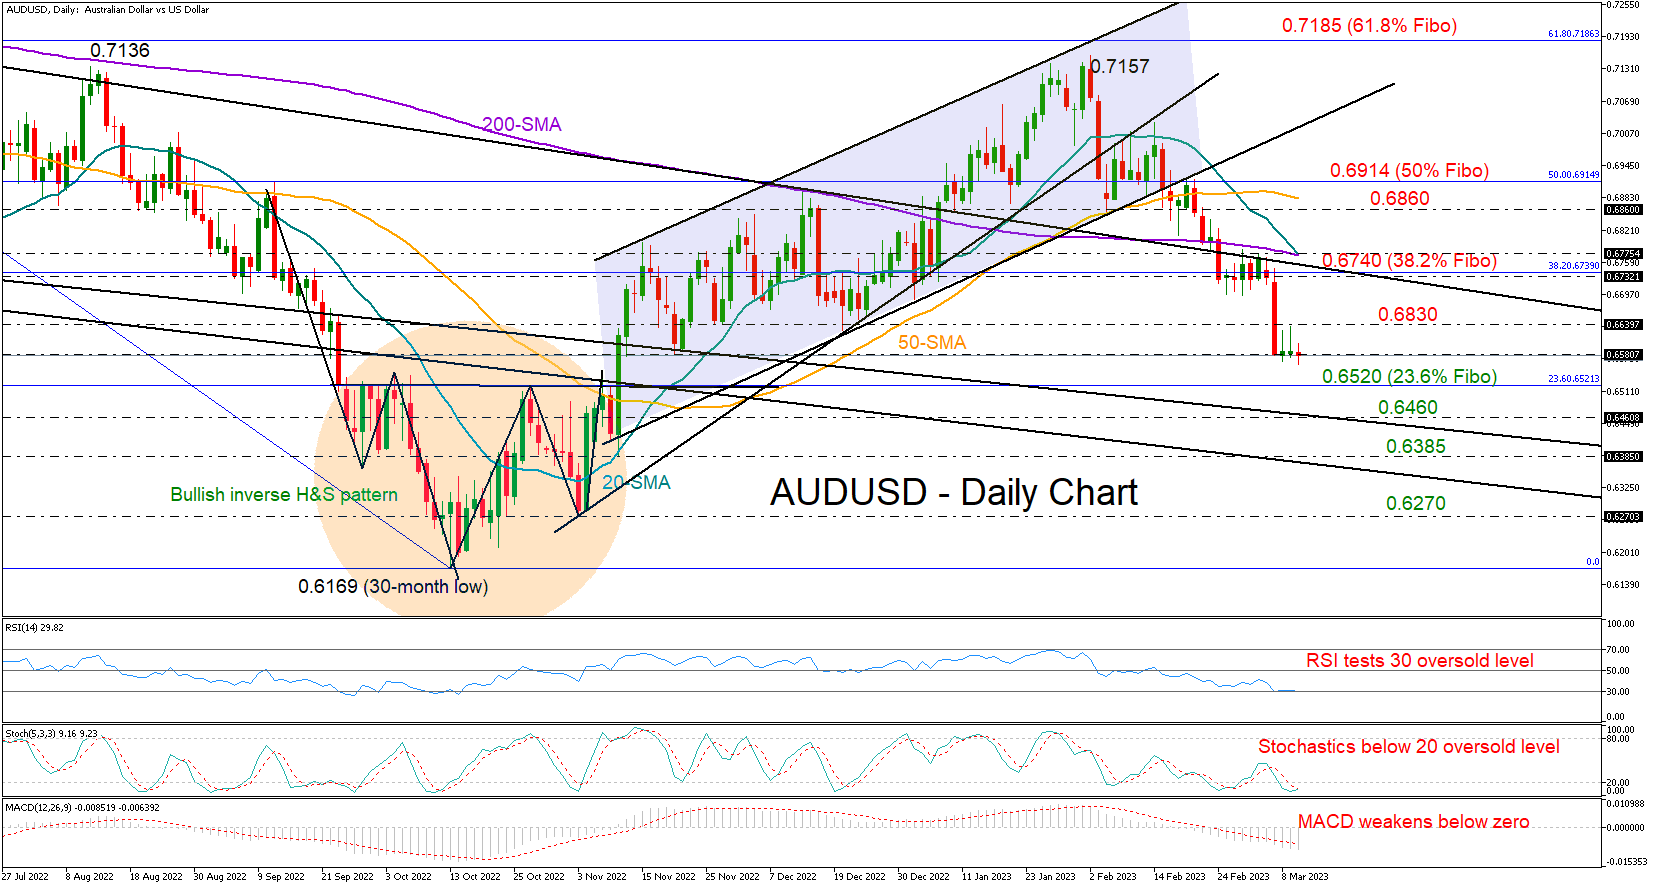
AUDUSD has been in a tight range, unable to recover from Tuesday's crash to 0.6579, and this continues to push the pair, on a weekly basis, back to the red zone.
The sharp shorting emerged after the strong rejection near the descending trendline drawn from May 2021, though an upside reversal might be underway as the RSI and the stochastic oscillator are currently flirting with oversold levels. Yet, as long as the indicators hover within the bearish area, downside corrections are more likely than upside ones in the coming sessions. Note that the MACD remains dipped in the negative area as well, while the 20-day simple moving average (SMA) is set to cross below the 200-day SMA following the drop below the 50-day SMA.
Another negative correction could bring the significant area of 0.6520 that caused the rise to 0.7157 under the spotlight. A step beneath that threshold, where the 23.6% Fibonacci retracement of the 0.7660-0.6169 downtrend is also placed, could press the price towards the two support trendlines from August 2021 at 0.6460 and 0.6368 respectively. If the latter gives way, the selloff may speed up to 0.6270.
On the upside, the 0.6630 region has been capping bullish actions over the past two days. Therefore, a move above that zone could send the price towards the 38.2% Fibonacci of 0.6740. The 20- and 200-day SMAs may cement that ceiling, preventing an advance to the 0.6860 handle. The 50% Fibonacci level of 0.6914 could be the next target.
All in all, AUDUSD has not escaped the latest downward pattern, eyeing additional losses to 0.6520. Still, with the price currently trading near oversold levels, an upside correction cannot be ruled out.
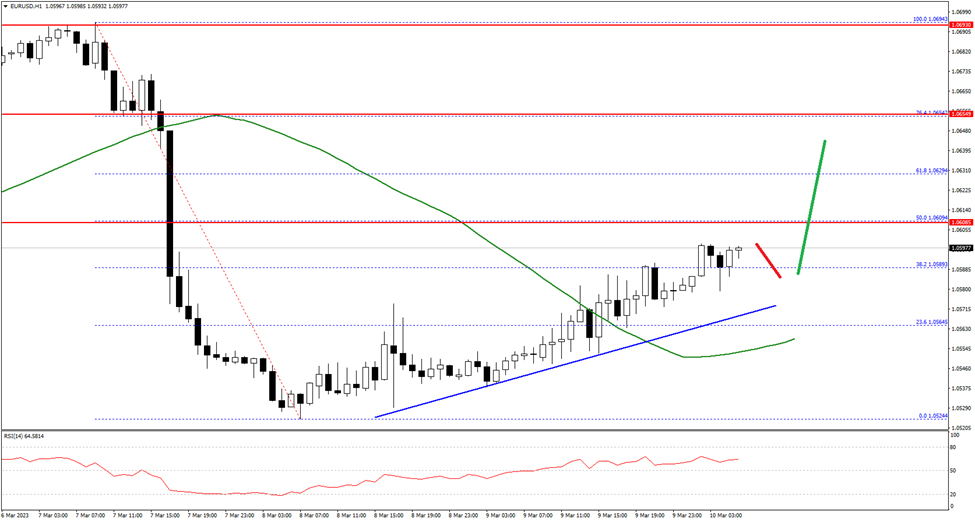
EUR/USD Pair is Correcting Losses With Resistance Near 1.0600
The Euro started a fresh decline from the 1.0700 zone against the US Dollar. The EUR/USD pair traded below the 1.0620 level to move into a bearish zone.
The pair even traded below the 1.0600 level and the 50 hourly simple moving average. The bears pushed the pair below 1.0550 and low is formed near 1.0524. It is now correcting losses, with an immediate resistance near the 1.0600 level.
The first major resistance is near the 1.0610 level. A break above the 1.0610 resistance level could start another increase. In the stated case, it could rise towards the 1.0650 resistance.
Conversely, the pair might resume its decline below 1.0575 and a bullish trend line on the hourly chart. The next key support is near 1.0550 on FXOpen, below the pair could drop towards the 1.0525 level. Any more losses might send the pair towards the 1.0500 level in the near term.
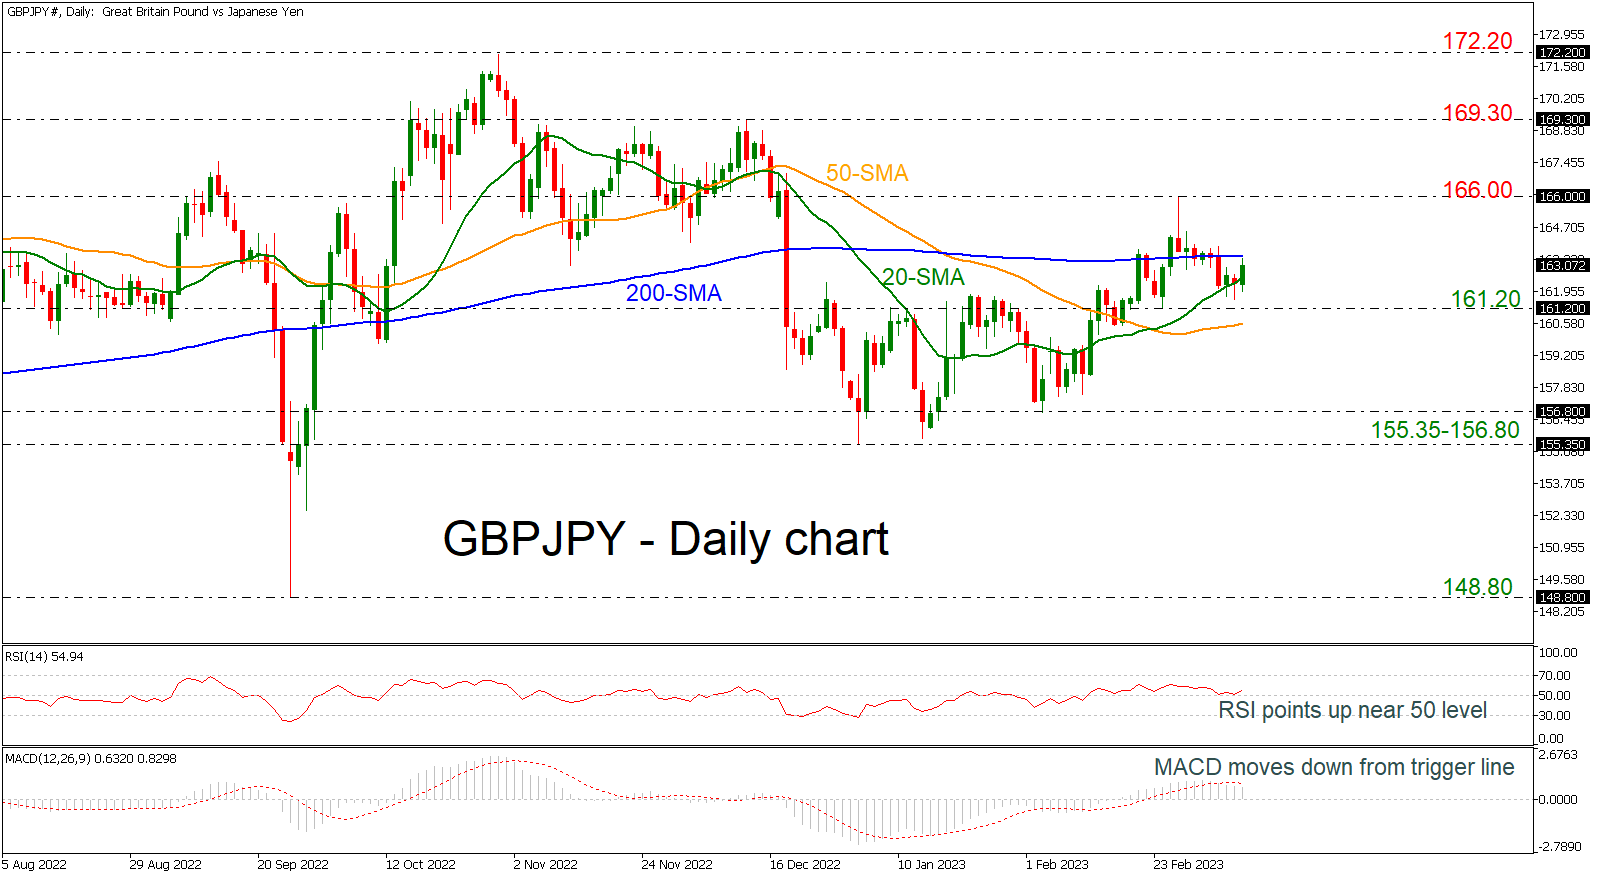
GBPJPY Meets 200-day SMA and Tries to Move North
GBPJPY is advancing above the 163.00 round number and is approaching the flat 200-day simple moving average (SMA) at 163.50. A closing day above the latter level could endorse a bullish bias in the near-term timeframe. The RSI indicator is pointing slightly up, while the MACD is holding beneath its trigger line in the positive region.
Hence, the short-run risk is looking neutral-to-positive at the moment and another retest of the 166.00 barrier is likely. Particularly, a decisive close above 166.00 might be what the bulls are eagerly waiting for to rally towards the 169.30 resistance.
To the downside, the 20-day SMA at the162.50 nearby support area may add some footing to the market, but a violation at this point may not attract much attention unless the price slumps below the 161.20 line and the 50-day SMA at 160.50. Negative momentum could further strengthen if the aforementioned level is breached as well, with the 155.35-156.80 restrictive zone likely appearing next on the radar.
In brief, GBPJPY could trade neutral-to-positive in the short-term. A closure above the 200-day SMA could bring fresh buying pressure into the market.
S&P 500 Turns Lower
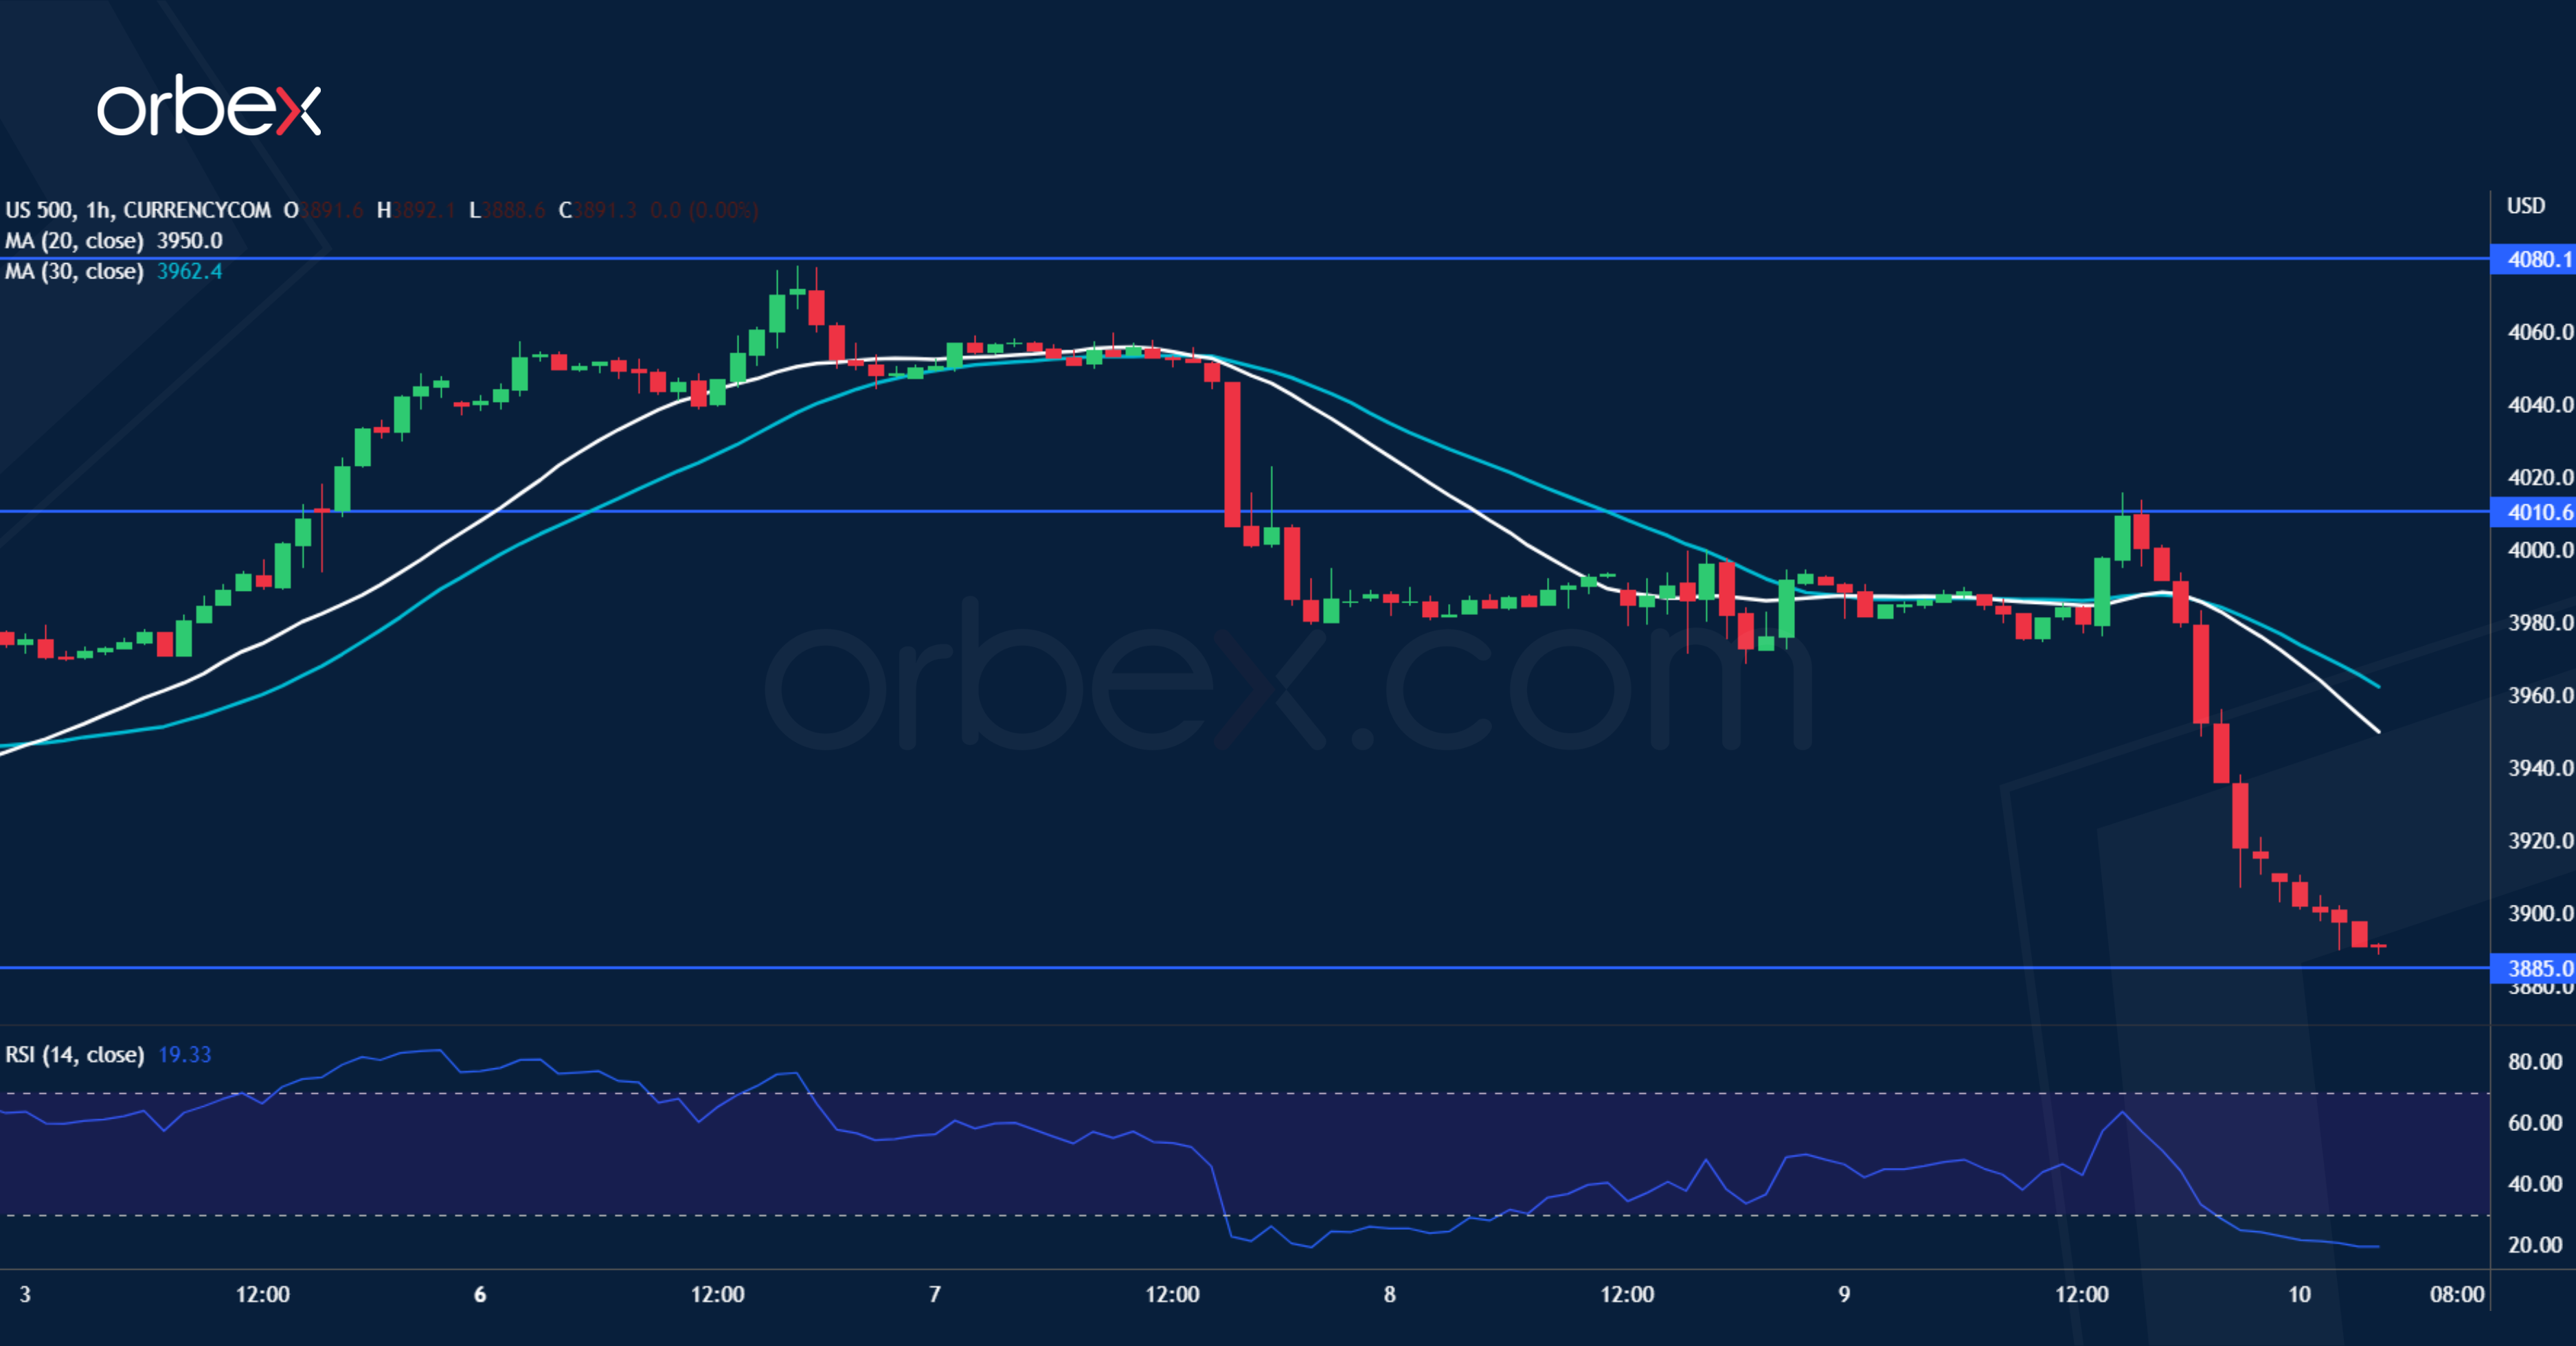
The S&P 500 fell as traders fret a solid jobs report would confirm the Fed’s hawkish stance. The index is at a crossroads on the daily chart as it goes sideways between 3900 and 4180. A failure to lift offers in the supply zone around 4080 indicates that the downward pressure still lingers in the wake of the February sell-off. A drop below 3970 signals that the path of least resistance is down and the daily support of 3885 is a critical floor to prevent a deeper correction to December’s lows near 3770. On the upside, 4010 is the first hurdle.