Sample Category Title
GBP/USD Daily Outlook
Daily Pivots: (S1) 1.1857; (P) 1.1898; (R1) 1.1964; More...
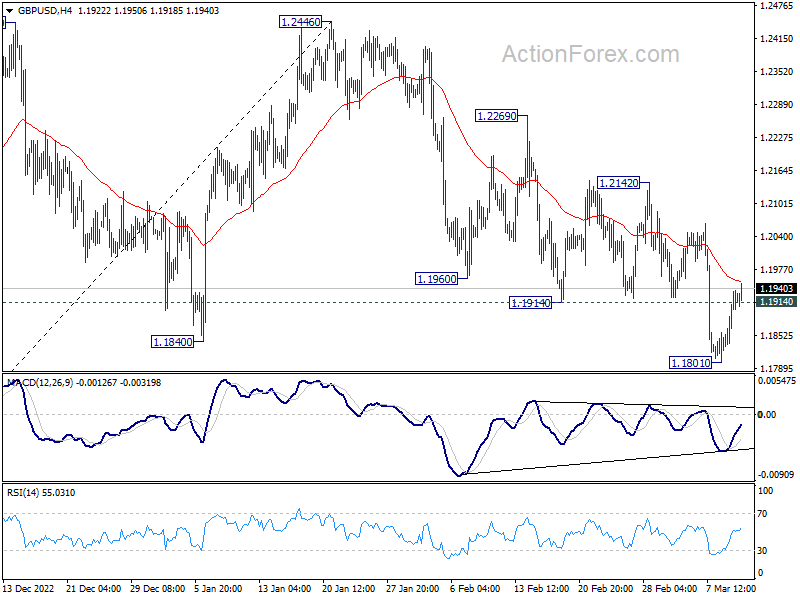
GBP/USD's break of 1.1914 support turned resistance indicates short term bottoming at 1.1801, after breaching 1.1840 support. Intraday bias is back on the upside for 55 day EMA (now at 1.2052). Sustained break there will bring retest of 1.2446 high. On the downside, however, break of 1.1801 will resume the decline to 38.2% retracement of 1.0351 to 1.2446 at 1.1646.
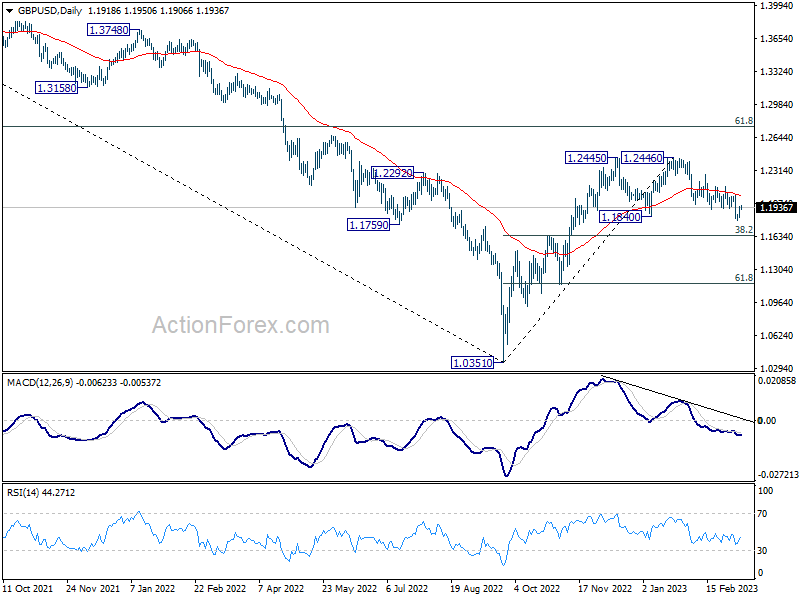
In the bigger picture, the failure to sustain below 1.1840 support argues that price actions from 1.2445 are merely a consolidation pattern. That is rise from 1.0351 is not over yet. Break of 1.2446 will target 61.8% retracement of 1.4248 (2021 high) to 1.0351 at 1.2759. However, decisive break of 1.1840 will bring deeper correction to 38.2% retracement of 1.0351 to 1.2446 at 1.1646, or even further to 61.8% retracement at 1.1151.
USD/CHF Daily Outlook
Daily Pivots: (S1) 0.9291; (P) 0.9359; (R1) 0.9395; More...
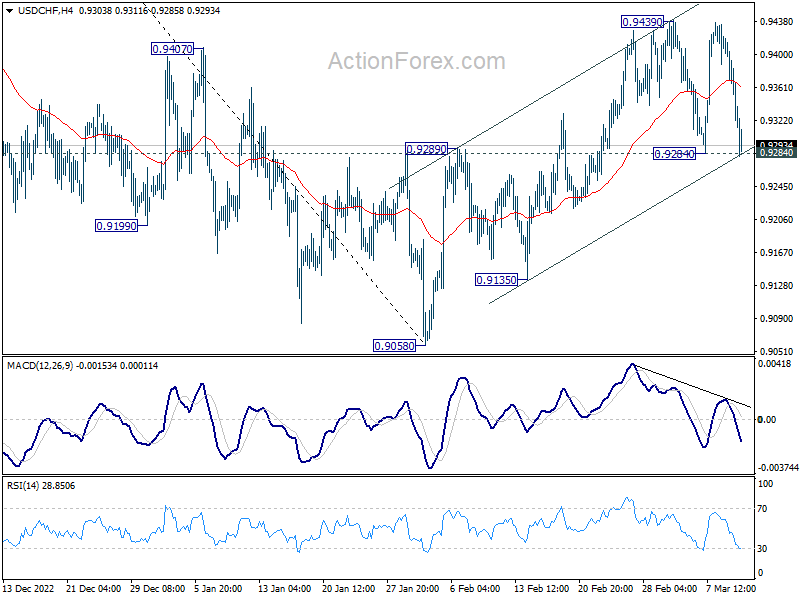
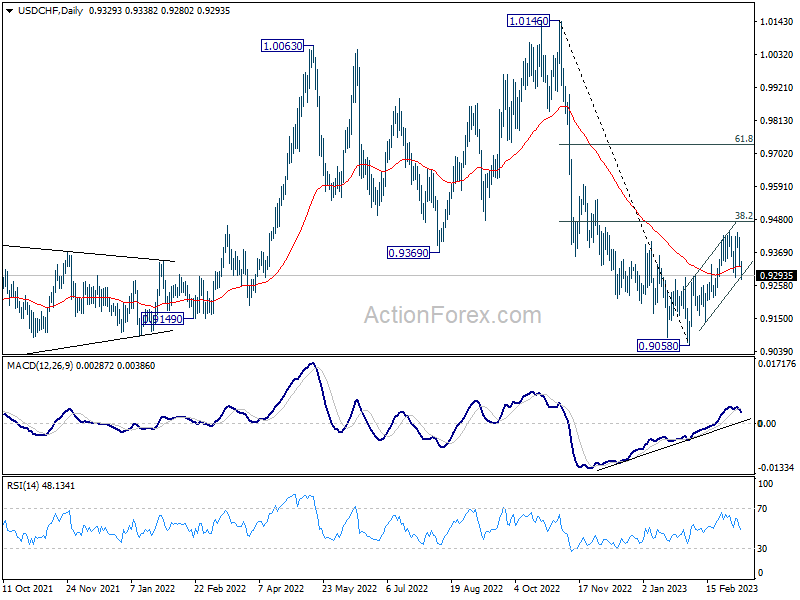
Intraday bias in USD/CHF remains neutral first. ON the downside, firm break of 0.9284 support will argue that rebound from 0.9058 has completed, and turn bias back to the downside for retesting this low. Nevertheless, strong rebound from current level, followed by break of 0.9439 will target 38.2% retracement of 1.0146 to 0.9058 at 0.9474.
In the bigger picture, decline from 1.0146 is seen as part of a long term sideway pattern. As long as 38.2% retracement of 1.0146 to 0.9058 at 0.9474 holds, another fall is in favor through 0.9058. However, sustained trading above 0.9474 will indicate that the medium term trend has reversed, and open up further rally to 61.8% retracement at 0.9730 and above.
USD/JPY Daily Outlook
Daily Pivots: (S1) 135.61; (P) 136.49; (R1) 137.04; More...
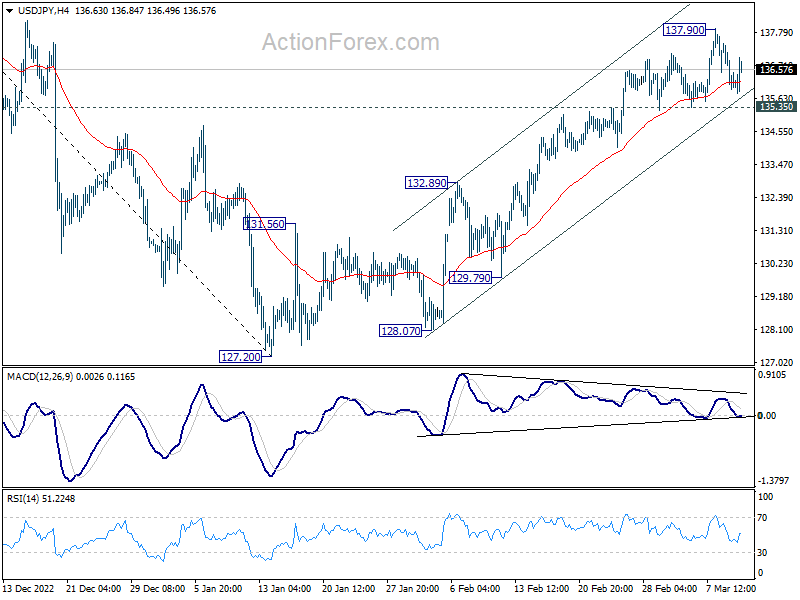
USD/JPY is staying in consolidation from 137.90 and intraday bias remains neutral. Further rally is expected as long as 135.35 support holds. Break of 137.90 will resume the rally from 127.20 to next fibonacci level at 142.48. However, break of 135.35 will bring deeper pull back to 55 day EMA (now at 134.36) instead.
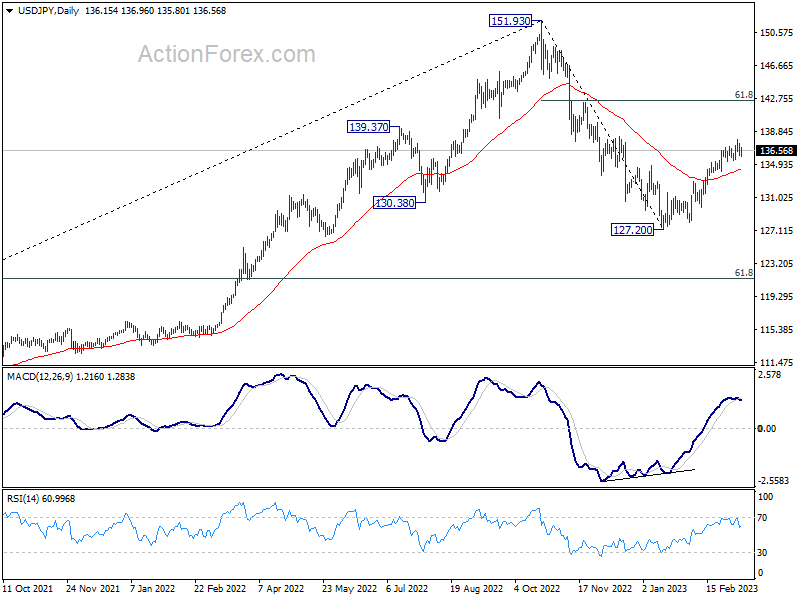
In the bigger picture, the break of 38.2% retracement of 151.93 to 127.20 at 136.64 suggests that whole down trend from 151.93 has completed at 127.20 already. Tentatively, rise from 127.20 is seen as the second leg the medium term pattern from 151.93. Further rally is expected to 61.8% retracement at 142.48. This will now remain the favored case as long as 55 day EMA (now at 134.10) holds.
AUD/USD Daily Report
Daily Pivots: (S1) 0.6565; (P) 0.6601; (R1) 0.6625; More...
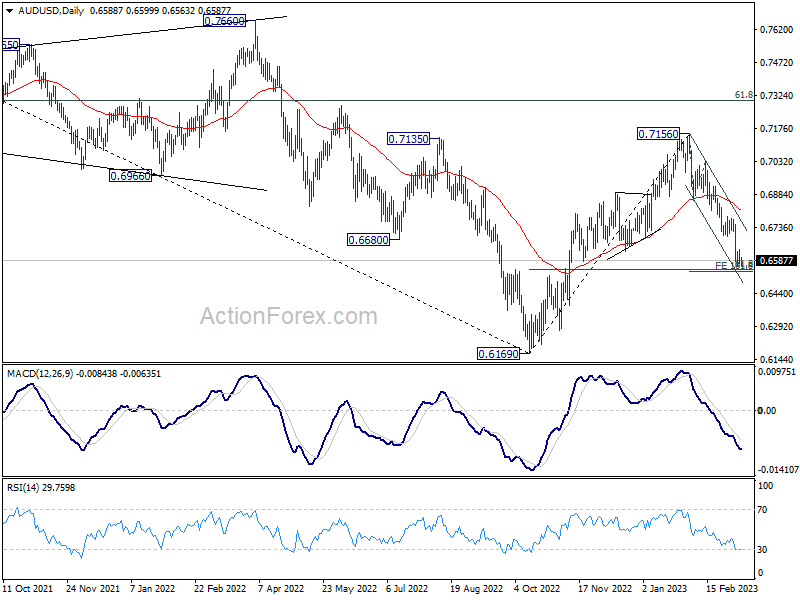
Intraday bias in AUD/USD remains neutral at this point. On the upside, break of 0.6694 support turned resistance will indicate short term bottoming, and turn bias back to the upside for rebound to 55 day EMA (now at 0.6809). However, sustained break of 161.8% projection of of 0.6854 to 0.7028 from 0.6854 at 0.6539 will carry larger bearish implication and target 0.6169 low again.
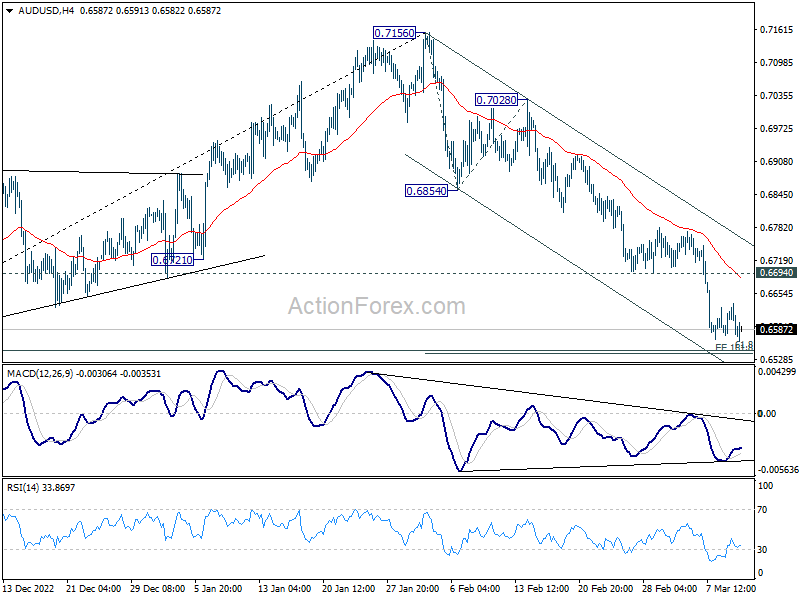
In the bigger picture, rise from 0.6169 (2022 low) has completed at 0.7156, after rejection by 55 month EMA (now at 0.7164). Deeper decline would then be see back to 61.8% retracement of 0.6169 to 0.7156 at 0.6546, even as a corrective fall. Sustained break there will raise the chance of long term down trend resumption through 0.6169 low.
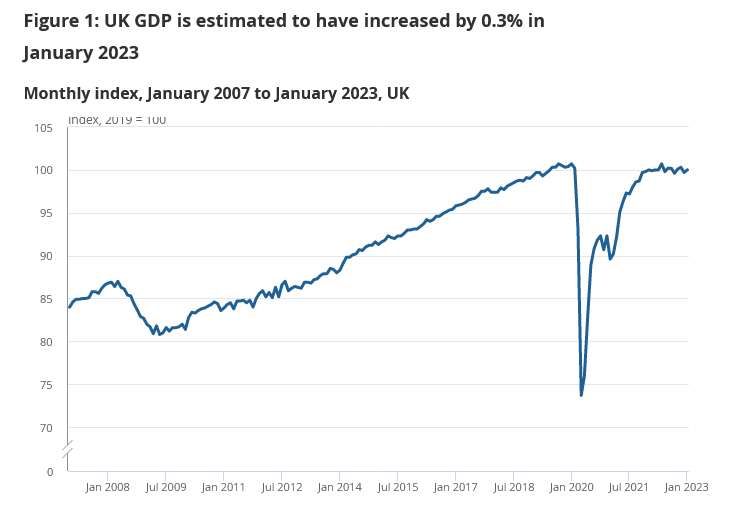
UK GDP grew 0.3% mom in Jan as services rose 0.5%
UK GDP grew 0.3% mom in January, better than expectation of 0.1% mom. Services rose 0.5% mom. Production declined -0.3% mom. Construction fell by -1.7% mom.
For the three months to January, however, GDP was flat. Services was flat. Production grew by 0.3% while construction contracted -0.7%.
Also published, manufacturing production came in at -0.4% mom, -5.2% yoy in January, versus expectation of -0.1% mom, -5.0% yoy. Industrial production was at -0.3% mom, -4.3% yoy, versus expectation of -0.1% mom, -4.0% yoy. Goods trade deficit narrowed from GBP -19.3B to GBP -17.9B, versus expectation of GBP -17.5B.
The Bank Rout
Thursday could’ve been a calm trading session. Especially given that after a deluge of strong economic figures concerning inflation and jobs, the little uptick in the US weekly jobless claims to above 200’000 for the first time since January – and which sent the US short-term yields tumbling - could’ve given some piece of mind to investors and lead to a minor correction in equities before today’s all-important US jobs figures.
But, no
A severe rout in banking stocks spoiled what could’ve been a calm session on Thursday.
The collapse of Silvergate Capital and a severe rout in SVB stock plunged the banking sector into darkness yesterday. While Silvergate Capital’s fall was mainly crypto-related and didn’t spur worries for the rest of the banking sector, SVB’s plunge fueled fears that the rest of the banks could also experience similar issues.
Why?
Because SVB bank launched a stock offering of around $2 billion to strengthen its balance sheet, because the bank needed to close a hole due to the sale of around $21 billion loss-making assets to ensure that they could pay depositors in the actual environment of rising interest rates.
And the SVB’s portfolio had a lot of US treasuries and mortgage-backed securities in it. This is an issue that could hit all the banks, including the big banks, because the banks amassed a lot of assets since the 2007/2008 financial crisis at rising prices, and they had to pay nearly no compensation for bank deposits, as interest rates have been near zero for such a long time.
And in theory, the rising interest rates would’ve been a boon for the banking sector as it would top their net interest income, as they would start making money on deposits, yet again.
But the problem is that the interest rates rose too fast. The Fed raised the rates by 450bp since last year.
And now, with inflation hanging at multi-decade highs, bank depositors ask higher compensation for their deposits, and to pay them, banks could be brought to sell their assets. But the assets must be sold at a severe loss, because the asset valuations sank severely from their all-time-high levels as a result of an aggressive Federal Reserve (Fed) tightening.
This is why JP Morgan lost more than 5%, Wells Fargo and Bank of America lost more than 6% as SVB plunged 60%.
As a result, the S&P500 didn’t wait for today’s NFP print to slip below both the 100 and 200-DMA and below the major 38.2% Fibonacci retracement on October to February rally.
Weak US jobs data could slow bleeding
Bank stocks will likely remain under the pressure of higher, and rising interest rates, as the rate hikes in the US could get more aggressive again, if the US jobs market doesn’t weaken, and inflation doesn’t cool down.
The expectation of a 50bp hike in the next FOMC meeting spiked above 80% earlier this week, as Fed Chair Jerome Powell told the US Senate that the Fed could increase the pace of interest rates if the ‘totality of the data’ requires so.
Activity in Fed funds futures currently gives slightly less than 60% chance for a 50bp hike. Today’s US jobs data could keep the 50bp hike expectations alive, or tilt the balance to 25bp hike again.
It all depends on the strength of the latest jobs data
The expectation is that the US economy may have added around 200K new nonfarm jobs in February, after last month’s whooping half-a-million NFP print. The wages are seen going up from 4.4% to 4.7%, and the unemployment rate is seen steady at 3.4% - a more-than-50-year low.
A good thing would be to see the US jobs figures weaken. Otherwise, the Fed will be brought to action a 50bp hike this month, and the latter could accelerate the equity selloff.
As such, soft, and ideally softer-than-expected jobs data from the US today could reset the Fed rate hike expectations back to a 25bp hike, whereas another set of strong jobs data will likely cement the idea of a 50bp hike from the Fed later this month, send the US yields and the US dollar up, and equities down.
US Jobs Growth in Focus
Market movers today
The macro highlight today will be the February US jobs report. We expect nonfarm payrolls growth to moderate to 220k, after effects of warm weather and heavy seasonal adjustments in January fade. Overall, leading indicators suggest that labour market conditions have remained tight amid a recovering growth outlook. The FOMC blackout period will begin on Saturday, so Fed still has the option to guide the markets after the Jobs Report.
In Norway and Denmark, inflation figures are on the agenda. We expect Norwegian core inflation to ease to 6.2% in February, which would still be higher than Norges Bank anticipated in the December monetary policy report. Inflation likely also eased in Denmark driven by lower energy prices, but rent prices create additional uncertainty.
In the UK the monthly GDP indicator will give insights into how the economy started into the new year. We expect it to show stagnation on a monthly basis, following a 0.5% decline in December.
The 60 second overview
Bank of Japan: Bank of Japan remained an outlier among global central banks and left its ultra-loose monetary policy unchanged at the last meeting of Governor Kuroda, in line with our expectations. The yen weakened a tad after the decision. Recent data on the Japanese economy has been to the weak side, and hence not supported monetary policy tightening for the time being - the BoJ is not convinced that the current inflationary pressures are persistent. However, we think it is a matter of time before BoJ will start tightening with at least tweaking the YCC during Q2. The outcome of the spring wage negotiations could have a major impact on how soon the BoJ could end its ultra-loose monetary policy. Japan's parliament has now formally approved Kazuo Ueda to succeed Kuroda as governor from April 9.
FI: Yields declined after the weaker than expected jobless claims that sent 10Y US Treasuries back below 4%. This also had a spillover effect on the European markets, where 10Y German government bonds initially had increased some 5-6bp during the day, but ended the day at an unchanged level. The US curve steepened significantly between 2Y and 10Y given expectations that the Federal Reserve may just do 25bp rather than a 50bp hike. The curve was more than 100bp inverse between 2Y and 10Y, but is now below 100bp again.
FX: USD/JPY firmed after Bank of Japan left monetary policy instruments intact. EUR/USD continued the past days' slow move higher ahead of non-farm payrolls. GBP/USD recovered yesterday but is still in the low 1.19s, while both SEK and NOK weakened. EUR/SEK is back at square one where it traded before the Riksbank's U-turn. EUR/NOK has printed a new year high above 11.31 ahead of key CPI data.
Credit: The secondary corporate bond market was flattish d/d with iTraxx Main unchanged at 76bp, while iTraxx X-over widened 1bp to 397bp. Attention yet again on the primary market with significant new issue activity. In the Nordic space we saw Finnish based Neste print EUR1bn in total divided in two tranches with a EUR500m 6 year Green bond with a 3.875% coupon and a EUR500m 10 year Green bond with a 4.250% coupon.
Nordic macro
Norwegian core inflation surprised strongly to the upside in January, with the annual rate rising to 6.4%. The January numbers are always associated with considerable uncertainty, especially in periods with big price movements. Price increases in many product groups slowed appreciably towards the end of last year, so we reckon that part of the rise in January was a correction of price levels rather than the start of inflation accelerating again. As expected, rents also rose more than normal, as these are linked to inflation in November. There is still great uncertainty, but we expect the annual rate of core inflation to ease to 6.2% in February. This would still be higher than Norges Bank anticipated in the December monetary policy report (5.9 %).
In Denmark, we also expect to see a decline in inflation driven by energy prices, where especially declining market prices for natural gas during recent months creates potential for lower consumer prices. Rents, which make up 19.5% of the CPI, create extra uncertainty in February. Even though Statistics Denmark have started to incorporate rent changes in the CPI on a quarterly basis, it is the February print that reflects the big annual changes. Some rents are indexed to inflation and will hence have risen, although the increase has been capped politically. Rents in especially social housing can to some extent reflect higher interest rates. We expect that rents will boost inflation from February and throughout the rest of the year.
Preliminary unemployment figures for February in the shape of Statistics Denmark's unemployment indicator are also due. Projections based on the weekly figures from the Danish Agency for Labour Market and Recruitment point to unemployment rising from 2.7% to 2.8% in February.
Five Waves Elliott Wave Structure in Dow Futures (YM)
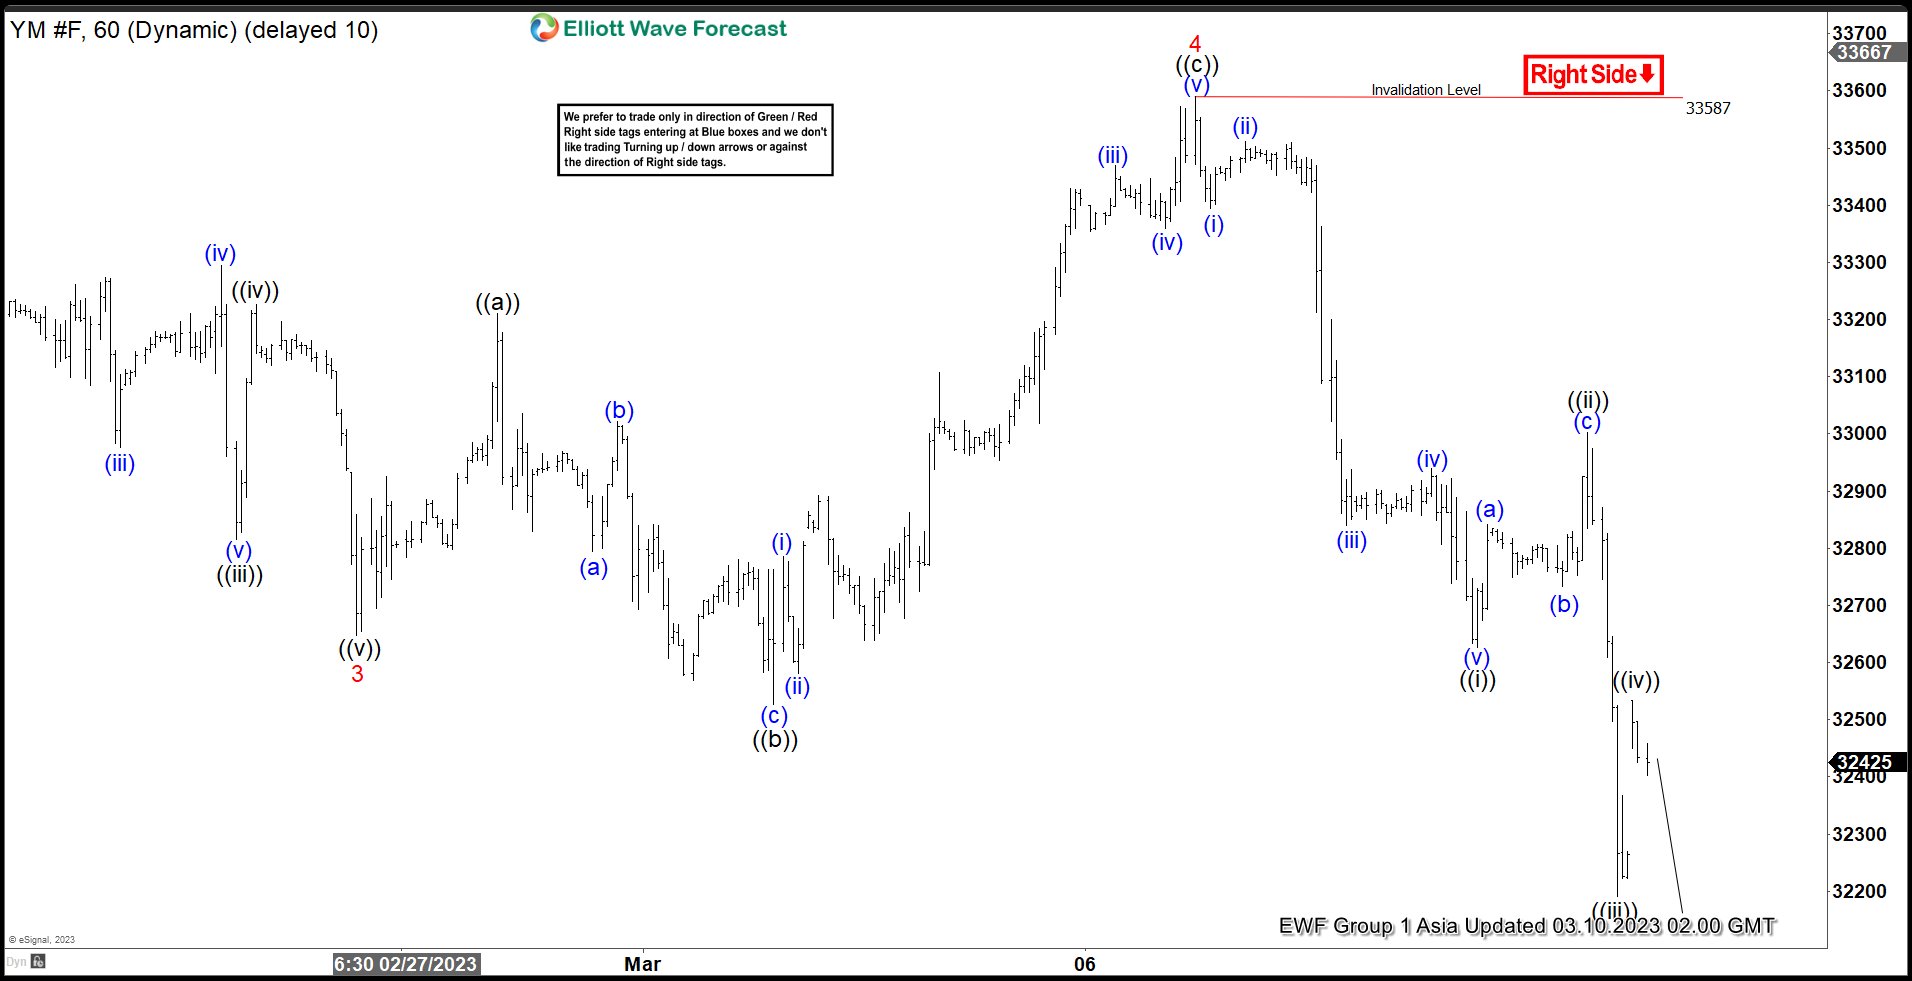
Cycle from 12.13.2022 high in Dow Futures (YM) shows a 5 swing sequence favoring follow up to the downside. Structure of the move lower from 12.13.2022 high is unfolding as a 5 waves diagonal Elliott Wave structure. Down from 12.13.2022 high, wave 1 ended at 32686 and rally in wave 2 ended at 34551. Dow Futures extends lower in wave 3 towards 32527 and wave 4 rally ended at 33590.
Internal subdivision of wave 4 unfolded as an expanded flat. Up from wave 3, wave ((a)) ended at 33211 and wave ((b)) pullback ended at 32527. Index then resumes higher in wave ((c)) with internal subdivision as 5 waves. Up from wave ((b)), wave (i) ended at 32785 and pullback in wave (ii) ended at 32580. Index then resumes higher in wave (iii) towards 33470, and pullback in wave (iv) ended at 33359. Final leg wave (v) ended at 33587 which completed wave ((c)) of 4 in higher degree. The Index has turned lower in wave 5 with internal subdivision as an impulse. Down from wave 4, wave ((i)) ended at 32626 and wave ((ii)) rally ended at 33002. Wave ((iii)) lower ended at 32190 and wave ((iv)) rally ended at 32534. Near term, as far as pivot at 33587 stays intact, expect rally to fail in 3, 7, 11 swing for further downside.
YM 60 Minutes Hour Elliott Wave Chart
Dow Futures (YM) Elliott Wave Video
https://www.youtube.com/watch?v=pdayZ2l7nTE
Technical Outlook and Review
DXY:
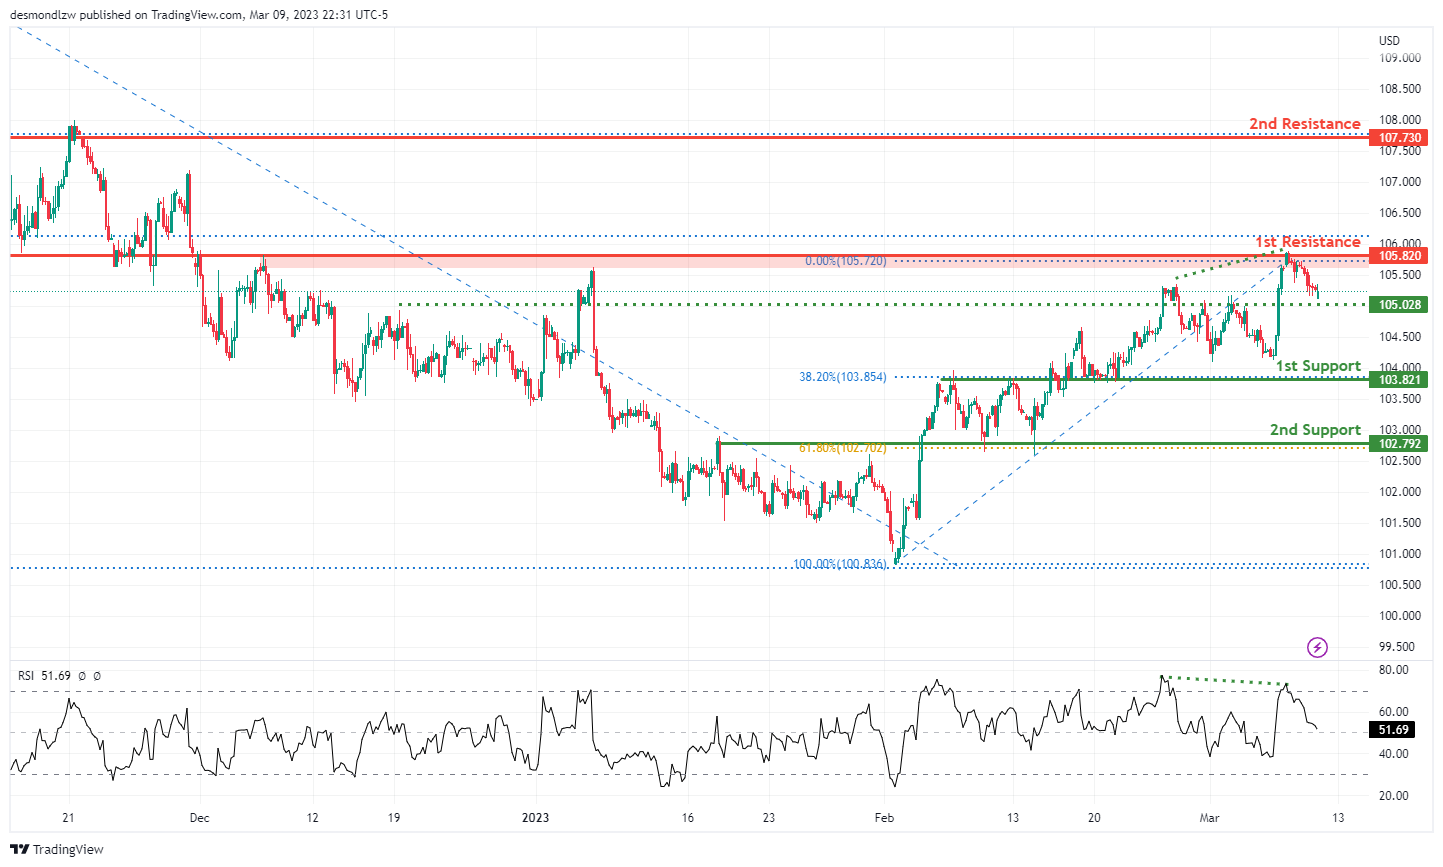
Price has reversed from 1st resistance area of 105.82, which is an overlap resistance. it could potentially drop to our 1st support at 103.80, which has the 38.2% Fibonacci retracement. The next support level is at 102.79, which is an overlap support that lines up with the 61.8% Fibonacci retracement. Do take of our intermediate support at 105.02
In terms of resistance, if the price were to break the 1st resistance, it could push up to 107.730, which is an overlap resistance. Worth noting that there’s a bearish divergence being formed against the RSI too which suggests a potential bearish reversal.
EUR/USD:
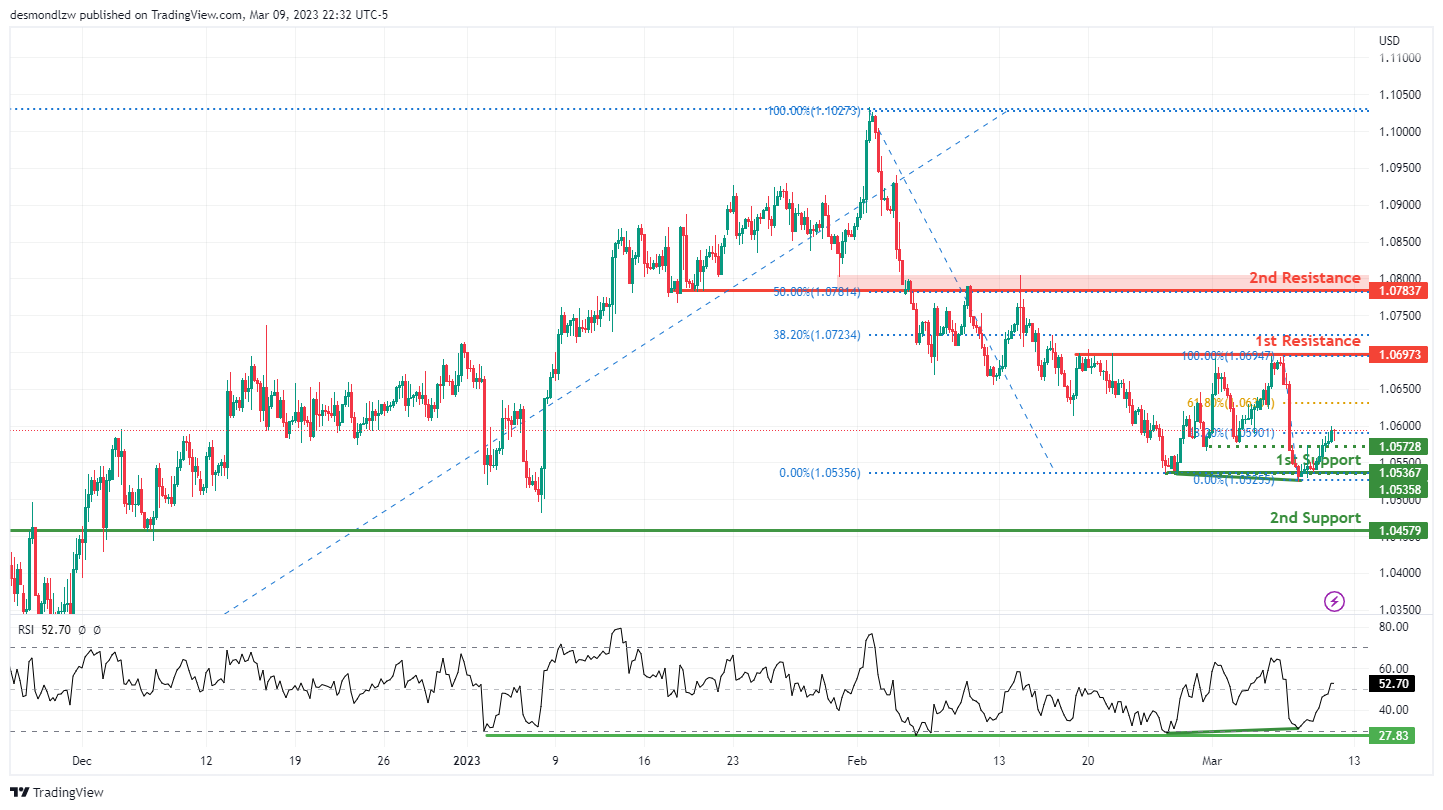
EURUSD has bouched nicely from our intermediate support at 1.0535 and is seeing bullish divergence vs RSI. Price could potentially rise to our 1st resistance at 1.0697 which is slightly below our 38.2% Fibonacci retracement.
The first major support is at 1.0485 which is a strong overlap support. If price were to break this level, we could see it drop further to 1.0354 which is our 2nd support.
GBP/USD:
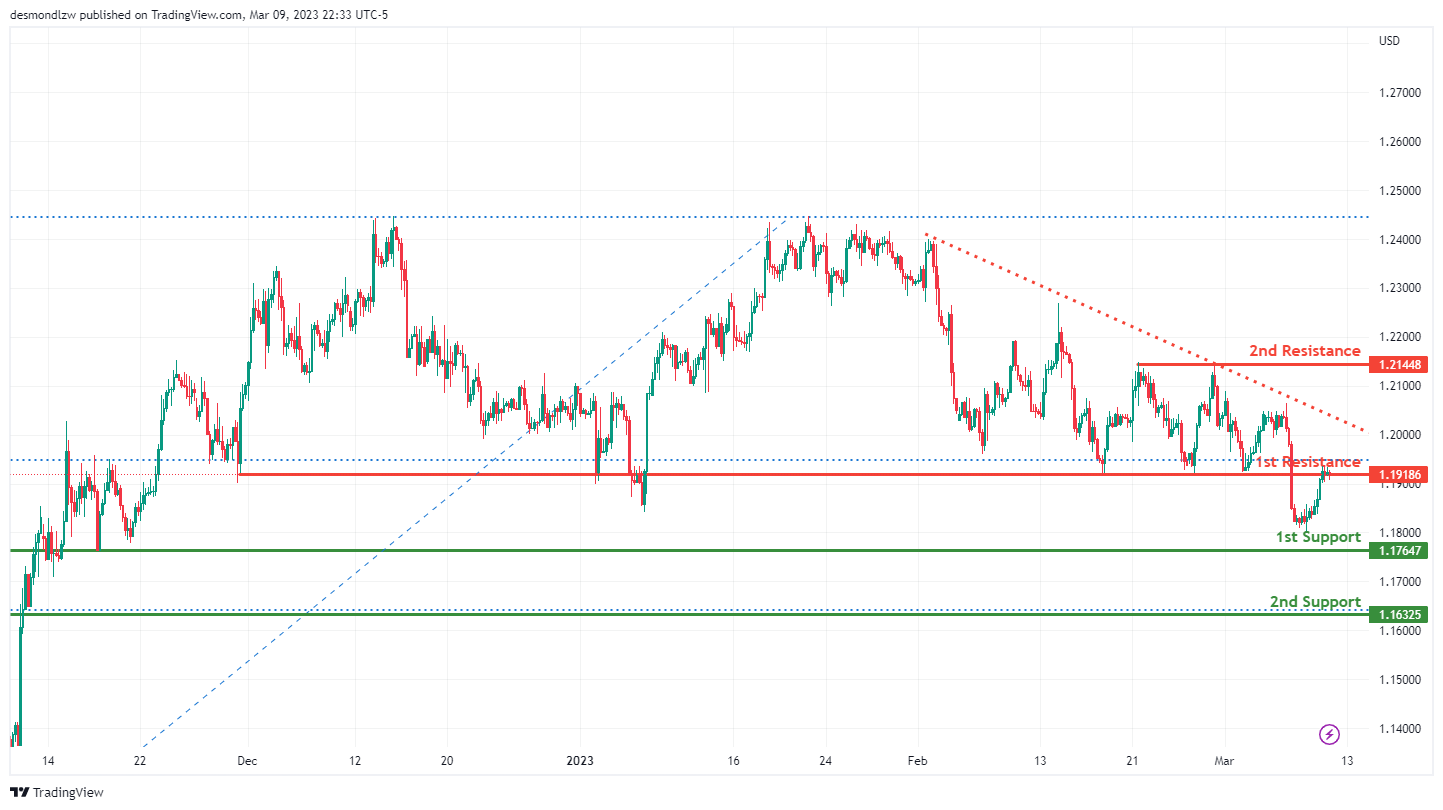
Price is currently at our 1st resistance at 1.1917, which is an overlap resistance if the price were to break from this level, it could push up to ur 2nd resistance at 1.2144
Regarding support levels, our 1st support is at 1.1764, which is overlap support, and the 2nd support level is at 1.1632.
USD/CHF:
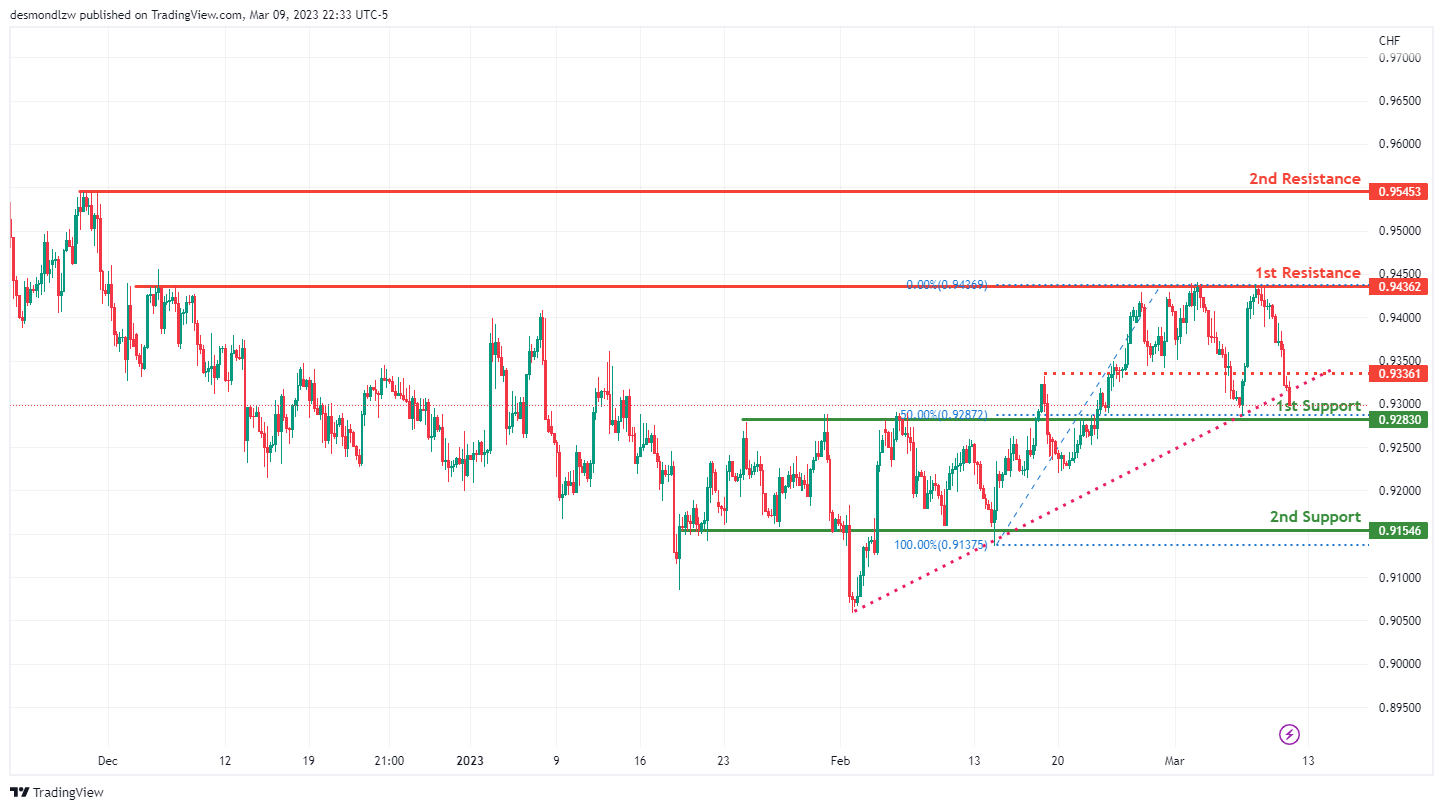
Price is approaching our 1st support level at 0.9283 with lines up the 50% Fibonacci retracement. If the price were to break from this level, our 2nd support level is 0.9154 which is an overlap support
Regarding resistance levels, if price were to reverse from the 1st support, we could see it push up to the 1st resistance at 0.9436. The 2nd resistance level is at 0.9545
USD/JPY:
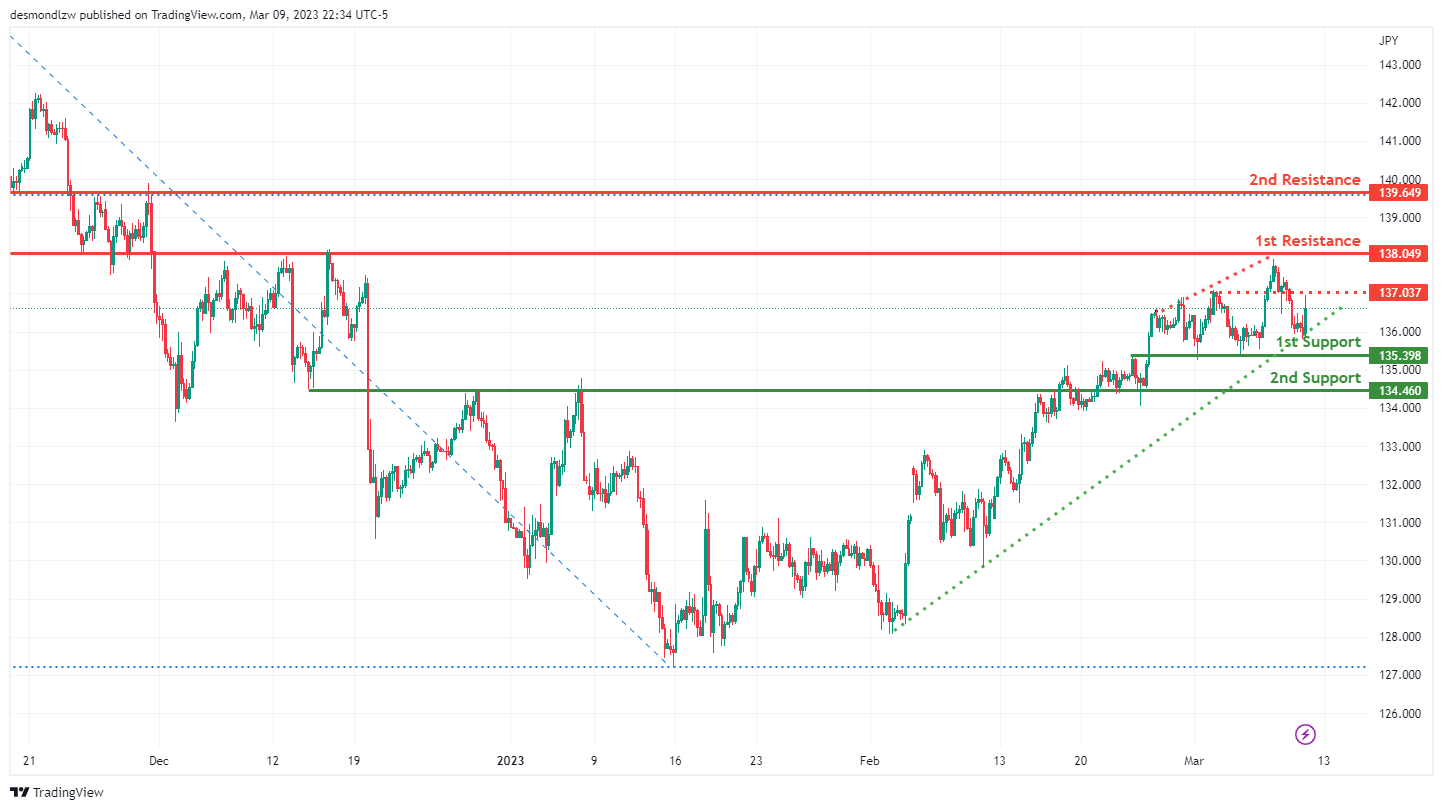
Price is seeing support from an ascending support line. We could see it continue to be squeezed against the 1st resistance of 138.04 which is a key overlap resistance. If price were to break that level, we could see a further push up to 2nd resistance at 139.64.
AUD/USD:
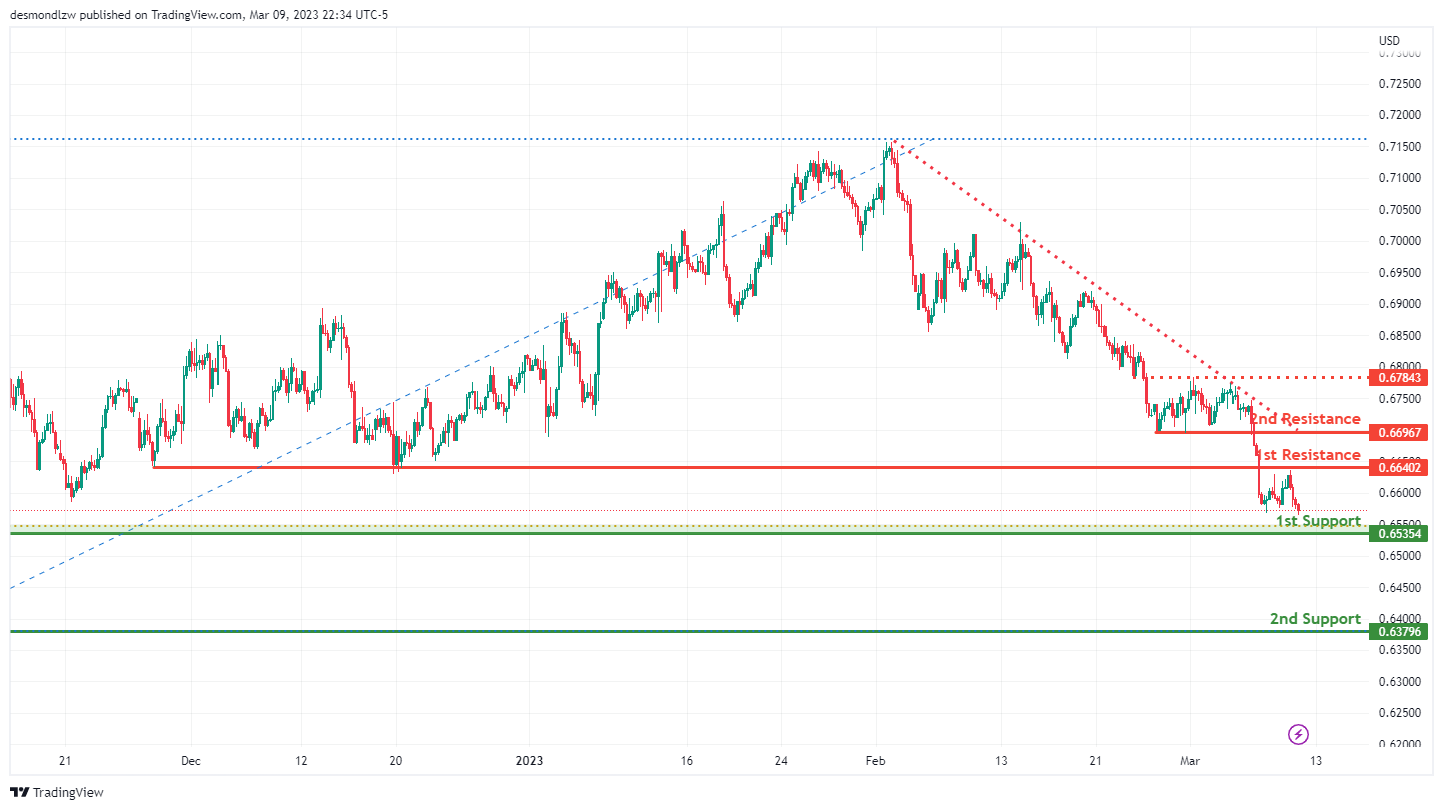
Price has reversed from our 1st resistance at 0.6640 which is a strong Overlap Resistance and it currently approaching our 1st support at 0.6535, which is an overlap support If the price were to break from this level, the next key support level would be at 0.6379, which is another overlap support
Regarding resistance levels, the 1st resistance is at 0.6640 which is a strong Overlap Resistance, and the 2nd resistance is at 0.6696 which is a short-term pullback resistance level.
NZD/USD:
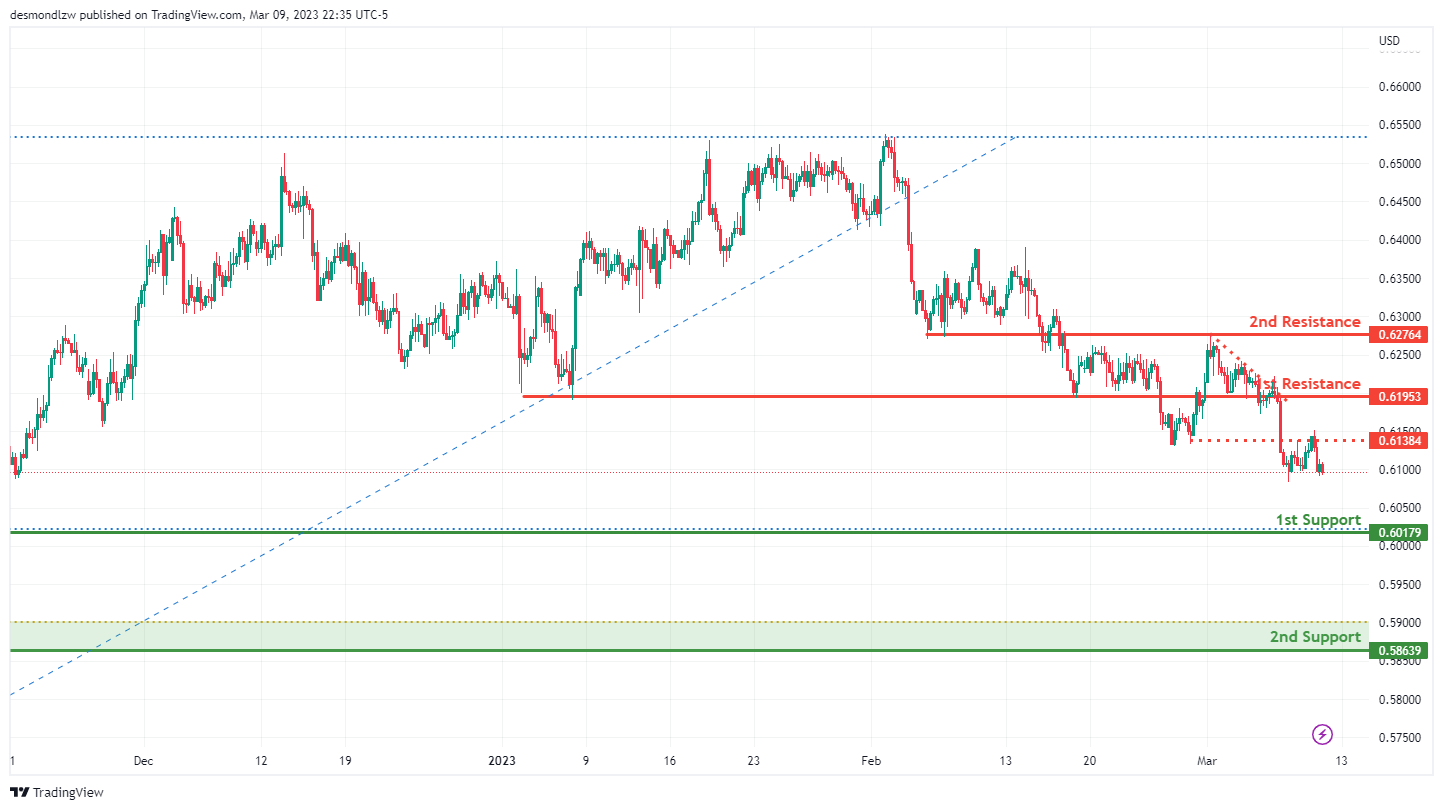
We are currently seeing a strong bearish momentum in the price. Price could come down to the 1st support level at 0.6017, and if the price were to break from that level, it could drop down to the 2nd support level at 0.5863, which is another overlap support.
Regarding resistance levels, the 1st resistance is at 0.6195, which is an overlap resistance, and the 2nd resistance is at 0.6276 which is an overlap resistance. It’s worth noting that our intermediate resistance is 0.6138
USD/CAD:
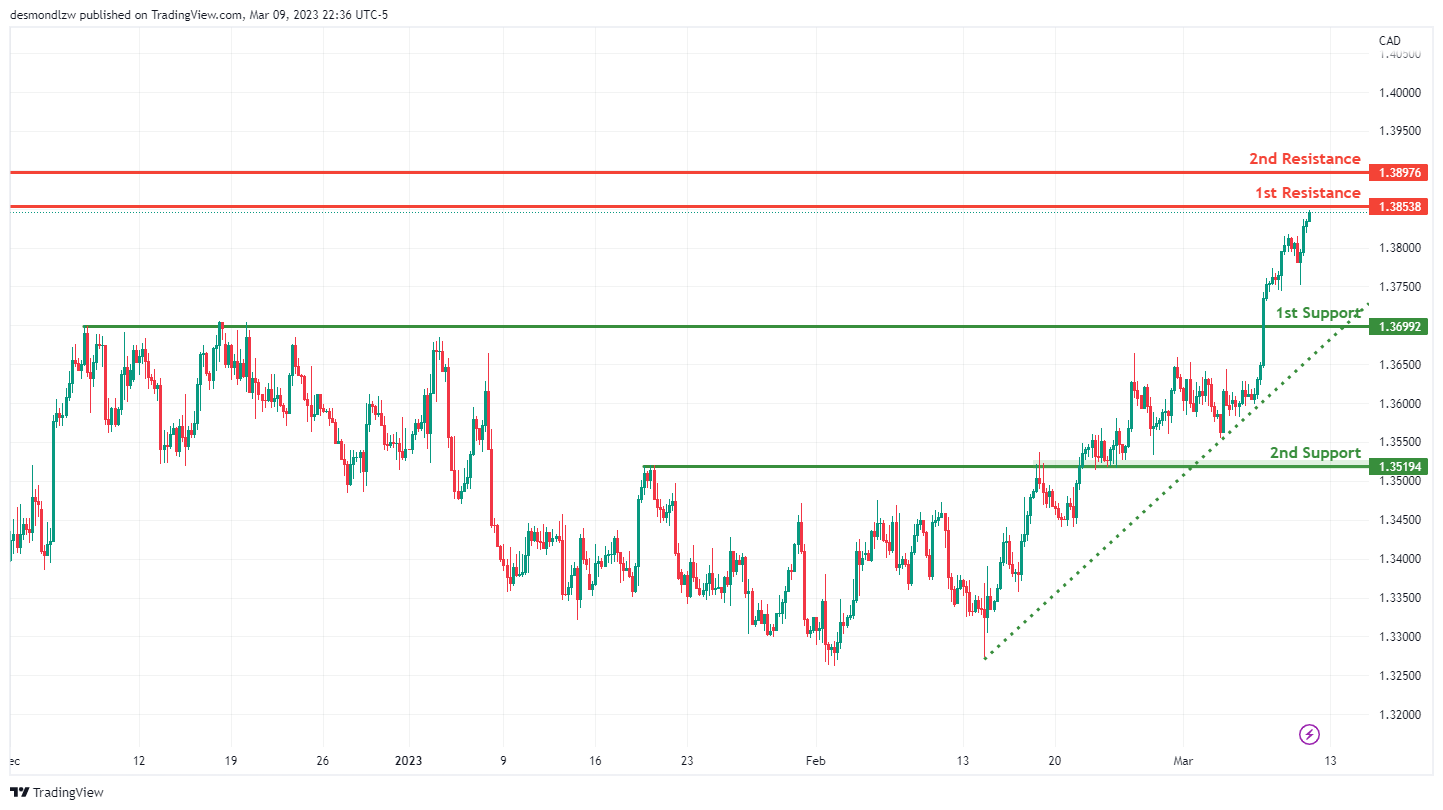
Price is approaching major resistance at 1.3830 and is seeing strong bullish momentum from our ascending support line and Ichimoku cloud support. The 1st support we’re looking at is at 1.3699 which is a pullback support.
DJ30:
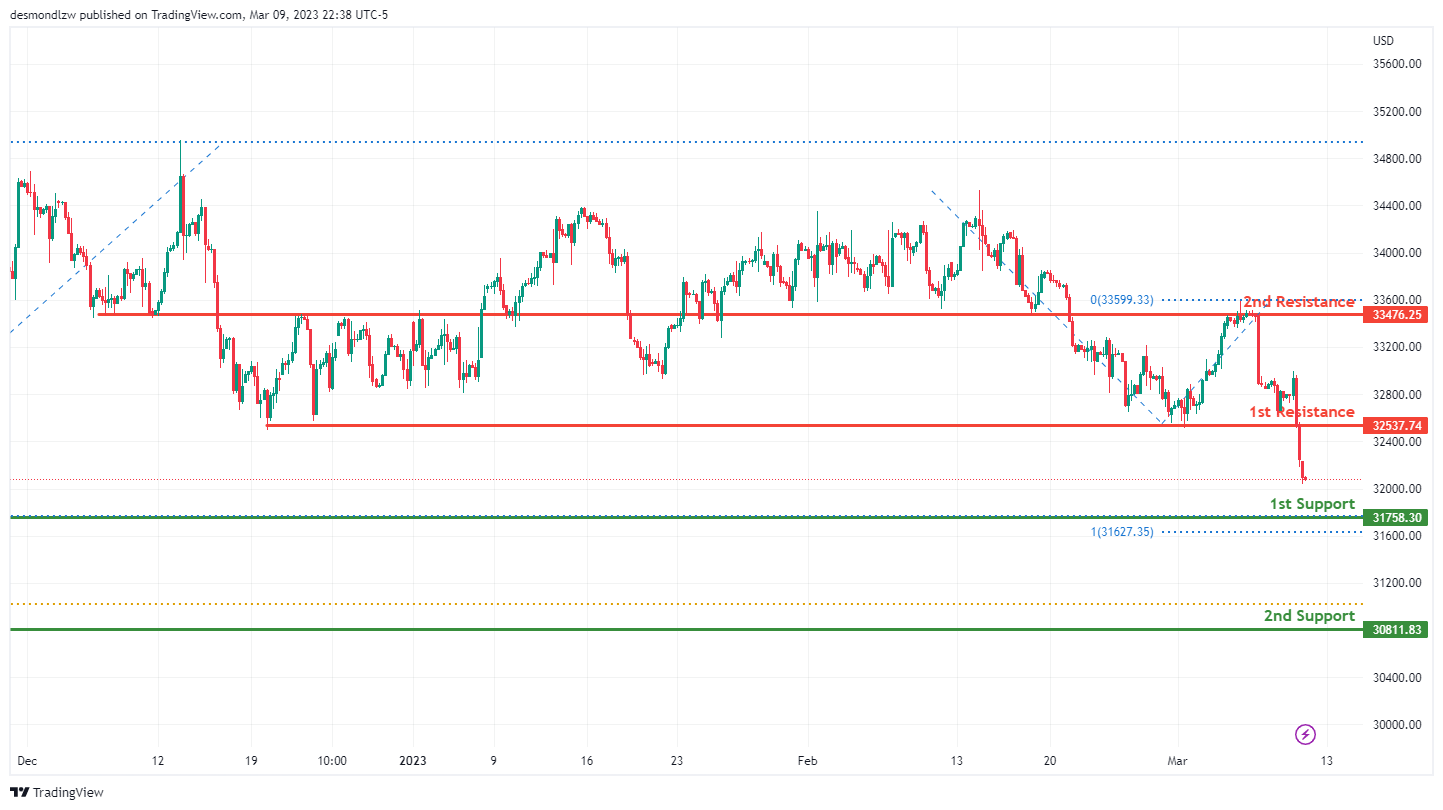
Price is currently dropping towards the 1st support level at 31758. If price were to break this level, the next support level is at 30811,
Regarding resistance levels, if price were to reverse, our 1st resistance level is 32537 and, the next resistance level is at 33476, which is a strong overlap resistance.
GER30:
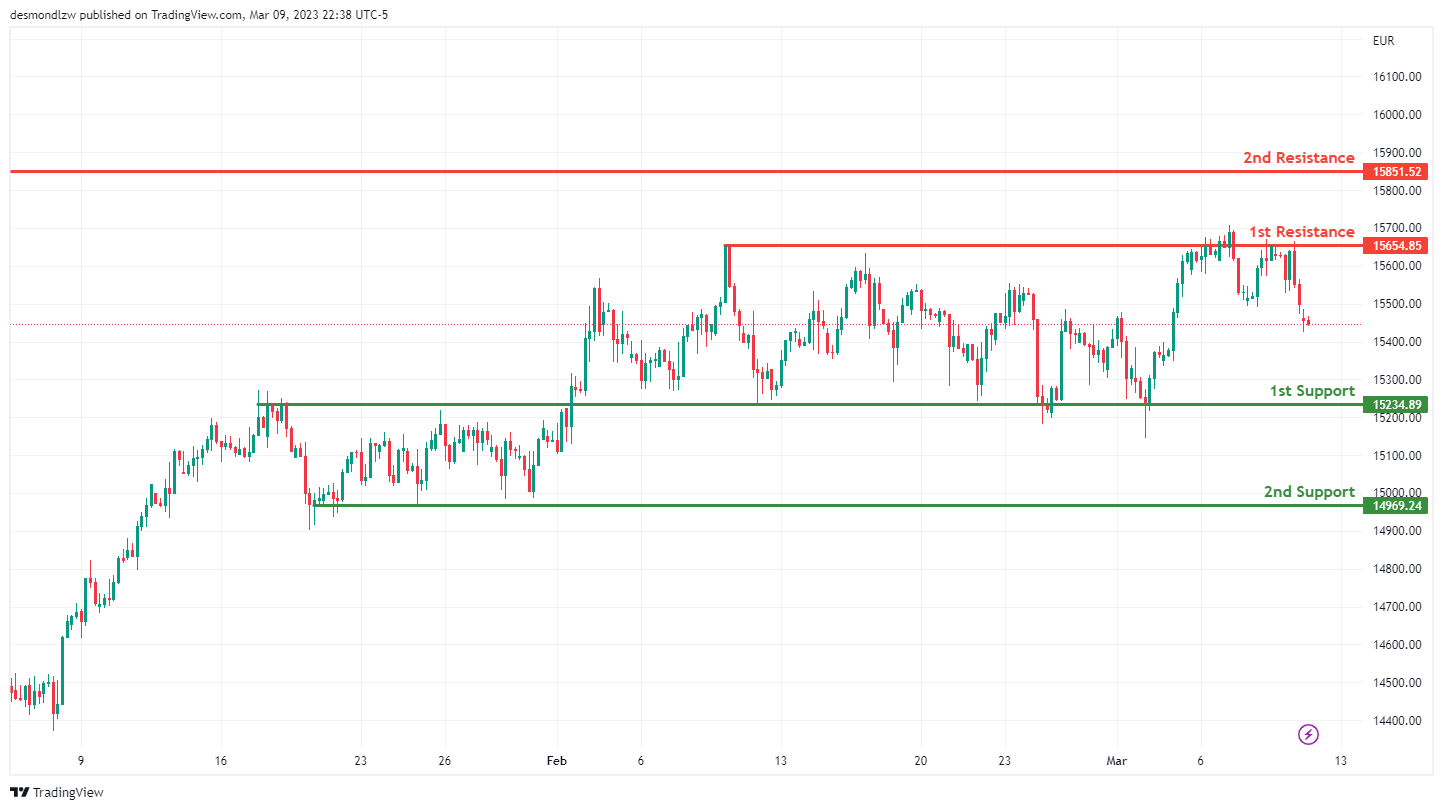
Price has reversed from major swing high resistance at 15654 which is a swing high resistance and it currently dropping toward our 1st support at 15234 which is overlap support if price were to break, it could drop to our 2nd support at 14969
BTC/USD:
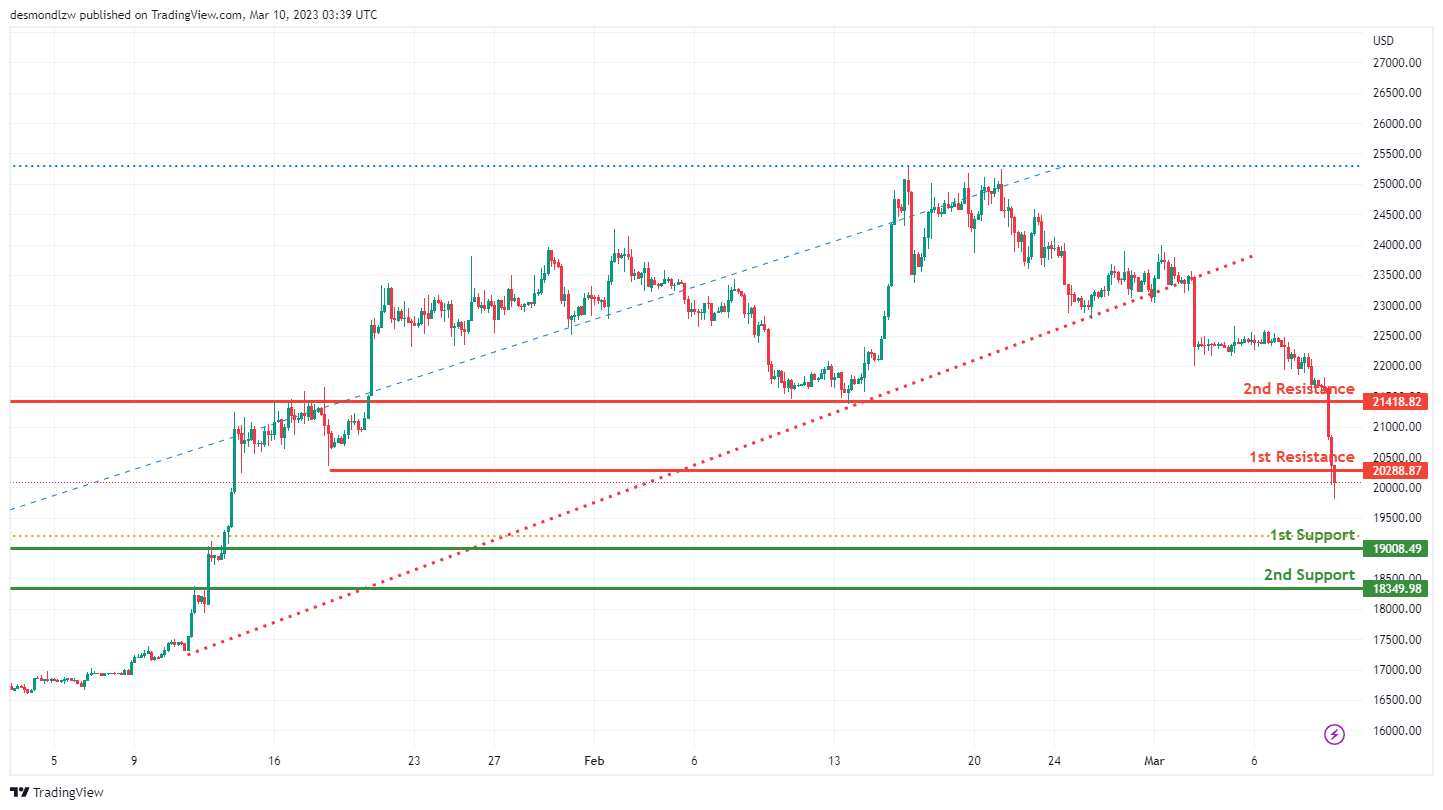
Price is dropping toward our 1st support at 19008 and 2nd support is 18349 if the price were to reverse, price could push up to our 1st resistance at 220288 and 2nd resistance is 21418 which is an overlap resistance
US500
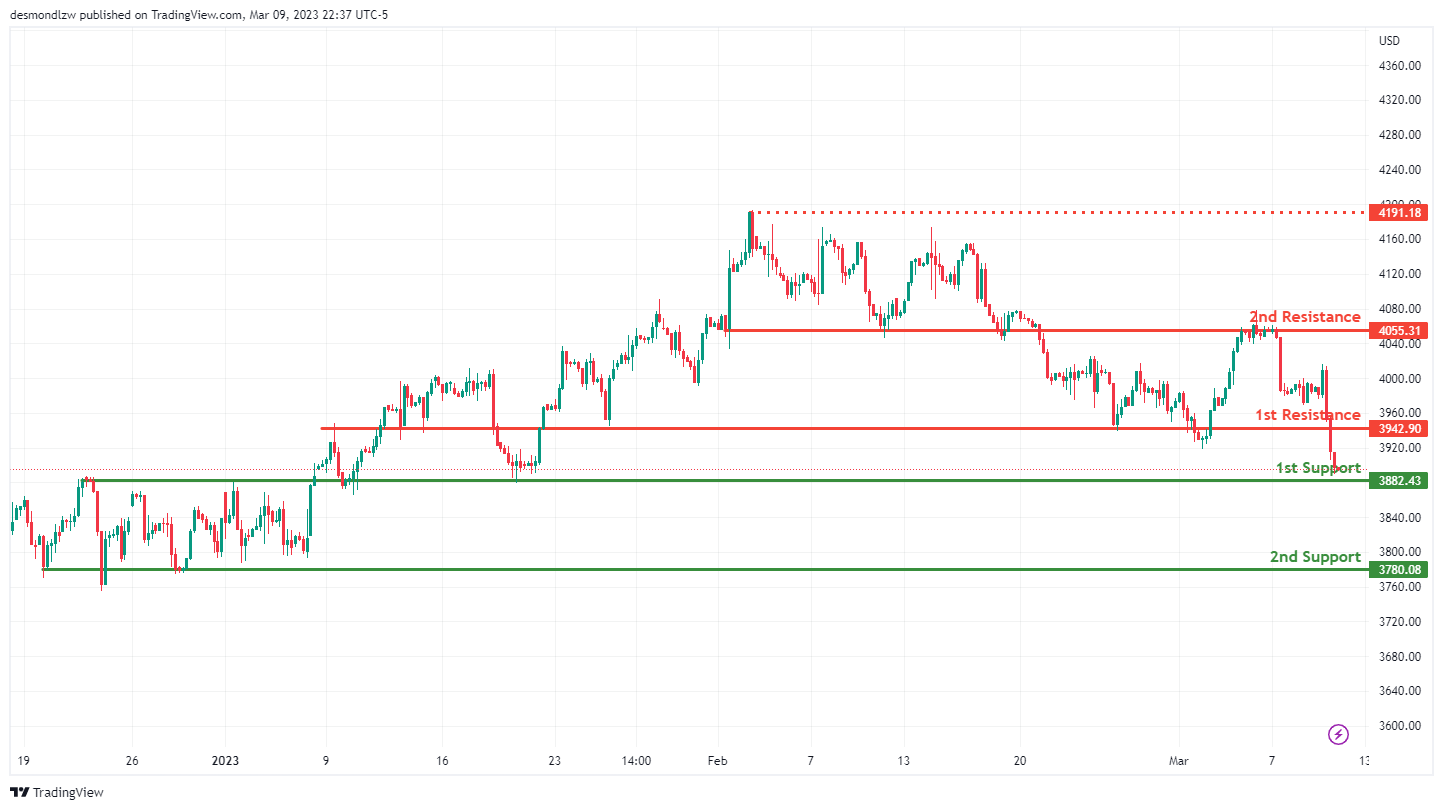
Price is approaching our 1st support which is overlap support if price were to break from this support, it could drop further to 2nd support at 3780
Regarding resistance level, If the price were to reverse from the 1st support level, our 1st resistance is 3942 and 2nd resistance is 4055 which is an overlap resistance
ETH/USD:
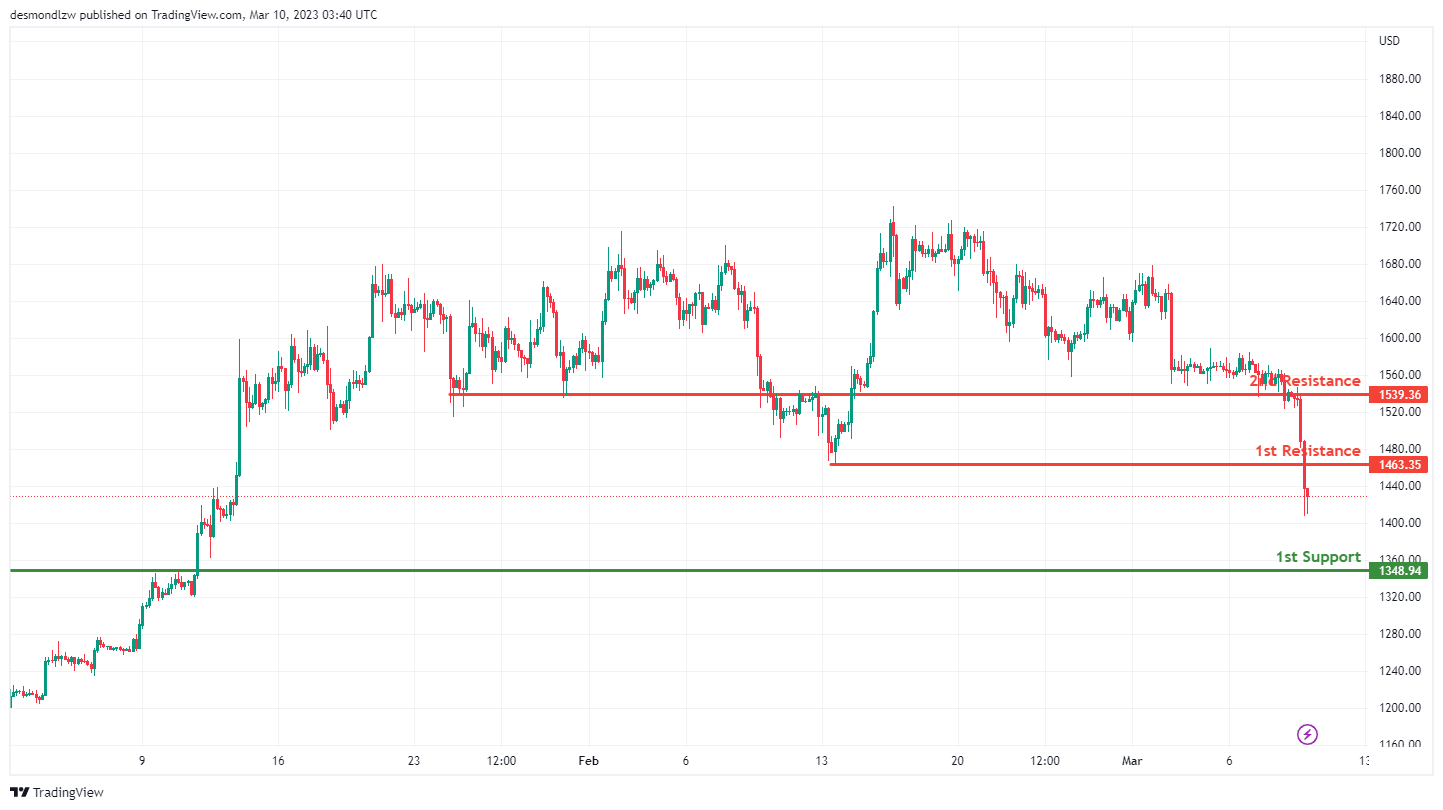
Price is dropping to our 1st support level at 1348, if price were to reverse from here, it could push up to our 1st resistance level at 1463 which is an overlap resistance and 2nd resistance is 1539
WTI/USD:
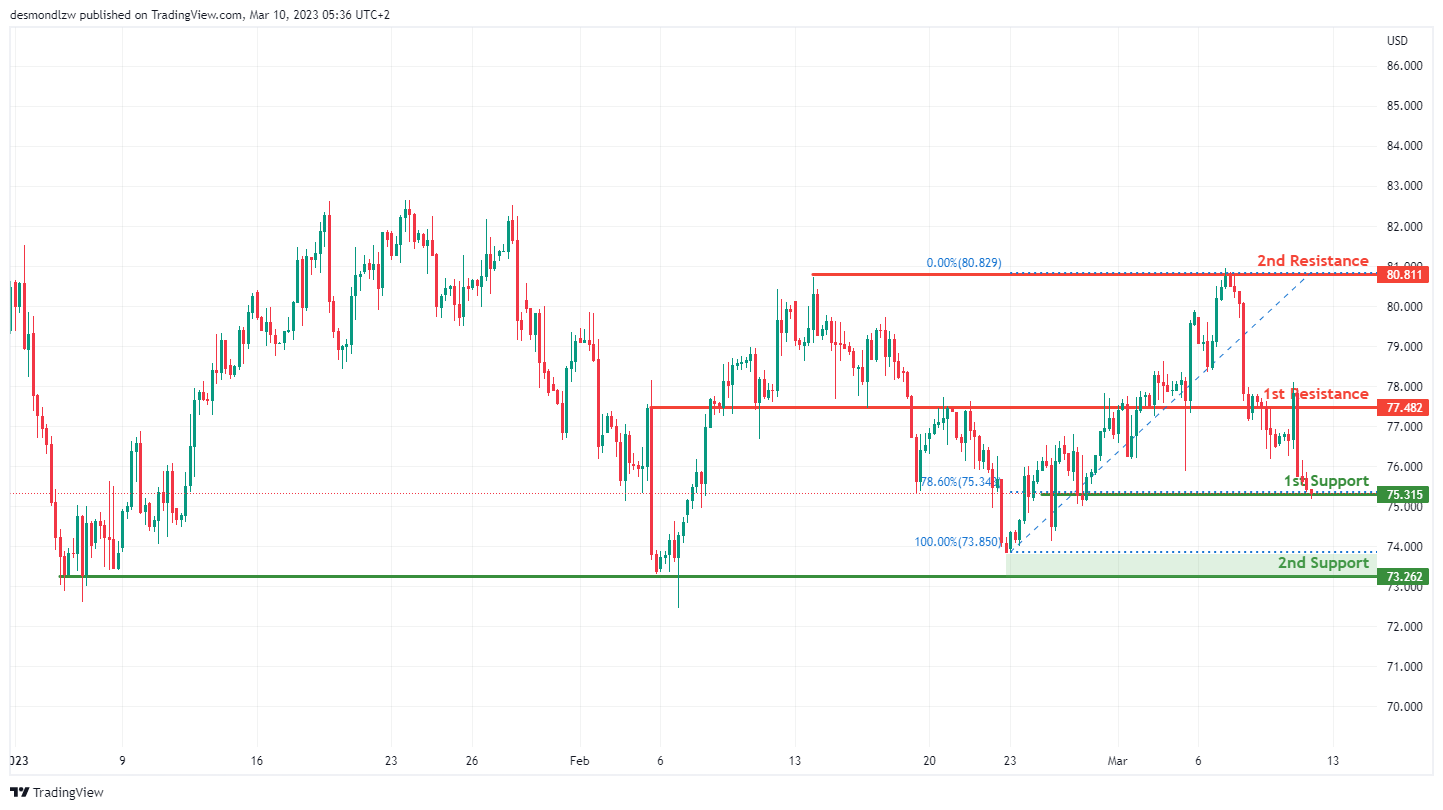
Price is currently at our 1st support level at 75.31 which lines up with the 78.6% Fibonacci retracement and our 2nd support is at 73.26
In terms of resistance, we can see an overlap resistance at 77.48 – if price were to break that resistance, the next closest resistance is all the way up at 80.81 which is a major swing high resistance.
XAU/USD (GOLD):
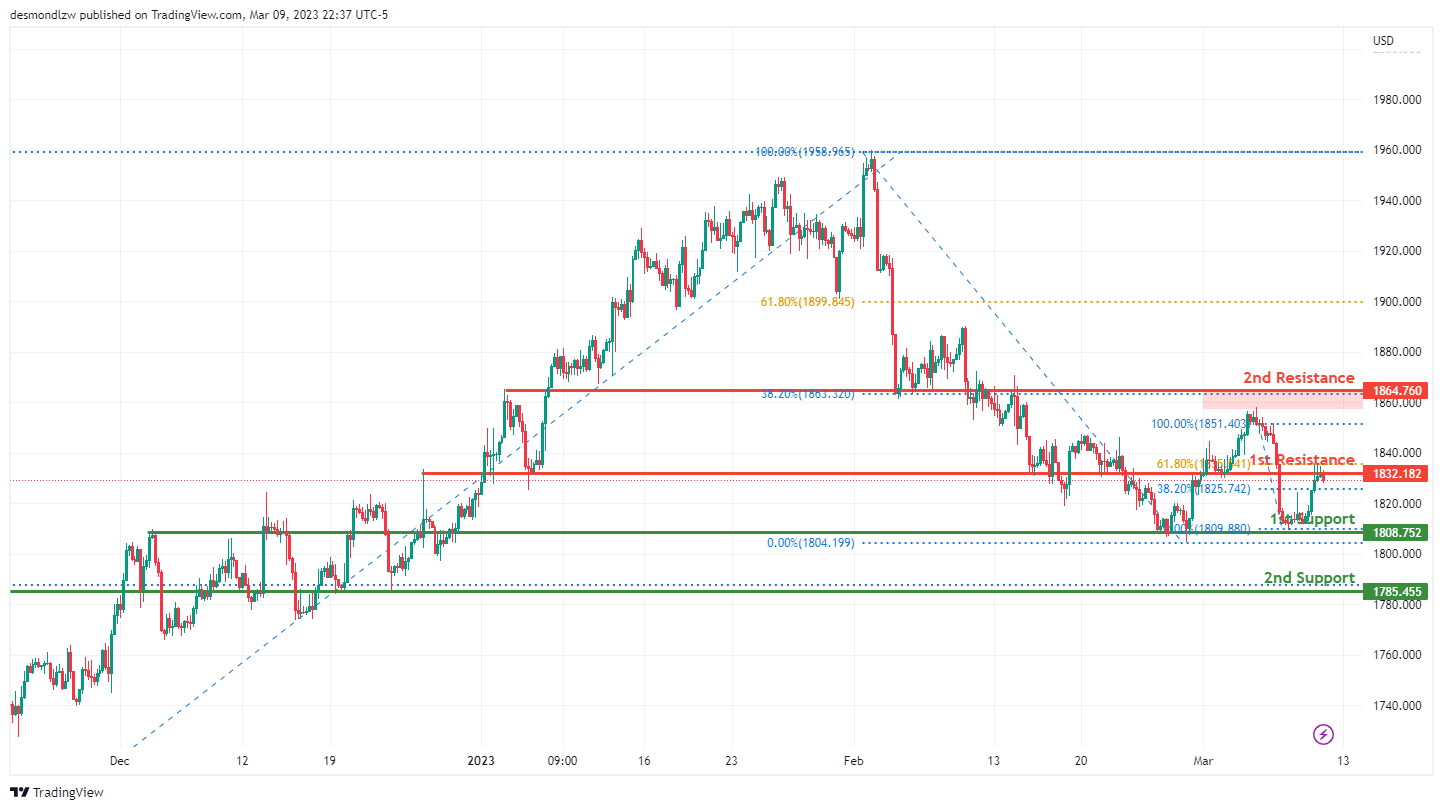
Price is currently at our 1st resistance area at 1832 which lines up with the 61.80% Fibonacci retracement if price were to reverse from here it could drop to our 1st support at 1808 and 2nd support is 1785 which major overlap support.
Our 2nd resistance is 1864 which lines up with the 38.20% Fibonacci retracement and overlap resistance
USD/CAD Daily Outlook
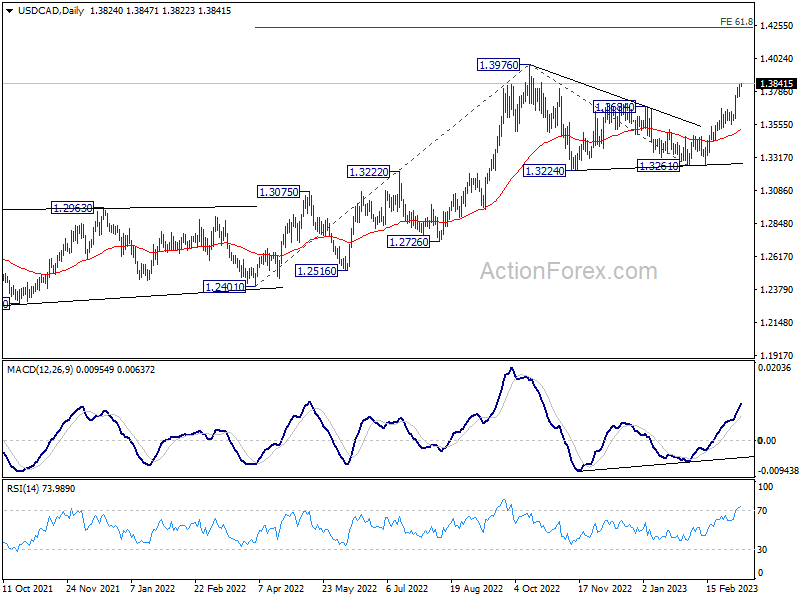
Daily Pivots: (S1) 1.3760; (P) 1.3788; (R1) 1.3831; More....
Intraday bias in USD/CAD remains on the upside for the moment. Rise from 1.3261 is in progress for retesting 1.3976 high. Firm break there will resume larger up trend and target 1.4234 projection level. On the downside, break of 1.3751 minor support will turn intraday bias neutral and bring consolidations. But retreat should be contained well above 1.3554 support to bring another rally.
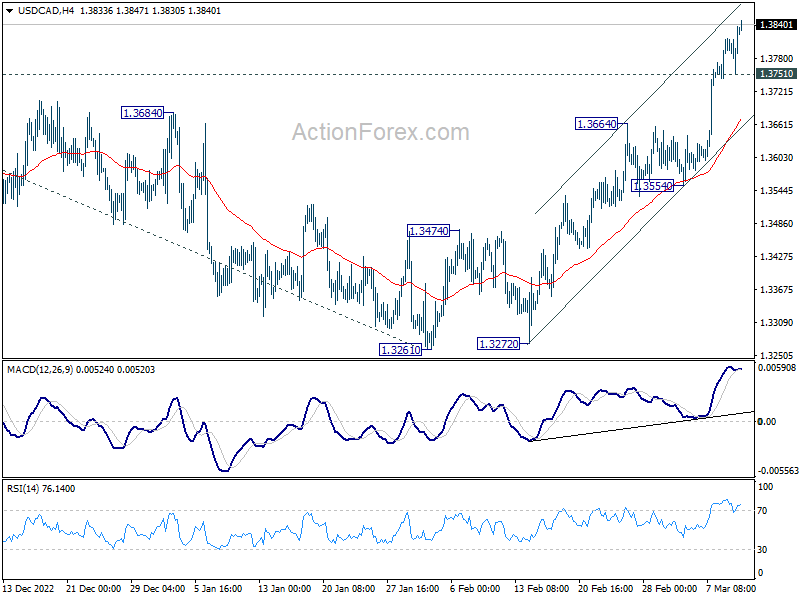
In the bigger picture, the up trend from 1.2005 (2021 low) is still in progress. Next target is 61.8% projection of 1.2401 to 1.3976 from 1.3261 at 1.4234. Firm break there will pave the way to long term resistance zone at 1.4667/89 (2016, 2020 highs). On the downside, break of 1.3261 support is needed to confirm medium term topping. Otherwise, outlook remains bullish even in case of deep pull back.