Sample Category Title
Cautious Ahead of Jobs Report
It would appear investors are taking a cautious stance ahead of tomorrow's jobs report, a little spooked by Powell's comments in Congress and fearful of being caught on the wrong side of another hot jobs report.
That's clearly the danger at this point, that we get another hot report that confirms January was no blip and instead indicative of a labour market that not only isn't cooling but perhaps getting hotter. The trend pre-January across many indicators pointed to a cooling in the economy and that was expected to catch up to the jobs market eventually but a variety of data points at the start of the year threw that narrative into doubt.
I expect the February data and that of the months that follow will see the pre-January trend continue, even accelerate given the additional tightening that will have worked its way through to the economy since. But following Powell's comments, we may need to see clear evidence of that on Friday or further cracks could appear in equity markets.
We're already seeing a move back to 50 basis point hikes being priced in, with that now seen as more likely than 25 in two weeks. Powell's comments obviously fuelled that although I still believed he chose his words very carefully to ensure it's an option that's taken seriously rather than the base case. The data over the next couple of weeks could potentially cement it.
Steady after Powell hit
Oil prices are treading water today, continuing to stabilize after Tuesday's plunge on the back of Jerome Powell's comments. There remain two dominant forces in the markets and recent activity has been evidence of that.
Anything that threatens the US economic outlook is a big downside risk while stronger numbers from China are providing the bullish case. But with neither certain, we may continue to see very choppy but ultimately range-bound trade. Tomorrow's jobs report will be the next test of that.
Holding ahead of jobs data
Gold once again ran into support around $1,800-$1,810 this week but that may only prove temporary if we get another hot jobs report tomorrow. It may well be that the proximity to the report is what's saved it for now, with technical support kicking in. Suddenly two levels are really standing out, the support mentioned above and $1,860, a move above which would represent the break of a double bottom neckline and potentially indicate that a strong recovery, at least, is on the cards.
A major test
The crypto headlines have not been helpful this past week and have come at a time when broader market sentiment is crumbling, resulting in bitcoin breaking back below $22,000 and looking likely to go further. Previous lows around $21,500 now offer the next test of support, a break of which could be a massive blow after such an encouraging start to the year.
AUD/JPY and NZD/JPY break support ahead of Kuroda’s last BoJ meeting
Yen is seeing a broad recovery today as investors anticipate Haruhiko Kuroda's last BoJ monetary policy meeting tomorrow. As with four of his predecessors, Kuroda is unlikely to make any changes to policy during this last meeting, with his comments expected to echo what has been said numerous times before. Specifically, he is likely to reiterate that the current ultra-loose monetary policy is still appropriate until there is sustained inflation above the 2% target led by wage growth.
Meanwhile, the government's nominees for the next BoJ Governor and Deputy Governors have been approved by the lower house of parliament today. The upper house will vote on the nominees tomorrow. Kazuo Ueda will officially replace Kuroda on April 8, and chair his first monetary policy meeting on April 27-28. The two deputy governor nominees, Shinichi Ueda and Ryozo Himino, will take office from March 20.
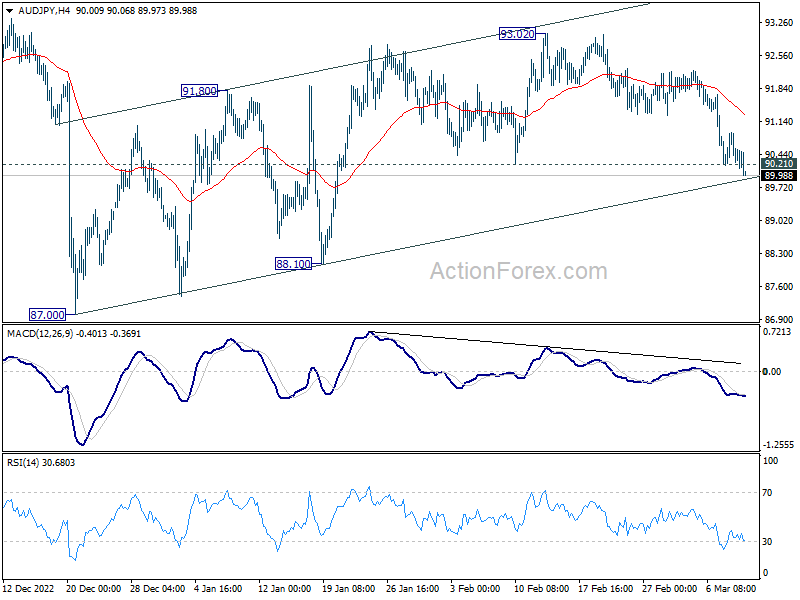
Yen is making progress today by breaking through near term resistance levels against commodity currencies. AUD/JPY's break of 90.21 support argues that corrective rise from 87.00 has completed at 93.02. Sustained trading below channel support (now at 89.91) will affirm this bearish case and target 87.00/88.10 support zone.
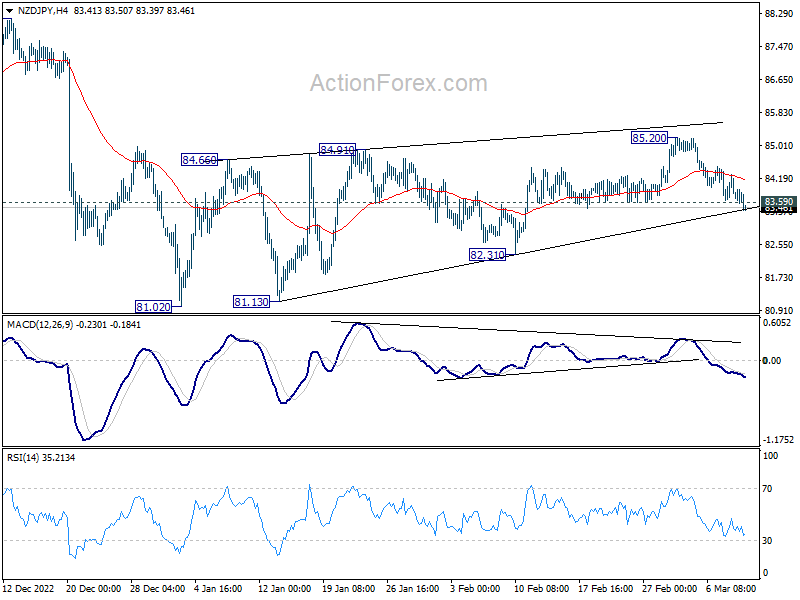
NZD/JPY's break of 83.59 support also argue that corrective pattern from 81.02 has completed at 85.20. Sustained trading below trend line support (now at 83.44) will bring deeper fall to 82.31 support first, and then 81.02 low.
USD/JPY Sharply Lower Ahead of Kuroda’s Last Meeting
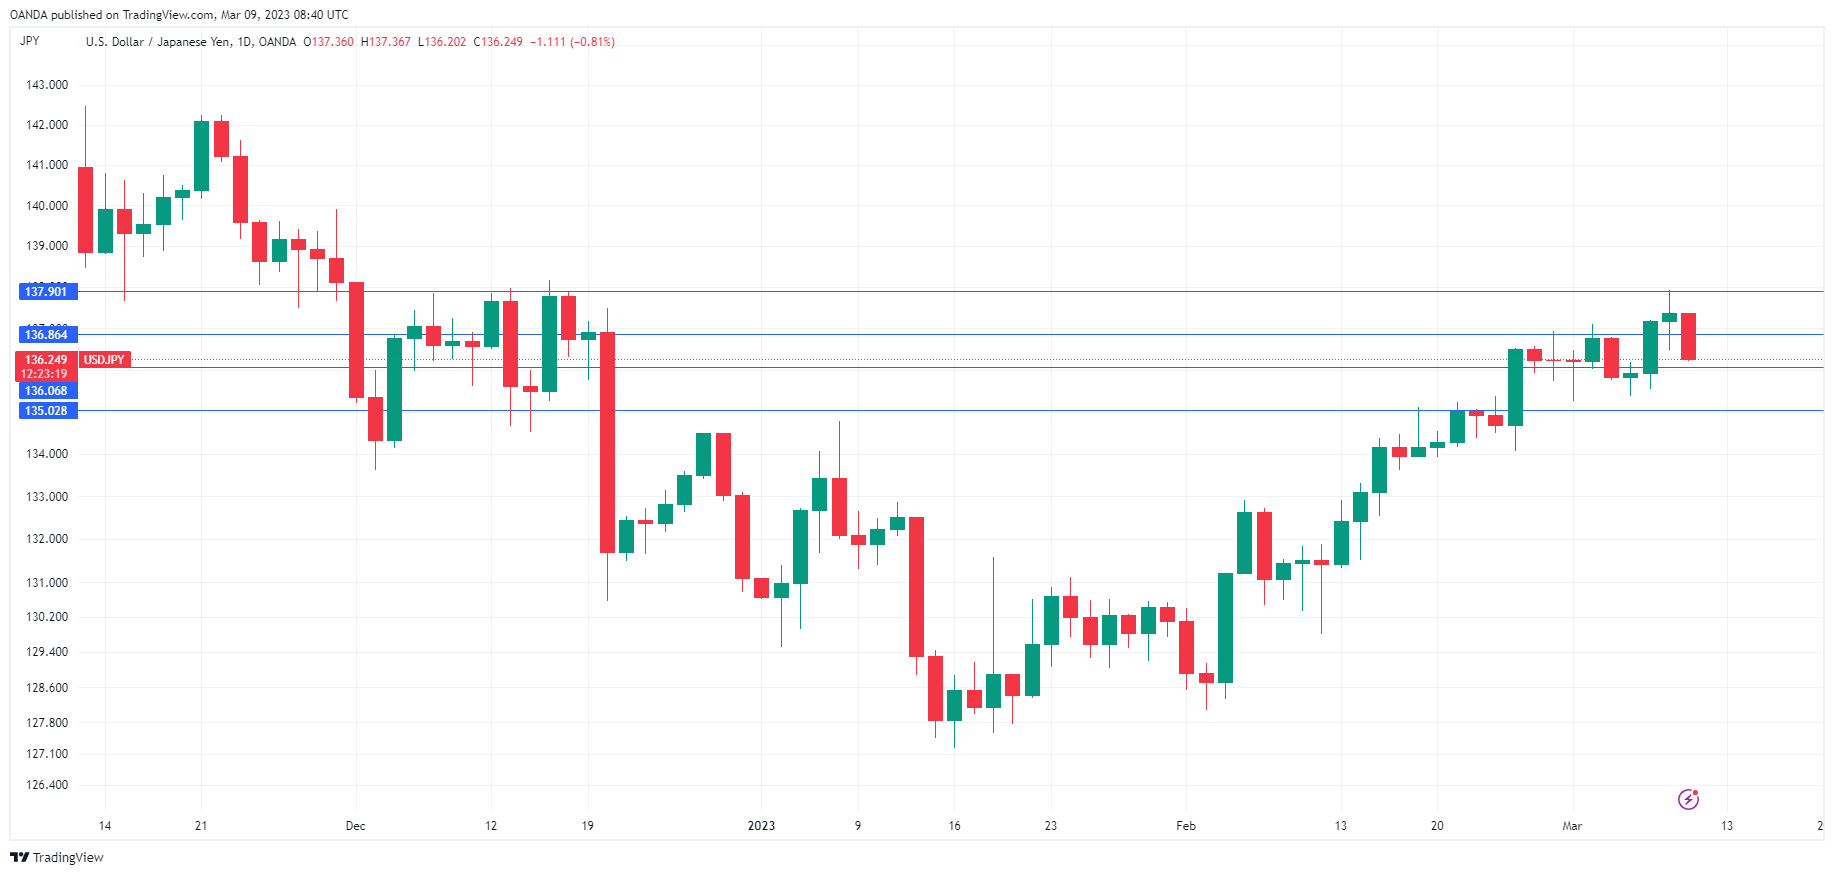
The Japanese yen is showing strength on Thursday. In the European session, USD/JPY is trading at 136.27, down 0.79%.
Kuroda’s last hurrah
After 10 years at the helm of the Bank of Japan, Governor Kuroda chairs his final policy meeting on Friday. Traditionally, BoJ governors have not made policy changes at their last meeting, and in all likelihood, Kuroda will not go out into the night with guns blazing.
Still, Kuroda likes to keep the markets guessing and his tweak of the 10-year yield target range in December completely blindsided traders and jolted the financial markets. This has kept the markets on alert for Kuroda tweaking or even abandoning the BoJ’s yield curve control (YCC) policy. The bond market remains dysfunctional due to the YCC, even with the band widening in December. Governor-elect Ueda has stated that the current policy is appropriate, but this is to be expected at this sensitive time of changing the guard at the BoJ. Ueda will be under pressure right away to make changes to the YCC, and that could occur as soon as he takes over in April.
Fed Chair Powell didn’t add anything new at a second day of testimony on Capitol Hill, but the markets have been scrambling since his hawkish comments to lawmakers a day earlier. Powell’s said that the Fed would accelerate the pace of interest rate increases if that was what the data dictated. The markets have fallen in line and have priced a 50-basis point hike at the March 22 meeting at 77% according to the CME Group, compared to 25% before Powell’s testimony on Tuesday.
Powell’s hawkish stance has also fuelled expectations that the peak rate will be higher than expected. In December, the Fed projected a rate of 5.1%, but that is clearly out of date. The markets have priced in a peak rate of around 5.5% and Blackrock, the world’s largest asset manager sees rates peaking at 6%. Currently, the benchmark rate stands at 4.75%.
USD/JPY Technical
- 136.06 is under pressure in support. 13502 is next
- 136.86 and 1.37.90 are the next resistance lines
Crypto Market Cheaper Than a Trillion Again
Market picture
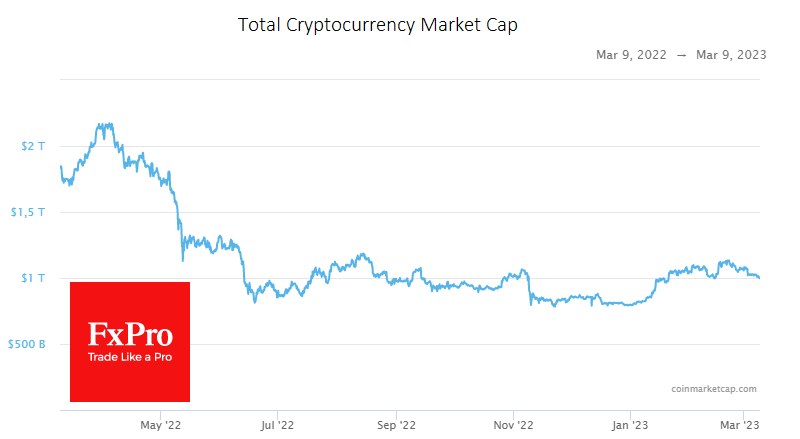
The total capitalisation of the crypto market is back below $1 trillion, down 1.1% over the last 24 hours. We note that sellers drive the market during periods of reduced liquidity – in the early hours of the Asian session, as was the case today.
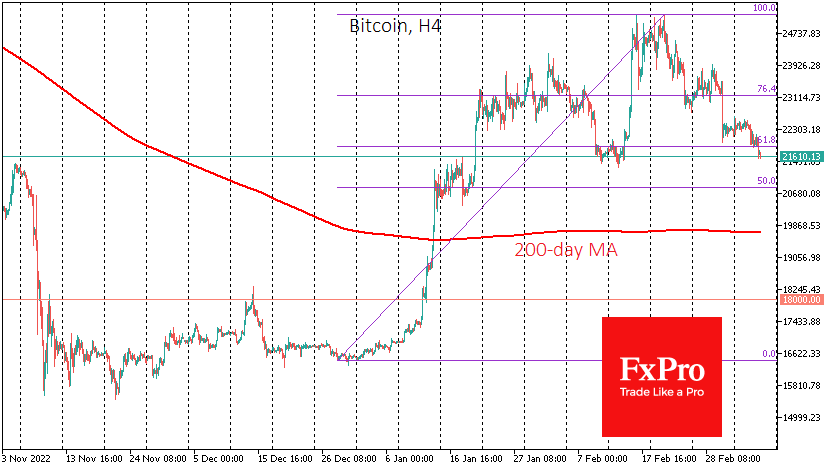
Bitcoin lost $300 in a sharp move to $21.7K, approaching the February lows and the critical signal level of $21.5K. A break below this level would change the status of the current events from a “typical correction” to a “methodical sell-off”.
In that case, the road to $18K for bitcoin is open, and the capitalisation of the entire crypto market could fall back to $820B, as the rally from the beginning of the year would look like a blip in a bear market, not the start of a long uptrend. Many, including ourselves, saw the latter scenario as the main one until the end of last week.
News background
Eric Pearce, CEO of One River Digital Asset Management, believes that the fall in the crypto market is temporary and that bitcoin has the potential to rise again. The key to the rally, he says, will be accelerating institutional adoption of crypto assets.
According to a new Paxos survey, 89% of US crypto investors continue to entrust their funds to centralised exchanges, despite the collapse of several major companies in the cryptocurrency industry. 75% of US citizens are still interested in cryptocurrencies.
US banking giant JPMorgan is ending its banking relationship with Gemini, a cryptocurrency exchange Cameron and Tyler Winklevoss owned.
According to PeckShield, the US government seized 48,998 BTC (worth about $1.08 billion) from the Silk Road darknet marketplace. The 9,825 BTC went to Coinbase, with the rest going to two new wallets.
According to the court ruling, Binance’s US unit could buy the assets of bankrupt cryptocurrency lender Voyager Digital.
WTI Futures Lose Ground Below Short-Term SMAs
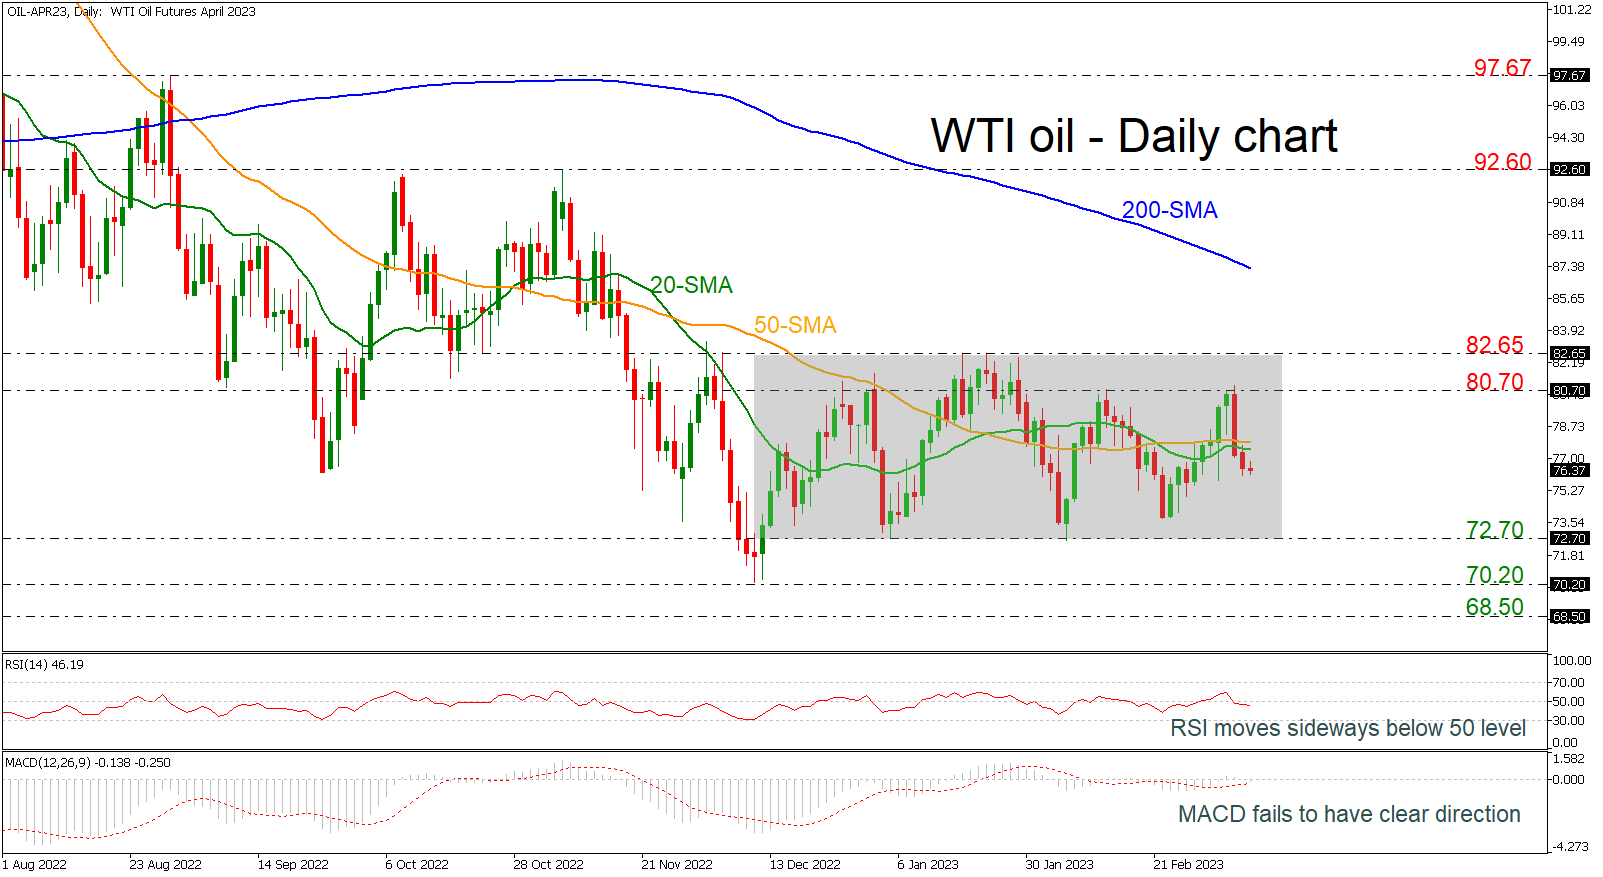
WTI crude oil futures are easing beneath the 20- and 50-day simple moving averages (SMAs), which are acting as a mid-level of the medium-term consolidation area of 72.70-82.65. The RSI is moving slightly lower below the neutral threshold of 50, while the MACD is losing momentum near its trigger and zero lines.
The market seems to be well supported by the lower boundary of the range at 72.70 and therefore only a decisively close below it would put traders in a more negative mode. If that floor is breached it would lead to a re-challenge of the 70.20 barrier, while below it the bears are eagerly waiting to take full control and drive towards a tougher barrier around 68.50.
Alternatively, if the bulls jump above the short-term SMAs, the spotlight will shift back to the 80.70 resistance and the upper band of the range at 85.65, a break of which would extend the upward move towards the 200-day SMA at 87.26. Above that, the door would open for the 95.60 top.
In brief, oil prices are expected to hold withing a sideways channel unless the price closes significantly below 72.70 or above 82.65.
ETHUSD Extends Retreat below 50-day SMA
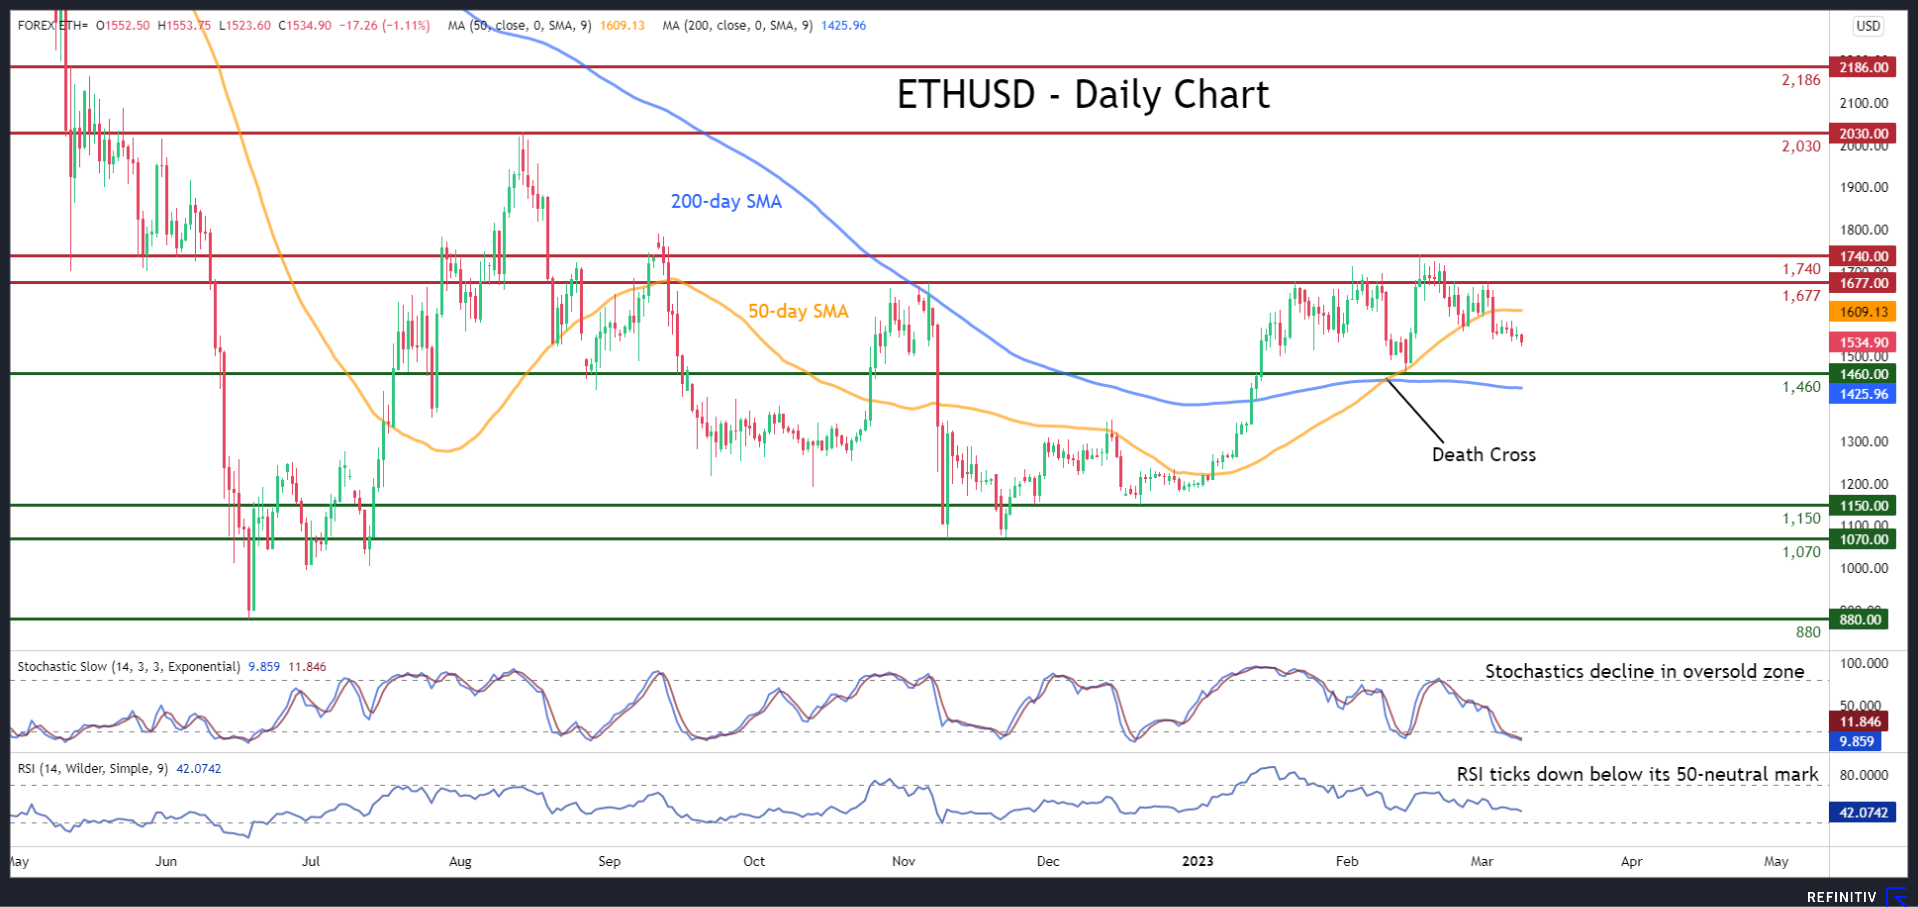
ETHUSD (Ethereum) has staged a significant rally since the beginning of the year, posting a fresh five-month high of 1,740 in mid-February. However, the digital asset has come under pressure lately, with the price crossing below its 50-day simple moving average (SMA) for the first time since January 4.
The momentum indicators currently suggest that the bearish forces are reigning supreme. Specifically, the stochastic oscillator is descending within its 20-oversold zone, while the RSI is ticking downwards below its 50-neutral mark.
To the downside, if selling pressures persist, initial support could be met at the recent low of 1,460. Sliding beneath that floor, the price could descend towards 1,150 or lower to test the November double-bottom region of 1,070. A break below the latter could open the door for the 2022 bottom of 880, which is also a two-year low.
Alternatively, should the price reverse higher, the 1,677 resistance zone, which also held strong in November, could act as the first resistance point. Conquering this barricade, the bulls may aim for the 2023 peak of 1,740 before the August high of 2,030 appears on the radar. Even higher, the 2,186 hurdle could prove to be a tough one for the price to overcome.
Overall, even though some oversold signals have emerged, ETHUSD keeps sloping downwards after violating the crucial 50-day SMA. For that bearish tone to reverse, the price needs to cross above the 1,740 ceiling.
USDCAD Tests a Make-or-Break Point
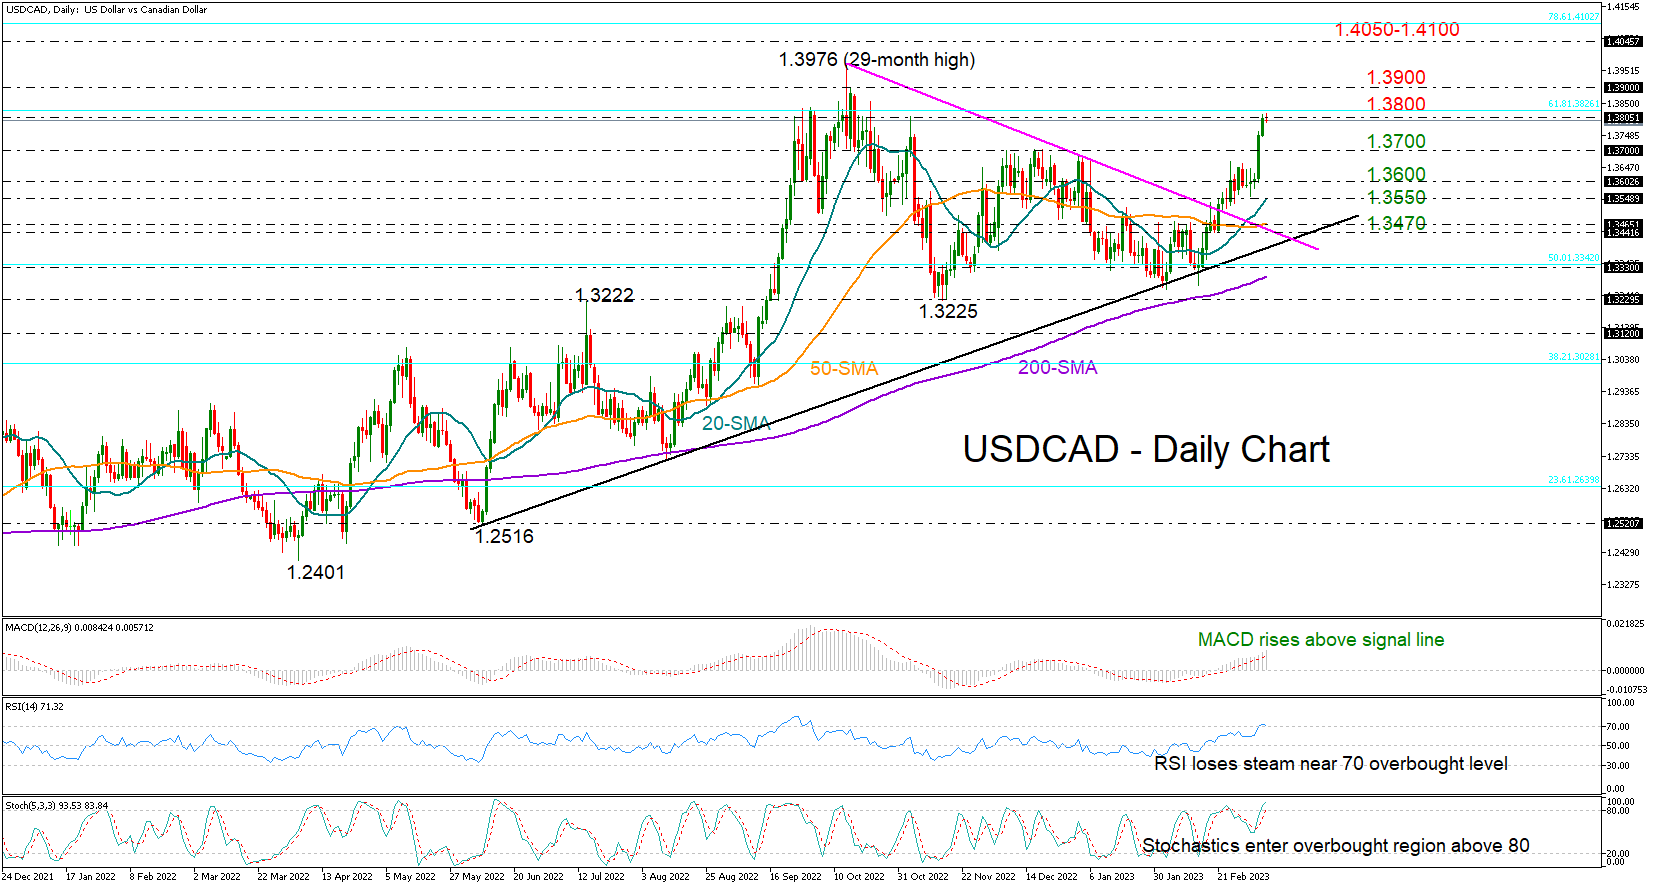
USDCAD skyrocketed in the wake of Powell’s hawkish rate hike comments, with the Bank of Canada adding more fuel to the rally on Thursday after saying that inflation may decelerate significantly in the middle of the year.
The pair rallied by 1.4% over the past two days to pause at a three-month high of 1.3816. This is where the uptrend from 2021 stalled last fall and a similar episode could play again as the RSI and the Stochastic oscillator flag overbought conditions. Yet, the indicators have not found a peak yet, while the MACD keeps trending upwards in the positive area, suggesting that there might be some extra bullish power in the market.
Strikingly, the 61.8% Fibonacci retracement of the 2020-2021 downtrend is also acting as resistance around 1.3800. Therefore, traders may wait for a clear close above that bar before they target the 1.3900 psychological level. If the uptrend resumes above October's 1.3976 top, resistance could next pop up somewhere between 1.4050 and the 78.6% Fibonacci of 1.4100.
In the bearish scenario, where the price gets rejected at 1.3800, the former resistance zone of 1.3700 may switch to a support area ahead of the 1.3600 number. The 20- and 50-day simple moving averages (SMAs) could next come into view at 1.3550 and 1.3470 respectively.
Summing up, USDCAD seems to be trading at a make-or-break point around 1.3800. A successful penetration higher would raise hopes for an uptrend resumption. Otherwise, the five-month-old consolidation phase could continue for longer.
GBP/JPY: Waiting for Growth in a Zigzag Pattern
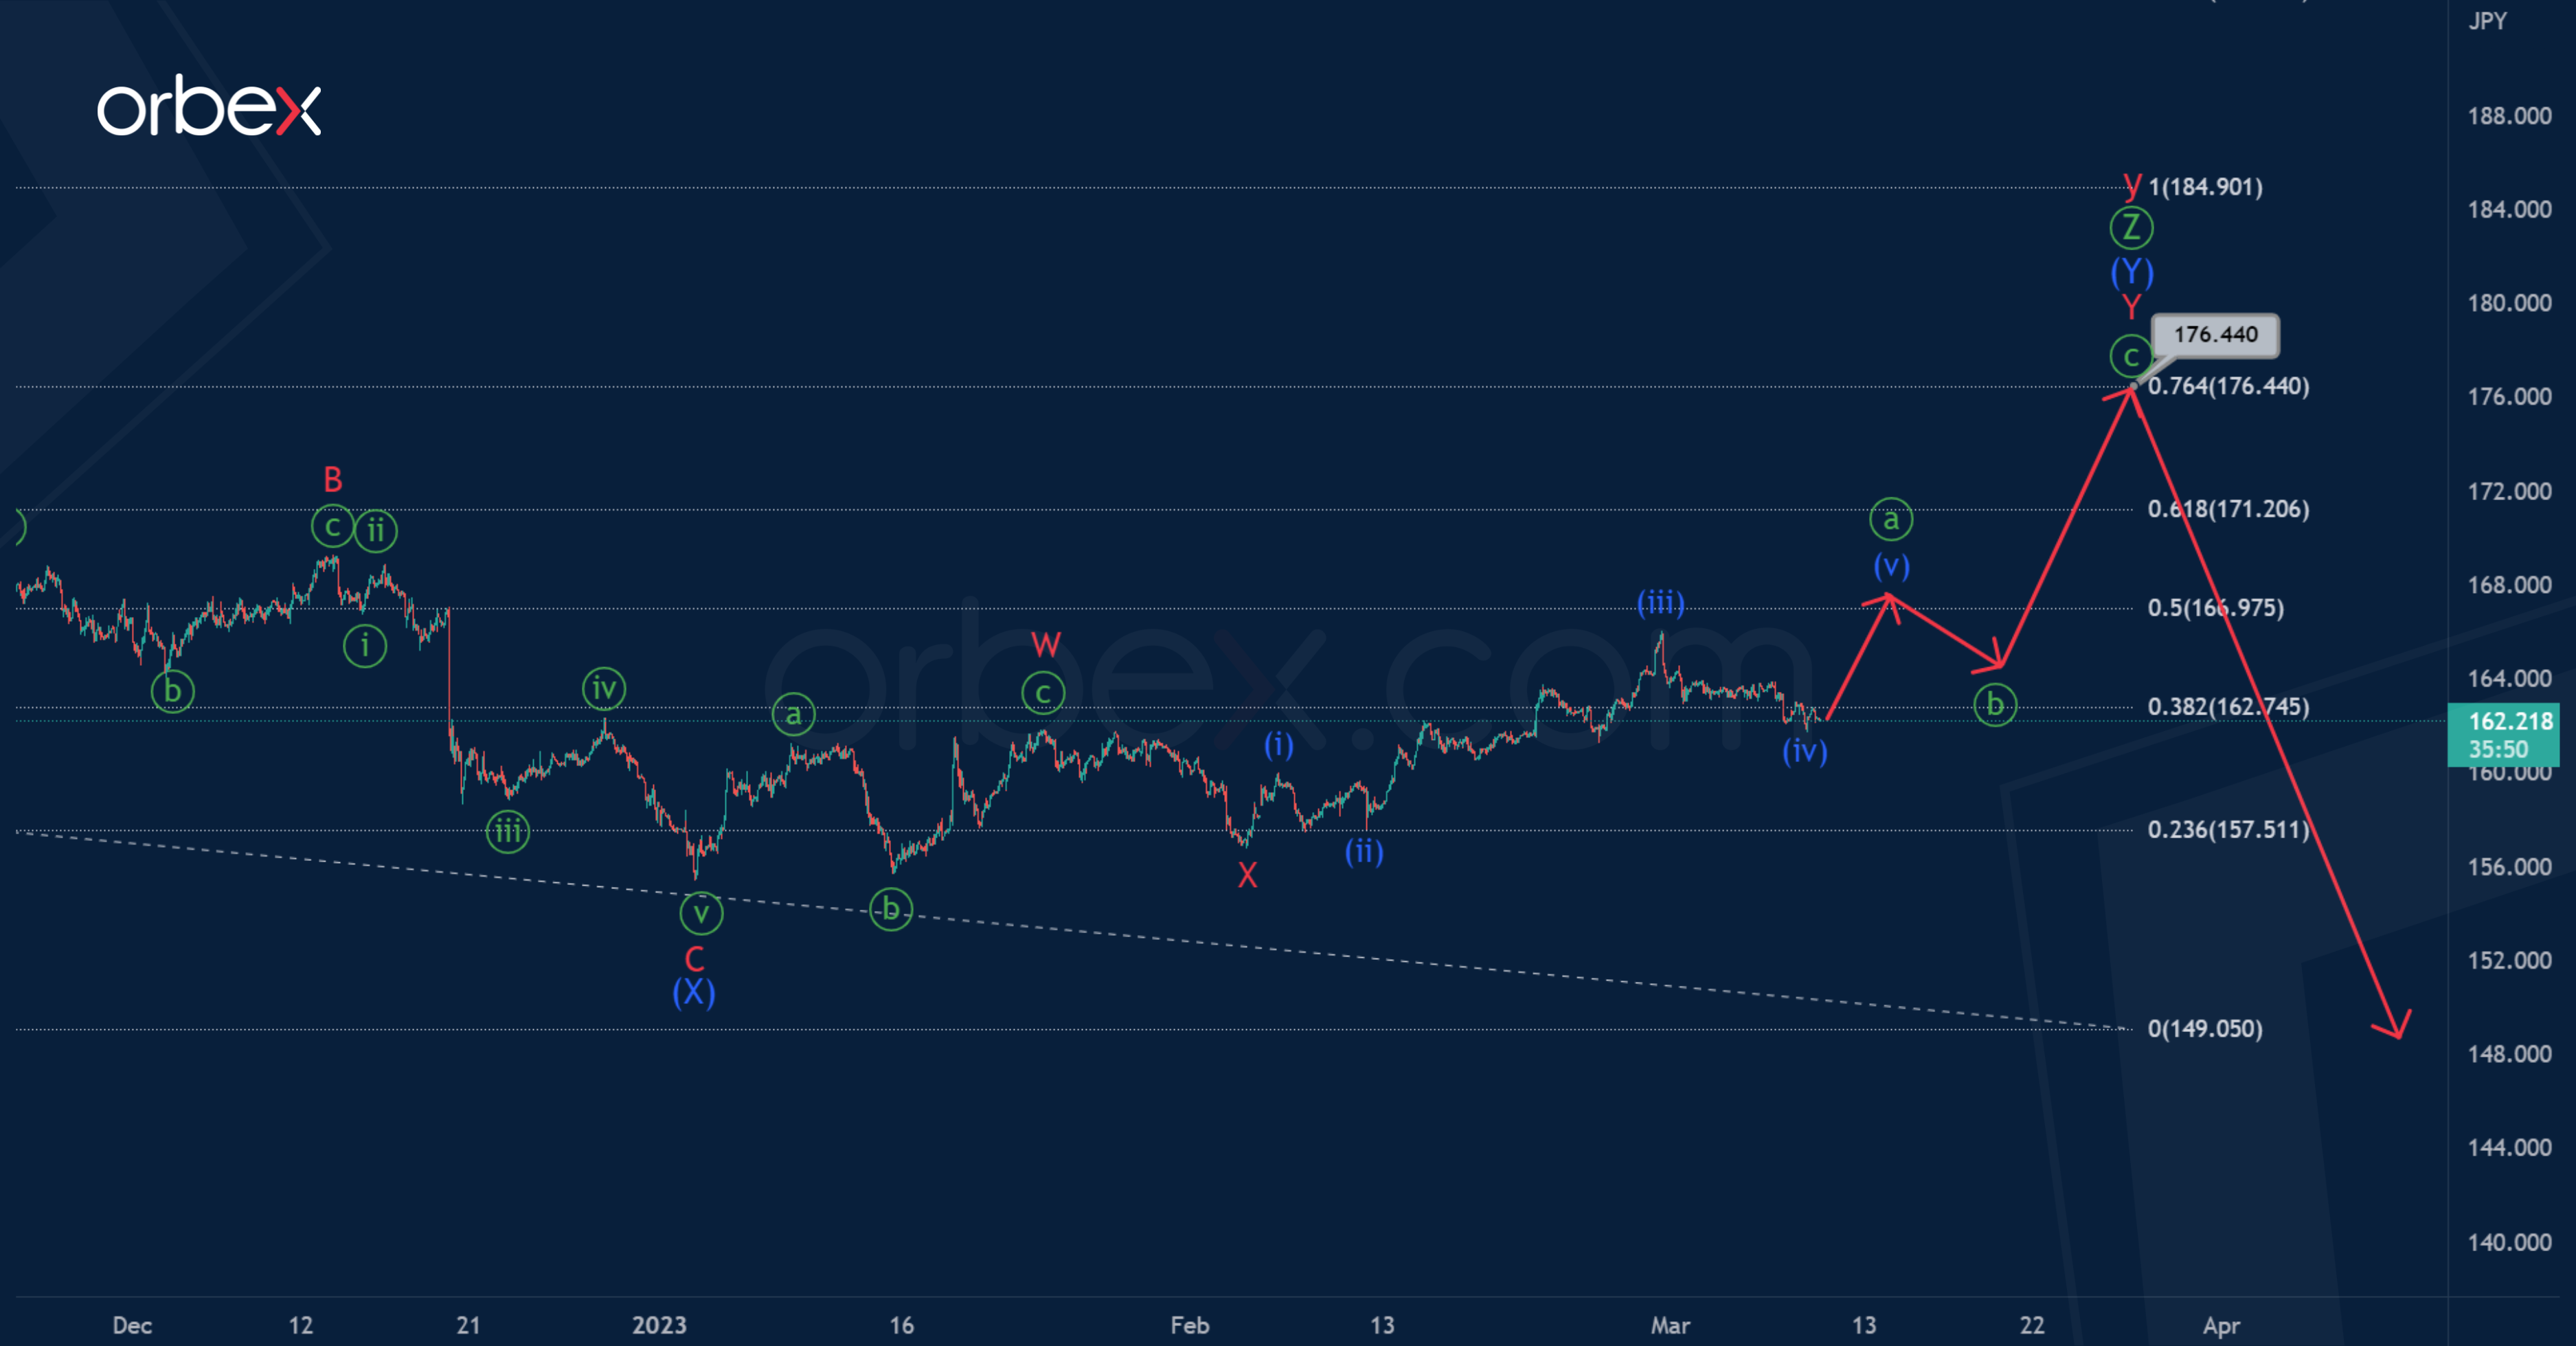
On the current chart for the GBPJPY pair, we see the final part of the triple zigzag Ⓦ-Ⓧ-Ⓨ-Ⓧ-Ⓩ inside a large wave y. As part of the triple zigzag, the last sub-wave Ⓩ is formed. It seems to take the form of a double zigzag (W)-(X)-(Y).
Perhaps two sub-waves (W) and (X) are completed. The last actionary wave (Y) is currently under development, it may take the form of a double zigzag W-X-Y. To complete this double zigzag , a minor sub-wave Y is needed.
The bulls are probably aiming at 176.44. At that level, wave (Y) will be at 76.4% of previous actionary wave (W).
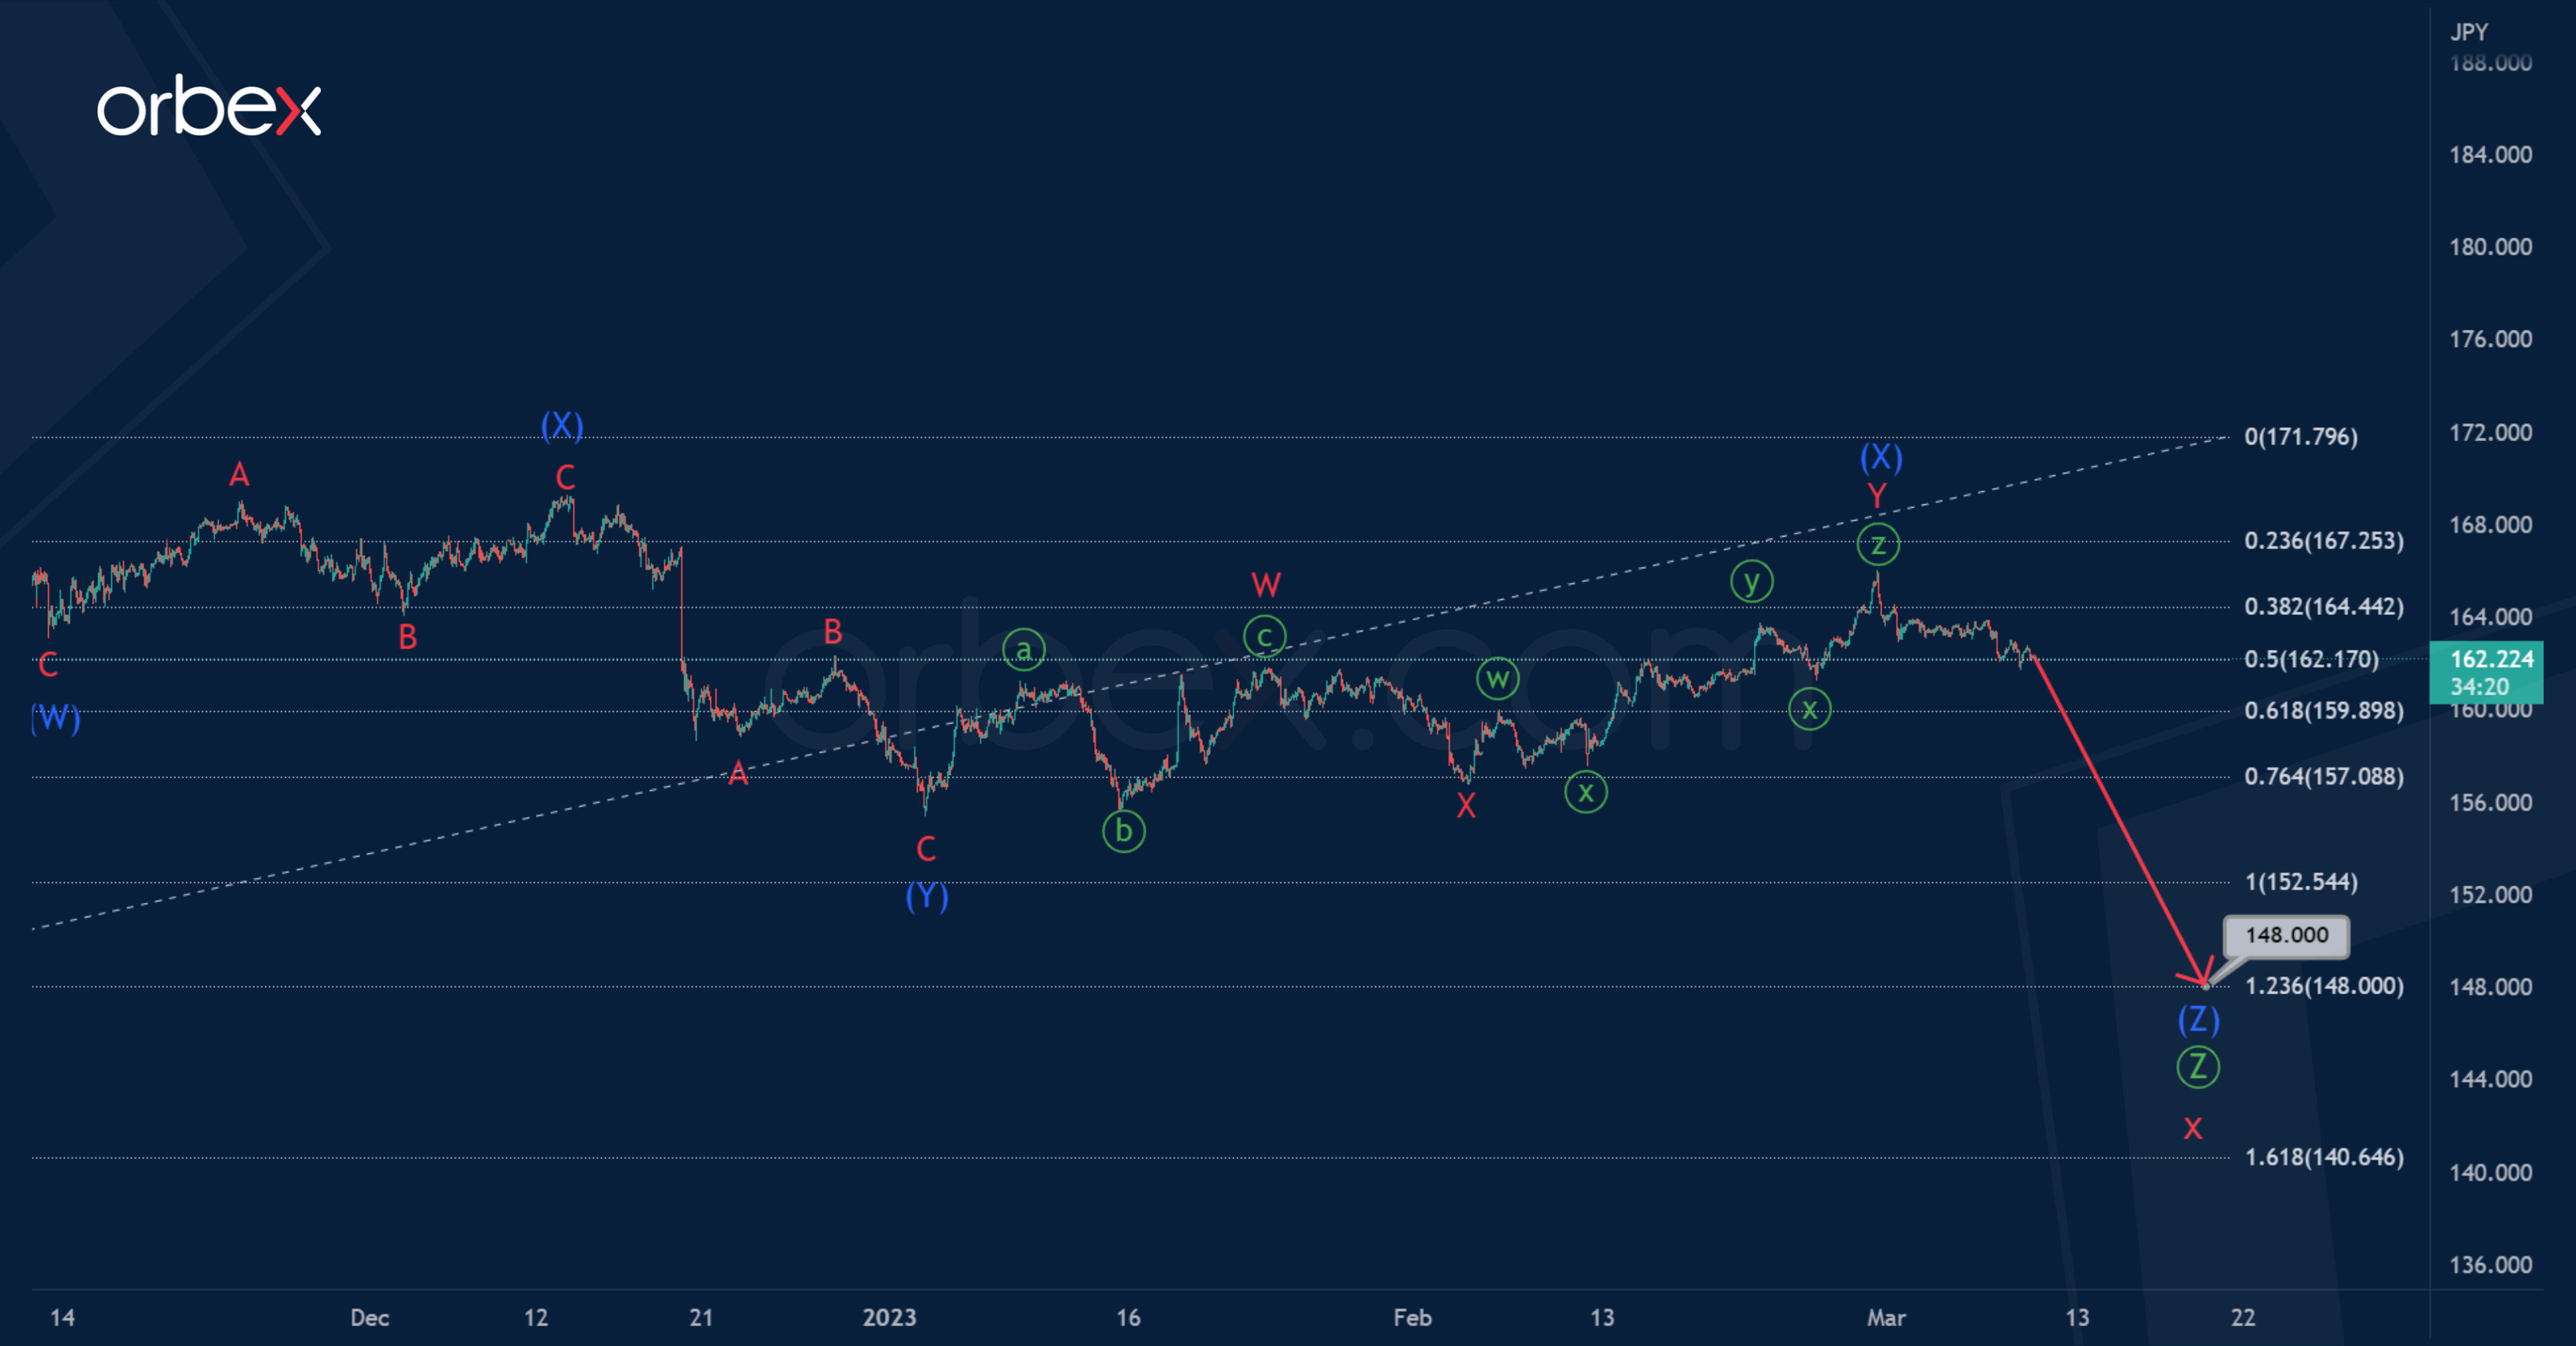
In the second scenario, a bearish intervening wave x is formed. It can end in the form of a triple zigzag, for the construction of which a final sub-wave Ⓩ is needed.
The current structure of the primary wave Ⓩ suggests an intermediate triple zigzag (W)-(X)-(Y)-(X)-(Z). The first four zigzag sub-waves have already been completed. In the next coming trading days, we are waiting for a drop in the sub-wave (Z) to 148.00.
At the specified level, wave Ⓩ will be at 123.6% of actionary wave Ⓨ.
GBP/JPY Daily Outlook
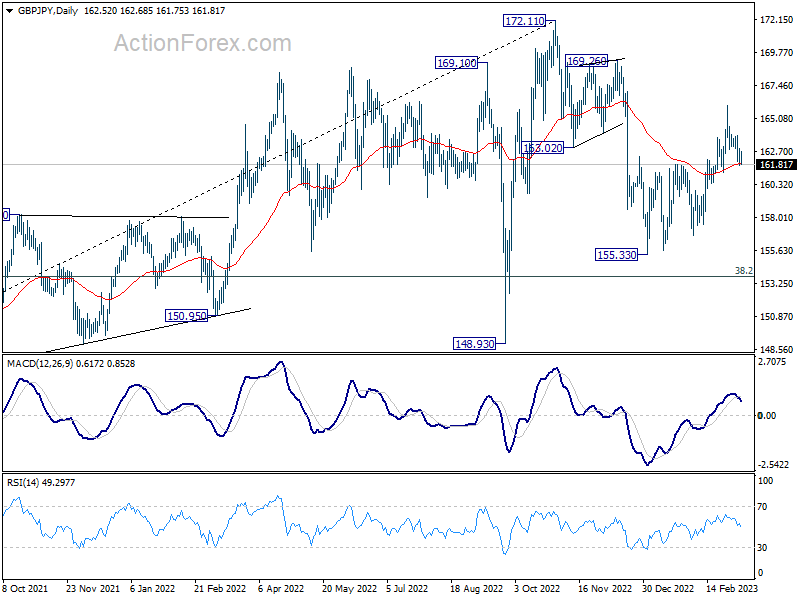
Daily Pivots: (S1) 161.94; (P) 162.47; (R1) 163.21; More...
Intraday bias in GBP/JPY remains neutral and outlook is unchanged. Further rally is still expected as long as 161.18 support holds. As noted before, corrective fall from 172.11 should have completed at 155.33 already. Break of 165.99 will target 169.26 resistance first, and then 172.11 high. However, break of 161.18 support will dampen this view and turn bias to the downside for 156.70 support instead.
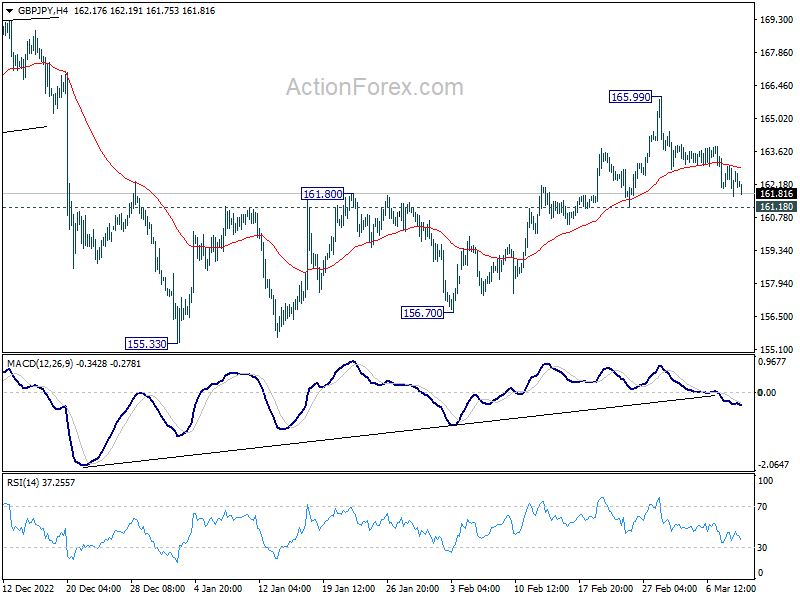
In the bigger picture, corrective decline from 172.11 medium term should have completed at 155.33. With 38.2% retracement of 123.94 (2020 low) to 172.11 (2022 high) at 153.70 intact, medium term bullishness is retained. That is, larger up trend from 123.94 (2020 low) is still in progress. Break of 172.11 high to resume such up trend is expected at a later stage.
EUR/JPY Daily Outlook
Daily Pivots: (S1) 144.29; (P) 144.77; (R1) 145.29; More....
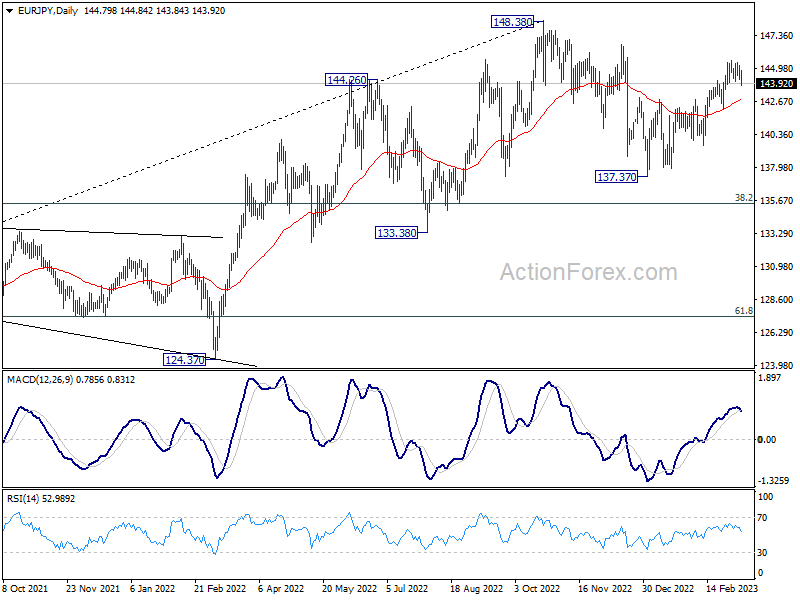
Intraday bias in EUR/JPY stays neutral and outlook is unchanged. Further rally is expected as long as 142.13 support holds. Corrective fall from 148.38 has completed at 137.37 already. Break of 145.55 will resume the rise from 137.37 to 146.71 resistance and then 148.38 high.
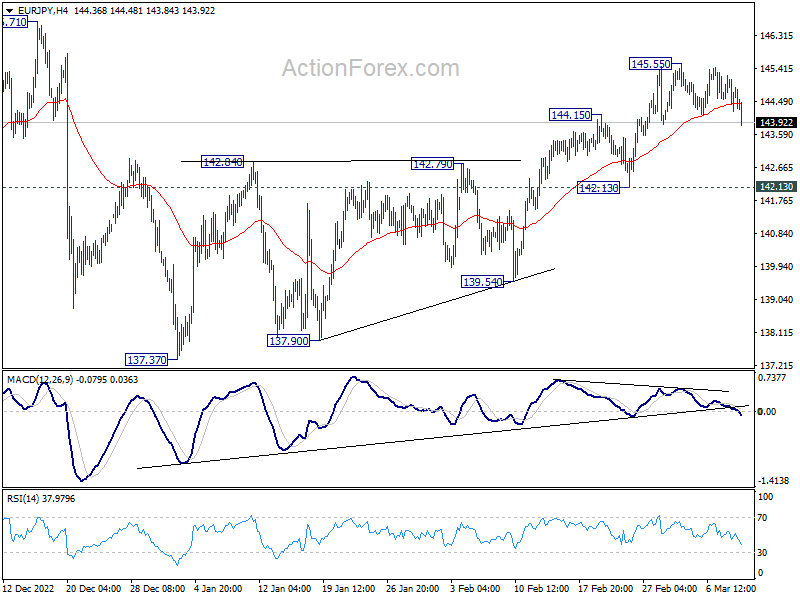
In the bigger picture, as long as 55 week EMA (now at 139.42) holds, larger up trend from 114.42 (2020 low) is still in progress for 149.76 long term resistance. However, firm break of 55 week EMA will bring deeper fall to 38.2% retracement of 114.42 to 148.38 at 135.40. Sustained break there will raise the chance of trend reversal, and target 61.8% retracement at 127.39.