Sample Category Title
NZD/USD Turns Red and At Risk of More Losses
Key Highlights
- NZD/USD started a major decline from well above the 0.6400 zone.
- A key bearish trend line is forming with resistance near 0.6180 on the 4-hours chart.
- GBP/USD extended its decline and tested the 1.1800 zone.
- EUR/USD might gain bearish momentum if it breaks the 1.0535 support.
NZD/USD Technical Analysis
The New Zealand Dollar started a major decline from well above 0.6400 against the US Dollar. NZD/USD declined below the 0.6250 support to move into a bearish zone.
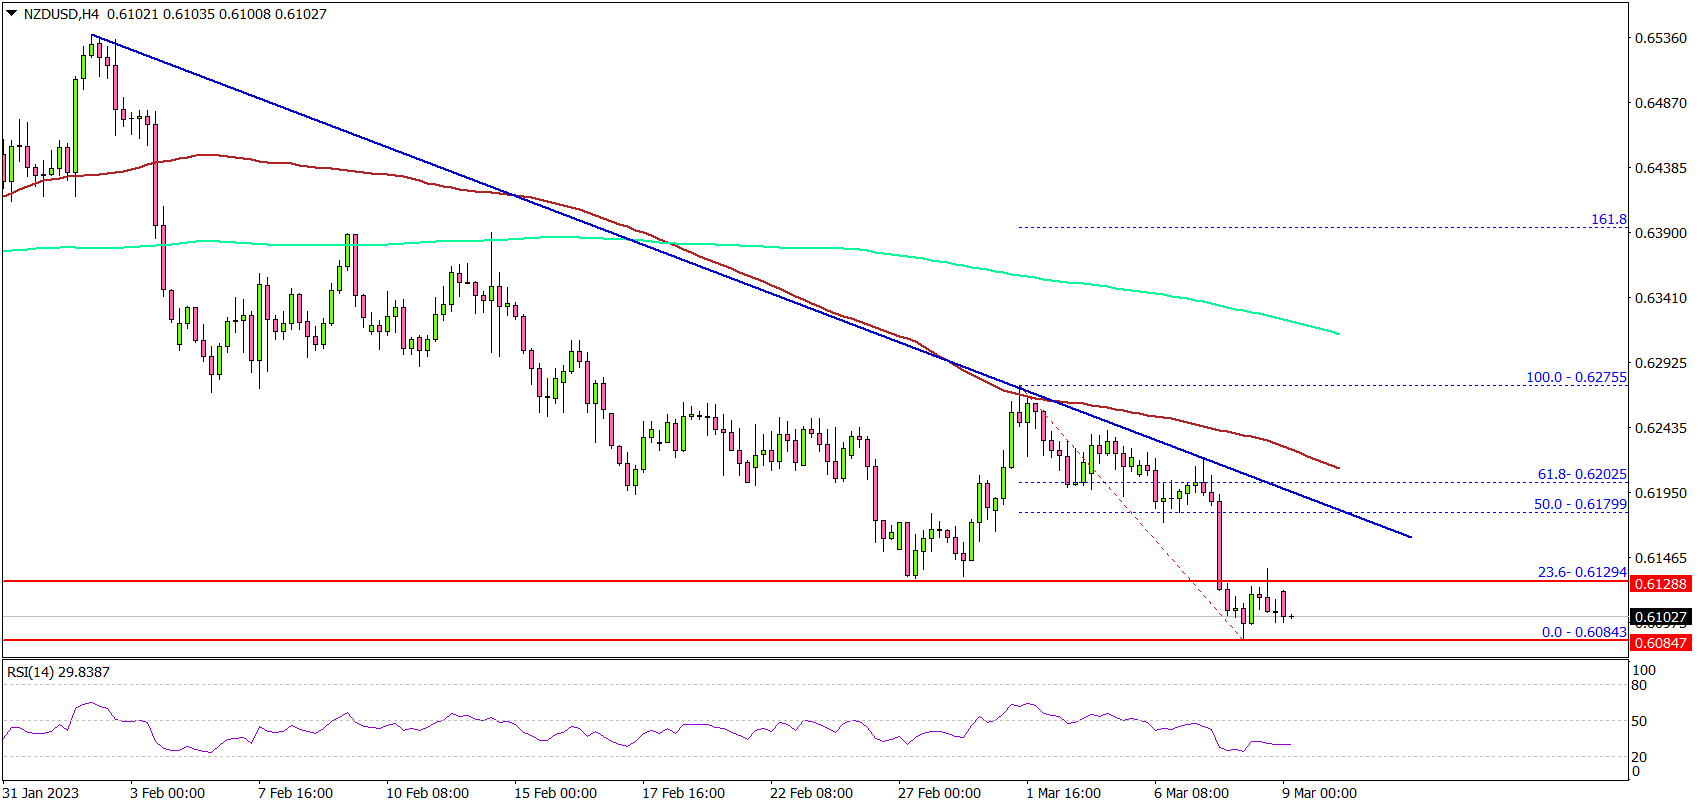
Looking at the 4-hours chart, the pair traded below the 0.6150 level, the 100 simple moving average (red, 4-hours), and the 200 simple moving average (green, 4-hours).
It traded as low as 0.6084 and is currently consolidating losses. An immediate resistance is near the 0.6130 level. It is near the 23.6% Fib retracement level of the downward move from the 0.6275 swing high to 0.6084 low.
The next major resistance is near the 0.6180 level. There is also a key bearish trend line forming with resistance near 0.6180 on the same chart.
The trend line is near the 50% Fib retracement level of the downward move from the 0.6275 swing high to 0.6084 low. A clear move above the 0.6180 resistance might start a steady increase towards the 0.6250 zone. Any more gains might send the pair towards 0.6300.
On the downside, an immediate support is near the 0.608 level. The next major support is near the 0.6050 level, below which there is a risk of a move towards the 0.6000 level.
Looking at GBP/USD, the pair tested the 1.1800 support zone and there are still chances of more downsides in the near term.
Economic Releases
- US Initial Jobless Claims - Forecast 195K, versus 190K previous.
USDCAD Wave Analysis
- USDCAD broke resistance level 1.3680
- Likely to rise to resistance level 1.3815
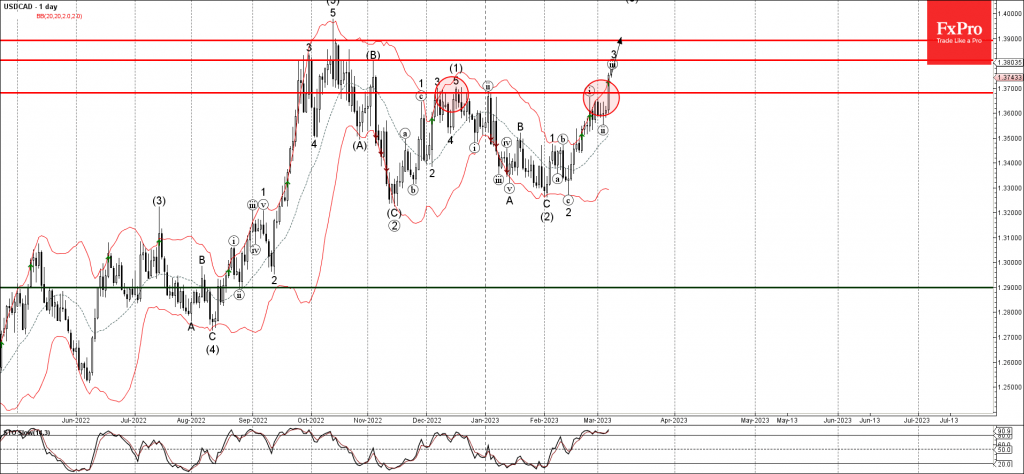
USDCAD currency pair recently broke above the resistance level 1.3680 (which has been reversing the price from the start of December).
The breakout of the resistance level 1.3680 accelerated the active impulse waves (iii) and 3.
USDCAD currency pair can be expected to rise further to the next resistance levels 1.3815 (monthly high from November) – followed by 1.3900.
WTI Crude Oil Wave Analysis
- WTI reversed from resistance level 80.80
- Likely to fall to support level 74.00
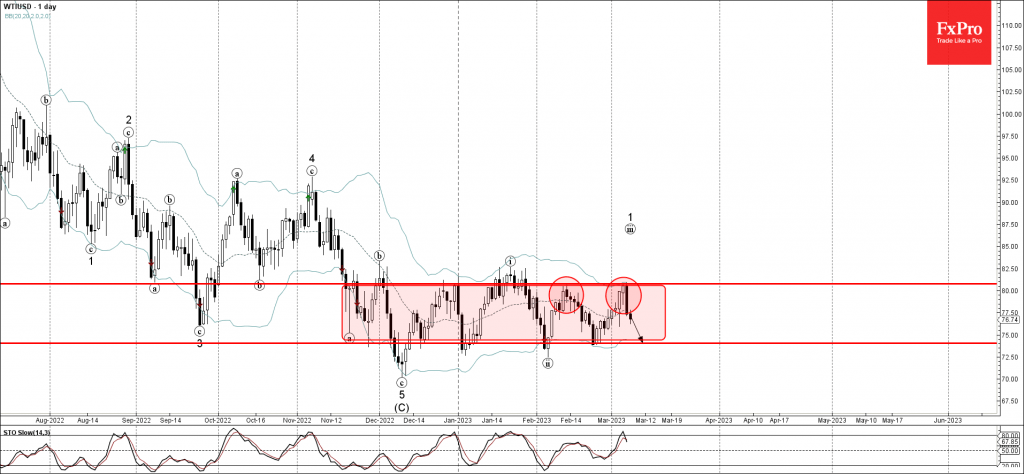
WTI crude oil recently reversed down from the resistance level 80.80 (upper border of the sideways price range inside which the price has been moving from November) – coinciding with the upper daily Bollinger Band.
The downward reversal from the resistance level 80.80 created the daily Japanese candlesticks reversal pattern Evening Star.
Given the strong daily downtrend, WTI crude oil can be expected to fall further to the next support level 74.00 (which has been reversing the price from December).
Bank of Canada Hits Pause
The Bank of Canada maintained the overnight rate at 4.5%, while stating that it will continue with Quantitative Tightening (QT).
Regarding recent economic data, the Bank stated that "restrictive monetary policy continues to weigh on household spending, and business investment has weakened alongside slowing domestic and foreign demand."
Although employment growth has been robust, it focused on how "with weak economic growth for the next couple of quarters, pressures in product and labour markets are expected to ease. This should moderate wage growth and also increase competitive pressures, making it more difficult for businesses to pass on higher costs to consumers."
All told, the inflation story remains intact, with the BoC still expecting "that CPI inflation will come down to around 3% in the middle of this year."
On the future path of policy, nothing changed as the Bank is "prepared to increase the policy rate further if needed."
Key Implications
Today was always set to be a placeholder meeting. The BoC had clearly communicated it would hit pause its hiking cycle and let the economy absorb the impact of 425 basis points of monetary policy tightening over the last year. The only thing to analyze was how firm the BoC would be on reinforcing the possibility of further hikes should incoming data prove stronger than expected. Today's announcement shows that the BoC isn't in a rush to start hiking again.
The BoC's actions over the last year have been effective in reining in inflation, with CPI expected to move from 5.9% year-on-year in January, to 3% this summer, and potentially towards 2% later this year. Higher rates have also taken a big bite out of the interest rate sensitive parts of the economy, with the real estate market still in the process of finding a bottom.
The issue is that this hasn't played out in the broader economy. There has been a significant upswing in the jobs market, with employers hiring at a breakneck pace. This is happening alongside a massive surge in government payouts to households, filling the wallets of Canadians and sending them on a spending spree. This is juicing the economy at a time when the BoC needs to see the opposite. Should this momentum continue, it could cause inflation to spike again, forcing the BoC back into hiking mode in the coming months.
BoC stands pat as conditional pause starts
BoC kept overnight rate unchanged at 4.50% as widely expected. It reiterated the stance to hold policy rate at current level, "conditional on economic developments evolving broadly in line with the MPR outlook". Nevertheless, BoC is "prepared to increase the policy rate further if needed."
In the accompanying statement, BoC noted, "the latest data remains in line with the Bank's expectation that CPI inflation will come down to around 3% in the middle of this year."
(BOC) Bank of Canada maintains policy rate, continues quantitative tightening
The Bank of Canada today held its target for the overnight rate at 4½%, with the Bank Rate at 4¾% and the deposit rate at 4½%. The Bank is also continuing its policy of quantitative tightening.
Global economic developments have evolved broadly in line with the outlook in the January Monetary Policy Report (MPR). Global growth continues to slow, and inflation, while still too high, is coming down due primarily to lower energy prices. In the United States and Europe, near-term outlooks for growth and inflation are both somewhat higher than expected in January. In particular, labour markets remain tight, and elevated core inflation is persisting. Growth in China is rebounding in the first quarter. Commodity prices have evolved roughly in line with the Bank's expectations, but the strength of China's recovery and the impact of Russia's war in Ukraine remain key sources of upside risk. Financial conditions have tightened since January, and the US dollar has strengthened.
In Canada, economic growth came in flat in the fourth quarter of 2022, lower than the Bank projected. With consumption, government spending and net exports all increasing, the weaker-than-expected GDP was largely because of a sizeable slowdown in inventory investment. Restrictive monetary policy continues to weigh on household spending, and business investment has weakened alongside slowing domestic and foreign demand.
The labour market remains very tight. Employment growth has been surprisingly strong, the unemployment rate remains near historic lows, and job vacancies are elevated. Wages continue to grow at 4% to 5%, while productivity has declined in recent quarters.
Inflation eased to 5.9% in January, reflecting lower price increases for energy, durable goods and some services. Price increases for food and shelter remain high, causing continued hardship for Canadians. With weak economic growth for the next couple of quarters, pressures in product and labour markets are expected to ease. This should moderate wage growth and also increase competitive pressures, making it more difficult for businesses to pass on higher costs to consumers.
Overall, the latest data remains in line with the Bank's expectation that CPI inflation will come down to around 3% in the middle of this year. Year-over-year measures of core inflation ticked down to about 5%, and 3-month measures are around 3½%. Both will need to come down further, as will short-term inflation expectations, to return inflation to the 2% target.
At its January decision, the Governing Council indicated that it expected to hold the policy interest rate at its current level, conditional on economic developments evolving broadly in line with the MPR outlook. Based on its assessment of recent data, Governing Council decided to maintain the policy rate at 4½%. Quantitative tightening is complementing this restrictive stance. Governing Council will continue to assess economic developments and the impact of past interest rate increases, and is prepared to increase the policy rate further if needed to return inflation to the 2% target. The Bank remains resolute in its commitment to restoring price stability for Canadians.
Information note
The next scheduled date for announcing the overnight rate target is April 12, 2023. The Bank will publish its next full outlook for the economy and inflation, including risks to the projection, in the Monetary Policy Report at the same time.
Sunset Market Commentary
Markets
Global markets today took a breather after yesterday’s sharp repositioning. At his hearing before the Senate, Fed Chair Powell admitted that rates most likely will have to be raised further than assumed in the December dots. Persistent stronger activity/demand and stubbornly high services inflation also force the Fed to reconsider stepping up the pace of rate hikes from 25 to 50 bps, conditional to this week’s labour market and next week’s inflation data. Today’s ADP report at least didn’t show the cooldown in the labour market the Fed is looking for. After a slightly slower net private sector job growth of 119k in January, growth at 242k returned toward the post-pandemic average. After finishing this report, the JOLTS job openings data will provide further insight on labour market tightness. For now, the direct impact of the ADP report markets was limited. Investors apparently don’t trust the link/correlation between ADP and Friday’s official payrolls. US yields this morning tried to build on yesterday’s move with the US 2-y yield extending its journey north of 5.0%. However, the upside momentum gradually ebbed. US yields in a daily perspective are changing between 2.5 bps (2-y) and 5.5 bps (10), further inverting the yield curve. At 108 bps, the negative difference between the US 10 and 2-y yield currently the steepest since 1981 (Volcker era). European/German yields, which didn’t follow the US move yesterday, this time also didn’t try a catching up move. In a similar inversion move, the German 2-yield gains 1 bp while 10 & 30’s are ceding 6 bps. Remarkably, (10-y) intra-EMU spreads versus German remain a place of calm despite recent sharp rise in core yields. The Italian/German yield spread today even eases 5 bps. Even as the steep curve inversion is widely seen as a harbinger of a recession further out in time, European and US equities today again avoid further losses (Euro Stoxx 50 +0.2%). The S&P 500 opens little changed.
On FX markets, the dollar is losing marginally after yesterday’s rally (DXY 105.60, EUR/USD 1.0545, USD/JPY 136.9) awaiting more high profile news to attack nearby resistance (e.g. EUR/USD 1.0484; USD/JPY 138.17). Sterling is holding a tight range near the EUR/GBP 0.89 pivot. New BoE MPC member Dhingra in a speech warned that the BoE might overtighten when raising rates further, risking to damage an already weak economy. News Headlines
Hungarian inflation decelerated in February for the first time in a year and a half. Headline prices rose 25.4% y/y (0.8% m/m) compared to 25.7% in January. Core inflation rose 25.2% compared to one year ago, the same as in January. Registering the highest increases were electricity, gas and other fuels (49%), closely followed by food (43.3%). Service charges were up by 11.6%. The Hungarian central bank core inflation gauges vary between 19.3% and 25.1% y/y with two out of the three measures still higher than last month. Despite headline inflation showing very premature signs of topping, the central bank plans to keep policy tight for the time being by leaving the overnight tender rate at a whopping 18%. In this regard, MNB deputy governor Virag in a speech before parliament today said the MNB will continue to carry out “disciplined policy”. In stealthy criticism to the government’s spending and price cap policies, he also said that “all” economic policy should serve to reduce inflation. MNB president Matolcsy, also appearing before parliament, put it a tad more bluntly, saying that the central bank is at odds with the government. “It’s easy to spoil” the situation, but harder to “amend” it. The quotes triggered more volatility in the forint than the CPI number did. EUR/HUF briefly rose above 380 before paring gains back to 379.69 currently.
Riksbank’s First Deputy Governor Breman is worried that it may take longer to get Swedish inflation back to target than earlier expected. She’s seeing signs of an economic slowdown and demand weakening, but the question is how much demand actually needs to ease before the effect is visible on inflation. The Riksbank hiked by 50 bps to 3% in February and guided markets towards further hikes in the near future. Breman said she’ll most likely support another 25 or 50 bps rate hike in April. Swedish money markets meanwhile have adjusted their terminal rate expectations to 4%+. Given the ECB will probably at least match that level, the relative interest rate support for the SEK is limited. At 11.27 currently, EUR/SEK is trading near recent multiyear highs.
USD/JPY: Bulls or Bears? Who Will Dominate in the Near Future
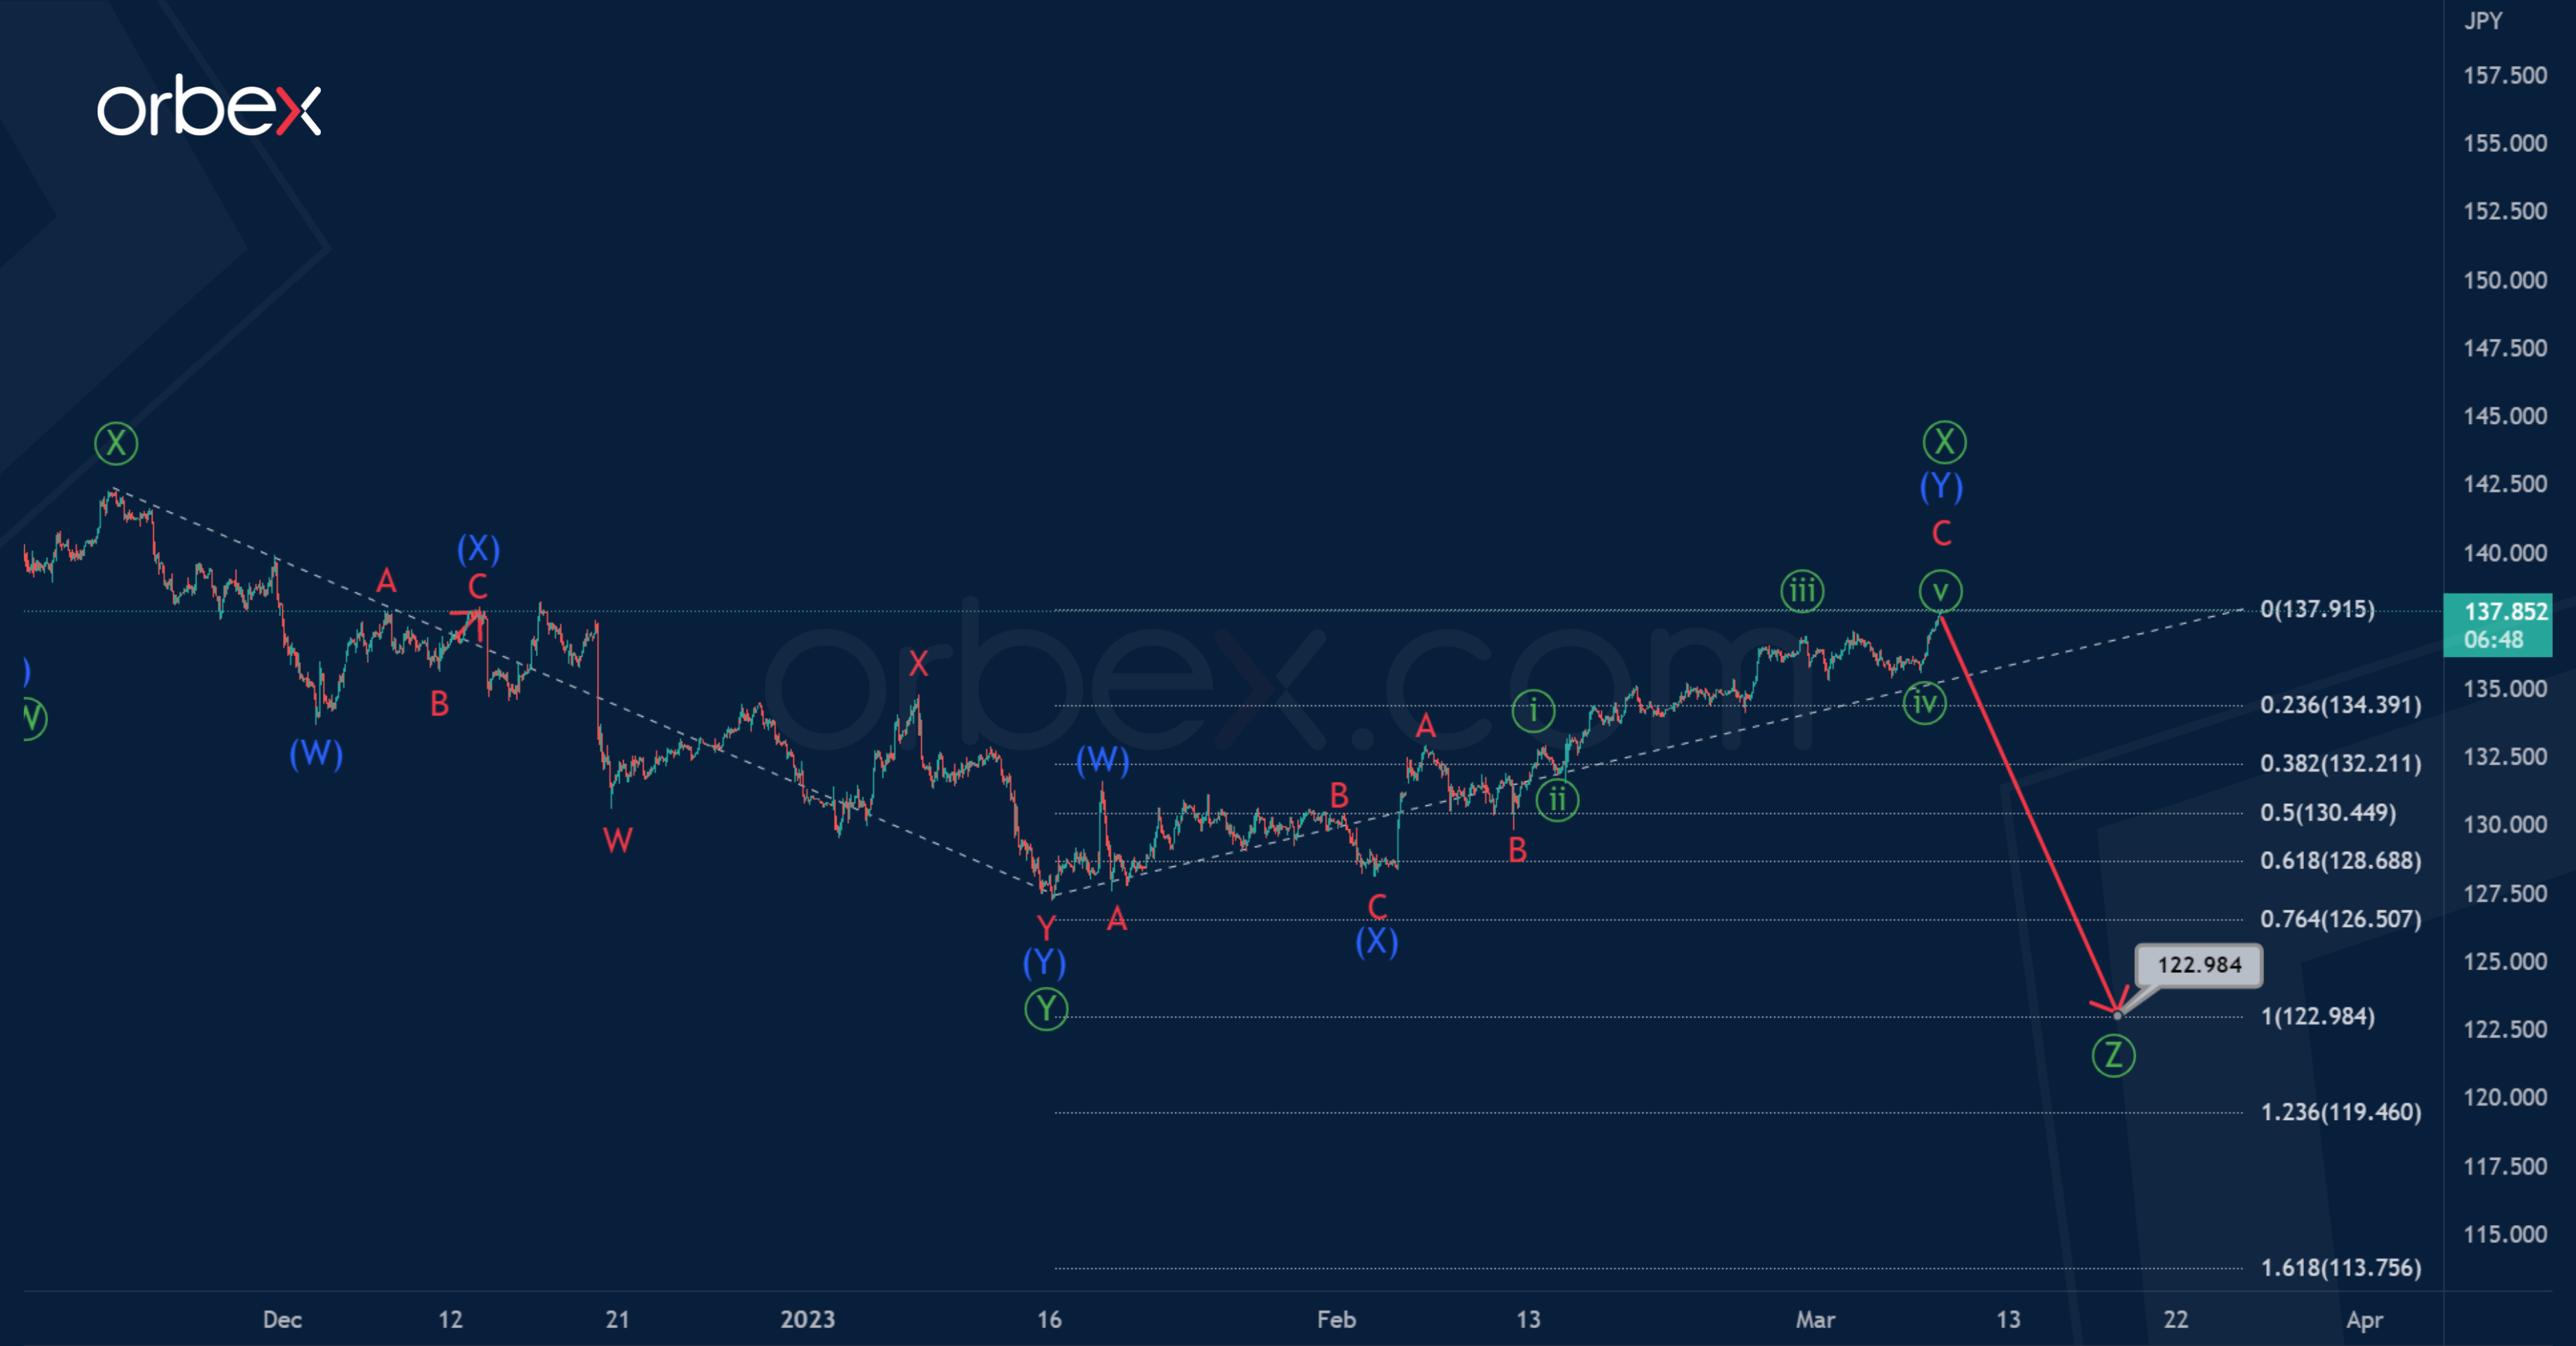
The USDJPY pair, as in the previous review, which was a few weeks ago, continues to form a bearish trend. The trend takes the form of a triple zigzag, in which the sub-waves are completed.
The wave is a double zigzag consisting of intermediate sub-waves (W)-(X)-(Y).
If this scenario is confirmed, a fall in the wave will begin in the near future towards the 122.98 area. At that level, primary wave will be at 76.4% of actionary wave.
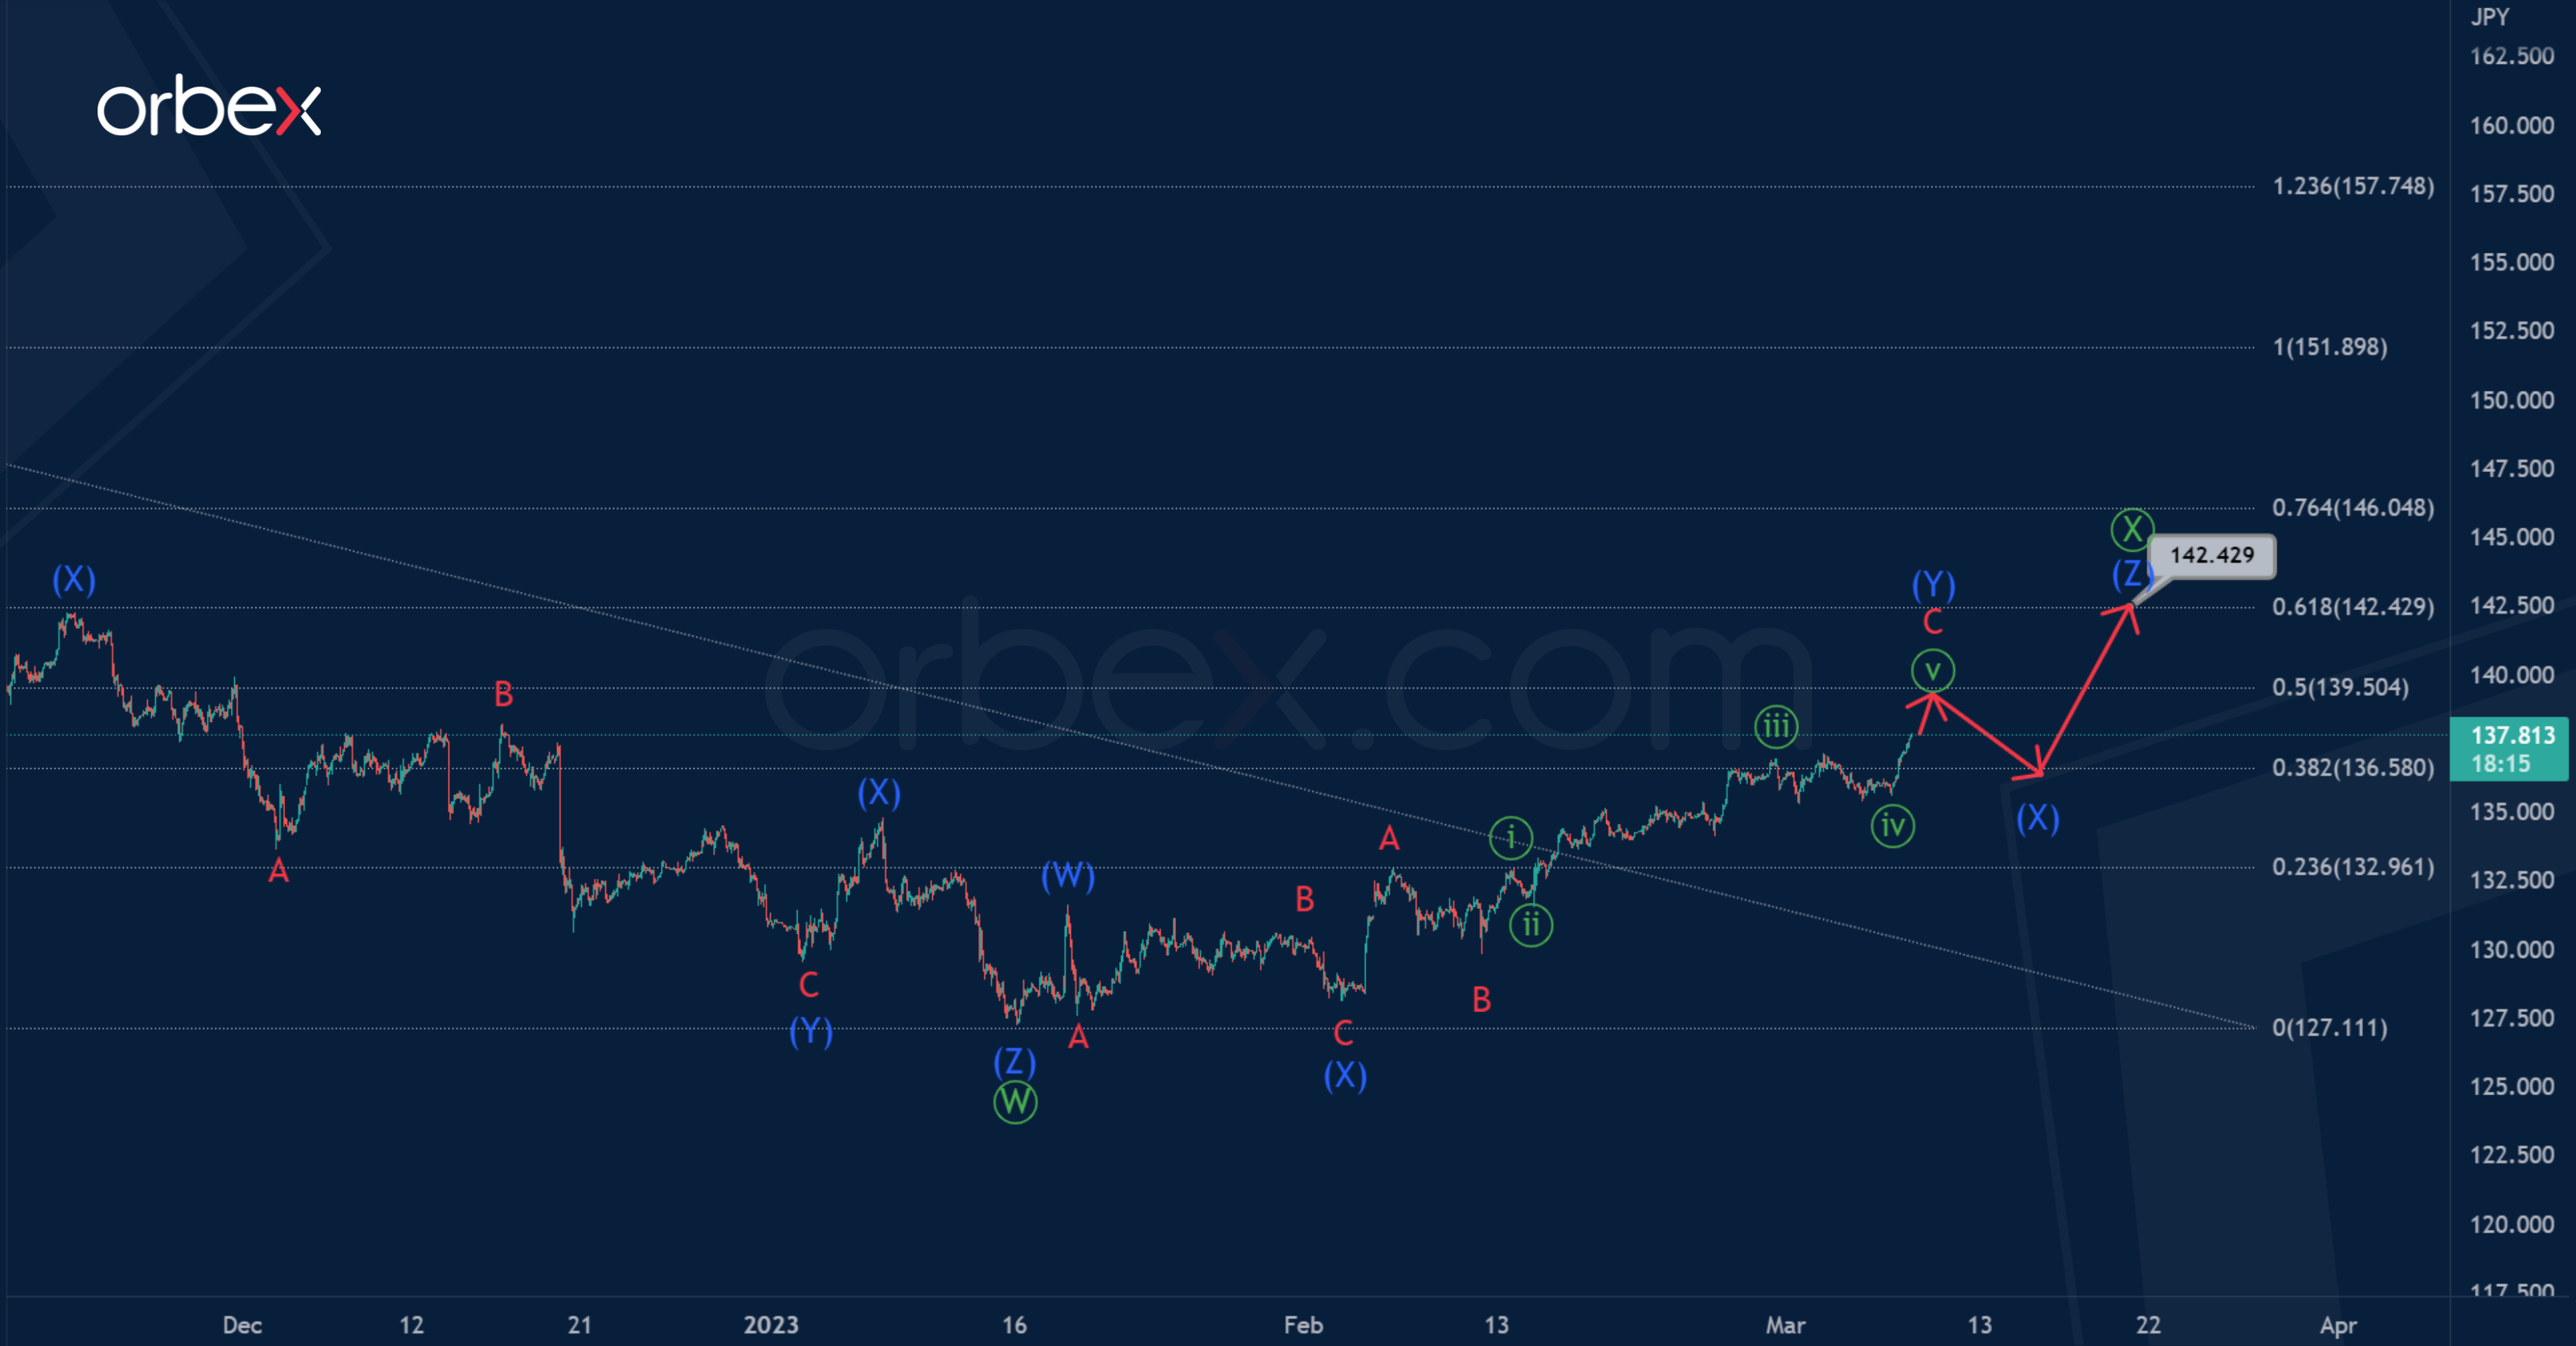
In the second variant, a bearish double zigzag of the primary degree is under construction, in which only the first actionary wave is completed. Wave is currently under development.
The intervening wave can take the form of a triple zigzag (W)-(X)-(Y)-(X)-(Z), as shown in the chart. It is possible that in the near future the growth will continue in the direction of the price mark of 142.42.
At that level, wave will be at 61.8% along the Fibonacci lines of wave.
EUR/USD Mid-Day Outlook
Daily Pivots: (S1) 1.0498; (P) 1.0597; (R1) 1.0647; More...
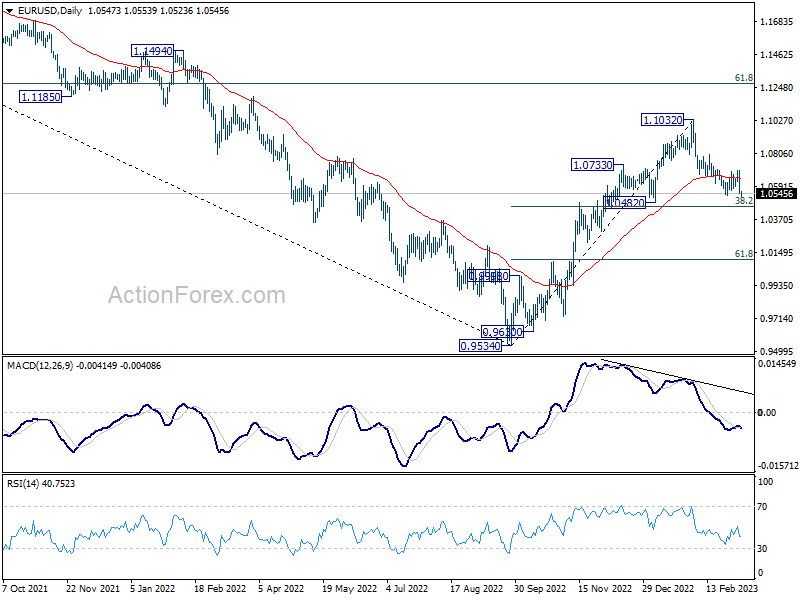
Intraday bias in EUR/USD remains on the downside as fall from 1.1032 is in progress. Next target is 38.2% retracement of 0.9534 to 1.1032 at 1.0463. Strong support could be seen there to bring reversal. But break of 1.0693 resistance is needed to indicate short term bottoming first. Meanwhile, sustained break of 1.0463 will carry larger bearish implications.
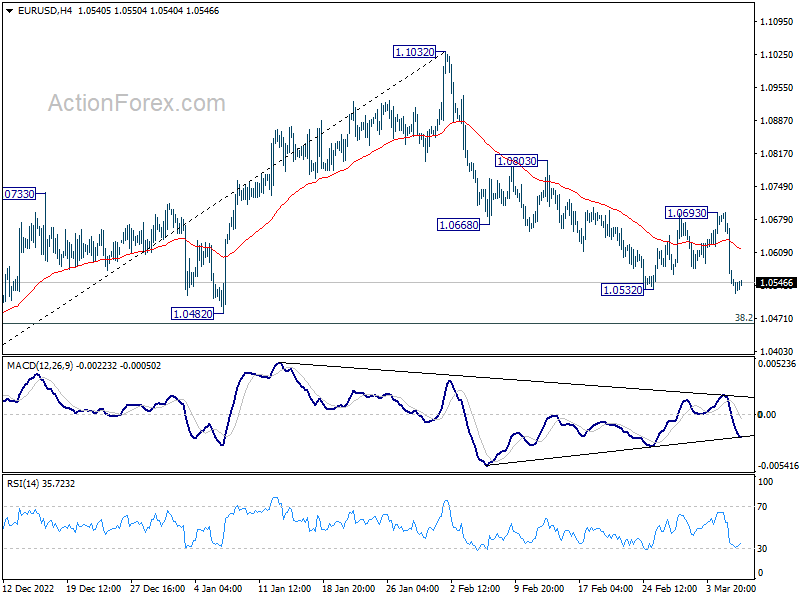
In the bigger picture, as long as 1.0482 support holds, rise from 0.9534 (2022 low) should continue to 61.8% retracement of 1.2348 (2021 high) to 0.9534 at 1.1273. However, sustained break of 1.0482 will bring deeper fall to 61.8% retracement of 0.9534 to 1.1032 at 1.0106, even as a corrective pull back.