

Sample Category Title
AUD/USD Weekly Report
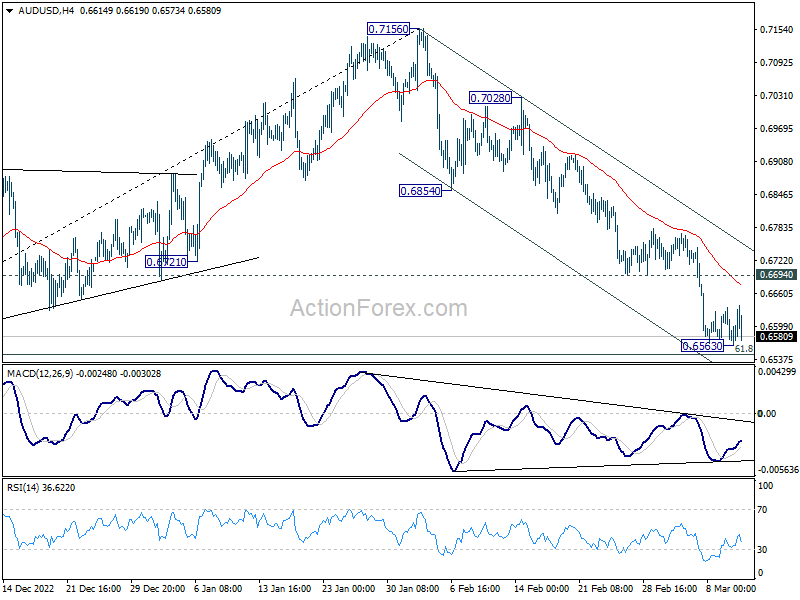
AUD/USD's decline from 0.7156 extended to as low as 0.6563 last week but lost momentum. Initial bias stays neutral this week first. Focus is on whether 0.6546 fibonacci level would provide strong support to bring reversal. On the upside, break of 0.6694 support turned resistance will indicate short term bottoming, and turn bias back to the upside for rebound to 55 day EMA (now at 0.6808). However, sustained break of 0.6546 will carry larger bearish implication and target 0.6169 low.
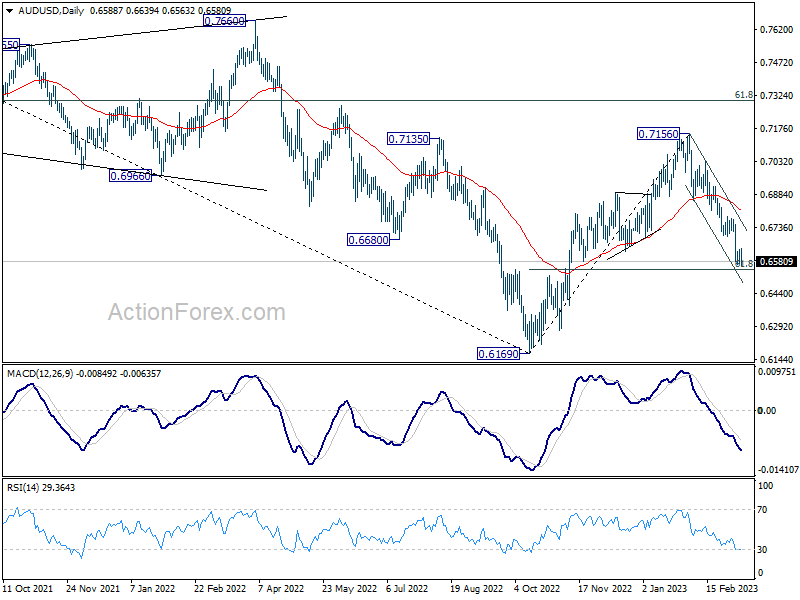
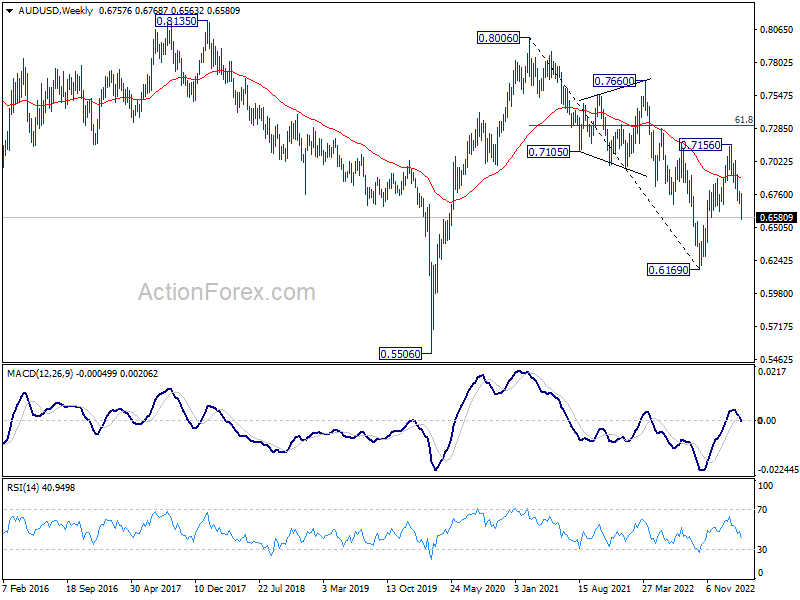
In the bigger picture, rise from 0.6169 (2022 low) has completed at 0.7156, after rejection by 55 month EMA (now at 0.7158). Deeper decline would then be see back to 61.8% retracement of 0.6169 to 0.7156 at 0.6546, even as a corrective fall. Sustained break there will raise the chance of long term down trend resumption through 0.6169 low.
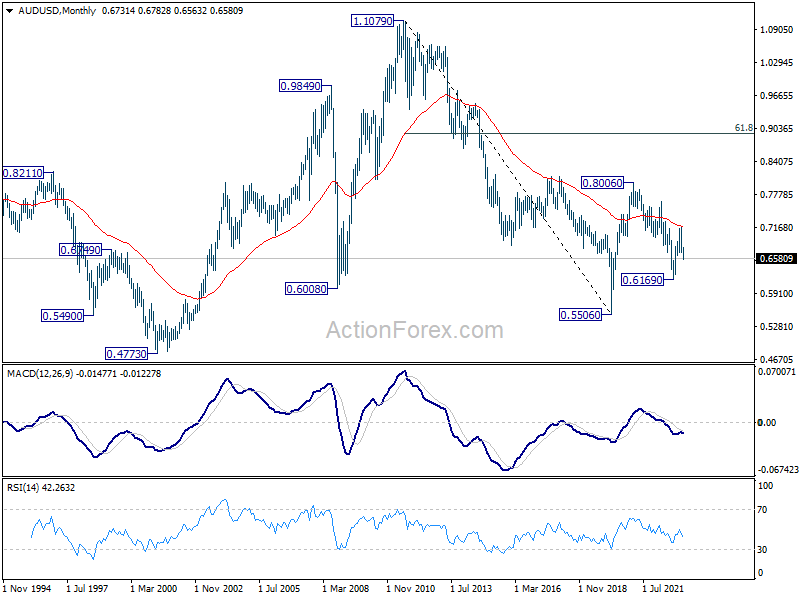
In the long term picture, initial rejection by 55 month EMA (now at 0.7164) retains long term bearishness. That is, down trend from 1.1079 (2011 high) could still resume through 0.5506 (2020 low) on resumption.
USD/CAD Weekly Outlook
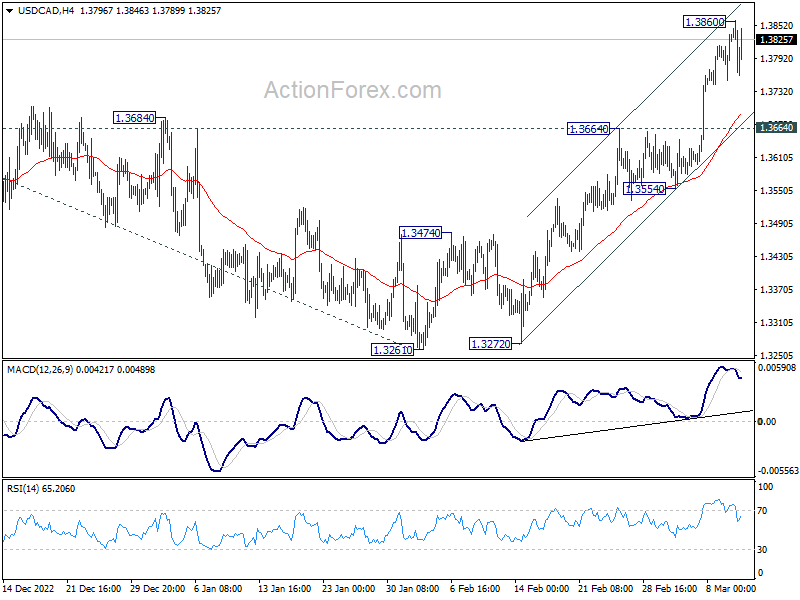
USD/CAD's rally resumed last week and reached as high as 1.3860. But a temporary top was formed with subsequent retreat. Initial bias is neutral this week for consolidations first. Downside of retreat should be contained by 1.3664 resistance turned support to bring another rally. Break of 1.3860 will target 1.3976 high.
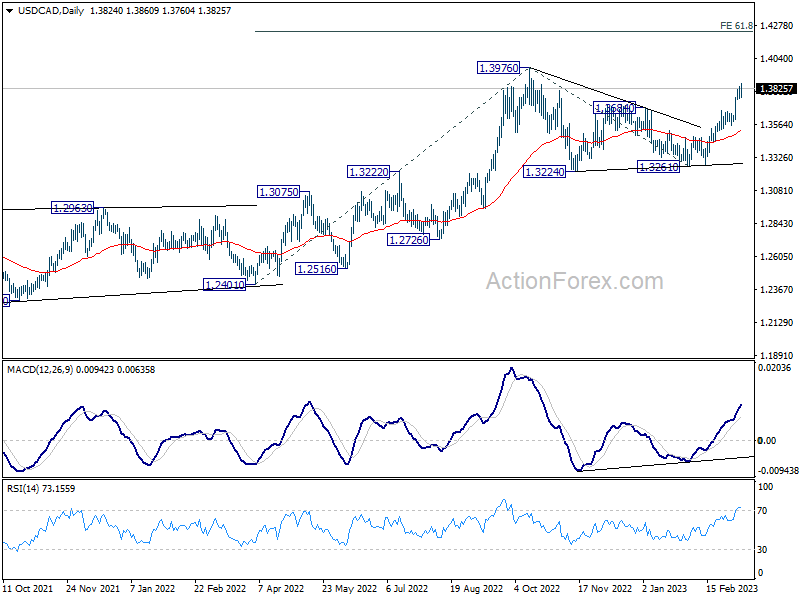
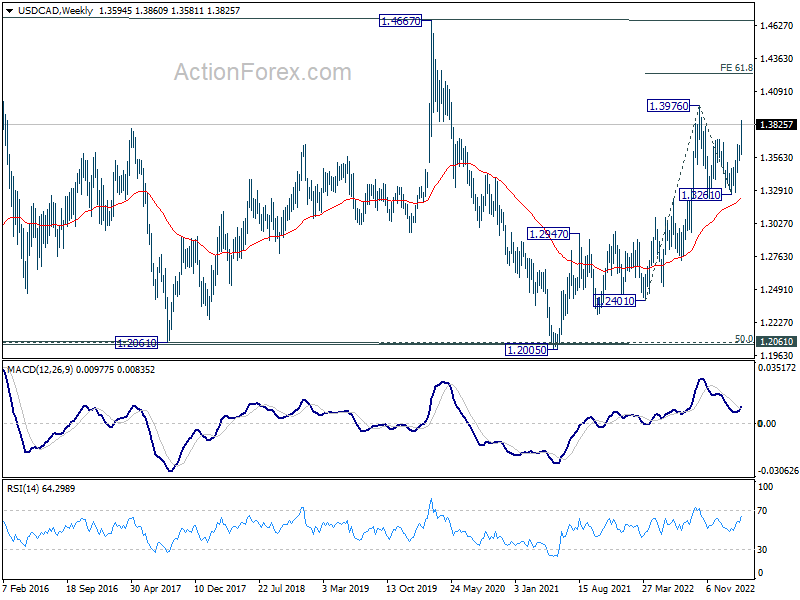
In the bigger picture, the up trend from 1.2005 (2021 low) is still in progress. Break of 1.3976 will confirm resumption and target 61.8% projection of 1.2401 to 1.3976 from 1.3261 at 1.4234. Firm break there will pave the way to long term resistance zone at 1.4667/89 (2016, 2020 highs). On the downside, break of 1.3261 support is needed to confirm medium term topping. Otherwise, outlook will remain bullish even in case of deep pull back.
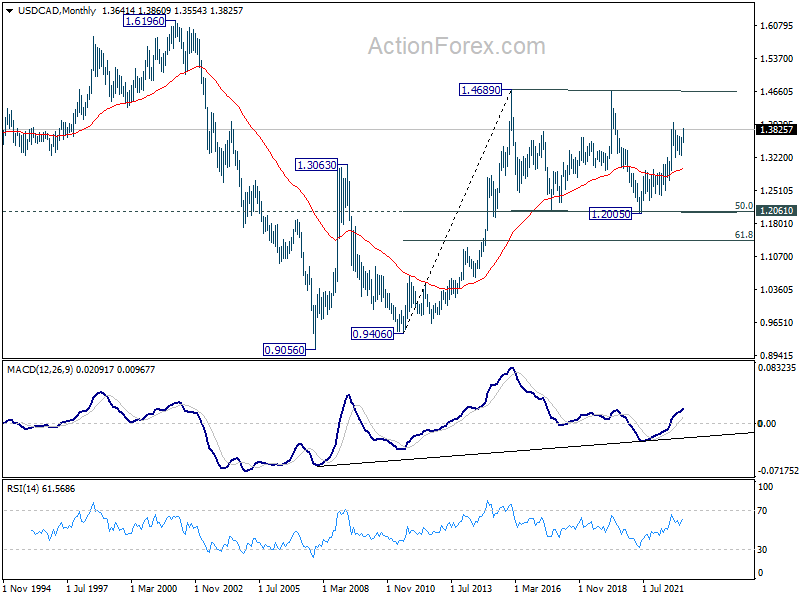
In the longer term picture, price actions from 1.4689 (2016 high) are seen as a consolidation pattern only, which might have completed at 1.2005. That is, up trend from 0.9506 (2007 low) is expected to resume at a later stage. This will remain the favored case as 55 month EMA (now at 1.3003) holds.
GBP/JPY Weekly Outlook
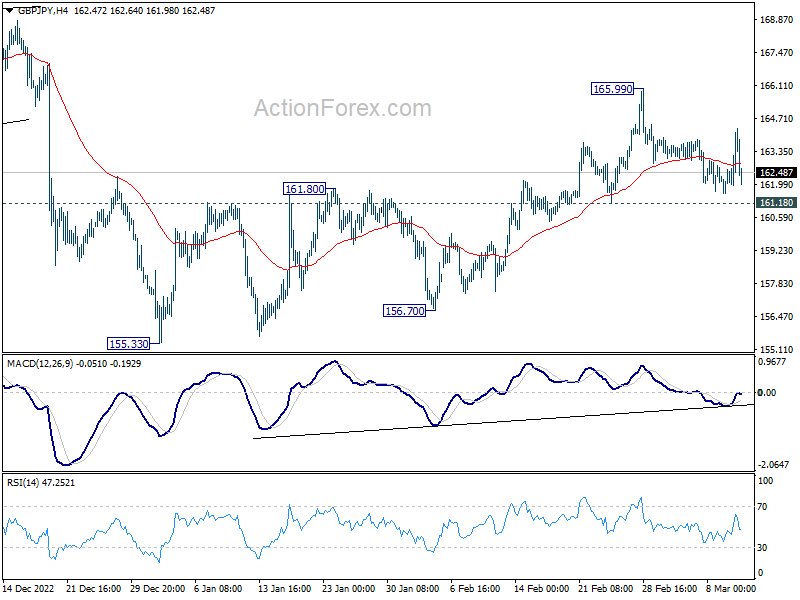
GBP/JPY stayed in consolidation below 165.99 last week and outlook is unchanged. Initial bias remains neutral this week first. Further rally is still expected as long as 161.18 support holds. As noted before, corrective fall from 172.11 should have completed at 155.33 already. Break of 165.99 will target 169.26 resistance first, and then 172.11 high. However, break of 161.18 support will dampen this view and turn bias to the downside for 156.70 support instead.
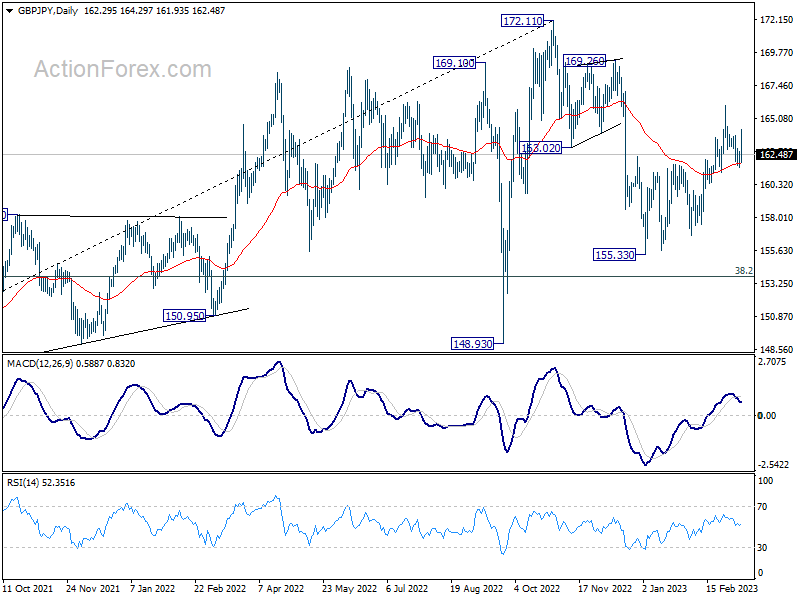
In the bigger picture, corrective decline from 172.11 medium term should have completed at 155.33. With 38.2% retracement of 123.94 (2020 low) to 172.11 (2022 high) at 153.70 intact, medium term bullishness is retained. That is, larger up trend from 123.94 (2020 low) is still in progress. Break of 172.11 high to resume such up trend is expected at a later stage.
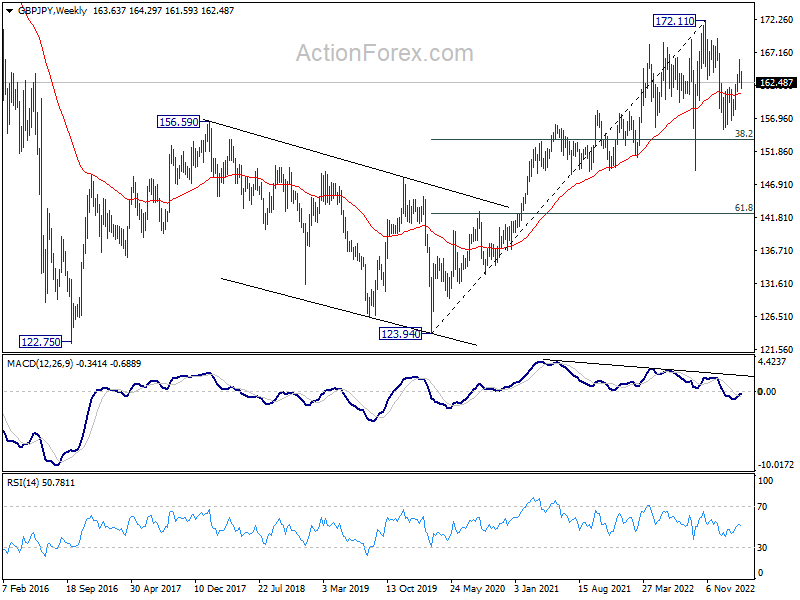
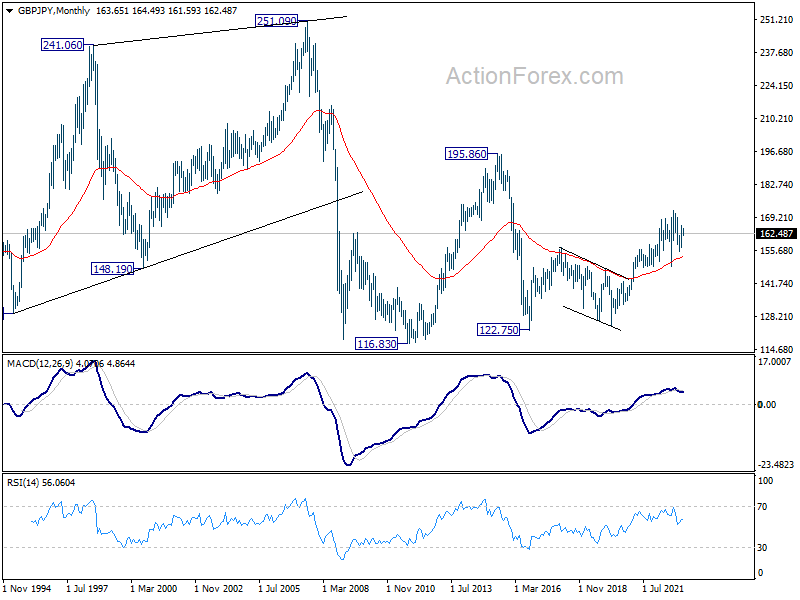
In the longer term picture, as long as 55 month EMA (now at 153.17) holds, rise from 122.75 could still extend higher at a later stage to 195.86 (2015 high).
EUR/JPY Weekly Outlook
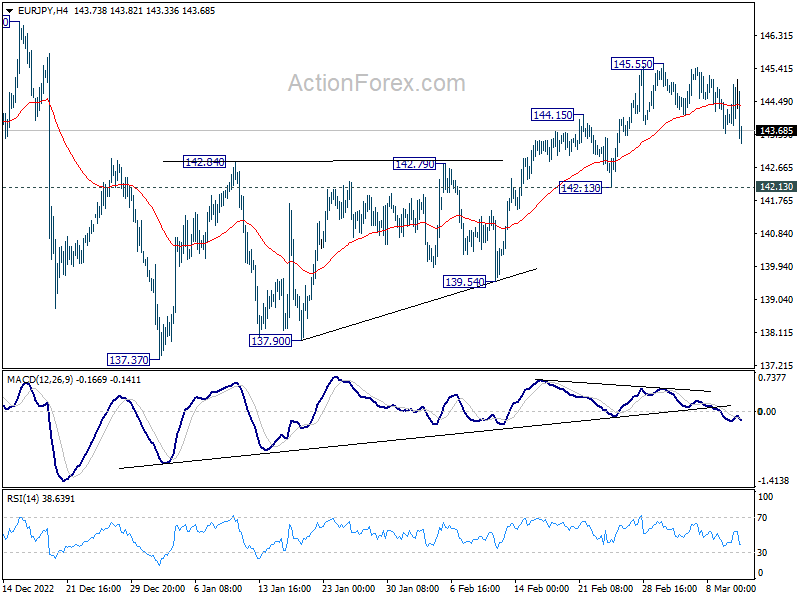
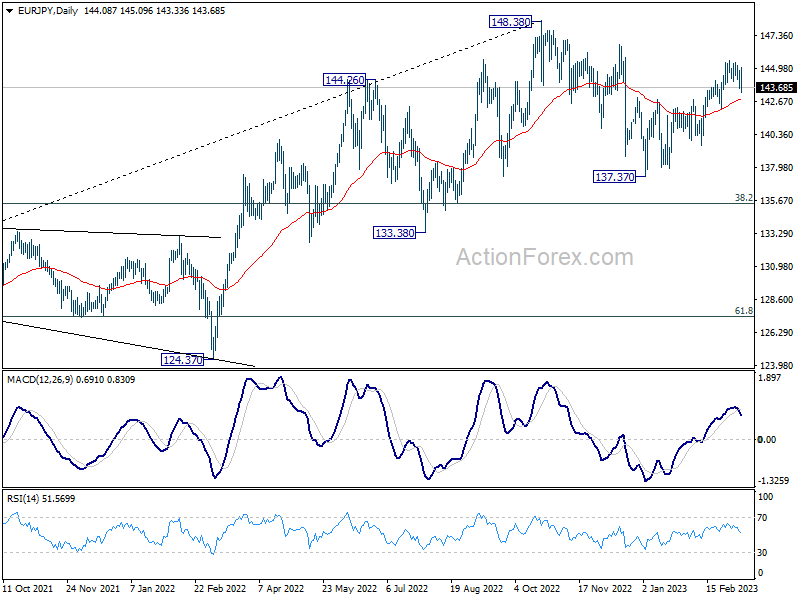
EUR/JPY stayed in consolidation below 145.55 last week and outlook is unchanged. Initial bias remains neutral this week first. Further rally is expected as long as 142.13 support holds. Corrective fall from 148.38 has completed at 137.37 already. Break of 145.55 will resume the rise from 137.37 to 146.71 resistance and then 148.38 high.
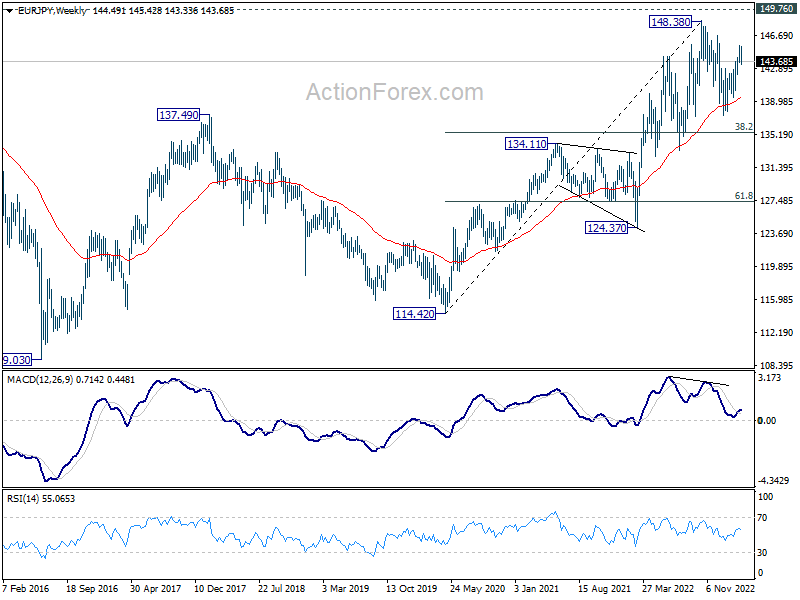
In the bigger picture, as long as 55 week EMA (now at 139.54) holds, larger up trend from 114.42 (2020 low) is still in progress for 149.76 long term resistance. However, firm break of 55 week EMA will bring deeper fall to 38.2% retracement of 114.42 to 148.38 at 135.40. Sustained break there will raise the chance of trend reversal, and target 61.8% retracement at 127.39.
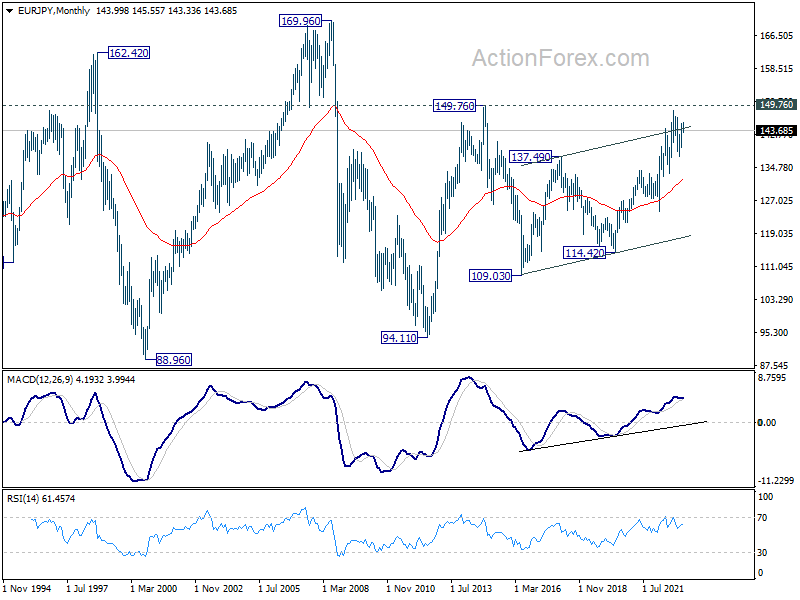
In the long term picture, outlook will stay bullish as long as 134.11 resistance turned support holds (2021 high). Sustained break of 149.76 (2014 high) will open up further rally, as resumption of the rise from 94.11 (2012 low), towards 169.96 (2008 high).
EUR/GBP Weekly Outlook
EUR/GBP reversed after edging higher to 0.8924, and the break of 0.8825 argues that rebound from 0.8753 has completed. The development suggests that corrective pattern from 0.8977 is still extending and it's probably in another falling leg. Initial bias is now mildly on the downside for 0.8753 support. On the upside, above 0.8924 will bring retest of 0.8977 instead.
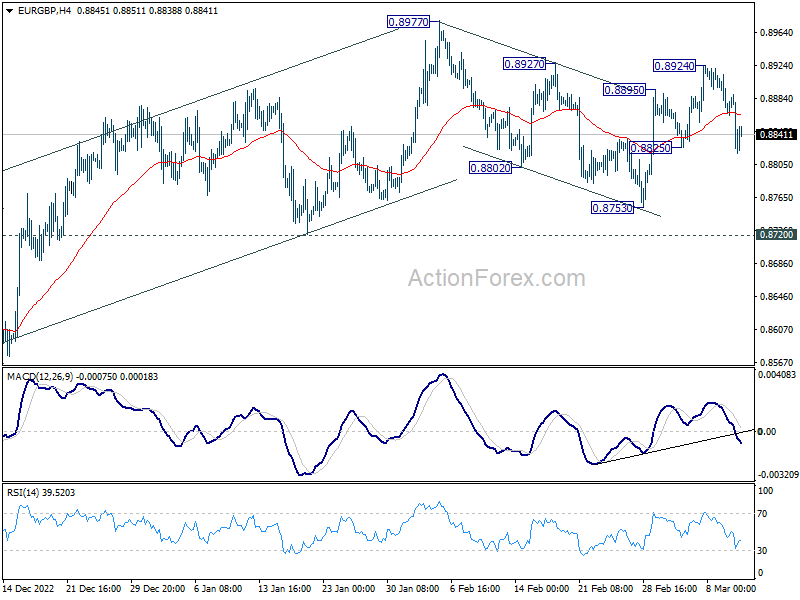
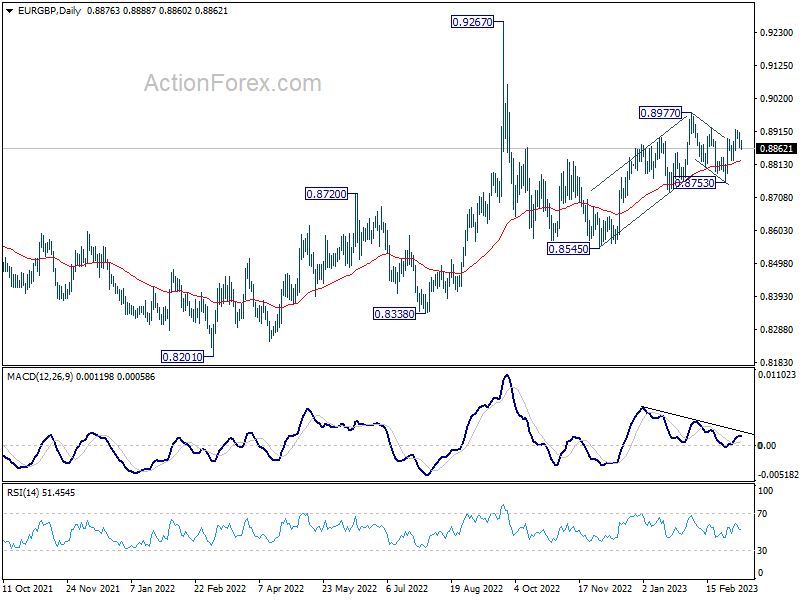
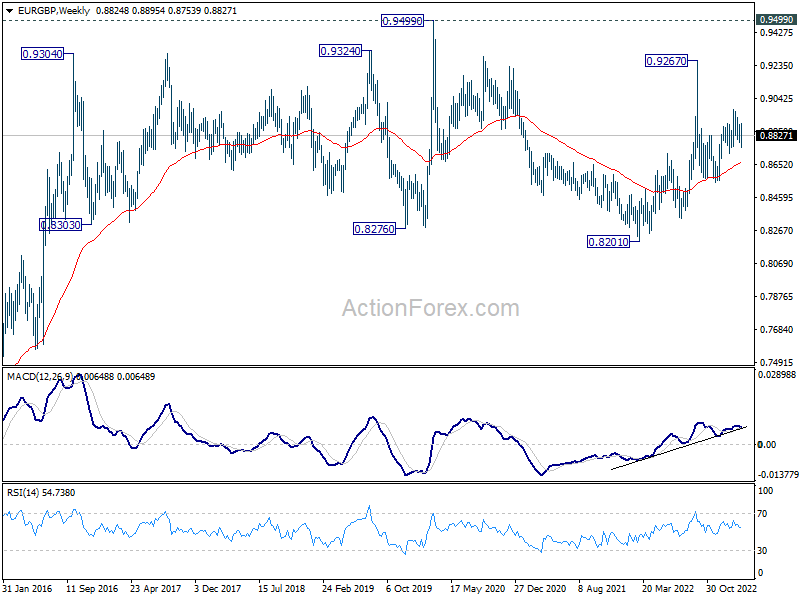
In the bigger picture, outlook is rather mixed for now, except that price actions from 0.9267 (2022 high) are part of the long term range pattern from 0.9499 (2020 high). With 0.8720 support intact, rise from 0.8545 is in favor to continue through 0.8977. However, firm break of 0.8720 will argue that such rebound has completed, and open up deeper fall through this support level.
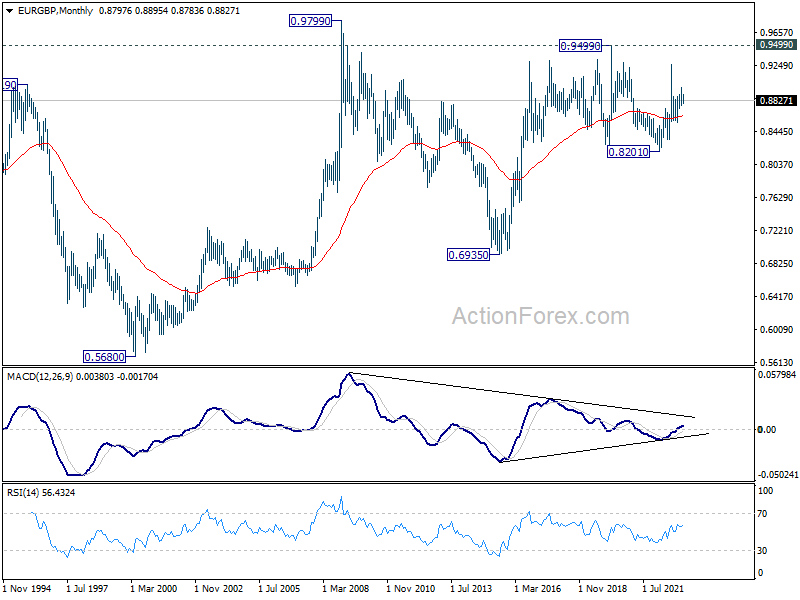
In the long term picture, long term range pattern is extending. But rise from 0.6935 (2015 low) is expected to extend at a later stage, to 0.9799 (2009 high).
EUR/AUD Weekly Outlook
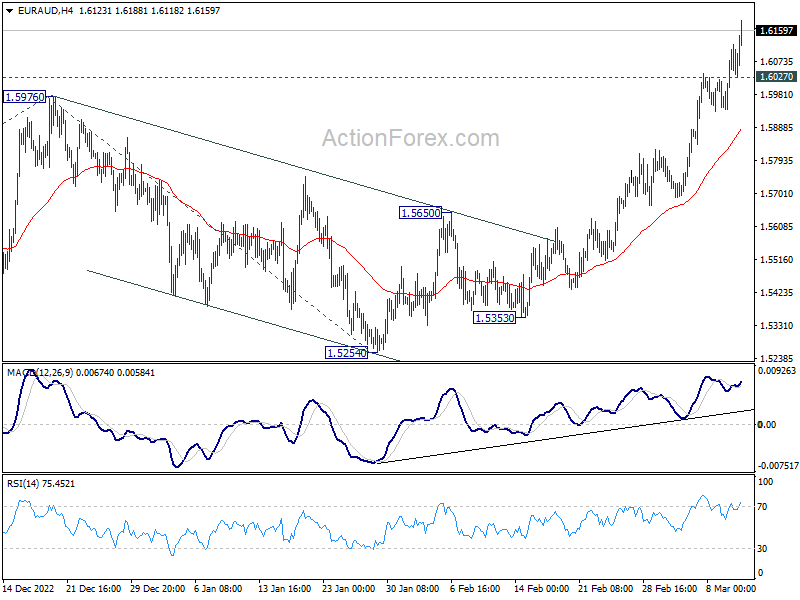
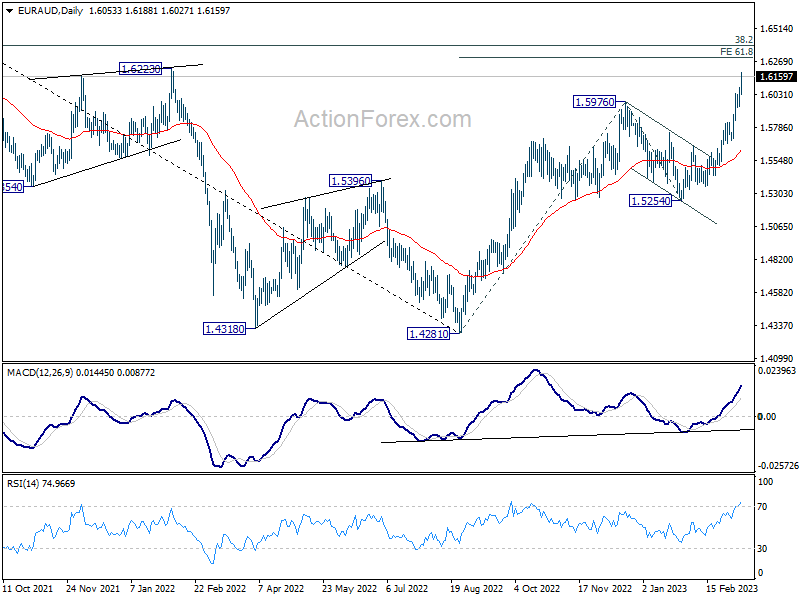
EUR/AUD's up trend from 1.4281 resumed by breaking through 1.5976 and hit as high as 1.6188 last week. Initial bias stays on the upside this week for 61.8% projection of 1.4281 to 1.5976 from 1.5254 at 1.6302 next. On the downside, below 1.6027 minor support will turn bias neutral and bring consolidations again first.
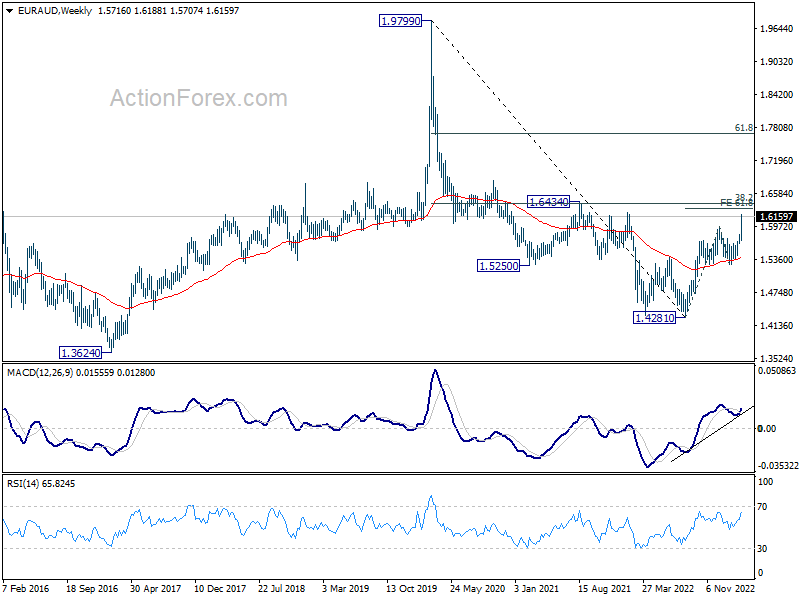
In the bigger picture, the strong support from 55 week EMA (now at 1.5396) is raising the chance of bullish trend reversal. Focus is now on 1.6434 cluster resistance (38.2% retracement of 1.9799 to 1.4281 at 1.6389). Sustained break there should confirm that whole down trend from 1.9799 (2020 high) has completed. Further rally should then be seen to 61.8% retracement at 1.7691. However, rejection by this cluster resistance will make medium term outlook neutral at best.
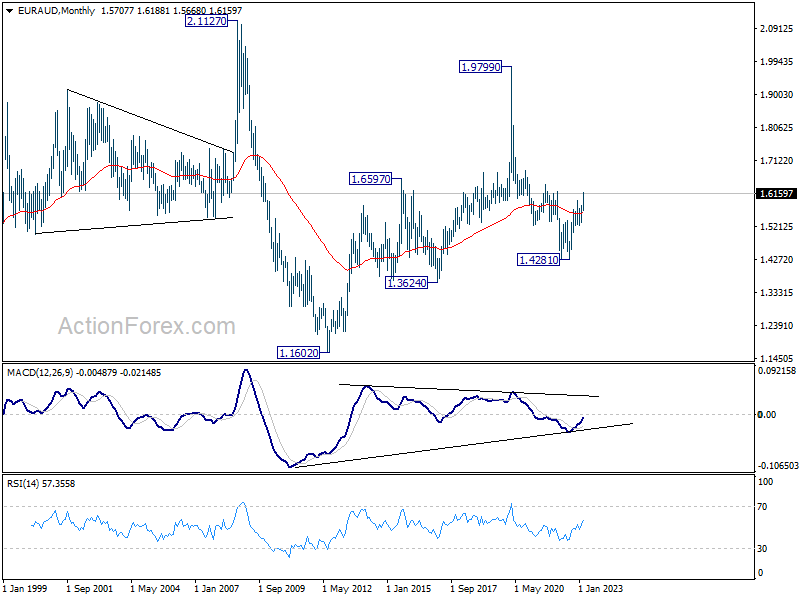
In the longer term picture, the strong break above 55 week EMA (now at 1.5616) now raising the chance of bullish trend reversal. Firm break of 1.6434 resistance should confirm that the down trend from 1.9799 has completed. It's still early to decide if the up trend from 1.1602 (2012 low) is resuming. An assessment will be made after rise from 1.4281 reveals more of its structure.
EUR/CHF Weekly Outlook
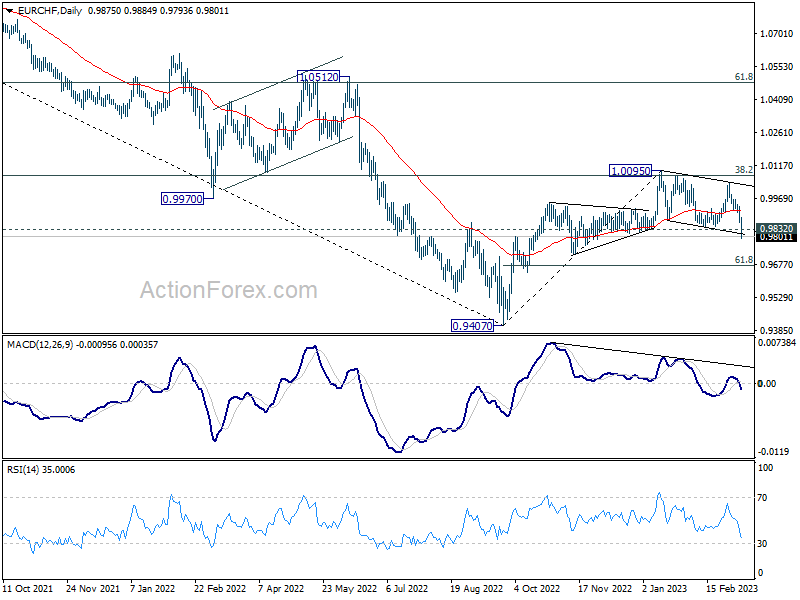
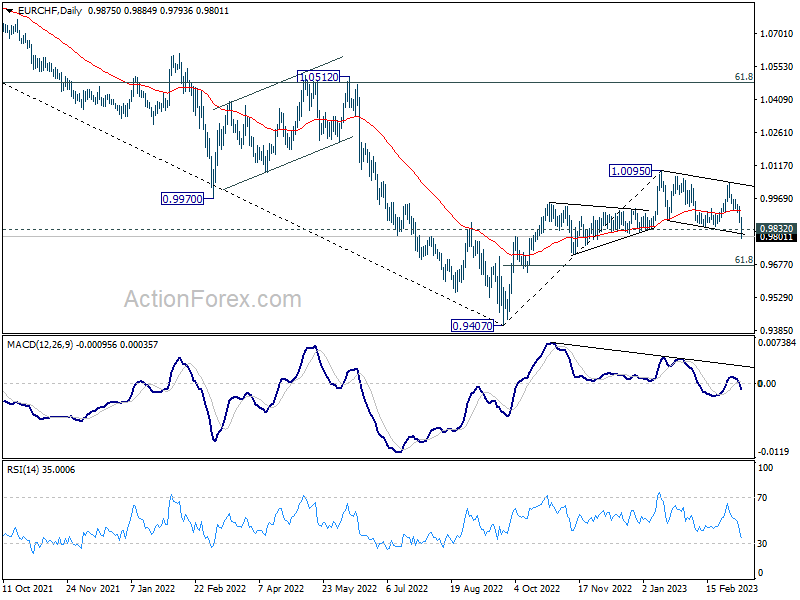
EUR/CHF's break of 0.9832 support argues that rebound form 0.9407 has completed at 1.0095 already, on bearish divergence condition in daily MACD. Initial bias is now on the downside this week for deeper fall to 61.8% retracement of 0.9407 to 1.0095 at 0.9670. Sustained break there will bring deeper fall to retest 0.9407 low. On the upside, above 0.9860 minor resistance will turn intraday bias neutral first. But risk will stay on the downside as long as 55 day EMA (now at 0.9910) holds.
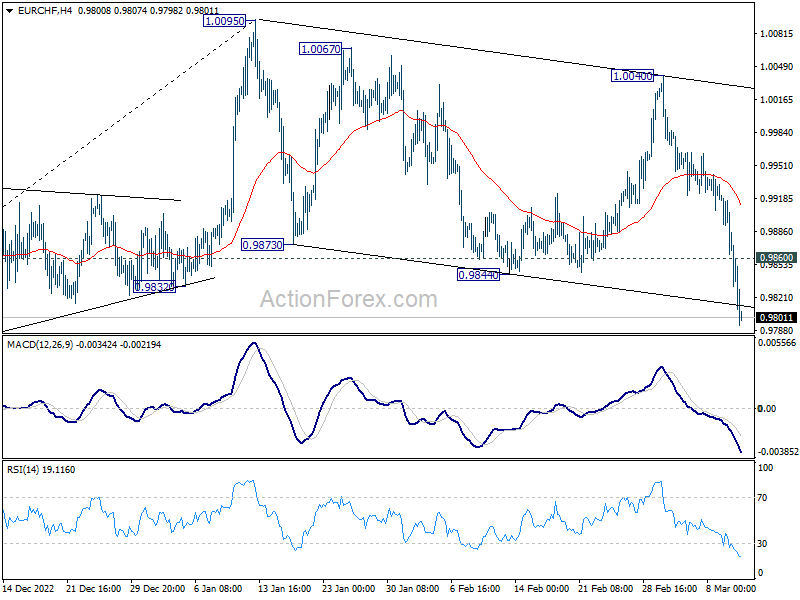
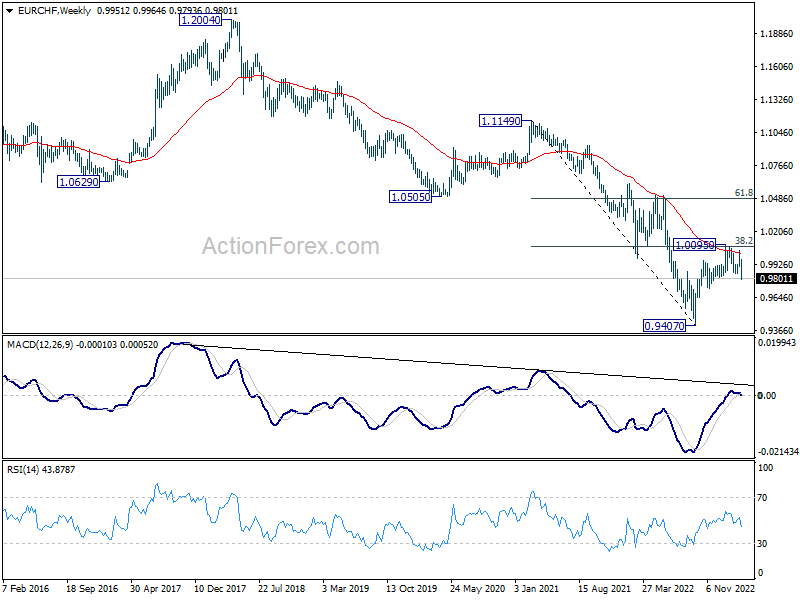
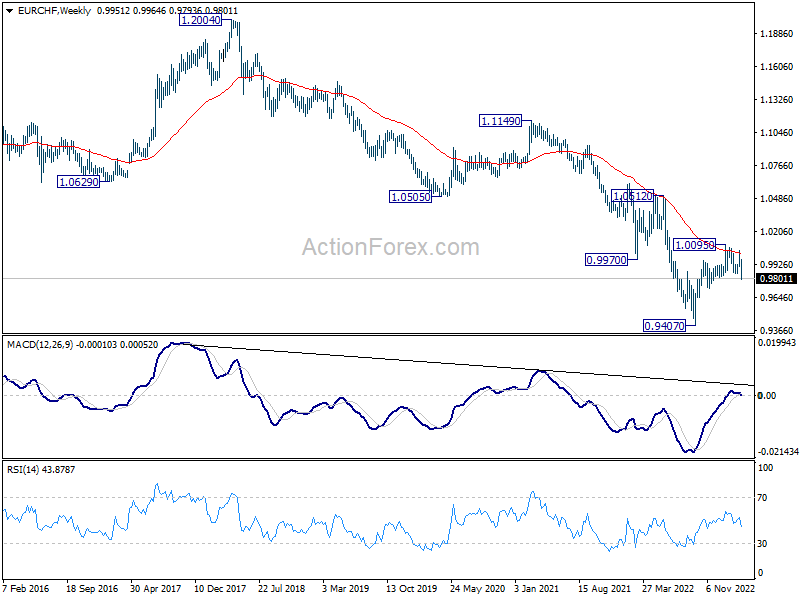
In the bigger picture, rejection by 55 week EMA (now at 1.0011) and 38.2% retracement of 1.1149 to 0.9407 at 1.0072 suggests that medium term outlook is staying bearish. That is, down trend from 1.2004 is not completed yet and is in favor to resume through 0.9407 at a later stage. For now, this will be the favored case as long as 1.0095 resistance holds.
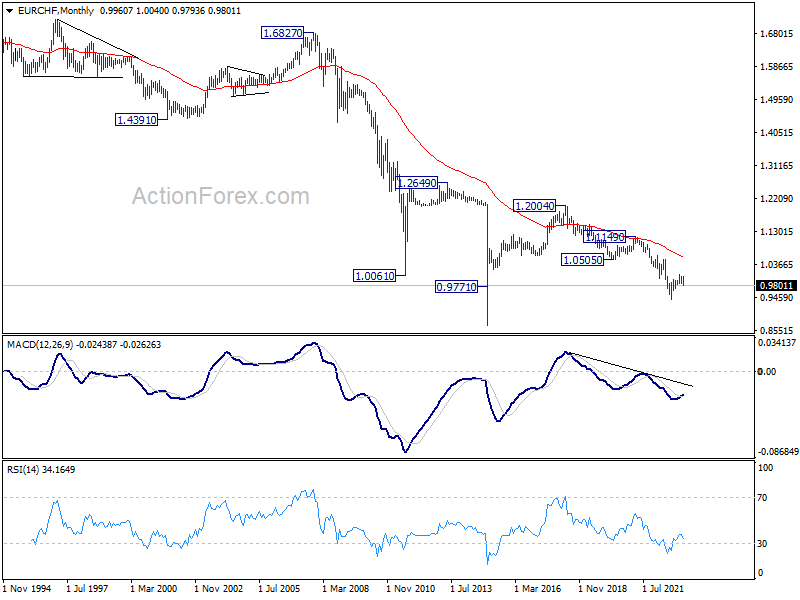
In the long term picture, it's still way too early too call for bullish trend reversal with upside capped well below 55 month EMA and 1.0505 support turned resistance (2020 low). The multi-decade down trend could still continue.
Silicon Valley Bank’s Collapse Outweighs Interest Rate Developments
Last week, investors were caught off guard by a series of surprises. However, the largest bank failure in the US since 2008 proved to be the most overwhelming for them. The risks of contagion from Silicon Valley Bank appeared to outweigh concerns about higher interest rates, inflation, and recession. Consequently, traders sought safety, resulting in the biggest rally in US treasuries in a decade, and steepest selloff in stocks in months.
Swiss Franc and Yen emerged as the strongest currencies for the week, propelled by risk aversion and additional by falling treasury yields. Euro finished in third place, while Dollar had mixed results, responding more to falling yields than risk aversion. Commodity currencies finished notably lower, led by Australian Dollar, while Sterling was also weaker.
Going forward, the news on SVB will be the primary market driver in the near term. If the situation in the banking sector deteriorates, risk-off sentiment may intensify. However, if the situation stabilizes, attention will return to inflation and central bank policies.
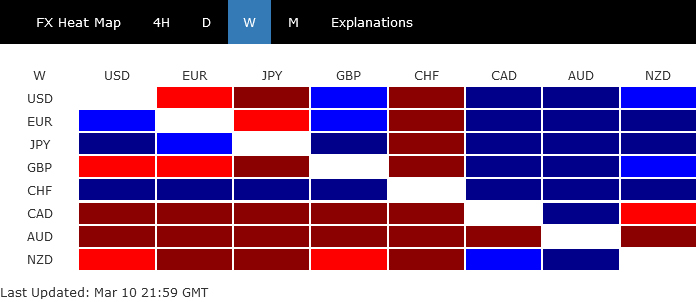
Sudden collapse of Silicon Valley Bank shakes markets, overshadows Fed tightening talks
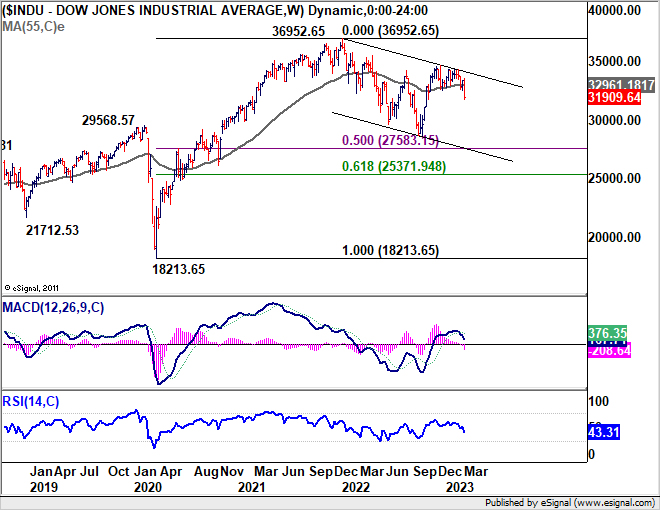
Last week was a tumultuous one for the markets, with concerns about tighter monetary policy by Fed dominating the first half. However, investors were then primarily focused on the sudden collapse of Silicon Valley Bank, the biggest bank failure in the US since the global financial crisis. DOW fell almost -1,500 points, or over -4%, during the week, marking the worst one-week selloff since June. Safe-haven flows even triggered the biggest two-day decline in Treasury yields since 2008.
At one point during the week, the probability of a 50bps rate hike by Fed in March exceeded 70%, following unusually hawkish comments by Fed Chair Jerome Powell during the semi-annual testimony to Congress. By the end of the week, the chance had dropped to around 40%. While the mixed non-farm payroll report may have played a role in shifting expectations, the risk of contagion from Silicon Valley Bank in the banking system could curtail Fed's willingness to accelerate tightening. If negative effects emerge, they could eventually force Fed to cut back interest rates earlier.
Uncertainties will persist until the Fed's next decision on March 22, with new economic projections to be published by then. On March 14, the release of CPI data will provide another important piece of information. With various paths that developments in Silicon Valley Bank could take, sentiment is likely to remain volatile.
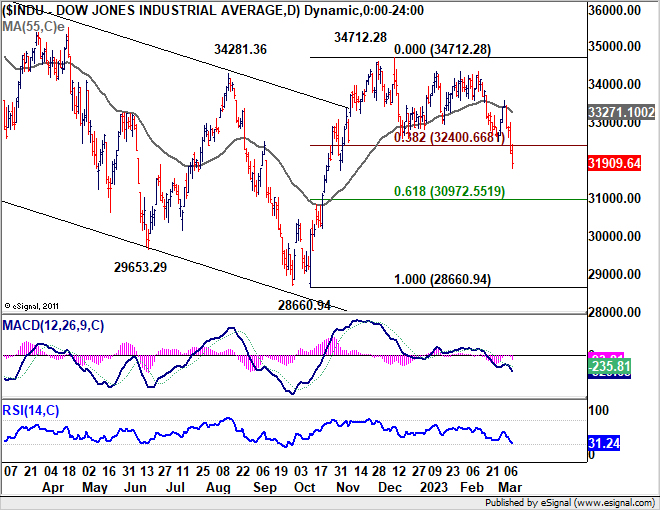
DOW broke key support level, heading to 30972 next
DOW break through an important support of 38.2% retracement of 28660.94 to 34712.28 at 32400.66 decisively with last week's selloff. 55 week EMA (now at 32961.18) was also taken out firmly. The development raises the chance that the rebound from 28660.94 has already completed. Whether that's the case or not, deeper fall is now expected as long as 55 day EMA (now at 33271.10) hold, to 61.8% retracement at 30972.55.
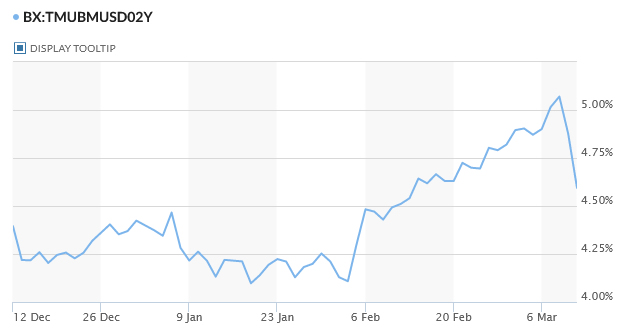
Treasury yields tumbled as investors seek safety
Massive flight-to-safety flows drove US treasury yields sharply lower last week. Yield of 2-year Treasury note hit as high as 5.096 before reversing to close at 4.58. That's two-day decline for 2-year yield since September 2008.
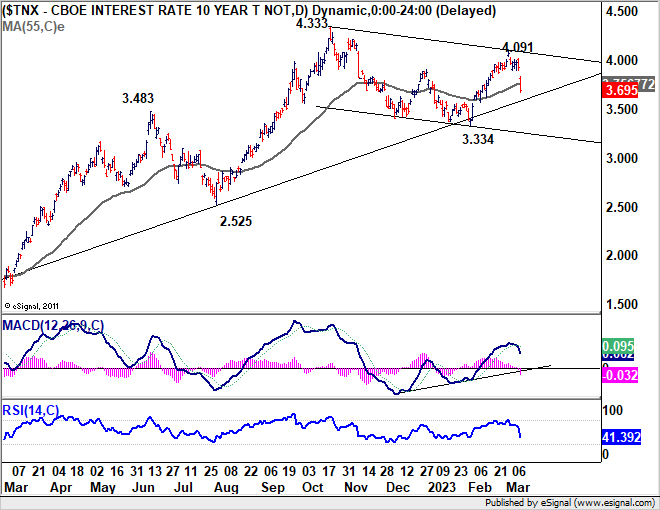
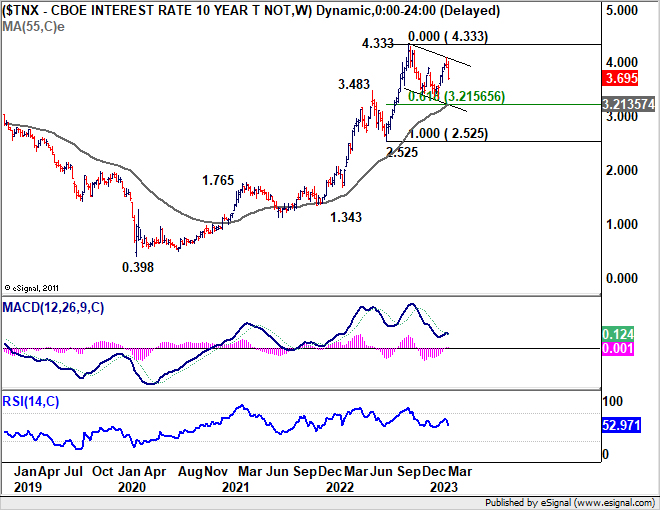
10-year yield gapped down on Friday and extended the fall to close at 3.695. The strong break of 55 day EMA suggests that rebound from 3.334 has completed at 4.091. More importantly, fall from 4.091 is now potentially another falling leg inside the corrective pattern from 4.333. Risk will stay heavily on the downside unless the gap at 3.832/3.894 is closed. Further fall is in favor back to 3.334, or even to 55 week EMA (now at 3.213).
Dollar index to defend 55 day EMA, or could it?
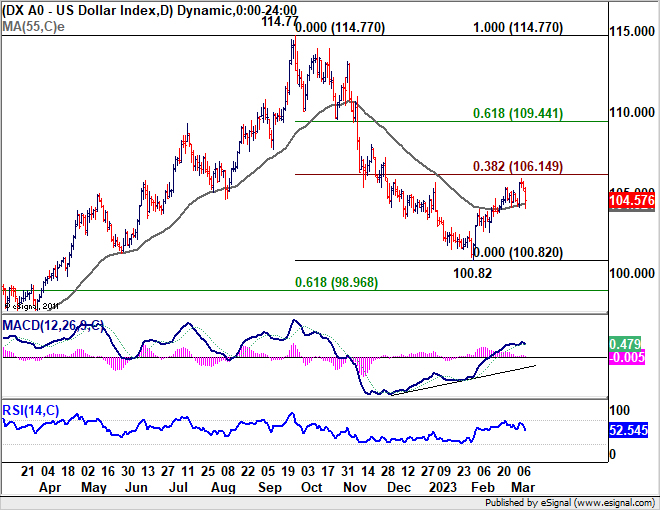
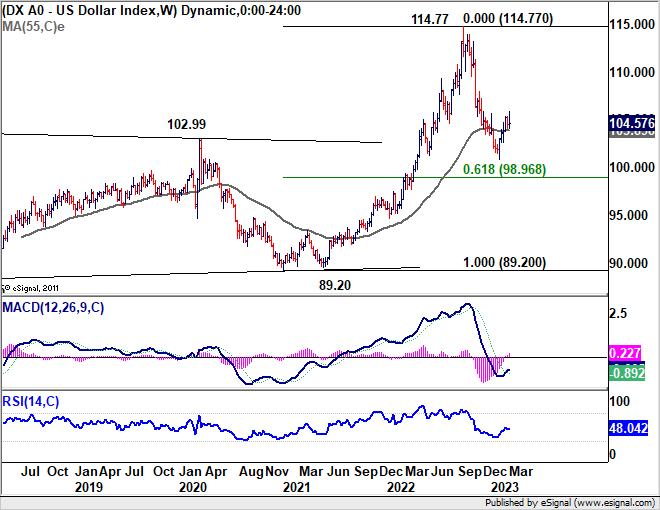
Dollar index initially jumped to 105.88 but was rejected by 38.2% retracement of 144.77 to 100.82 at 106.14, and reversed from there. Rise from 100.82 still perfectly fits into a corrective move category. But strong risk appetite was not the reason capping Dollar's advance as envisaged. Instead, it was the sharp decline in Treasury yields that overshadowed the support to the greenback from risk-aversion.
With a close about 55 day EMA (now at 104.32), it's not the end of the world for DXY yet. Another rally attempt could still be seen. But even so, firm break of 106.14 fibonacci level is not expected. Sustained trading below the 55 day EMA will argue that the corrective rise from 100.82 has completed, and open the door to retest this low.
EUR/CHF broke key support as Franc flexes muscles
Swiss Franc ended as the biggest winner of the week as smart money could have started jump into this safe harbor on Thursday. In the background, the Franc is also supported by expectation of further tightening by SNB after stronger than expected February CPI reading.
Taking a look at EUR/CHF (while Euro wasn't really the worst performer already), the development was rather bearish. The break of 0.9832 support suggests that rebound from 0.9407 has completed at 1.0095 already, on bearish divergence condition in daily MACD. That came after rejection by 55 week EMA. Break of near term channel support suggests downside acceleration, as backed by the dip in daily MACD too.
So further decline is now expected as long as 55 day EMA (now at 0.9915) holds. Next target is 61.8% retracement of 0.9407 to 1.0095 at 0.9670. Sustained break there will bring deeper fall to retest 0.9407 low, or even below to resume larger down trend from 1.2004 (2018 high).
AUD/JPY ready for decline resumption after RBA signals pause is coming
Australian Dollar was staying in pressure in risk-averse environment. RBA delivered the 25bps rate hike as expected. The indication of a potential pause was a surprise, but that shouldn't be delivered after at least one more hike in April.
Meanwhile, BoJ stood pat and Governor Haruhiko Kuroda indicated his last meeting that the bank was in no hurry to exit ultra-loose monetary policy. Yen was originally pressured during the week but rebounded strongly on falling treasury yields.
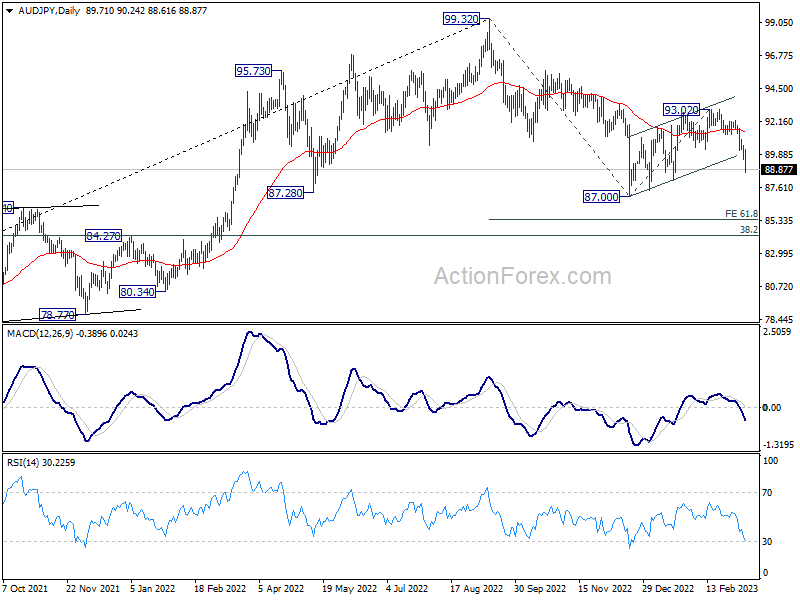
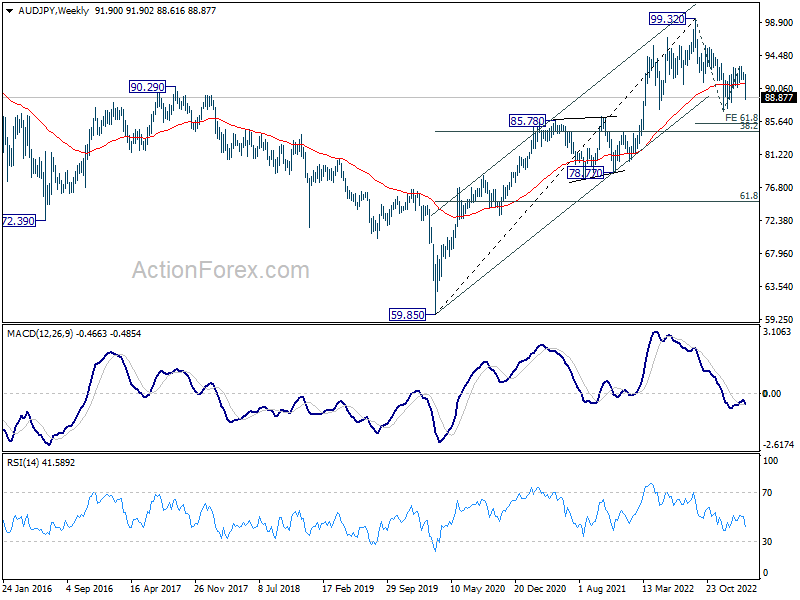
AUD/JPY's steep decline and the strong break of the near term falling channel indicates that corrective rebound from 87.00 has completed at 93.02 already. Deeper fall should be seen next. Firm break of 93.02 will resume the whole decline from 99.32, as a correction to the up trend from 59.85 (2020 low). Next target will be 61.8% projection of 99.32 to 87.00 from 93.02 at 85.40.
GBP/CAD eyeing upside breakout after BoC started conditional pause
Another commodity currency Canadian Dollar was also weak. BoC formally started its conditional pause and it's unlikely to alter course any time soon. Meanwhile, recent economic data from the UK indicated that even if there is another GDP contraction in Q1, it would be a shallow one. While opinions among BoE MPC members are split, tightening is still set to continue.
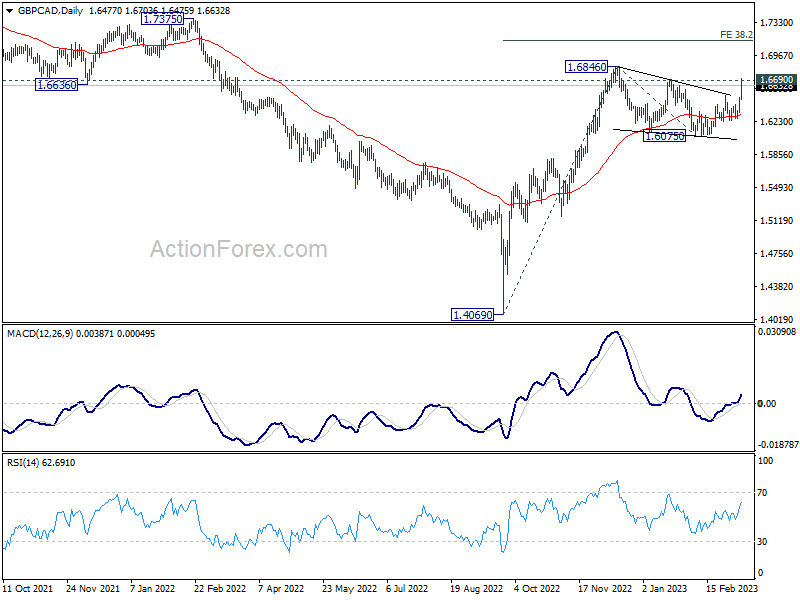
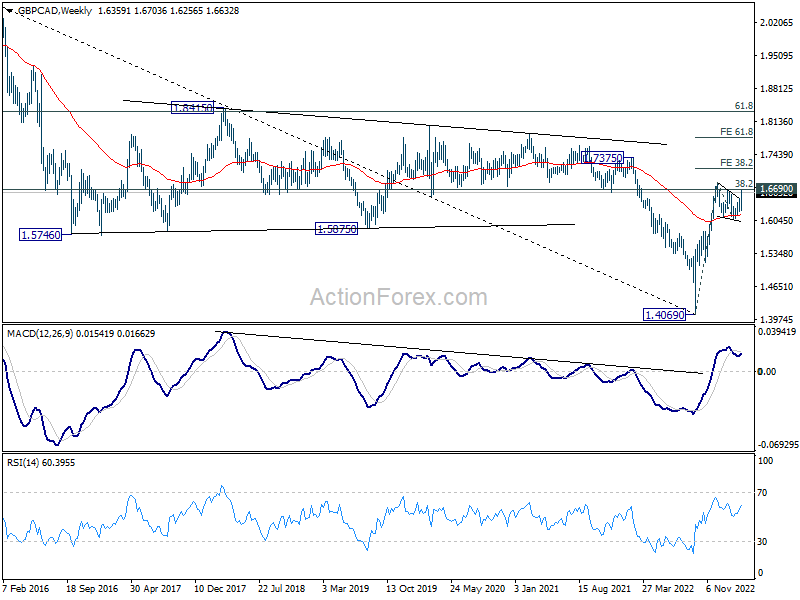
GBP/CAD's strong rally and breach of 1.6690 resistance argues that corrective pattern from 1.6846 has completed at 1.6075 already. That dame after drawing support from 55 week EMA, which is a medium term bullish signal.
Further rise is in favor to retest 1.6846 high first. Sustained break there will resume whole up trend from 1.4069 to 38.2% projection of 1.4069 to 1.6846 from 1.6075 at 1.7136 next.
USD/CHF Weekly Outlook
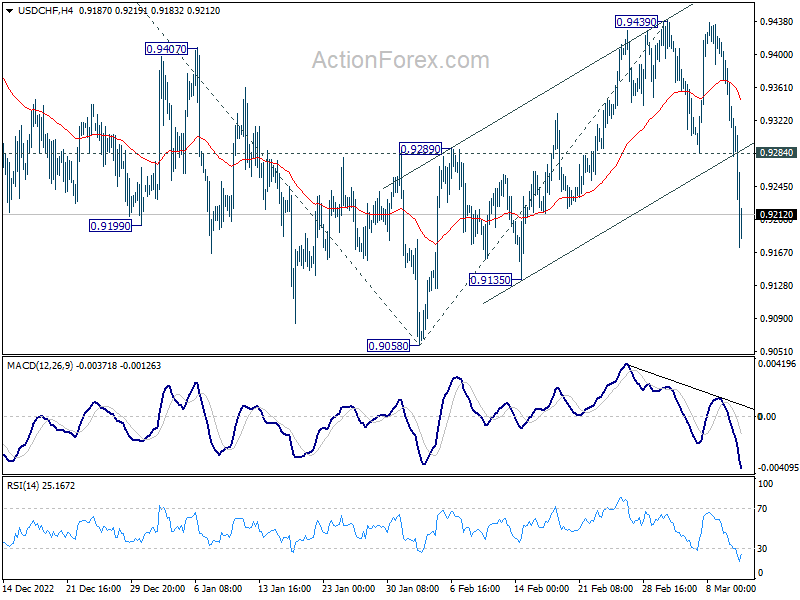
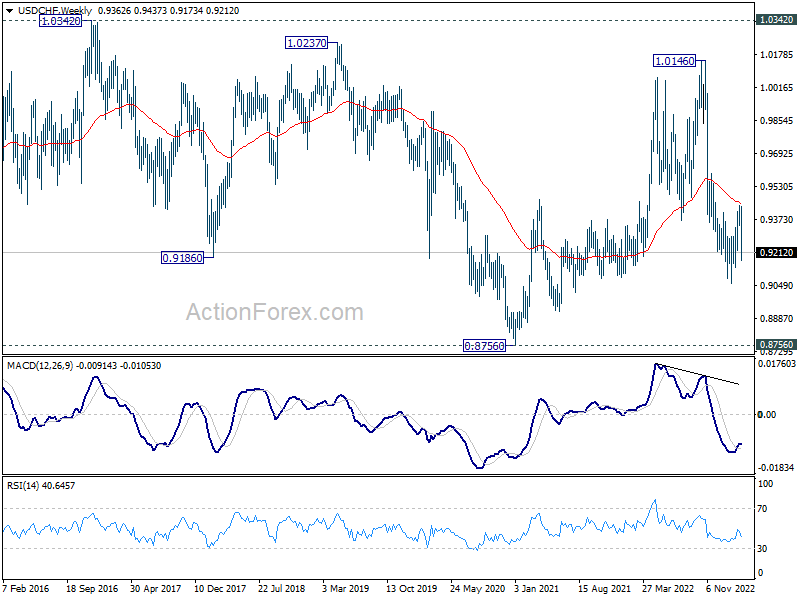
USD/CHF's sharp decline last week suggests that corrective rebound from 0.9058 has completed at 0.9439 already, ahead of 38.2% retracement of 1.0146 to 0.9058 at 0.9474. Initial bias stays on the downside this week for retesting 0.9058 low. Decisive break there will resume larger down trend from 1.0146. Next target is 61.8% projection of 1.0146 to 0.9058 from 0.9439 at 0.8767. On the upside, above 0.9284 minor resistance will turn intraday bias neutral first. But risk will now stay on the downside as long as 0.9439 resistance holds.
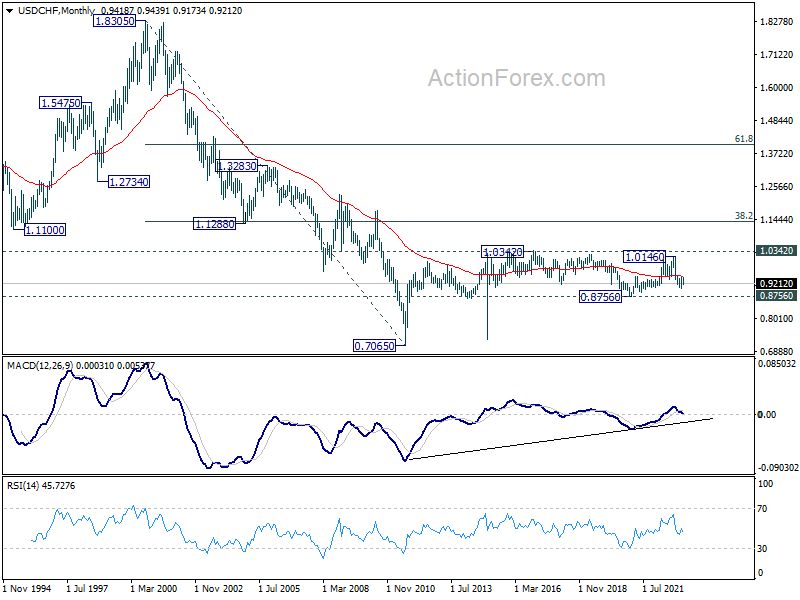
In the bigger picture, fall from 1.1046 (2022 high) is should still be in progress with 38.2% retracement of 1.0146 to 0.9058 at 0.9474 intact. Rejection by 55 week EMA is also a medium term bearish sign. Break of 0.9058 will resume such decline towards 0.8756 support (2021 low). But overall, such fall is still as a leg in the long term range pattern from 1.0342 (2016 high). So, downside should be contained by 0.8756 to bring reversal. For now, this will remain the favored cas as long as 0.9439 resistance holds.
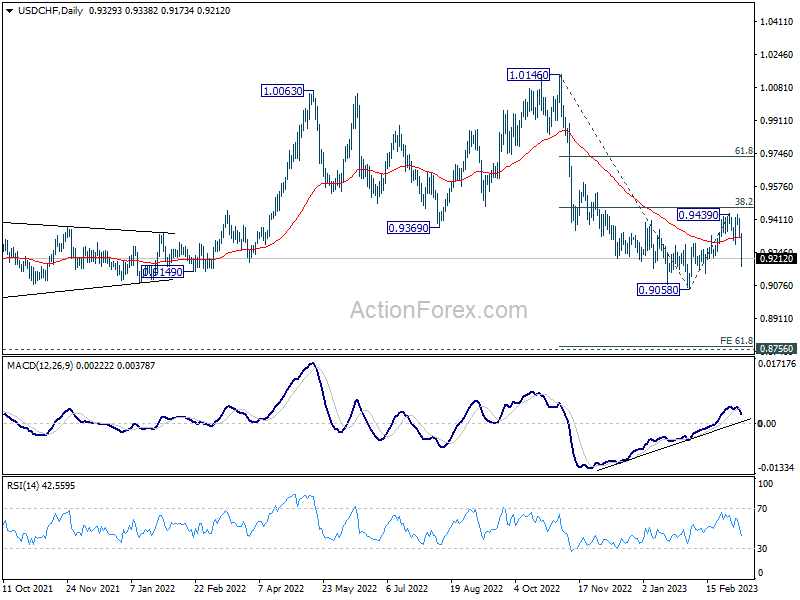
In the long term picture, long term sideway pattern from 1.0342 (2016 high) is extending. Overall, range trading should continue until further development.
Summary 3/13 – 3/17
Monday, Mar 13, 2023
| GMT | Ccy | Events | Consensus | Previous |
|---|---|---|---|---|
| 21:30 | NZD | Business NZ PSI Feb | 54.5 | |
| 23:50 | JPY | BSI Large Manufacturing Index Q1 | -4.2 | -3.6 |
| 15:30 | USD | 3-Month Bill Auction | ||
| 15:30 | USD | 6-Month Bill Auction | ||
| 23:30 | AUD | Westpac Consumer Confidence Mar | -6.90% |
| GMT | Ccy | Events | |
|---|---|---|---|
| 21:30 | NZD | Business NZ PSI Feb | |
| Forecast: | Previous: 54.5 | ||
| 23:50 | JPY | BSI Large Manufacturing Index Q1 | |
| Forecast: -4.2 | Previous: -3.6 | ||
| 15:30 | USD | 3-Month Bill Auction | |
| Forecast: | Previous: | ||
| 15:30 | USD | 6-Month Bill Auction | |
| Forecast: | Previous: | ||
| 23:30 | AUD | Westpac Consumer Confidence Mar | |
| Forecast: | Previous: -6.90% | ||
Tuesday, Mar 14, 2023
| GMT | Ccy | Events | Consensus | Previous |
|---|---|---|---|---|
| 00:30 | AUD | NAB Business Conditions Feb | 18 | |
| 00:30 | AUD | NAB Business Confidence Feb | 6 | |
| 07:00 | GBP | Claimant Count Change Feb | -12.4K | -12.9K |
| 07:00 | GBP | ILO Unemployment Rate (3M) Jan | 3.80% | 3.70% |
| 07:00 | GBP | Average Earnings Excluding Bonus 3M/Y Jan | 6.60% | 6.70% |
| 07:00 | GBP | Average Earnings Including Bonus 3M/Y Jan | 5.70% | 5.90% |
| 07:30 | CHF | Producer and Import Prices M/M Feb | 0.50% | 0.70% |
| 07:30 | CHF | Producer and Import Prices Y/Y Feb | 3.40% | 3.30% |
| 09:00 | EUR | Italy Industrial Output M/M Jan | -0.40% | 1.60% |
| 11:00 | USD | NFIB Business Optimism Index Feb | 91.2 | 90.3 |
| 12:30 | CAD | Manufacturing Sales M/M Jan | -0.40% | -1.50% |
| 12:30 | USD | CPI M/M Feb | 0.40% | 0.50% |
| 12:30 | USD | CPI Y/Y Feb | 6.00% | 6.40% |
| 12:30 | USD | CPI Core M/M Feb | 0.40% | 0.40% |
| 12:30 | USD | CPI Core Y/Y Feb | 5.50% | 5.60% |
| 21:45 | NZD | Current Account (NZD) Q4 | -7.65B | -10.21B |
| 23:50 | JPY | BoJ Minutes |
| GMT | Ccy | Events | |
|---|---|---|---|
| 00:30 | AUD | NAB Business Conditions Feb | |
| Forecast: | Previous: 18 | ||
| 00:30 | AUD | NAB Business Confidence Feb | |
| Forecast: | Previous: 6 | ||
| 07:00 | GBP | Claimant Count Change Feb | |
| Forecast: -12.4K | Previous: -12.9K | ||
| 07:00 | GBP | ILO Unemployment Rate (3M) Jan | |
| Forecast: 3.80% | Previous: 3.70% | ||
| 07:00 | GBP | Average Earnings Excluding Bonus 3M/Y Jan | |
| Forecast: 6.60% | Previous: 6.70% | ||
| 07:00 | GBP | Average Earnings Including Bonus 3M/Y Jan | |
| Forecast: 5.70% | Previous: 5.90% | ||
| 07:30 | CHF | Producer and Import Prices M/M Feb | |
| Forecast: 0.50% | Previous: 0.70% | ||
| 07:30 | CHF | Producer and Import Prices Y/Y Feb | |
| Forecast: 3.40% | Previous: 3.30% | ||
| 09:00 | EUR | Italy Industrial Output M/M Jan | |
| Forecast: -0.40% | Previous: 1.60% | ||
| 11:00 | USD | NFIB Business Optimism Index Feb | |
| Forecast: 91.2 | Previous: 90.3 | ||
| 12:30 | CAD | Manufacturing Sales M/M Jan | |
| Forecast: -0.40% | Previous: -1.50% | ||
| 12:30 | USD | CPI M/M Feb | |
| Forecast: 0.40% | Previous: 0.50% | ||
| 12:30 | USD | CPI Y/Y Feb | |
| Forecast: 6.00% | Previous: 6.40% | ||
| 12:30 | USD | CPI Core M/M Feb | |
| Forecast: 0.40% | Previous: 0.40% | ||
| 12:30 | USD | CPI Core Y/Y Feb | |
| Forecast: 5.50% | Previous: 5.60% | ||
| 21:45 | NZD | Current Account (NZD) Q4 | |
| Forecast: -7.65B | Previous: -10.21B | ||
| 23:50 | JPY | BoJ Minutes | |
| Forecast: | Previous: | ||
Wednesday, Mar 15, 2023
| GMT | Ccy | Events | Consensus | Previous |
|---|---|---|---|---|
| 02:00 | CNY | Retail Sales Y/Y Feb | 3.40% | -1.80% |
| 02:00 | CNY | Industrial Production Y/Y Feb | 2.60% | 1.30% |
| 02:00 | CNY | Fixed Asset Investment YTD Y/Y Feb | 4.50% | 5.10% |
| 10:00 | EUR | Eurozone Industrial Production M/M Jan | 0.50% | -1.10% |
| 12:15 | CAD | Housing Starts Feb | 225K | 215K |
| 12:30 | USD | Empire State Manufacturing Index Mar | -7.5 | -5.8 |
| 12:30 | USD | Retail Sales M/M Feb | 0.20% | 3.00% |
| 12:30 | USD | Retail Sales ex Autos M/M Feb | -0.10% | 2.30% |
| 12:30 | USD | PPI M/M Feb | 0.30% | 0.70% |
| 12:30 | USD | PPI Y/Y Feb | 5.10% | 6.00% |
| 12:30 | USD | PPI Core M/M Feb | 0.40% | 0.50% |
| 12:30 | USD | PPI Core Y/Y Feb | 5.00% | 5.40% |
| 14:00 | USD | Business Inventories Jan | 0.00% | 0.30% |
| 14:00 | USD | NAHB Housing Market Index Mar | 42 | 42 |
| 14:30 | USD | Crude Oil Inventories | -1.7M | |
| 21:45 | NZD | GDP Q/Q Q4 | -0.20% | 2.00% |
| 23:50 | JPY | Trade Balance (JPY) Feb | -1.46T | -1.82T |
| 23:50 | JPY | Machinery Orders M/M Jan | 1.80% | 1.60% |
| GMT | Ccy | Events | |
|---|---|---|---|
| 02:00 | CNY | Retail Sales Y/Y Feb | |
| Forecast: 3.40% | Previous: -1.80% | ||
| 02:00 | CNY | Industrial Production Y/Y Feb | |
| Forecast: 2.60% | Previous: 1.30% | ||
| 02:00 | CNY | Fixed Asset Investment YTD Y/Y Feb | |
| Forecast: 4.50% | Previous: 5.10% | ||
| 10:00 | EUR | Eurozone Industrial Production M/M Jan | |
| Forecast: 0.50% | Previous: -1.10% | ||
| 12:15 | CAD | Housing Starts Feb | |
| Forecast: 225K | Previous: 215K | ||
| 12:30 | USD | Empire State Manufacturing Index Mar | |
| Forecast: -7.5 | Previous: -5.8 | ||
| 12:30 | USD | Retail Sales M/M Feb | |
| Forecast: 0.20% | Previous: 3.00% | ||
| 12:30 | USD | Retail Sales ex Autos M/M Feb | |
| Forecast: -0.10% | Previous: 2.30% | ||
| 12:30 | USD | PPI M/M Feb | |
| Forecast: 0.30% | Previous: 0.70% | ||
| 12:30 | USD | PPI Y/Y Feb | |
| Forecast: 5.10% | Previous: 6.00% | ||
| 12:30 | USD | PPI Core M/M Feb | |
| Forecast: 0.40% | Previous: 0.50% | ||
| 12:30 | USD | PPI Core Y/Y Feb | |
| Forecast: 5.00% | Previous: 5.40% | ||
| 14:00 | USD | Business Inventories Jan | |
| Forecast: 0.00% | Previous: 0.30% | ||
| 14:00 | USD | NAHB Housing Market Index Mar | |
| Forecast: 42 | Previous: 42 | ||
| 14:30 | USD | Crude Oil Inventories | |
| Forecast: | Previous: -1.7M | ||
| 21:45 | NZD | GDP Q/Q Q4 | |
| Forecast: -0.20% | Previous: 2.00% | ||
| 23:50 | JPY | Trade Balance (JPY) Feb | |
| Forecast: -1.46T | Previous: -1.82T | ||
| 23:50 | JPY | Machinery Orders M/M Jan | |
| Forecast: 1.80% | Previous: 1.60% | ||
Thursday, Mar 16, 2023
| GMT | Ccy | Events | Consensus | Previous |
|---|---|---|---|---|
| 00:00 | AUD | Consumer Inflation Expectations Mar | 5.10% | |
| 00:30 | AUD | Employment Change Feb | 48.5K | -11.5K |
| 00:30 | AUD | Unemployment Rate Feb | 3.60% | 3.70% |
| 04:30 | JPY | Industrial Production M/M Jan F | -4.60% | -4.60% |
| 08:00 | CHF | SECO Economic Forecasts | ||
| 12:30 | CAD | Wholesale Sales M/M Jan | 0.10% | -0.80% |
| 12:30 | USD | Initial Jobless Claims (Mar 10) | 205K | 211K |
| 12:30 | USD | Housing Starts Feb | 1.32M | 1.31M |
| 12:30 | USD | Building Permits Feb | 1.35M | 1.34M |
| 12:30 | USD | Import Price Index M/M Feb | -0.20% | -0.20% |
| 12:30 | USD | Philadelphia Fed Manufacturing Survey Mar | -16 | -24.3 |
| 13:15 | EUR | ECB Main Refinancing Rate | 3.50% | 3.00% |
| 13:45 | EUR | ECB Press Conference | ||
| 14:30 | USD | Natural Gas Storage | -84B | |
| 15:30 | USD | 4-Week Bill Auction | 4.64% |
| GMT | Ccy | Events | |
|---|---|---|---|
| 00:00 | AUD | Consumer Inflation Expectations Mar | |
| Forecast: | Previous: 5.10% | ||
| 00:30 | AUD | Employment Change Feb | |
| Forecast: 48.5K | Previous: -11.5K | ||
| 00:30 | AUD | Unemployment Rate Feb | |
| Forecast: 3.60% | Previous: 3.70% | ||
| 04:30 | JPY | Industrial Production M/M Jan F | |
| Forecast: -4.60% | Previous: -4.60% | ||
| 08:00 | CHF | SECO Economic Forecasts | |
| Forecast: | Previous: | ||
| 12:30 | CAD | Wholesale Sales M/M Jan | |
| Forecast: 0.10% | Previous: -0.80% | ||
| 12:30 | USD | Initial Jobless Claims (Mar 10) | |
| Forecast: 205K | Previous: 211K | ||
| 12:30 | USD | Housing Starts Feb | |
| Forecast: 1.32M | Previous: 1.31M | ||
| 12:30 | USD | Building Permits Feb | |
| Forecast: 1.35M | Previous: 1.34M | ||
| 12:30 | USD | Import Price Index M/M Feb | |
| Forecast: -0.20% | Previous: -0.20% | ||
| 12:30 | USD | Philadelphia Fed Manufacturing Survey Mar | |
| Forecast: -16 | Previous: -24.3 | ||
| 13:15 | EUR | ECB Main Refinancing Rate | |
| Forecast: 3.50% | Previous: 3.00% | ||
| 13:45 | EUR | ECB Press Conference | |
| Forecast: | Previous: | ||
| 14:30 | USD | Natural Gas Storage | |
| Forecast: | Previous: -84B | ||
| 15:30 | USD | 4-Week Bill Auction | |
| Forecast: | Previous: 4.64% | ||
Friday, Mar 17, 2023
| GMT | Ccy | Events | Consensus | Previous |
|---|---|---|---|---|
| 04:30 | JPY | Tertiary Industry Index M/M Jan | 0.30% | -0.40% |
| 09:00 | EUR | Italy Trade Balance (EUR) Jan | 1.50B | 1.07B |
| 09:30 | GBP | Consumer Inflation Expectations | 4.80% | |
| 10:00 | EUR | Eurozone CPI Y/Y Feb F | 8.60% | 8.60% |
| 10:00 | EUR | Eurozone CPI Core Y/Y Feb F | 5.60% | 5.60% |
| 12:30 | CAD | Industrial Product Price M/M Feb | 0.40% | |
| 12:30 | CAD | Raw Material Price Index Feb | -0.10% | |
| 13:15 | USD | Industrial Production M/M Feb | 0.60% | 0.00% |
| 13:15 | USD | Capacity Utilization Feb | 78.50% | 78.30% |
| 15:00 | USD | Michigan Consumer Sentiment Index Mar P | 67 | 67 |
| GMT | Ccy | Events | |
|---|---|---|---|
| 04:30 | JPY | Tertiary Industry Index M/M Jan | |
| Forecast: 0.30% | Previous: -0.40% | ||
| 09:00 | EUR | Italy Trade Balance (EUR) Jan | |
| Forecast: 1.50B | Previous: 1.07B | ||
| 09:30 | GBP | Consumer Inflation Expectations | |
| Forecast: | Previous: 4.80% | ||
| 10:00 | EUR | Eurozone CPI Y/Y Feb F | |
| Forecast: 8.60% | Previous: 8.60% | ||
| 10:00 | EUR | Eurozone CPI Core Y/Y Feb F | |
| Forecast: 5.60% | Previous: 5.60% | ||
| 12:30 | CAD | Industrial Product Price M/M Feb | |
| Forecast: | Previous: 0.40% | ||
| 12:30 | CAD | Raw Material Price Index Feb | |
| Forecast: | Previous: -0.10% | ||
| 13:15 | USD | Industrial Production M/M Feb | |
| Forecast: 0.60% | Previous: 0.00% | ||
| 13:15 | USD | Capacity Utilization Feb | |
| Forecast: 78.50% | Previous: 78.30% | ||
| 15:00 | USD | Michigan Consumer Sentiment Index Mar P | |
| Forecast: 67 | Previous: 67 | ||
What Do Higher US Interest Rates Mean for the Risk-Linked Currencies?
With expectations about the Fed’s future course of action changing radically lately, the commodity-linked or risk-sensitive currencies aussie, kiwi, and loonie have been under strong pressure. But why are those currencies suffering and how could they perform in the near future?
What does commodity-linked currencies mean?
Commodity currencies are the currencies of economies that are sensitive to changes in commodity prices and usually rely on commodity exports for growth. Among the major ones, the three that fit that description are the Australian dollar, the New Zealand dollar, and the Canadian dollar. Their link to commodities makes them sensitive to changes in the global risk sentiment and that’s why they usually have positive correlation with stock indices, like the S&P 500.
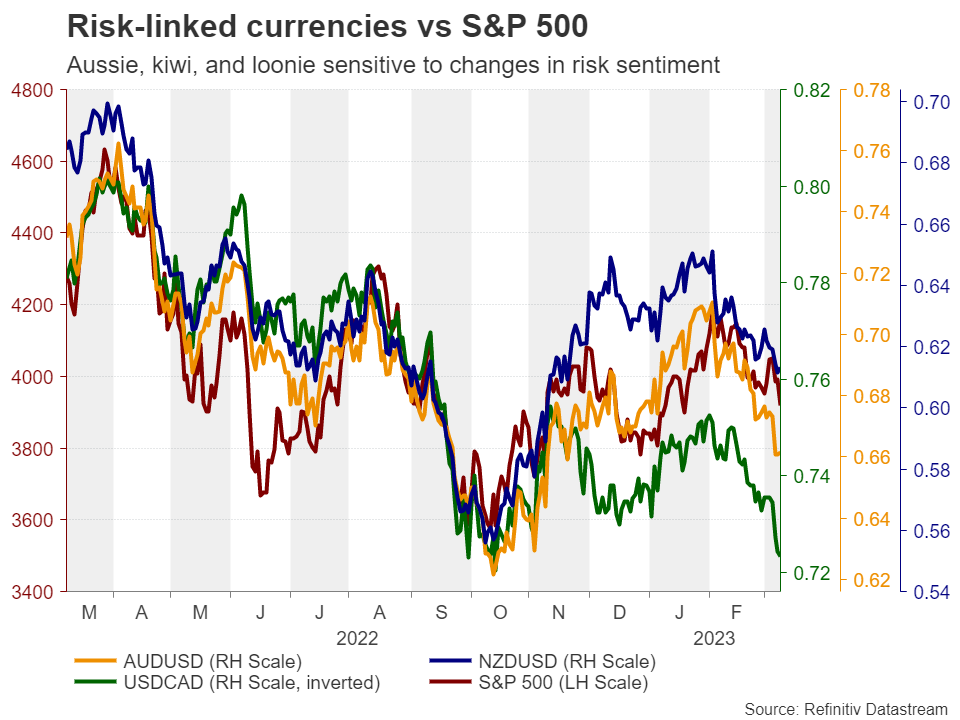
For example, iron ore is the leading commodity exported from Australia, with the nation holding the eighth place in terms of copper exports. Due to manufacturing and industrial sectors around the globe using those metals, the demand for them is affected by the performance of the global economy and that’s why the aussie (and for similar reasons the other commodity-linked currencies) is usually moving in tandem with equity indices. For that reason, those currencies are also called risk-sensitive or risk-linked currencies.
Risk-linked currencies suffer as Fed and ECB hike bets rise
Since the beginning of February all the major currencies have been underperforming against the US dollar, which has staged a stellar comeback as a streak of upbeat US economic releases and hotter-than-expected inflation data prompted market participants to radically increase their Fed hike bets. With Fed Chair Jerome Powell appearing in a hawkish suit on Tuesday and saying that interest rates may rise higher and probably faster than previously anticipated, investors are now assigning a nearly 70% probability for a bigger 50bps hike by the Fed in two weeks, while they see a terminal rate of nearly 5.5%.
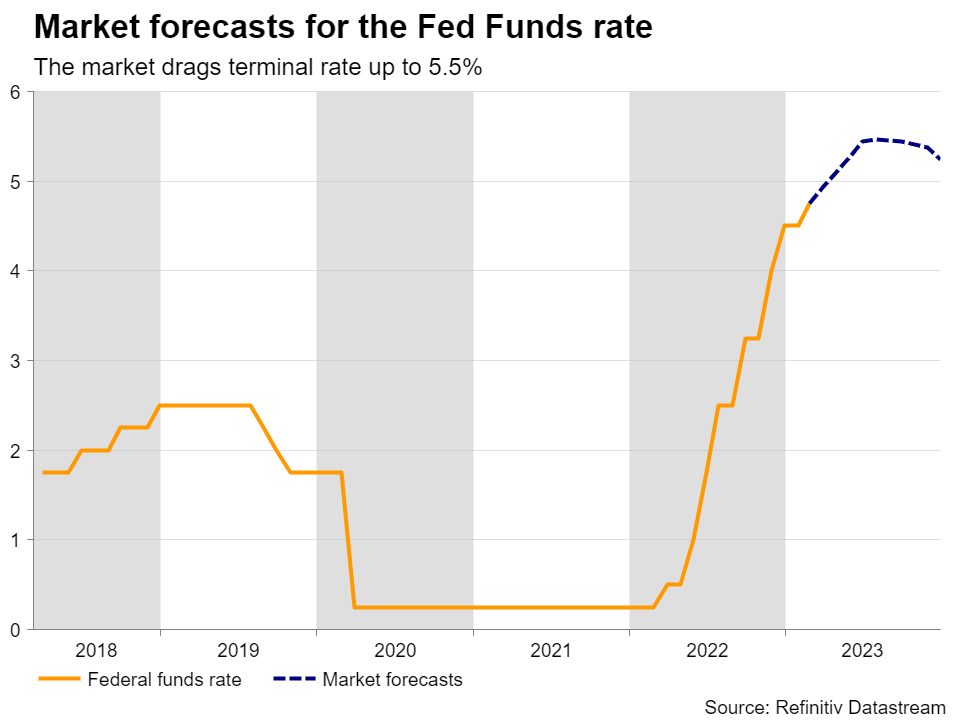
This change of heart on US interest rates has also weighed on equities and the broader risk sentiment as higher interest rates mean higher borrowing costs and lower corporate valuations, but also tighter financial conditions that could result in an economic slowdown. But hike bets are not rising only regarding the Fed. The ECB is also expected to raise rates higher than previously anticipated, with money markets now expecting a total of 160 basis points worth of additional rate increases by the end of the year.
Therefore, regardless of what their national central banks are planning to do, the aussie, the kiwi and the loonie have been under pressure, and they could continue feeling the heat of rising hike bets should incoming Eurozone and US data releases continue to corroborate that narrative.
How are they affected by policies of their own central banks?
Having said all that, an interesting question might be: Which currency could be hurt the most? There is no crystal-clear answer, but one major dynamic that could help in arriving at some sort of conclusion may be any divergences between the monetary policy strategies of their respective central banks.
So, kicking off with the BoC, this Wednesday, it refrained from pushing the hike button, becoming the first major central bank to hit the pause button in the current fight against inflation, with the meeting statement providing hints that they could stay on the sidelines until data warrants otherwise. Market participants are pricing nearly another 25bps hike by the end of the year, which leaves ample room for further declines in the loonie should Canadian data continue to disappoint.
Passing the ball to the RBA, policymakers of this Bank did press the hike button when they last met, delivering a 25bps hike and noting that further tightening of monetary policy will probably be needed. However, they added that how much further interest rates need to increase will depend on upcoming data and developments, with Governor Lowe saying a few days after the meeting that they are now closer to also pausing. In terms of market pricing, there is only a 40% probability for another 25bps hike at the upcoming gathering, with the remaining 60% pointing to a pause, but investors see nearly another 50bps worth of increments until December.
Last but not least, the RBNZ hiked by 50bps in February, with the market expecting 80 more basis points worth of hikes this year.
Loonie could be hurt the most
Putting everything together, it seems that there is a decent divergence between the RBNZ and the other two Banks, and thus the kiwi may be the first to be dismissed as a potential answer. Now, between the other two, the aussie took the most beating since the dollar’s rebound on February 3. However, following Powell’s hawkish remarks before Congress and the BoC’s dovish decision this Wednesday, the loonie accelerated its slide, although it has been holding better compared to the other two.
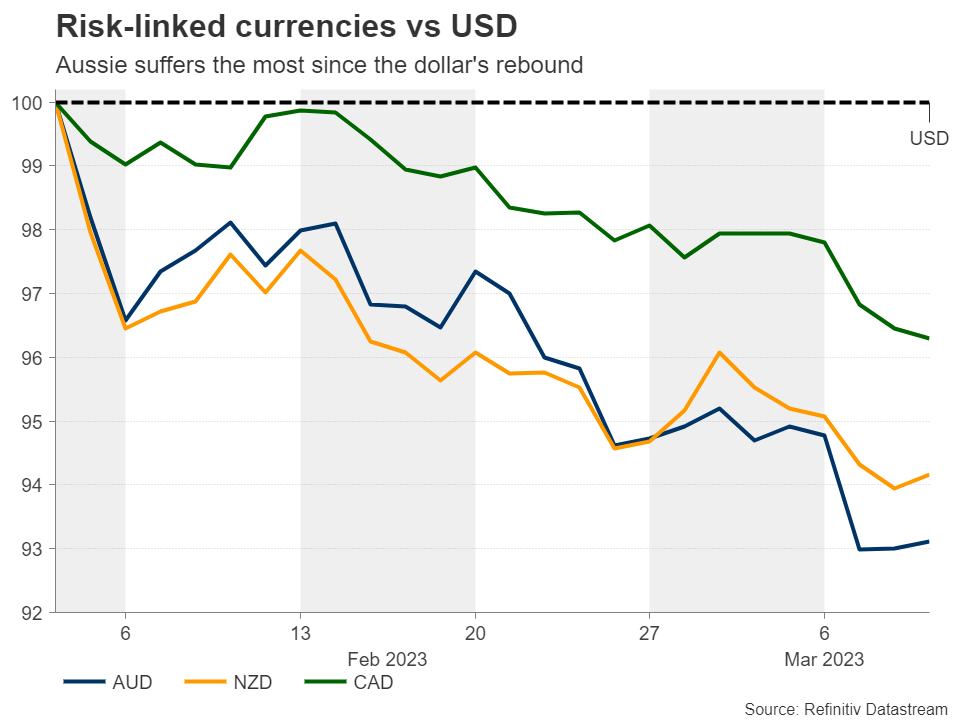
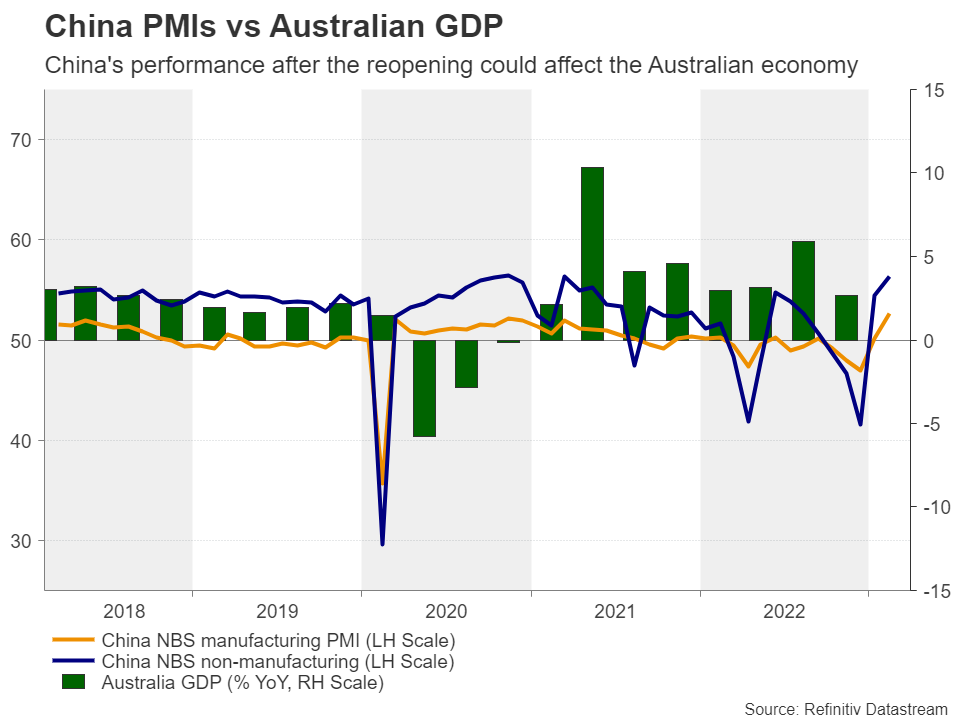
With the BoC appearing more dovish than the RBA, this suggests that from a risk-to-reward perspective, the loonie may be a better choice for exploiting further declines. In other words, there may be more room for the loonie to extend its slide. On top of that, Australia has closer trading ties with China and thus, it is more sensitive to developments surrounding the world’s second largest economy. Therefore, with the Chinese PMIs pointing to a notable improvement after the nation’s reopening from the strict COVID-related curbs, the environment may be slightly more favorable for the aussie hereafter.
Ergo, should market participants keep their Fed hike bets elevated, all three of the major risk-liked currencies could continue to slide against the dollar, but the one to suffer the most may be the loonie.
Dollar/loonie gets closer to its October high
Dollar loonie has been in a rally mode since Tuesday, breaking two important resistance areas since then; the 1.3700 zone, which acted as a ceiling between December 7 and January 3, and the 1.3810 barrier, marked by the high of November 3. Overall, the pair is trading well above the uptrend line drawn from the low of June and well above the 50- and 200-day exponential moving averages.
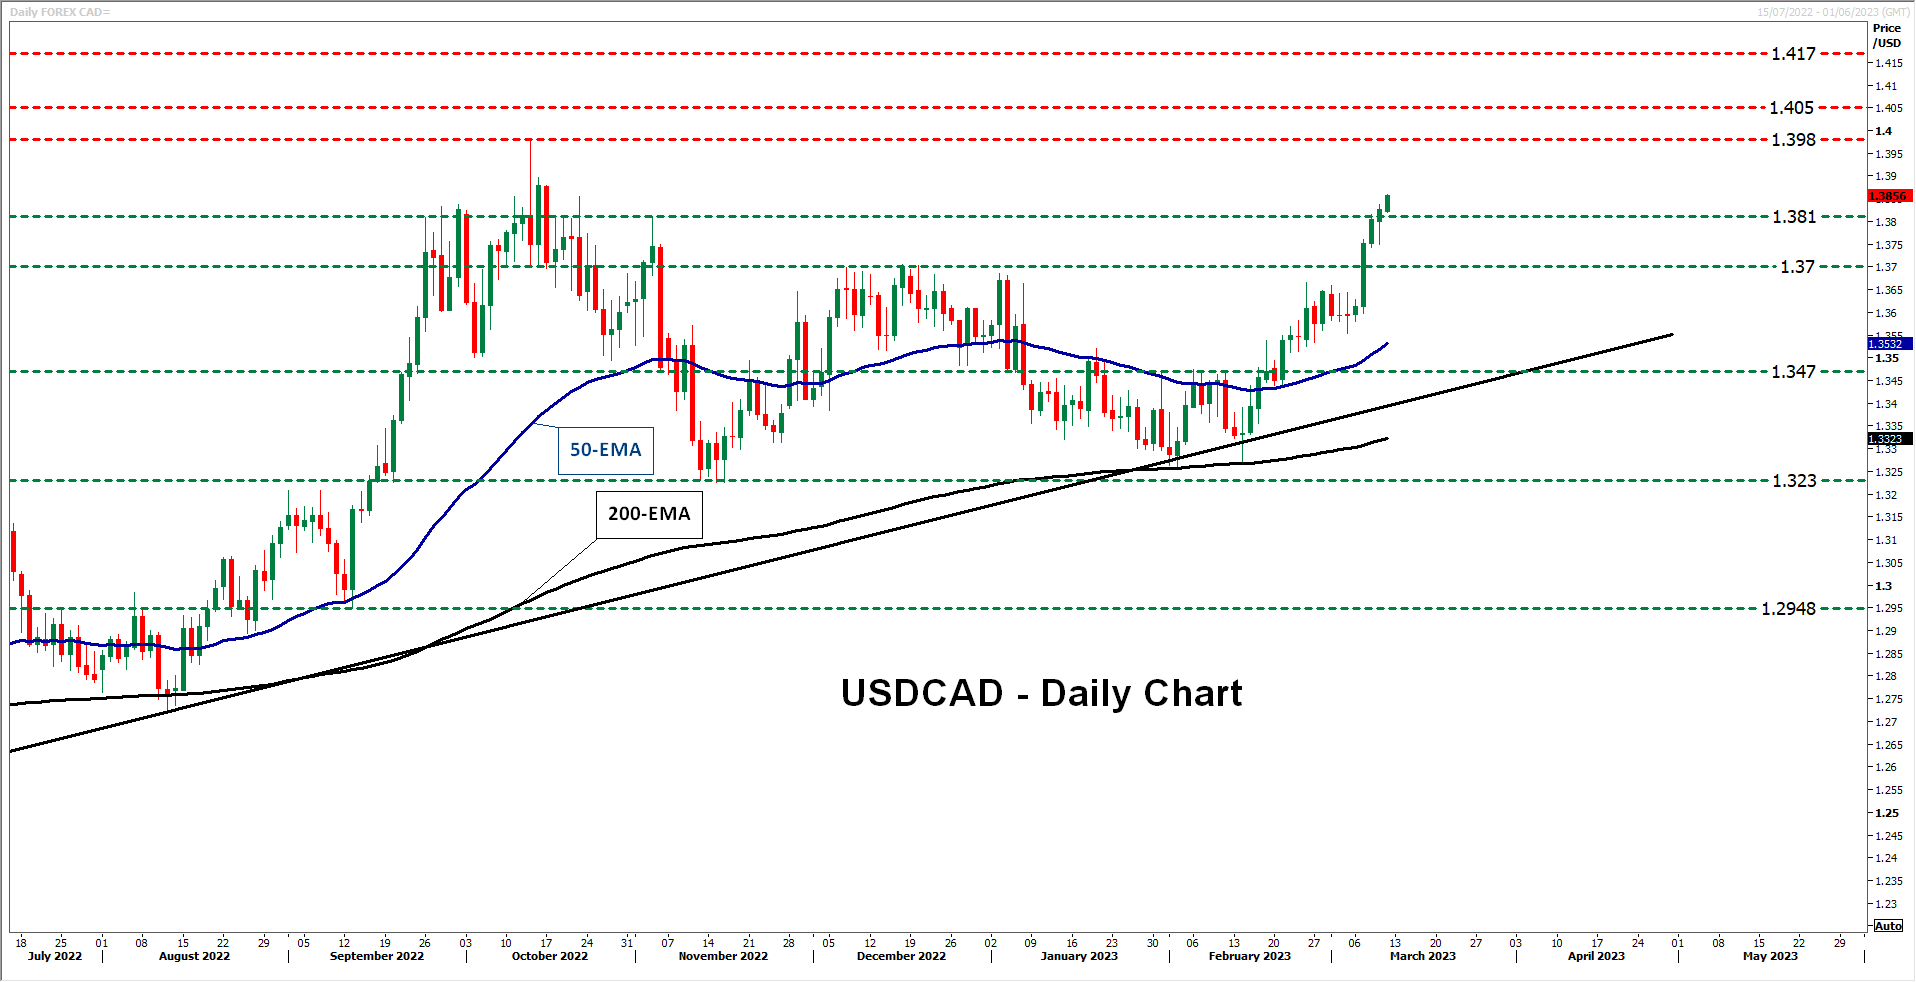
Dollar/loonie now seems to be heading towards the peak of October 3 at 1.3980, which is also the highest point since May 2020. If the bulls are strong enough to overcome it, they could aim for the high of May 22, 2020, at 1.4050, the break of which could see scope for extensions towards the peak of May 7, 2020, at 1.4170.
On the downside, the positive outlook could be dismissed upon a dip below 1.3470. Such a dip could also signal the break of the aforementioned uptrend line and allow declines towards the key territory of 1.3230, which offered support in November and February, and acted as resistance back in July. If that important area fails to stop the bears this time around, its break could set the stage for declines towards the low of September 13 at 1.2955.