Sample Category Title
NZ BNZ services rose to 55.8, activity growing relatively well
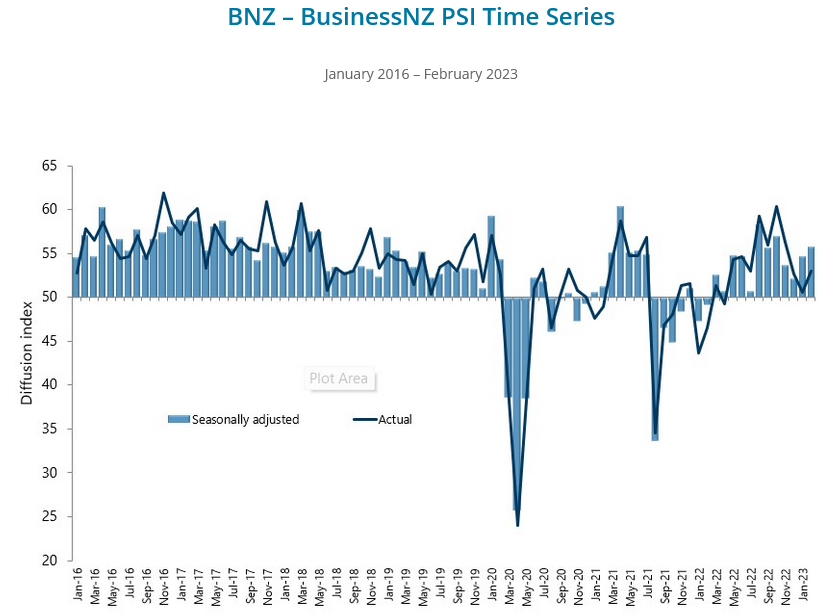
New Zealand BusinessNZ Performance of Services Index rose from 54.7 to 55.8 in February. The move further above the trend in the index indicates a more favorable comparison to its long-term average of 53.6.
Looking at some details, activity/sales rose from 52.1 to 53.6, while employment dipped from 51.6 to 51.2. New orders/business increased from 54.8 to 57.1, and stocks/inventories went up from 54.7 to 58.3. Additionally, supplier deliveries improved from 52.3 to 55.9.
BNZ Senior Economist Craig Ebert said that "the strongly expanding PSI, along with the recovered tone of the PMI, suggests economic activity is growing relatively well in the early stages of this year".
US Treasury, FDIC, and Fed announce measures to stabilize banking system
The US government has announced measures to stabilize the banking system and alleviate concerns over the potential fallout from the collapse of Silicon Valley Bank. The Federal Deposit Insurance Corporation (FDIC) has ensured that depositors will have access to their funds at SVB, and taxpayers will not bear any losses associated with the bank's resolution. However, shareholders and some unsecured debt holders will not be protected. In addition, a similar exception was announced for Signature Bank in New York.
Meanwhile, the Federal Reserve has established a new Bank Term Funding Program to provide additional funding to eligible depository institutions, ensuring that banks have the capability to meet the needs of all depositors. This move aims to bolster the capacity of the banking system to safeguard deposits and ensure the ongoing provision of money and credit to the economy. These measures are expected to ease concerns over potential systemic risks and promote stability in the banking sector.
Preview of NZ Q4 GDP and OCR Forecast Change
Bumps along the road
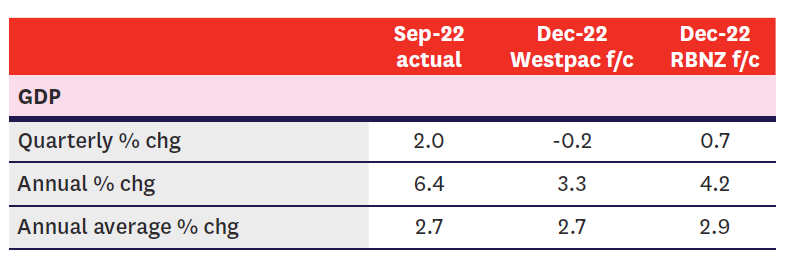
- We expect a 0.2% fall in GDP for the December quarter, following two quarters of extremely strong growth.
- This does not necessarily mark the start of a recession. GDP data has been choppy since Covid, and the details don't tell a consistent story about whether monetary policy is biting.
- Nevertheless, it does show that the economy is coming from a less overheated starting point than the Reserve Bank thought.
- We think that will nudge them towards a smaller 25 basis point hike at the April OCR review.
Weak Q4 not a sign of recession – yet.
The New Zealand economy went on a tear through the middle part of last year, as the return of overseas tourists lifted GDP by almost 4% over the June and September quarters. Coming off the back of that, we were already bracing for much more subdued growth in the December quarter. But the final batch of indicators released last week actually suggest a slight contraction. We now estimate that GDP fell by 0.2% in the December quarter.
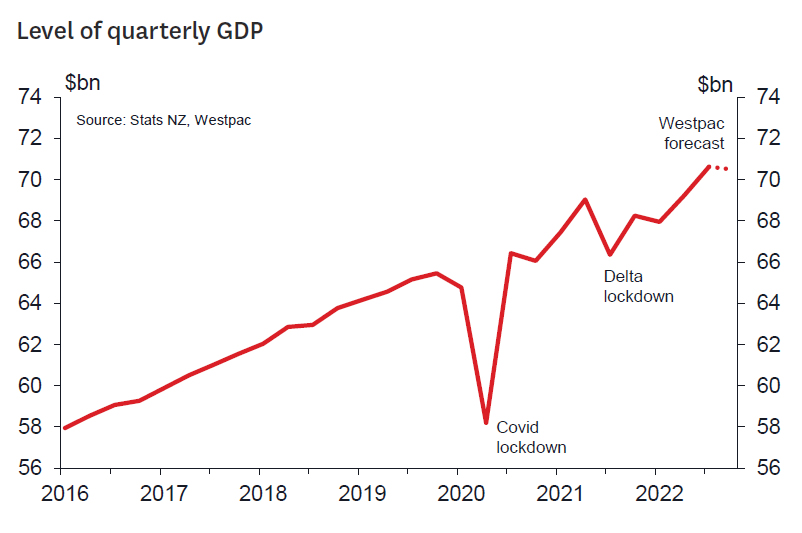
Whether this is a sign that recession has come upon us earlier than expected is unclear. The GDP figures have been choppy since the Covid pandemic, with Stats NZ often having to use alternative data sources, and with the border closure in particular throwing out the normal seasonal patterns in activity. If our forecast is right, this will be the third time in two years that we see a drop in quarterly GDP that wasn't the result of a lockdown.
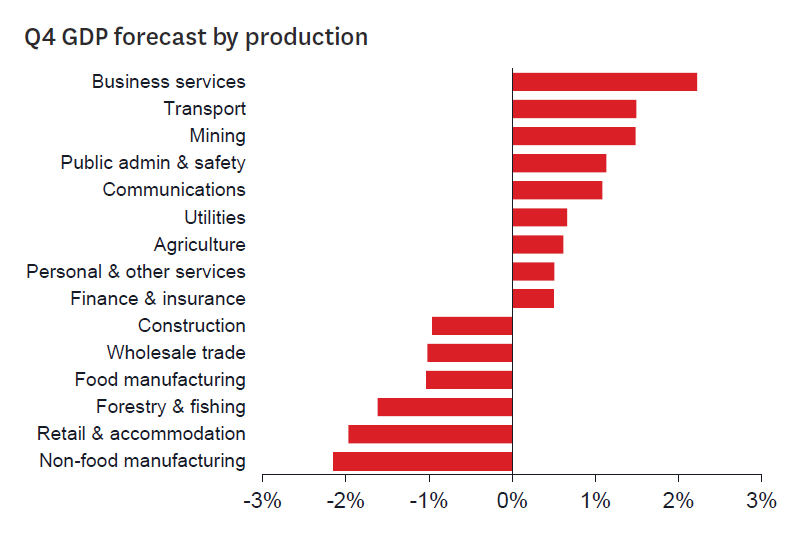
Moreover, the details don't tell as clean a story as we might like about the Reserve Bank's efforts to slow the economy. Goods-producing sectors were softer across the board in the December quarter, with retail, wholesaling, manufacturing and construction all likely recording declines. But services sectors are still looking robust – and not just those relating to international tourism, but areas like professional services as well. There's no obvious reason why tight monetary policy would have such disparate effects.
Some of the higher-frequency data that was genuinely weaker at the end of last year has picked up a little in the last two months. Card spending showed that the December splurge was smaller than usual, but January and February were more like normal. The manufacturing PMI remained below 50 in the December quarter (signalling a contraction in activity), but has risen above that mark again.
Finally, we know that March quarter GDP is going to be affected by the January floods and Cyclone Gabrielle. And as the 2011 Christchurch earthquake showed, the initial loss of activity can end up being almost immediately outweighed by the boost from repairs, replacement and cleaning up. While we did have a small drop pencilled in for March quarter GDP, it's likely that we'll end up revising that higher.
Notwithstanding the current volatility in the GDP numbers, we still think that the scene is set for the economy to head into recession later this year. Homeowners will increasingly be rolling onto much higher mortgage rates in the coming months. That will require some belt-tightening on their discretionary spending, until activity is reined back in to more sustainable levels.
We now expect a 25bp OCR hike in April.
Our forecast is around the middle of the range of market forecasts (although almost all locally-based forecasters are picking a negative number). More importantly, it's looking a lot weaker than the 0.7% increase that the Reserve Bank assumed in its February Monetary Policy Statement. That doesn't preclude the case for tighter monetary policy – the economy is still coming from an overheated starting point, just not as much as the RBNZ thought.
The RBNZ's February projections sat somewhere between a 25 and a 50 basis point hike at the next OCR review on 5 April. Previously we favoured a 50 point move, on the basis that the RBNZ's recent tactic have been to move quickly towards where it thinks the OCR needs to be. But with the likelihood of a much weaker than expected GDP result – and effectively no other major data releases between now and April – we now expect the RBNZ to lean towards a smaller 25 basis point increase.
For now we've kept the peak of our OCR forecasts at 5.50%, with two further 25 basis point hikes in May and July. The April review is not a full Monetary Policy Statement so the RBNZ won't be publishing new projections anyway. But in February there was a sense that the RBNZ has deferred the question of how high interest rates will need to go until the May review, when they will have a better sense of the inflationary effects of both the cyclone's impact and the fiscal response.
EUR/USD Rallies Above Resistance, Gold Price Skyrockets
Key Highlights
- EUR/USD climbed higher above the 1.0680 resistance zone.
- It broke a major bearish trend line with resistance near 1.0675 on the 4-hours chart.
- GBP/USD also recovered above the 1.2000 resistance zone.
- Gold price surged above the $1,850 and $1,860 resistance levels.
EUR/USD Technical Analysis
The Euro found support near the 1.0525 zone against the US Dollar. EUR/USD formed a base and started a steady increase above the 1.0600 resistance zone.
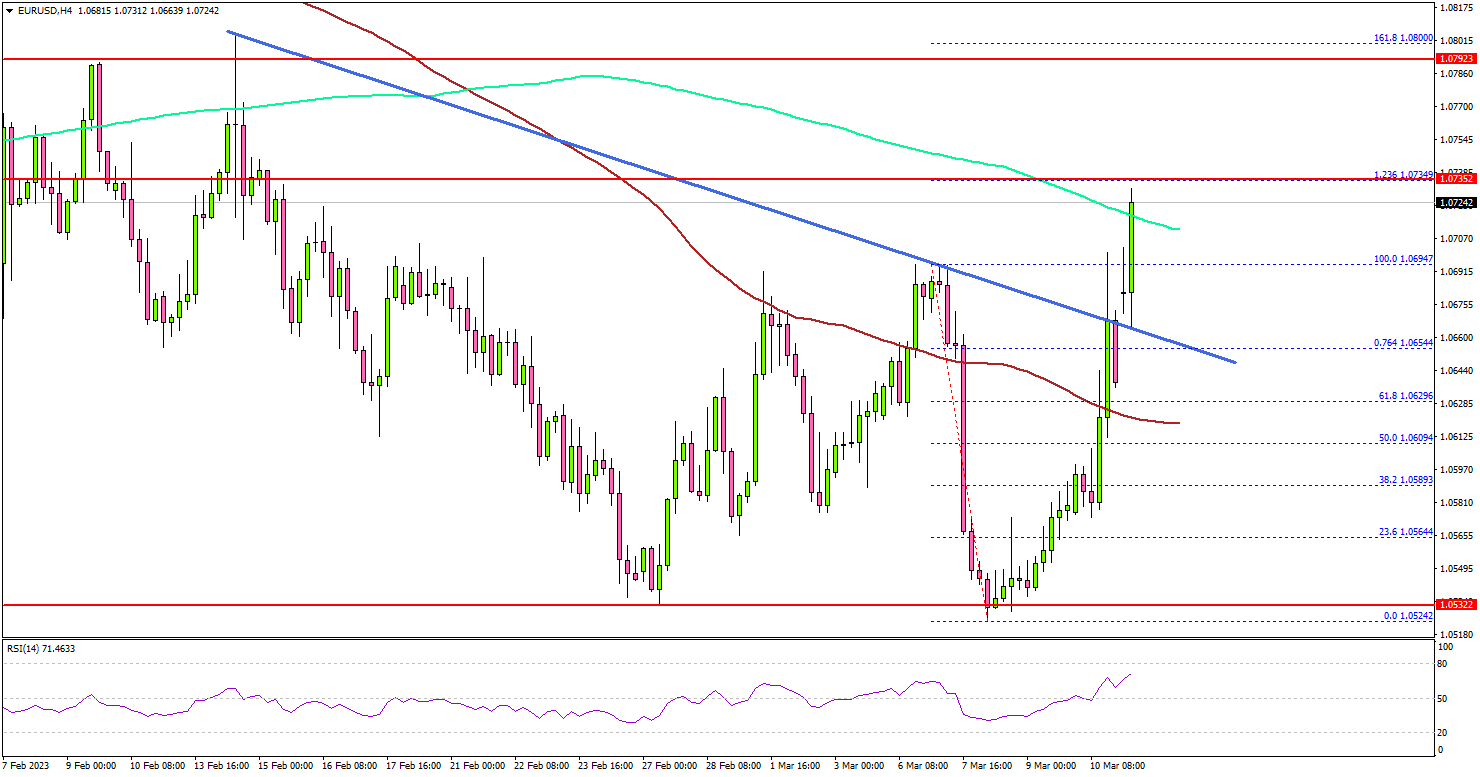
Looking at the 4-hours chart, the pair gained pace above the 1.0650 resistance and the 100 simple moving average (red, 4-hours). Besides, the pair broke a major bearish trend line with resistance near 1.0675.
It opened the doors for more gains above the 1.0680 resistance and the 200 simple moving average (green, 4-hours). The pair is now trading above the 1.0700 level.
An immediate resistance is near the 1.0740 level. It is near the 1.236 Fib extension level of the downward move from the 1.0697 swing high to 1.0525 low. The next major resistance is near the 1.0800 level.
A clear move above the 1.0800 resistance might start another increase towards the 1.0920 zone. Any more gains might send the pair towards 1.1000.
On the downside, an immediate support is near the 1.0700. The next major support is near the 1.0680 level, below which there is a risk of a move towards the 1.0630 level and the 100 simple moving average (red, 4-hours).
Looking at gold price, there was a strong rally and the price was able to climb higher towards the $1,900 resistance zone.
Economic Releases
- Eurogroup Meeting.
Forex and Cryptocurrency Forecast
EUR/USD: USA Labor Market Stops USD
Jerome Powell played on the dollar side last week. Of course, the Fed Chairman knew that markets expected an interest rate increase of 25 basis points (bps) from the next FOMC (Federal Open Market Committee) meeting. But he did not rule out that his organization could take a more decisive step in an effort to curb inflation and raise it by 50 bp on March 22 at once. Moreover, it had been earlier expected that the rate would reach 5.00-5.25% at the peak. Now Powell and his colleagues do not rule out that its maximum value will be 5.50%. (According to Commerzbank strategists, even an increase to 6.00% is possible).
And so, to avoid a shock, the head of the Fed decided to prepare the markets for this in advance. His speech to the US Congress on Tuesday, March 7, was extremely hawkish, as a result of which the DXY Dollar Index updated its 2023 highs, soaring to 105.86, and EUR/USD lost more than 170 points, finding a local bottom at 1.0523. The probability of a 50bp rate hike in March rose to 70% (it was 23-30% a week ago, and the markets estimated it at only 9% a month ago).
However, the dollar could not build on its success, and EUR/USD turned north in the middle of the week. Data from the US labor market helped to lose ground. The number of initial applications for unemployment benefits published on Thursday March 09 amounted to 211K against the expected 195K and 190K a month earlier. This indicator exceeded the 200K mark for the first time since the first half of January and reached its maximum since the end of December 2022. In addition, short-term speculators began to take profits on the USD ahead of the report on the US labor market for February, published on Friday, March 10. And they did the right thing, as the dollar continued to retreat. The report showed that the number of new jobs created outside the agricultural sector (NFP) was 311K, which is more than the forecast of 205K, but significantly less than in January - 503K. Together with an increase in unemployment by 3.6% (forecast 3.4% and 3.4% in January), these data indicate a cooling of the country's economy, which in turn may cool down the hawkish ardor of FOMC members. This was confirmed by the dynamics of EUR/USD, which soared to a height of 1.0700 just a few hours after the publication of the report.
As for the euro area, the macro data looked neutral last week. Thus, the Consumer Price Index (CPI) in Germany, the locomotive of the European economy, remained at the same level and fully met the forecasts - 8.7% in annual terms.
The last chord of the week sounded at 1.0638. And despite the fall of the dollar at the end of the week, 80% of analysts expect it to strengthen in the near future, the remaining 20% have taken a neutral position, not a single vote has been cast for the growth of the euro. Among the oscillators on D1, 25% are red, another 25% are green, and 50% are neutral gray. Among trend indicators, 80% recommend buying, 20% - selling. The nearest support for the pair is located at 1.0600-1.0620, then there are levels and zones 1.5000-1.0530, 1.0440, 1.0375-1.0400, 1.0300 and 1.0220-1.0255. Bulls will meet resistance in the area of 1.0650, 1.0700, 1.0740-1.0760, 1.0800, 1.0865, 1.0930, 1.0985-1.1030.
There will be quite a lot of economic statistics next week. Moreover, it will certainly play a very important role in the decisions of both the Fed and the ECB. Thus, data on consumer inflation (CPI) in the US will be received on Tuesday, March 14. Data on retail sales in this country, as well as the US Producer Price Index (PPI), will be released the next day. The European Central Bank will decide on the euro interest rate on Thursday, March 16, which is expected to be raised by 50 bp., from 2.50% to 3.00%. Of course, the subsequent comments of the ECB management on monetary policy are also of absolute interest to market participants. And finally, the value of CPI in the Eurozone will become known at the very end of the working week, on March 17.
GBP/USD: Volatility Is High, the Result Is Zero
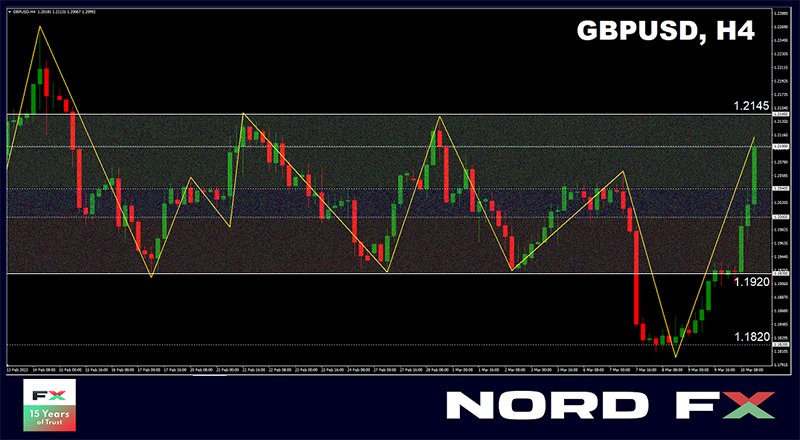
The result of the past five days for GBP/USD, despite the volatility of 310 points, ended up being close to zero. The pair finished the working week at the level of 1.2025, returning to the central zone of the side channel 1.1920-1.2145. The reason for this dynamics is the same as for EUR/USD, since both pairs were actively reacting to what was happening in the US. There were no important macro statistics from the United Kingdom all week until Friday, March 10, when the data on GDP and industrial production for January were released.
The first indicator showed an increase from -0.5% to +0.3% with a forecast of +0.1%, the second one, on the contrary, fell. UK manufacturing output fell from 0.0% to -0.4% in January against the forecast of -0.1%, while total industrial output was -0.3% m/m versus -0.2% and +0.3% expected in December. Thus, the data on GDP added optimism to the bulls on the pound, while the data on industrial production reduced it slightly.
According to Commerzbank economists, the Bank of England (BoE) is unlikely to help the British currency. Recall that the head of the Bank of England (BoE), Andrew Bailey, speaking on Wednesday, March 01, further fogged the issue, saying that the final decision on the prospects for the monetary policy of the British Central Bank has not yet been made, and that the regulator should be flexible in the coming months so as not to scare the markets. And as long as this regulator sticks to its rather cautious stance, unlike the Fed and the ECB, the pound is likely to remain under downward pressure. The Bank of England, instead of actively fighting high inflation, is likely to act as a catch-up, which will lead GBP/USD to further decline.
Experts' median forecast for the near term is similar to the forecast for EUR/USD: 75% of experts vote for the strengthening of the dollar and the fall of GBP/USD, the remaining 25% prefer to abstain from forecasts. Among the oscillators on D1, the balance of power is as follows: 35% vote in favor of greens, another 35% in favor of reds, and 30% in favor of neutral grays. Among the trend indicators, a clear advantage is on the side of the greens: 75% to 25% in their favor. Support levels and zones for the pair are 1.1985-1.2000, 1.1960, 1.1900-1.1925, 1.1840, 1.1800, 1.1720 and 1.1600. When the pair moves north, it will face resistance at the levels 1.2055, 1.2075-1.2085, 1.2145, 1.2185-1.2210, 1.2270, 1.2335, 1.2390-1.2400, 1.2430-1.2450, 1.2510, 1.2575-1.2610, 1.2700, 1.2750 and 1.2940.
As for the release of British macro statistics, next week's calendar includes Tuesday, March 14, when data on the unemployment rate and wages in the United Kingdom will be received.
USD/JPY: The Dollar Decides Everything
The meeting of the Bank of Japan (BOJ) was held at the very end of last week, on Friday, March 10, which was chaired for the last time by the former head, Haruhiko Kuroda. It went exactly as expected: the Japanese Central Bank did not change the parameters of its ultra-stimulating monetary policy, the interest rate again remained at the previous negative level of -0.1%.
Haruhiko Kuroda, speaking at his last press conference and commenting on the results of the last meeting of the Central Bank, said that the positive effect of monetary policy easing has significantly exceeded its side effects. At the same time, he noted that the regulator "will not hesitate to continue easing monetary policy if necessary" and that "it is important to continue to ease it in order to stimulate companies to raise wages." Kazuo Uedu, the new CEO of BoJ, is likely to follow his predecessor's precepts. At least, one should not expect any sharp steps from him.
At the moment, the American currency is decisive in this, as in other dollar pairs. After the release of data on the US labor market, the dollar fell to new lows around the world, while futures for US stock indices turned positive. If USD/JPY was trading at 137.90 on Wednesday, March 08, it found the bottom at 134.10 on March 10, and ended the week after a correction at 135.05.
As for the immediate prospects, 75% of experts vote for the pair's movement to the south at the moment, 25% point in the opposite direction. Among the oscillators on D1, 25% point north, 40% look in the opposite direction, and the remaining 35% look east. For trend indicators, 40% point north, and 60% look south. The nearest support level is located at 134.75 zone, followed by levels and zones 134.00-134.35, 133.60, 132.80-133.20, 131.85-132.00, 131.25 130.50, 129.70-130.00. Levels and resistance zones are 135.15, 136.00-136.30, 136.70-137.10, 137.50, 139.00-139.35, 140.60, 143.75.
Among the events of the upcoming week, we can mention the publication of the Report on the last meeting of the Bank of Japan on Wednesday, March 15. Although, this document is unlikely to make a serious impression on market participants.
CRYPTOCURRENCIES: It's Really Bad. Will it get worse?
Bitcoin continues to be under pressure from an avalanche of bad news. A record $94 million in bullish positions for 2023 was liquidated on Thursday, March 10 alone. Analysts at Santiment are recording massive negative sentiment towards cryptocurrencies. The gloomy mood of players and investors has been influenced by:
1. Liquidation of Silvergate crypto bank. After the close of trading on the New York Stock Exchange on March 8, Silvergate Capital Corp., the American company that manages this bank, announced its intention to curtail its activities and voluntarily liquidate it. Given Silvergate's impressive customer base, this could cause a domino effect similar to last year's.
2. Potential U.S. government sale of $1 billion in bitcoin.
3. Possible tightening of the Fed's monetary policy, which has collapsed the quotes of all risky assets, including stocks and cryptocurrencies.
4. Continued crackdown on crypto exchanges. On March 09, the New York prosecutor's office filed a lawsuit against KuCoin, due to the lack of registration of this exchange in the United States as a securities broker. The fact is that Attorney General Letitia James, as well as SEC Chairman Gary Gensler, consider altcoins to be securities.
5. And finally, as icing on the cake, the proposals of the US President Biden's administration to ban crypto companies from tax maneuvers and to establish a 30% electricity tax for miners. A tax maneuver is a financial transaction when a company, with an unrecorded loss, first sells crypto assets and immediately buys them again, which reduces the amount of tax. The introduction of a 30% tax on electricity can deal a crushing blow not only to American miners, but also to the industry as a whole.
In our opinion, there is plenty of bad news for one week. Now let's try to add at least a few tablespoons of honey to this barrel of tar. According to Credible Crypto experts, at the moment, about 73% of all BTC coins are concentrated in the hands of experienced holders who are used to taking a hit and able to withstand the most severe crypto frosts. And Santiment reminds that such a total negative led earlier to a noticeable upward rebound in prices.
Eight Global CEO Michael Van De Poppe noted the importance of the next few weeks for bitcoin. "Capitalization could drop to $860 million, dragging the entire market down with it," he warned. According to the expert's forecast, the price of bitcoin may fall to $19,700. Recall that he said just recently that in the worst case, the bottom could be even lower, at the level of $18,000, after which the coin will go up and could reach $40,000 this year.
Felix Zulauf, founder of hedge fund Zulauf Consulting, has suggested that bitcoin will head into a clear bull run sometime in late spring. The expert does not rule out that the asset could reach $100,000 on a sharp uptrend. Despite the bearish dynamics, Credible Crypto experts also remain optimistic about the medium-term prospects for the flagship crypto asset. They agree with Felix Zulauf that bitcoin may reach its all-time high this year. However, before a sustainable bull trend begins, the asset, in their opinion, will face several obstacles. (We have already listed five of them above)
Arthur Hayes, former CEO and co-founder of the BitMEX crypto exchange, believes that the bitcoin rally will start at a time when the global economy is in an oil crisis. In his opinion, a sharp increase in hydrocarbon prices will create conditions for the growth of digital assets and, first of all, bitcoin.
Hayes's logic is as follows: against the background of geopolitical tensions in the world, demand for energy resources will increase, as oil exporters are likely to reduce production. In this situation, the United States, as a leading economic power, will have to increase its own oil production. The Fed will need to ease the monetary rate to stimulate business activity in the energy sector. As soon as the regulator starts lowering interest rates, capital will return to risky assets, including cryptocurrencies. In addition, the former head of BitMEX recalled that the limited supply of BTC will also contribute to its growth, as the US dollar will lose ground.
It is appropriate here to cite data from the analytical platform WooBull, according to which the inflation rate of bitcoin is now at least three times lower than that of the US dollar. This allows BTC to act as a possible hedge against capital depreciation and economic uncertainty. Statistics show that the inflation rate of the first cryptocurrency has been steadily declining since its inception in 2009 and amounted to 1.79% as of March 04. At the same time, the same indicator for USD reached 6.4% in 2023, which is 3.57 times higher than that of BTC.
The decrease in bitcoin inflation is due to the asset's deflationary model, supported by halvings, which reduce the speed of coin mining and halve miners' rewards. Experts also believe that this indicator remains low due to the decentralization of BTC, which avoids most of the political and economic risks typical of the US dollar, whose inflation rate, on the contrary, will increase. This is primarily due to an excessive increase in the money supply, a decrease in demand and/or a reduction in production.
In the meantime, at the time of writing the review (March 10, 23:00 NordFX server time), BTC/USD is trading in the $20,070 zone. (the report on employment in the US has slightly supported the quotes). The total capitalization of the crypto market for the week fell below the psychologically important level of $1 trillion and is $0.937 trillion ($1.024 trillion a week ago). The Crypto Fear & Greed Index fell from 50 to 34 points in a week and moved from the Neutral zone to the Fear zone.
The forecast made by well-known cryptanalyst and host of DataDash YouTube channel Nicholas Merten causes fear as well. He did not rule out a new major drop in ethereum. According to the specialist, if we take into account previous bear markets when forecasting, ETH could fall by more than 90% from its historical high, that is, find itself at the level of several hundred dollars. "ETH/USD has a long way to go. "We're only 67% from the record," Merten says. "And if we see again what we had in previous bear markets, say, a 92 percent correction or a 94 percent correction, the price of ETH will drop to several hundred dollars. The difference is huge, from $870 to about $500."
We usually try to end our review on an optimistic note. But what if after a long crypto winter, instead of spring, we'll get another harsh winter? Although, let's still hope that the crypto calendar will be directly correlated with the regular calendar. And it is now the first month of spring, which should be followed by a warm sunny summer.
EUR/USD Weekly Outlook
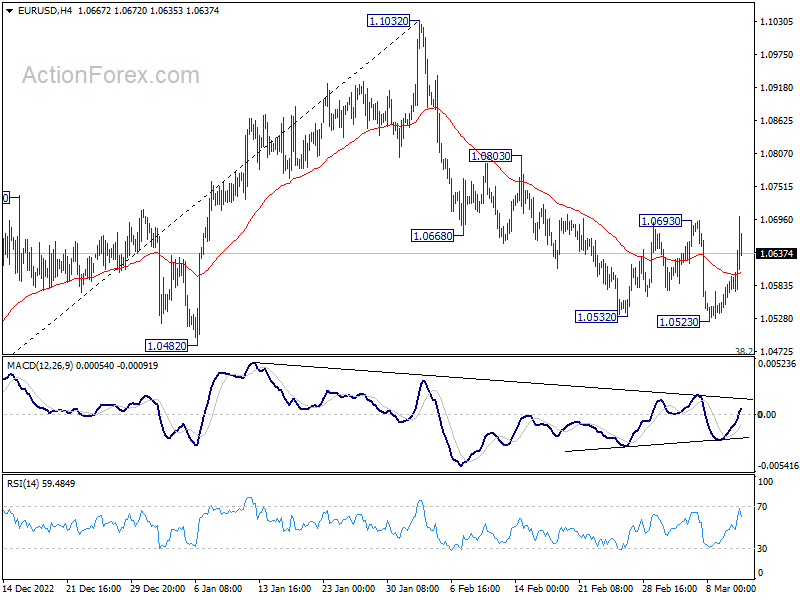
EUR/USD edged lower to 1.0523 but rebounded strongly since then. Yet, it couldn't take out 1.0693 resistance decisively. Initial bias remains neutral this week first. Fall from 1.1032 is seen as a corrective move only. Then, in case of another decline, downside should be contained by 38.2% retracement of 0.9534 to 1.1032 at 1.0463 to bring rebound. Firm break of 1.0693 will confirm short term bottoming, and turn bias back to the upside for 1.0803 resistance and above.
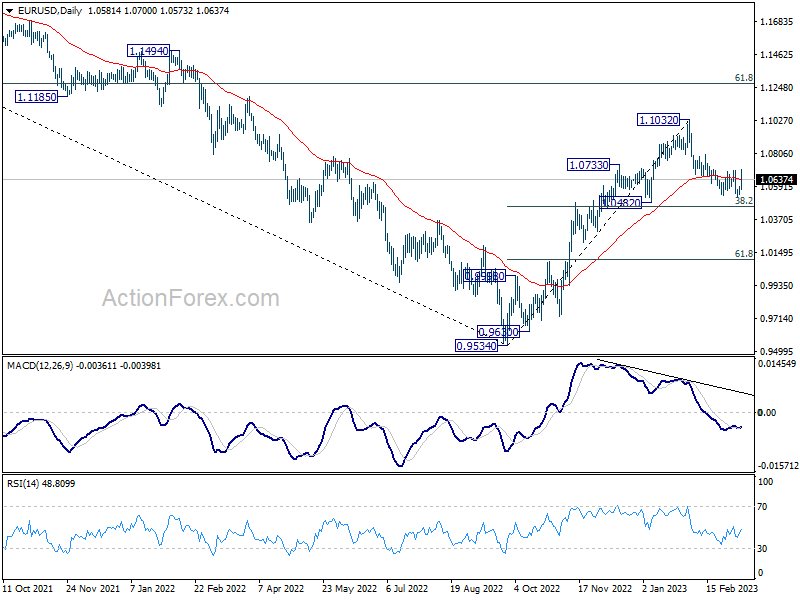
In the bigger picture, as long as 1.0482 support holds, rise from 0.9534 (2022 low) should continue to 61.8% retracement of 1.2348 (2021 high) to 0.9534 at 1.1273. However, sustained break of 1.0482 will bring deeper fall to 61.8% retracement of 0.9534 to 1.1032 at 1.0106, even as a corrective pull back.
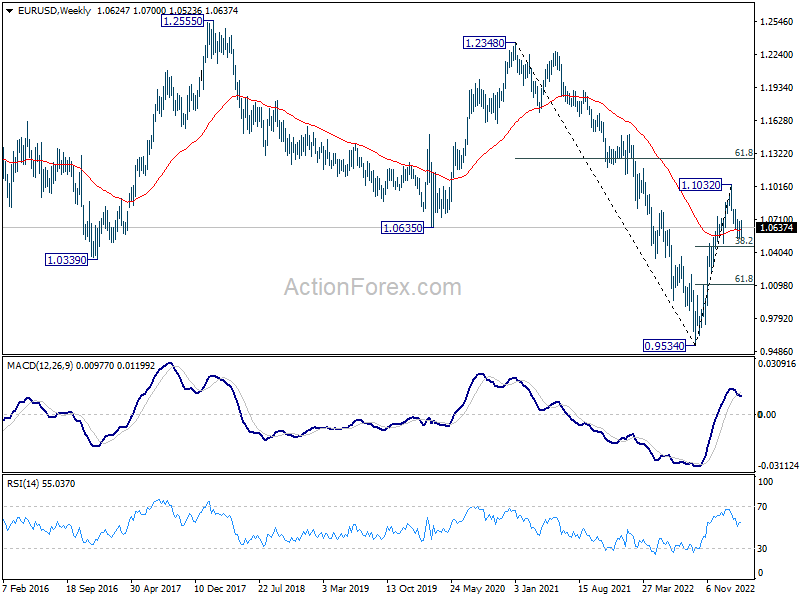
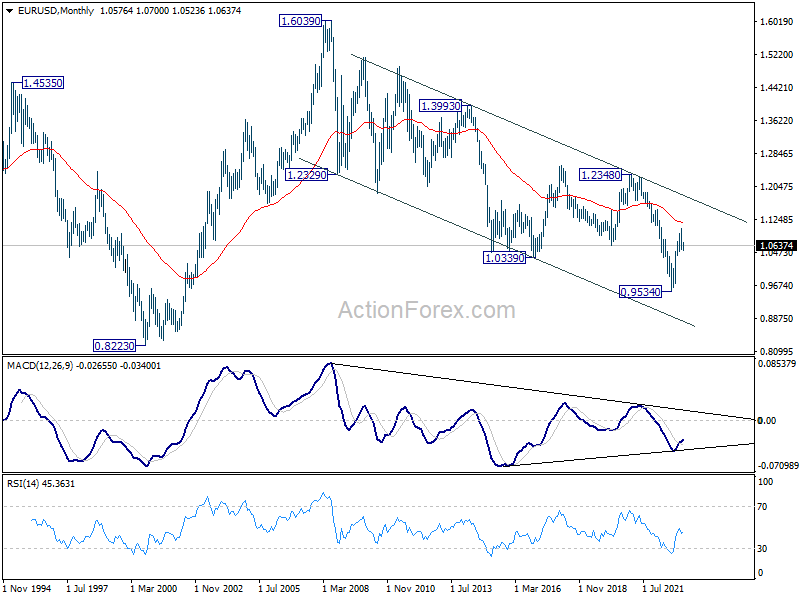
In the long term picture, while it's too early to call for long term trend reversal at this point, the strong break of 1.0635 support turned resistance (2020 low) should at least turn outlook neutral. Focus will turn to 55 month EMA (now at 1.1165). Rejection by this EMA will revive long term bearishness.
USD/JPY Weekly Outlook
USD/JPY's decline last week confirms short term topping at 137.90, on bearish divergence condition in 4 hour MACD. Initial bias stays on the downside this week for 38.2% retracement of 127.20 to 137.90 at 133.81. Some support could be seen there to bring rebound. But near term risk will stay on the downside as long as 137.90 resistance holds, in case of recovery. Sustained break of 133.81 will carry larger bearish implication and target 61.8% retracement at 131.28.
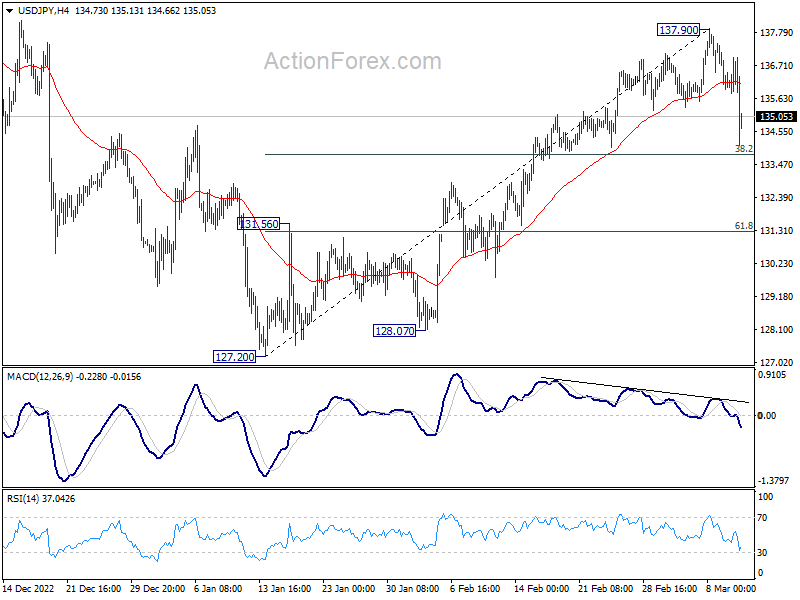
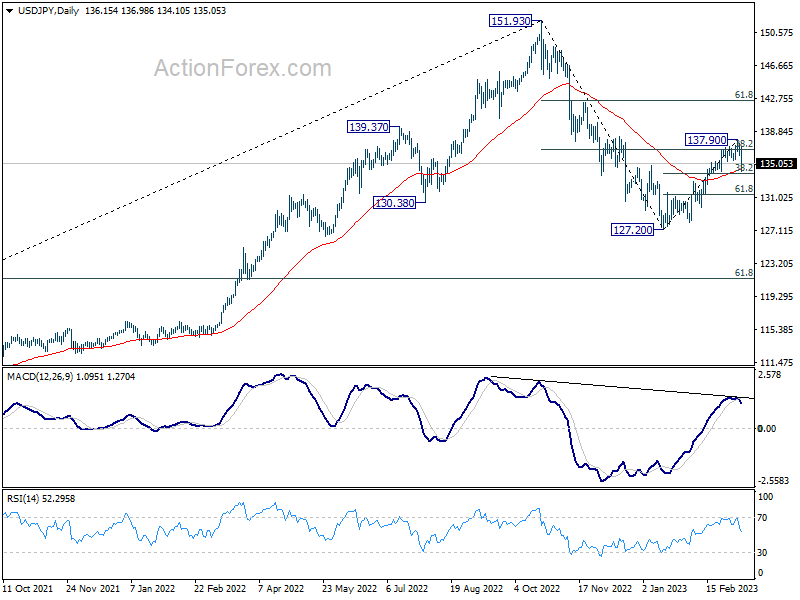
In the bigger picture, down trend from 151.93 (2022 high) is tentatively seen as completed at 127.20 already. Break of 137.90 will resume the rise to 61.8% retracement of 151.93 to 127.20 at 142.48. However, sustained trading below 55 day EMA (now at 134.31) will dampen this bullish view, argue that fall from 151.93 is still on track to another low below 127.20.
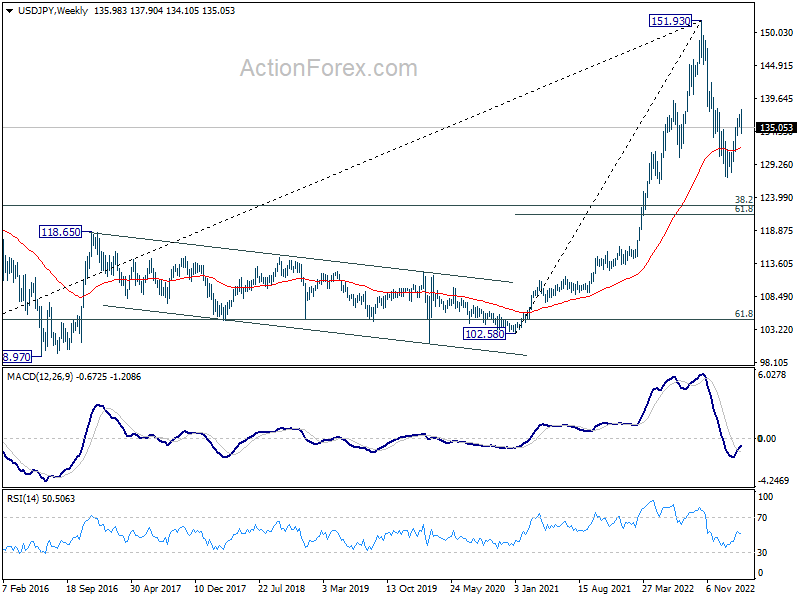
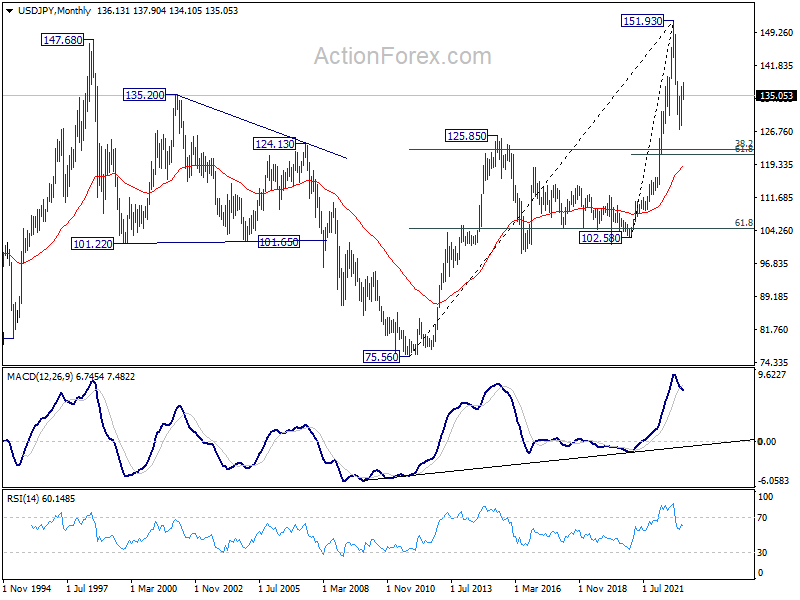
In the long term picture, price action from 151.93 is seen as developing into a corrective pattern to up trend from 75.56 (2011 low). While deeper decline cannot be ruled out, downside should be contained by 38.2% retracement of 75.56 to 151.93 at 122.75.
GBP/USD Weekly Outlook
Despite dipping to 1.1801, GBP/USD quickly quickly rebounded after drawing support from 1.1840. Initial bias stays mildly on the upside this week. Sustained trading above 55 day EMA (now at 1.2052) will argue that consolidation pattern from 1.2445 has complete. Further rally would be seen back to retesting 1.2445/6 resistance. Nevertheless, below 1.1937 minor support. will turn bias neutral first.
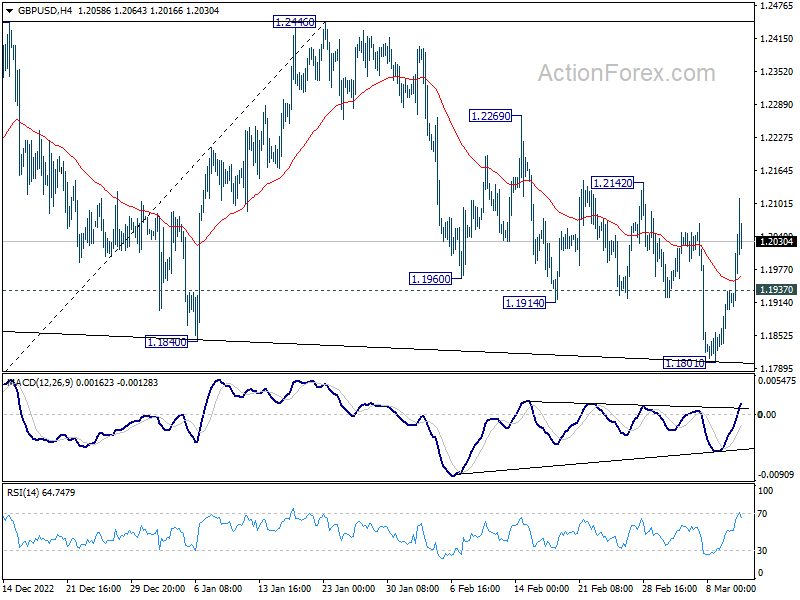
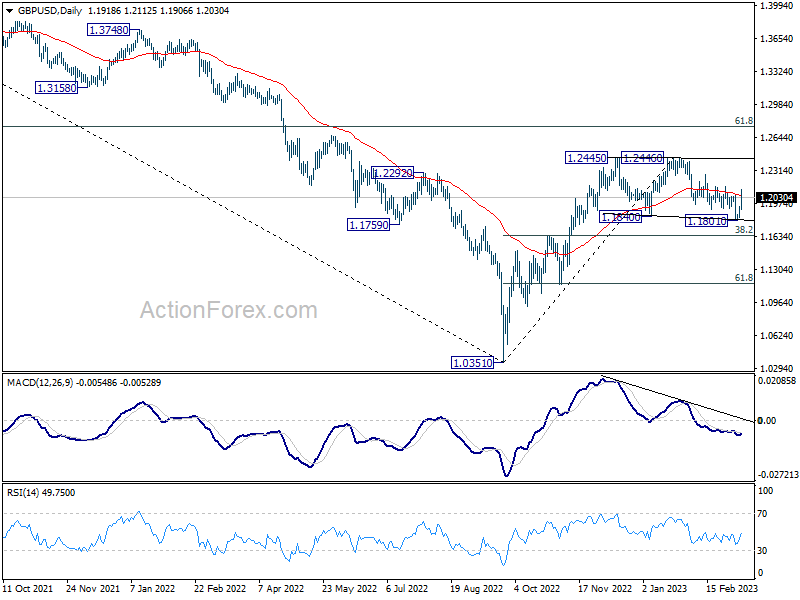
In the bigger picture, price action from 1.2445 are seen as a corrective pattern to rise from 1.0351 medium term bottom (2022 low). Resumption is expected as a later stage and firm break of 1.2446 will target 61.8% retracement of 1.4248 (2021 high) to 1.0351 at 1.2759. This will remain the favored case as long as 38.2% retracement of 1.0351 to 1.2445 at 1.1645 holds.
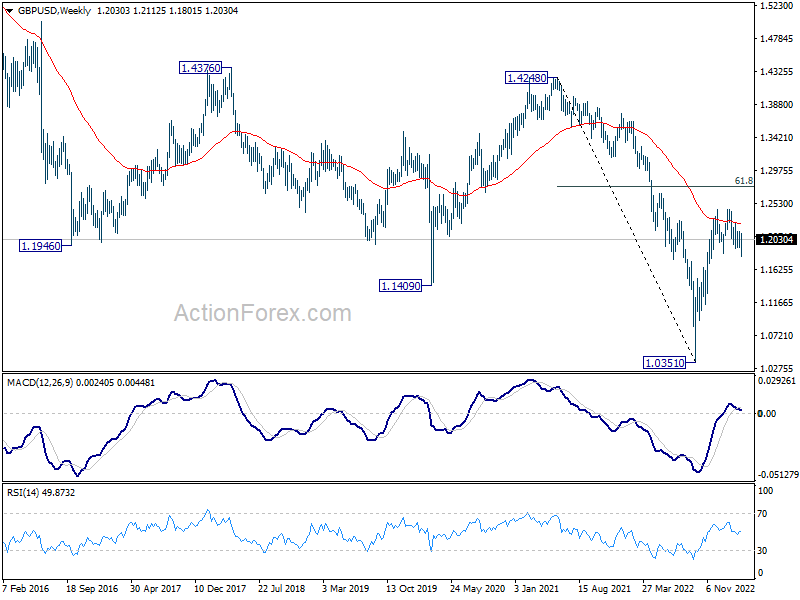
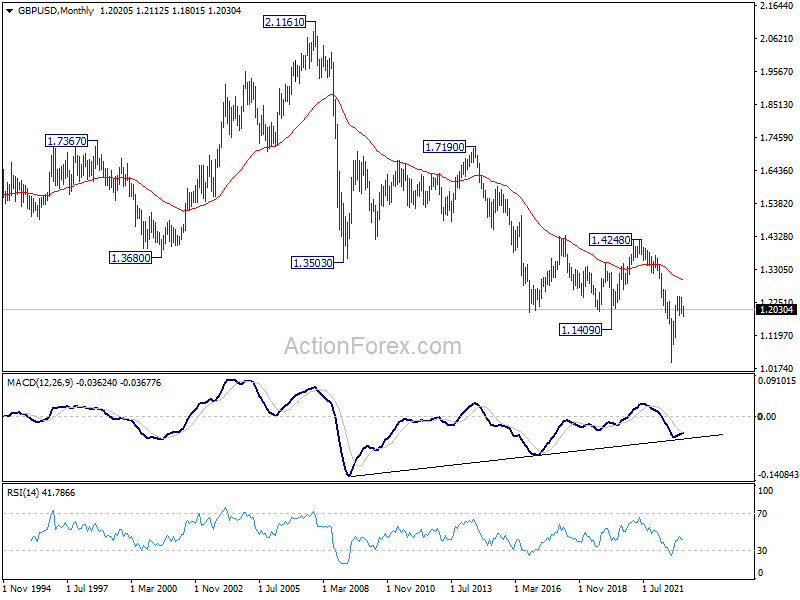
he longer term picture, as long as 1.4248 resistance holds (2021 high), long term outlook will remain neutral at best. Down trend from 2.1161 (2007) could still resume for another low through 1.0351 at a later stage.
USD/CHF Weekly Outlook
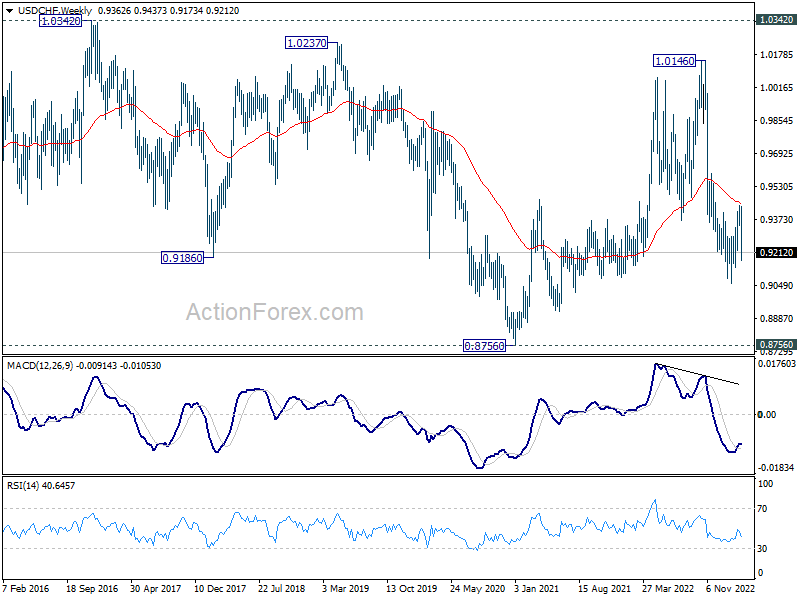
USD/CHF's sharp decline last week suggests that corrective rebound from 0.9058 has completed at 0.9439 already, ahead of 38.2% retracement of 1.0146 to 0.9058 at 0.9474. Initial bias stays on the downside this week for retesting 0.9058 low. Decisive break there will resume larger down trend from 1.0146. Next target is 61.8% projection of 1.0146 to 0.9058 from 0.9439 at 0.8767. On the upside, above 0.9284 minor resistance will turn intraday bias neutral first. But risk will now stay on the downside as long as 0.9439 resistance holds.
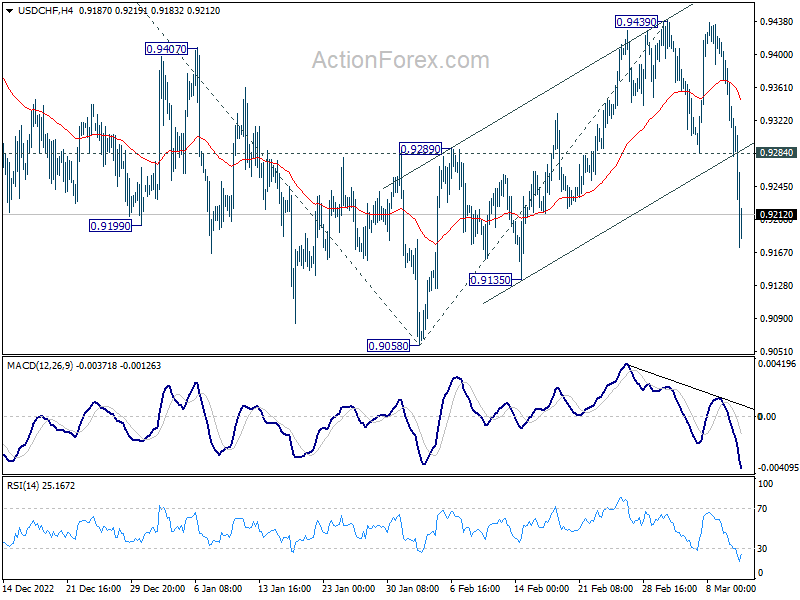
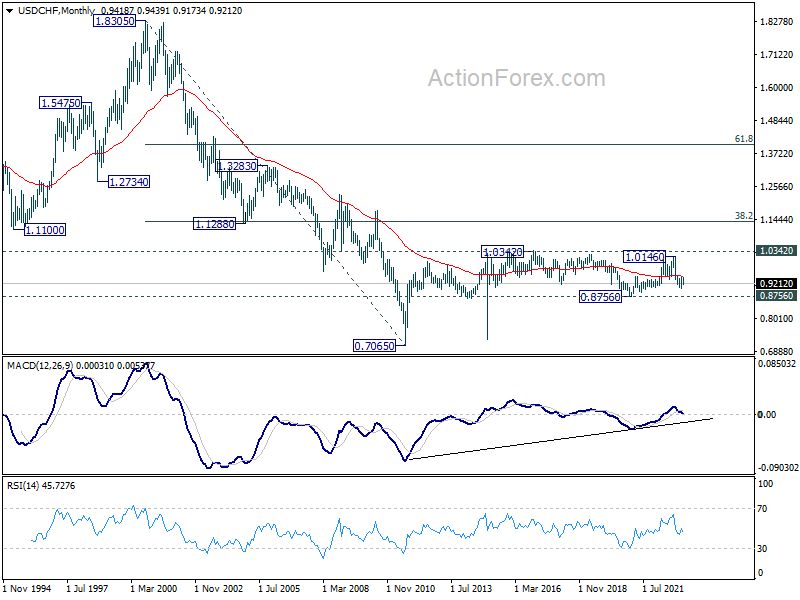
In the bigger picture, fall from 1.1046 (2022 high) is should still be in progress with 38.2% retracement of 1.0146 to 0.9058 at 0.9474 intact. Rejection by 55 week EMA is also a medium term bearish sign. Break of 0.9058 will resume such decline towards 0.8756 support (2021 low). But overall, such fall is still as a leg in the long term range pattern from 1.0342 (2016 high). So, downside should be contained by 0.8756 to bring reversal. For now, this will remain the favored cas as long as 0.9439 resistance holds.
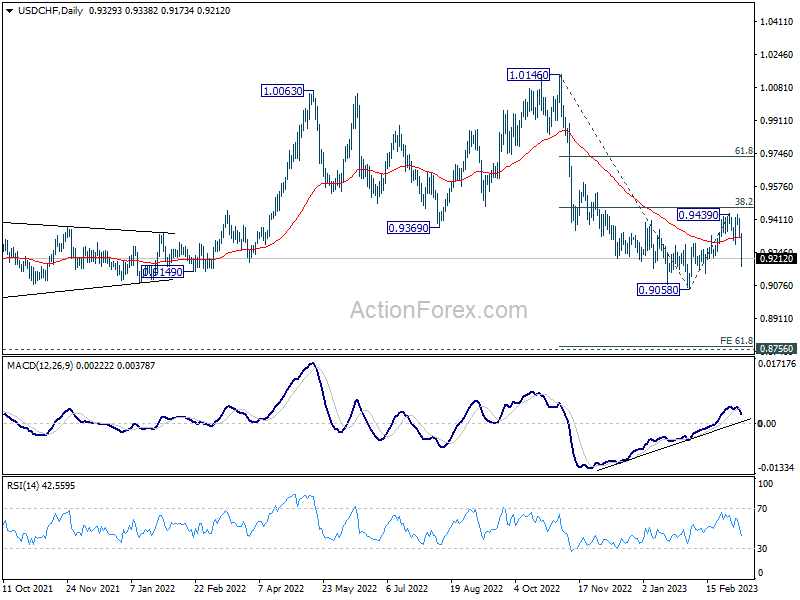
In the long term picture, long term sideway pattern from 1.0342 (2016 high) is extending. Overall, range trading should continue until further development.