

Sample Category Title
Bank Crisis Hammers Fed Hike Expectations
The Silicon Valley Bank (SVB) went bust on Friday, around 44 hours after announcing that they would raise capital to fill in an almost $2 billion hole, after the bank sold its loss-making portfolio, rich in US treasuries, to pay their depositors – who are mostly tech startups – back in the actual environment of rising interest rates.
Signature Bank also collapsed abruptly this weekend, as regulators said that keeping the bank – which has a big real estate portfolio and law firms’ money, could threaten the stability of the entire financial system.
SVB’s flash crash raised questions that other similar local banks in the US could also experience liquidity issues and may not be able to pay their depositors back, unless they also start selling their probably loss-making portfolios.
So, the likes of First Republic Bank, PacWest Bancorp and Signature Bank suffered heavy losses on Friday.
Across Europe, big banks pulled indices down on Friday, as well – even though they are not expected to have similar liquidity issues as the Silicon Valley Bank. Most big banks have a diversified client base and more importantly don’t have the same exposure to tech startups, which are extremely rate sensitive.
The contagion risk remains for small banks with highly rate-sensitive clients, but the US authorities now step in to avoid contagion. They said that SVB depositors could access their money today.
The bank crisis changes the landscape for Fed expectations
The bank crisis will be sitting in the headlines, as solutions and possible contagion beyond the banking sector and beyond the US borders will be on the menu of the week.
The latter will likely interfere with Federal Reserve (Fed) rate hike expectations, as well, as the Fed may want to think twice before stepping on the gas this month; Mr. Powell certainly doesn’t want to go down in history as the clumsiest Fed President in the history of the Fed.
So, it is well possible that the Fed may simply FORGET about a 50bp hike this month or may not hike at all.
Activity in Fed funds futures now assesses more than 98% chance for a 25bp hike in March, not because the US jobs data was soft enough to overhaul rate hike expectations last Friday, but because the Fed can’t ignore the issues caused by the steep interest rate increases in the banking sector and can’t afford to trigger a financial crisis to bring inflation back to 2%.
Economic data will be important, but the developments across the banking sector could overshadow the data.
Last Friday, the US released a mixed jobs report. The NFP printed another strong 311’000 new nonfarm jobs additions in February, versus around 200’000 expected by analysts. But the unemployment rate ticked higher from 3.4% to 3.6%, as the participation rate improved, and the wages grew less than expected.
The kneejerk market reaction was a swift decline in the US dollar, and the yields. But of course, a major part of the decline in the US short term yields is due to the expectations that the Fed may have its hands tied faced with the banking crisis and could forget about another rate hike in the immediate future.
The latest fall in US yields is not necessarily based on the best foundation for a stock rally. And indeed we saw the S&P500 dive on Friday to the bearish consolidation zone below the major 38.2% Fibonacci retracement on the October to February rally. But at the time of writing, the S&P500 futures hint at an almost 2% rise at the open.
Tomorrow, the US will release the latest inflation figures for February, and the expectation is a further decline both in headline and core inflation. A sufficient decline in US inflation will cement the idea of a 25bp hike, or no rate hike from the Fed this month. But even disappointing inflation figures may not fuel the Fed rate hike expectations, depending on how the situation evolves on the banks’ front.
USD/CAD Daily Outlook
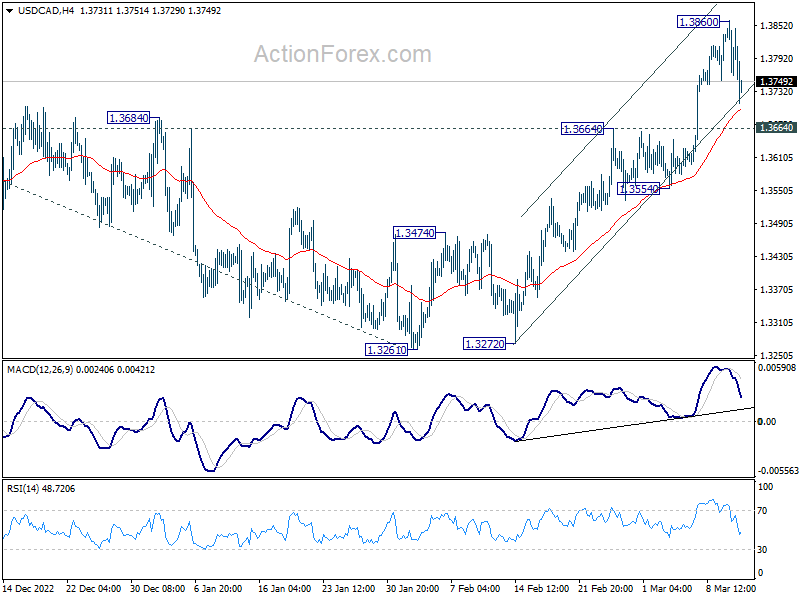
Daily Pivots: (S1) 1.3770; (P) 1.3816; (R1) 1.3870; More....
Intraday bias in USD/CAD remains neutral as consolidation from 1.3860 continues. Downside of retreat should be contained by 1.3664 resistance turned support to bring another rally. Break of 1.3860 will resume the rally from 1.3261 to retest 1.3976 high. However, firm break of 1.3664 will mix up the near term outlook and bring deeper pullback first.
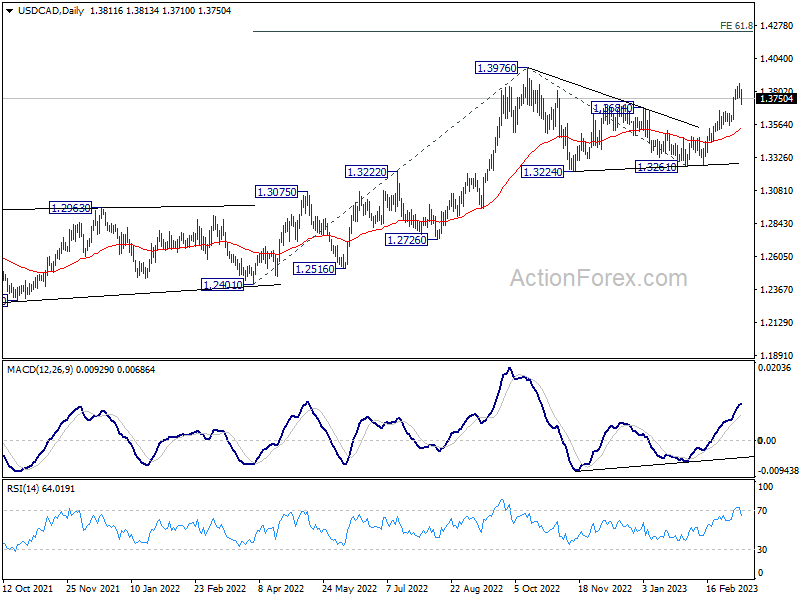
In the bigger picture, the up trend from 1.2005 (2021 low) is still in progress. Break of 1.3976 will confirm resumption and target 61.8% projection of 1.2401 to 1.3976 from 1.3261 at 1.4234. Firm break there will pave the way to long term resistance zone at 1.4667/89 (2016, 2020 highs). On the downside, break of 1.3261 support is needed to confirm medium term topping. Otherwise, outlook will remain bullish even in case of deep pull back.
AUD/USD Daily Report
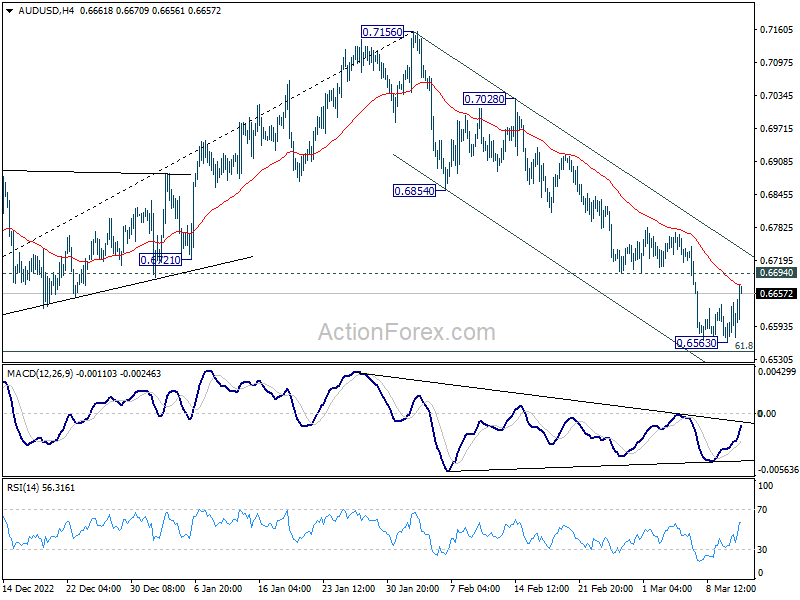
Daily Pivots: (S1) 0.6551; (P) 0.6596; (R1) 0.6626; More...
AUD/USD's recovery from 0.6563 continues today but stays below 0.6694 support turned resistance. Intraday bias remains neutral at this point. Focus is on whether 0.6546 fibonacci level would provide strong support to bring reversal. On the upside, break of 0.6694 support turned resistance will indicate short term bottoming, and turn bias back to the upside for rebound to 55 day EMA (now at 0.6803). However, sustained break of 0.6546 will carry larger bearish implication and target 0.6169 low.
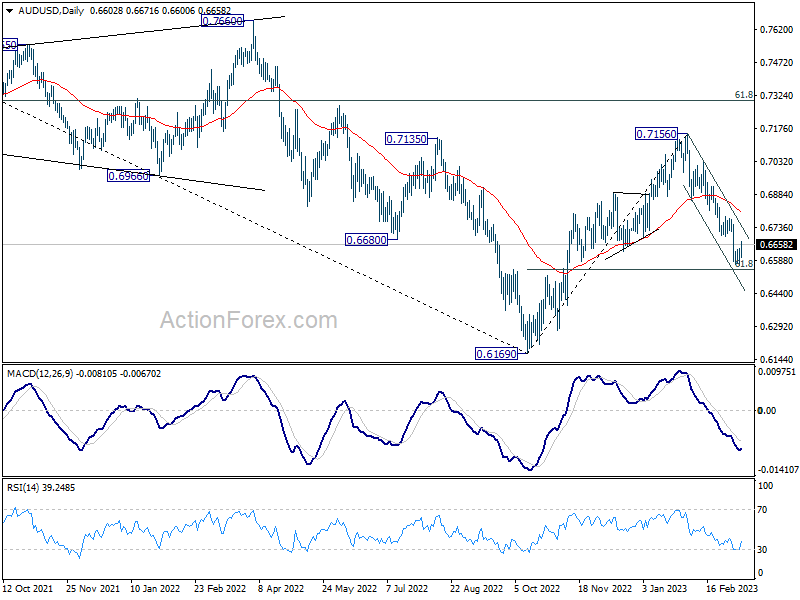
In the bigger picture, rise from 0.6169 (2022 low) has completed at 0.7156, after rejection by 55 month EMA (now at 0.7158). Deeper decline would then be see back to 61.8% retracement of 0.6169 to 0.7156 at 0.6546, even as a corrective fall. Sustained break there will raise the chance of long term down trend resumption through 0.6169 low.
USD/JPY Daily Outlook
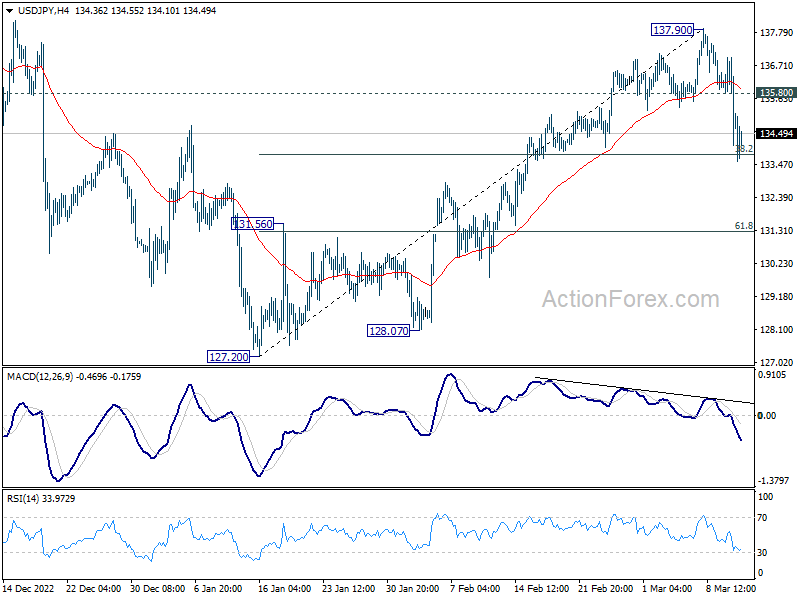
Daily Pivots: (S1) 133.80; (P) 135.39; (R1) 136.67; More...
Intraday bias in USD/JPY remains on the downside for the moment. Some support could be seen from 38.2% retracement of 127.20 to 137.90 at 133.81. Above 135.580 minor resistance will turn intraday bias back to the upside for stronger rebound. However, sustained break of 133.81 will carry larger bearish implication and target 61.8% retracement at 131.28.
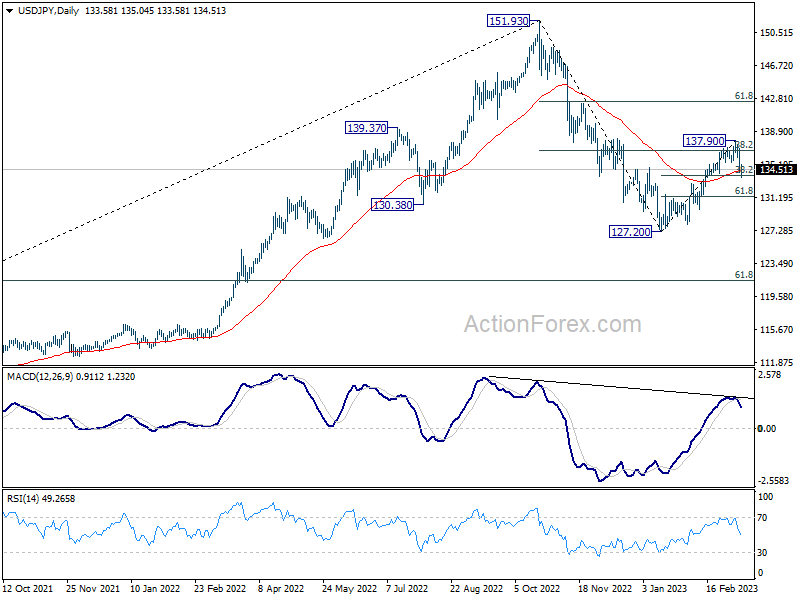
In the bigger picture, down trend from 151.93 (2022 high) is tentatively seen as completed at 127.20 already. Break of 137.90 will resume the rise to 61.8% retracement of 151.93 to 127.20 at 142.48. However, sustained trading below 55 day EMA (now at 134.31) will dampen this bullish view, argue that fall from 151.93 is still on track to another low below 127.20.
USD/CHF Daily Outlook
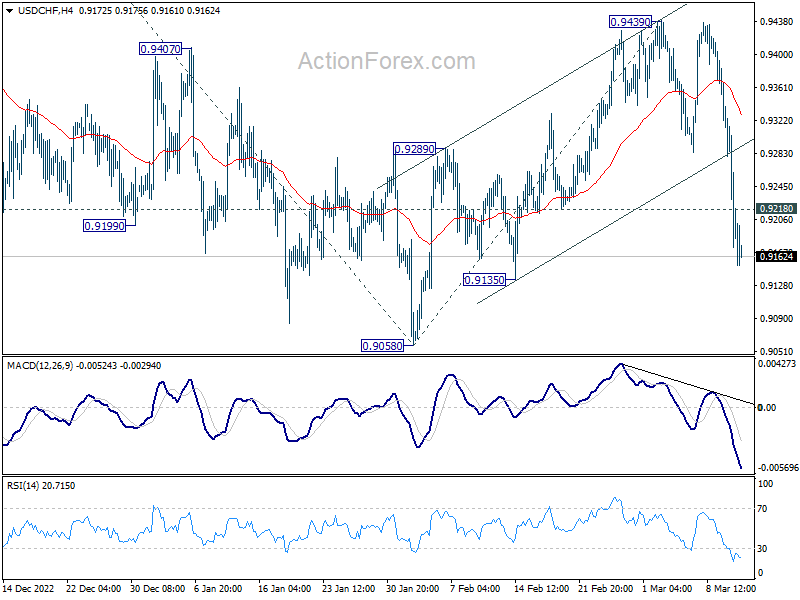
Daily Pivots: (S1) 0.9144; (P) 0.9244; (R1) 0.9313; More...
Intraday bias in USD/CHF remains on the downside for retesting 0.9058 low. Decisive break there will resume larger down trend from 1.0146. Next target is 61.8% projection of 1.0146 to 0.9058 from 0.9439 at 0.8767. On the upside, above 0.9218 minor resistance will turn intraday bias neutral first. But risk will now stay on the downside as long as 0.9439 resistance holds.
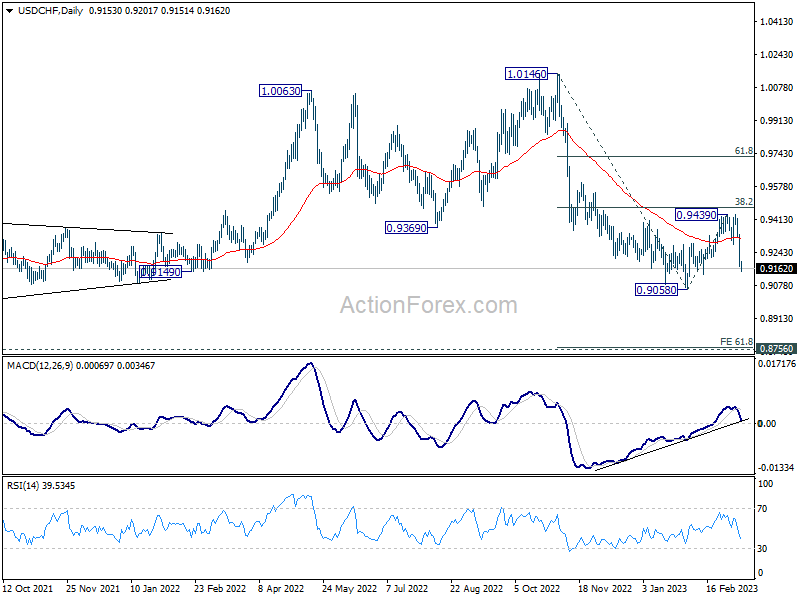
In the bigger picture, fall from 1.1046 (2022 high) is should still be in progress with 38.2% retracement of 1.0146 to 0.9058 at 0.9474 intact. Rejection by 55 week EMA is also a medium term bearish sign. Break of 0.9058 will resume such decline towards 0.8756 support (2021 low). But overall, such fall is still as a leg in the long term range pattern from 1.0342 (2016 high). So, downside should be contained by 0.8756 to bring reversal. For now, this will remain the favored cas as long as 0.9439 resistance holds.
GBP/USD Daily Outlook
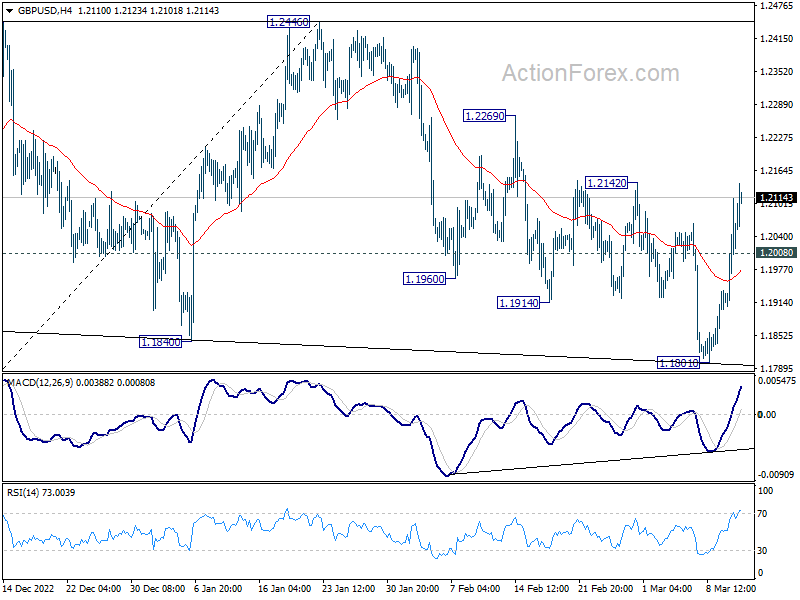
Daily Pivots: (S1) 1.1924; (P) 1.2019; (R1) 1.2129; More...
Intraday bias in GBP/USD remains on he upside for the moment. The corrective pattern from 1.2445 should have completed with three waves to 1.1801. Break of 1.2142 will bring retest of 1.2445/6 resistance zone. On the downside, below 1.2008 minor support will delay the bullish case and turn intraday bias neutral first.
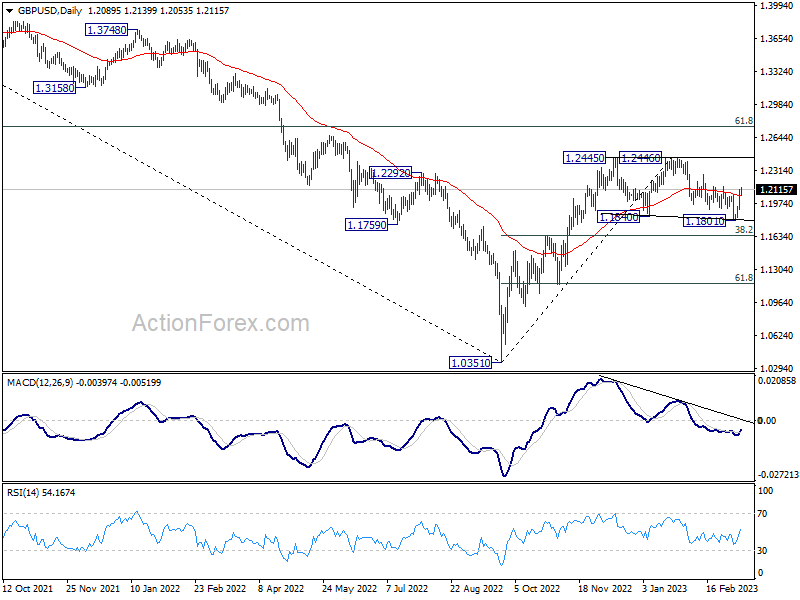
In the bigger picture, price action from 1.2445 are seen as a corrective pattern to rise from 1.0351 medium term bottom (2022 low). Resumption is expected as a later stage and firm break of 1.2446 will target 61.8% retracement of 1.4248 (2021 high) to 1.0351 at 1.2759. This will remain the favored case as long as 38.2% retracement of 1.0351 to 1.2445 at 1.1645 holds.
EUR/USD Daily Outlook
Daily Pivots: (S1) 1.0575; (P) 1.0638; (R1) 1.0702; More...
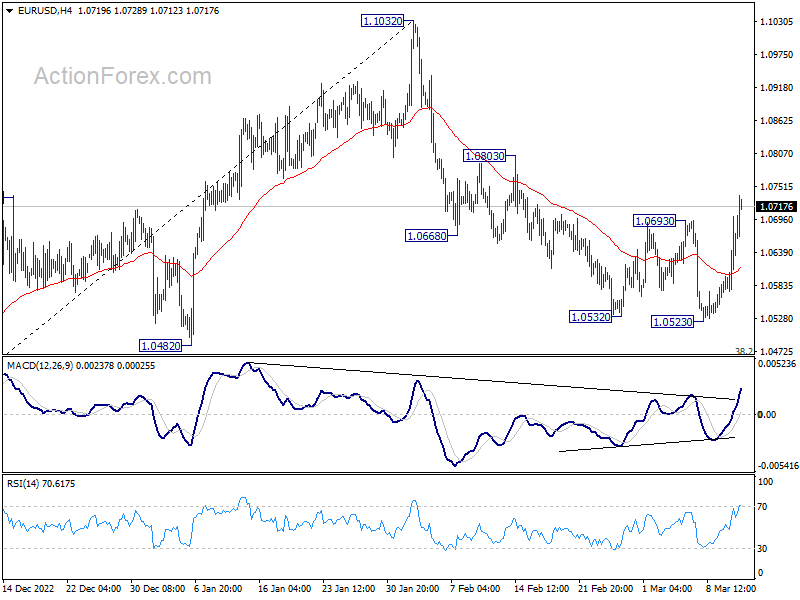
EUR/USD's break of 1.0693 resistance indicates short term bottoming at 1.0523, on bullish convergence condition in 4 hour MACD. More importantly, the corrective decline from 1.1032 should have completed too, ahead of 1.0482 key support. Intraday bias is back on the upside for 1.0803 resistance first. Firm break there will target a retest on 1.1032 high. For now, risk will stay on the upside as long as 1.0523 support holds, in case of retreat.
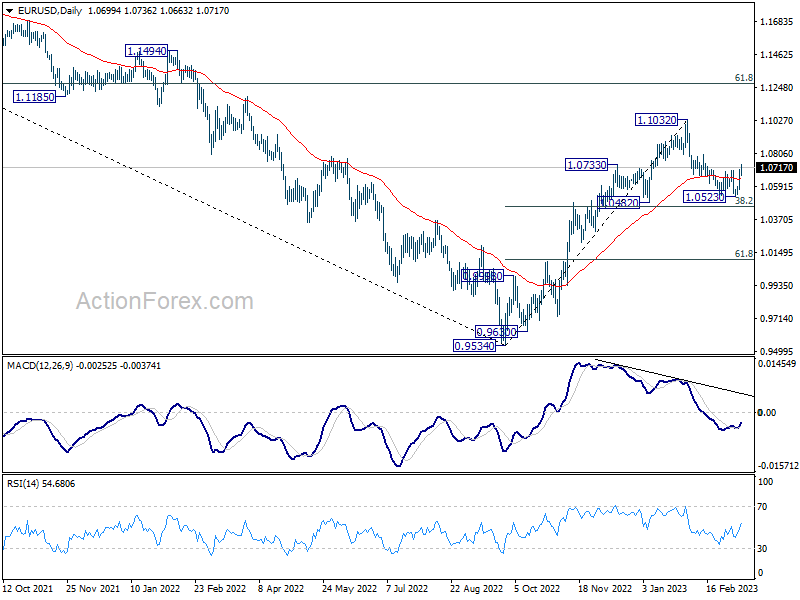
In the bigger picture, as long as 1.0482 support holds, rise from 0.9534 (2022 low) should continue to 61.8% retracement of 1.2348 (2021 high) to 0.9534 at 1.1273. However, sustained break of 1.0482 will bring deeper fall to 61.8% retracement of 0.9534 to 1.1032 at 1.0106, even as a corrective pull back.
Sentiment Stabilized After Measures on SVB, Focus Turning Back to US CPI and ECB Hike
Mixed market sentiment prevails in the Asian session today, as Nikkei is weighed down by selloff in bank stocks, while Hong Kong's HSI sees a recovery. US futures are also seeing a strong rebound. The announcement of measures by the US government and Fed to stabilize the situation surrounding the collapse of Silicon Valley Bank has helped to ease concerns for now. Market's focus is expected to gradually shift back to economic data event, particularly US CPI data and ECB rate decision, which are scheduled for this week.
Dollar continues its decline from last week, along with treasury yields. The 10-year yield has dropped below the 3.7% handle. Meanwhile, Yen and Swiss Franc are also showing weakness. Among commodity currencies, Australian dollar is leading, while the Sterling is seeing some recovery. Euro is also trading slightly higher.
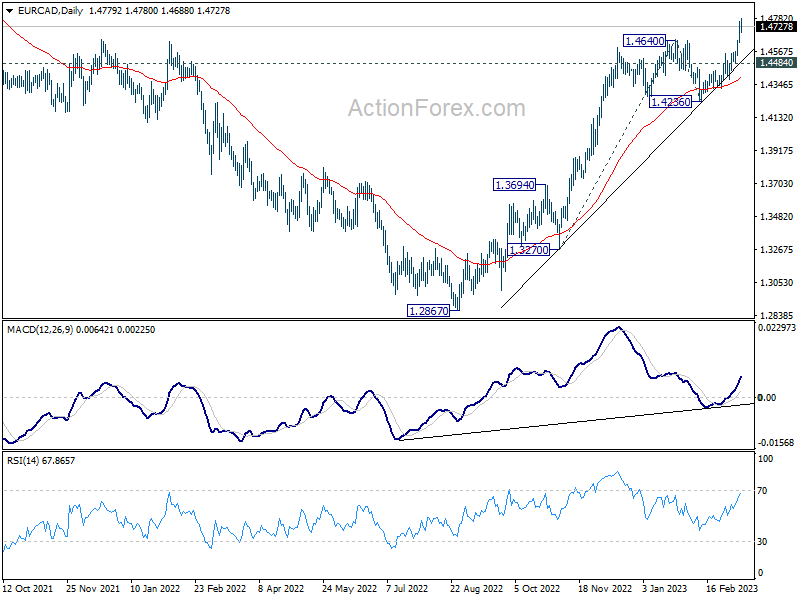
EUR/CAD is a pair to note this week, especially with the possibility of a hawkish surprise from ECB. Last week, the cross managed to break through the 1.46460 resistance level, which signals a resumption of larger uptrend from 1.2867. As long as the 1.4484 minor support level holds, near-term outlook for will remain bullish. The next target for1.5083, which represents the 61.8% projection of the move from 1.3270 to 1.4640 from 1.4236. Let's see how it plays out.
In Asia, Nikkei closed down -1.11%. Hong Kong HSI is up 2.01% at the time of writing. China Shanghai SSE is up 0.89%. Singapore Strait Times is down -0.99%. Japan 10-year JGB yield is down further by -0.0785 at 0.315.
US Treasury, FDIC, and Fed announce measures to stabilize banking system
The US government has announced on Sunday measures to stabilize the banking system and alleviate concerns over the potential fallout from the collapse of Silicon Valley Bank. The Federal Deposit Insurance Corporation (FDIC) has ensured that depositors will have access to their funds at SVB, and taxpayers will not bear any losses associated with the bank's resolution. However, shareholders and some unsecured debt holders will not be protected. In addition, a similar exception was announced for Signature Bank in New York.
Meanwhile, the Federal Reserve has established a new Bank Term Funding Program to provide additional funding to eligible depository institutions, ensuring that banks have the capability to meet the needs of all depositors. This move aims to bolster the capacity of the banking system to safeguard deposits and ensure the ongoing provision of money and credit to the economy. These measures are expected to ease concerns over potential systemic risks and promote stability in the banking sector.
Gold heading back to 1959 high on weak Dollar
Gold prices surged in the Asian session today, following a 2% rally on Friday. At the same time, Dollar and Treasury yield were also trading lower. The market was rocked by the bankruptcy of Silicon Valley Bank, which triggered panic and furthered risk aversion. Moreover, it lowered expectations for interest rate hikes as the failure of the second-largest collapse of an American lender in history has raised concerns of potential spillover effects on the financial system.
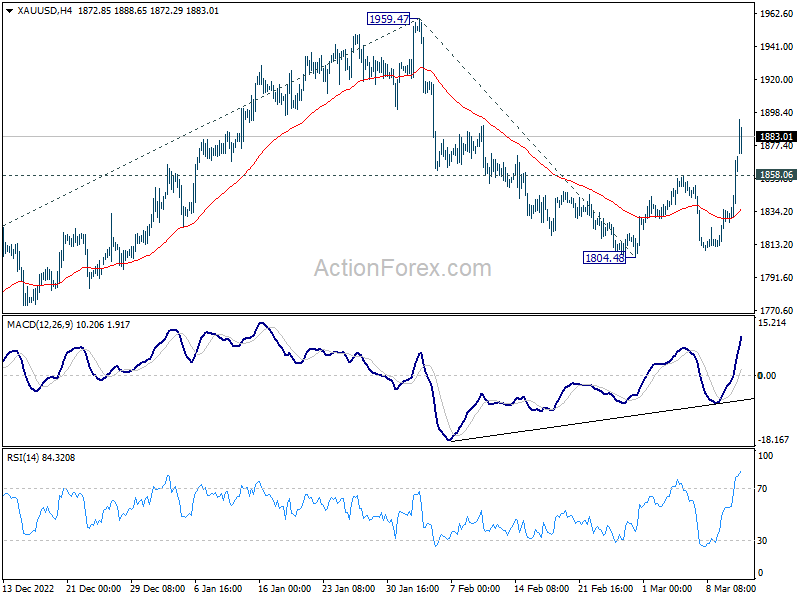
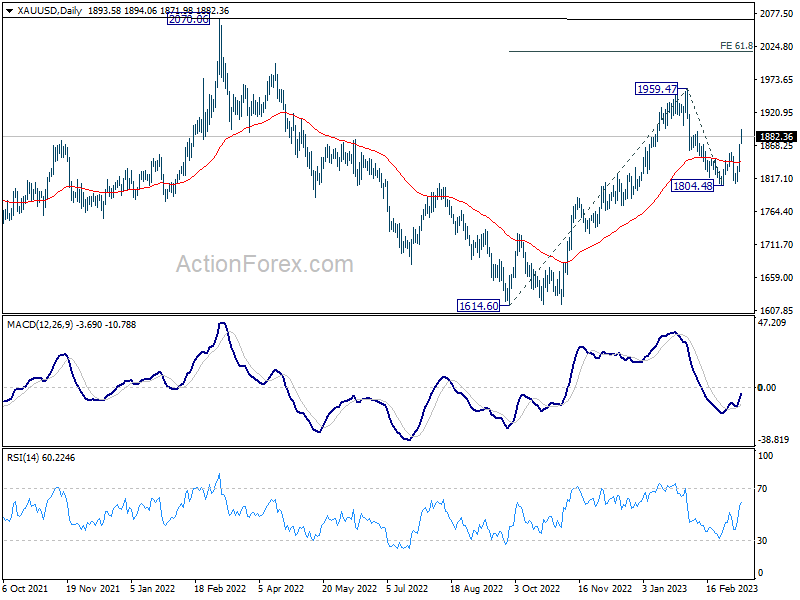
Current development argues that Gold's decline from 1959.47 has completed at 1804.48 already, on bullish convergence condition in 4 hour MACD. The rise back above 55 day EMA is also a bullish signal. Further rally is expected as long as 1858.06 resistance turned support holds. to retest 1959.47 high.
It's still early to call for an upside breakout. But decisive break of 1959.47 will resume whole up trend from 1614.60 to 61.8% projection of 1614.60 to 1959.47 from 1804.48 at 2017.60.
However, break of 1858.06 will mix up the near term outlook.
NZ BNZ services rose to 55.8, activity growing relatively well
New Zealand BusinessNZ Performance of Services Index rose from 54.7 to 55.8 in February. The move further above the trend in the index indicates a more favorable comparison to its long-term average of 53.6.
Looking at some details, activity/sales rose from 52.1 to 53.6, while employment dipped from 51.6 to 51.2. New orders/business increased from 54.8 to 57.1, and stocks/inventories went up from 54.7 to 58.3. Additionally, supplier deliveries improved from 52.3 to 55.9.
BNZ Senior Economist Craig Ebert said that "the strongly expanding PSI, along with the recovered tone of the PMI, suggests economic activity is growing relatively well in the early stages of this year".
ECB Expected to Hike 50bps, US CPI in Focus
ECB is widely anticipated to announce a 50bps hike in interest rates during its upcoming meeting on Thursday, bringing the main refinancing rate to 3.50% and the deposit rate to 3.00%. Investors will be looking ahead to the new economic projections, which will be released following the meeting, to gain an insight into future policy moves.
Some analysts are expecting an additional 50bps increase in May, with 25bps hikes predicted for both June and July. ECB's interest rates will likely reach their peak in the summer, with the main refinancing rate and deposit rate expected to be 4.50% and 4.00%, respectively. Still, much will depend on the evolving economic outlook.
In the US, attention will be on the CPI data, which is expected to shed light on the likelihood of a 25 or 50bps hike by Fed on March 22. Expectations have been shifting in the past week, and the inflation data could provide a clearer picture. Other data important releases from the US include PPI and retail sales.
Other major economic events include UK employment data, Australia's employment and consumer sentiment reports, New Zealand's GDP figures, and a range of data from China.
Here are some highlights for the week.
- Monday: New Zealand BNZ services index; Japan BSI manufacturing.
- Tuesday: Australia Westpac consumer sentiment, NAB business confidence; UK employment; Swiss PPI; US CPI; Canada manufacturing sales.
- Wednesday: BoJ minutes; China industrial production, retail sales, fixed asset investment; Eurozone industrial production; US PPI, retail sales, Empire State manufacturing, business inventories, NAHB housing index; Canada housing starts.
- Thursday: New Zealand GDP; Australia employment; Japan trade balance; Swiss SECO economic forecasts; ECB rate decision; Canada wholesale sales; US Philly Fed survey, jobless claims, housing starts and building permits, import prices.
- Friday: Japan tertiary industry index; Eurozone CPI final; Canada foreign securities purchases, IPPI and RMPI; US industrial production, U of Michigan consumer sentiment.
EUR/USD Daily Outlook
Daily Pivots: (S1) 1.0575; (P) 1.0638; (R1) 1.0702; More...
EUR/USD's break of 1.0693 resistance indicates short term bottoming at 1.0523, on bullish convergence condition in 4 hour MACD. More importantly, the corrective decline from 1.1032 should have completed too, ahead of 1.0482 key support. Intraday bias is back on the upside for 1.0803 resistance first. Firm break there will target a retest on 1.1032 high. For now, risk will stay on the upside as long as 1.0523 support holds, in case of retreat.
In the bigger picture, as long as 1.0482 support holds, rise from 0.9534 (2022 low) should continue to 61.8% retracement of 1.2348 (2021 high) to 0.9534 at 1.1273. However, sustained break of 1.0482 will bring deeper fall to 61.8% retracement of 0.9534 to 1.1032 at 1.0106, even as a corrective pull back.
Economic Indicators Update
| GMT | Ccy | Events | Actual | Forecast | Previous | Revised |
|---|---|---|---|---|---|---|
| 21:30 | NZD | Business NZ PSI Feb | 55.8 | 54.5 | ||
| 23:50 | JPY | BSI Large Manufacturing Index Q1 | -10.5 | -4.2 | -3.6 | |
| 15:30 | USD | 3-Month Bill Auction | ||||
| 15:30 | USD | 6-Month Bill Auction |
Technical Outlook and Review
DXY:
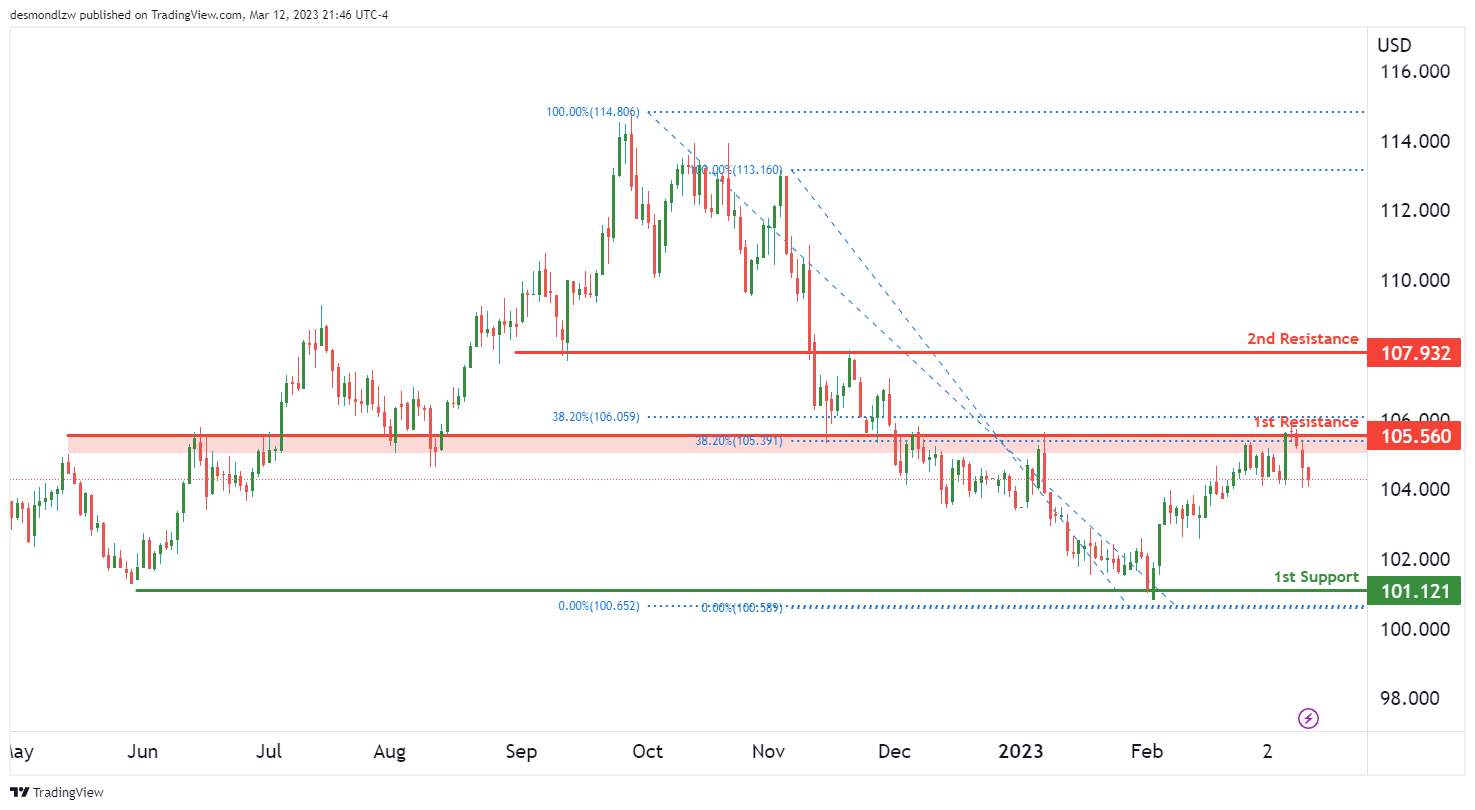
Price has reversed from 1st resistance area of 105.56, with lines up with the 38.2% Fibonacci retracement which is an overlap resistance. it could potentially drop to our 1st support at 101.12,
In terms of resistance, if the price were to break the 1st resistance, it could push up to 107.93 which is an overlap resistance.
EUR/USD:
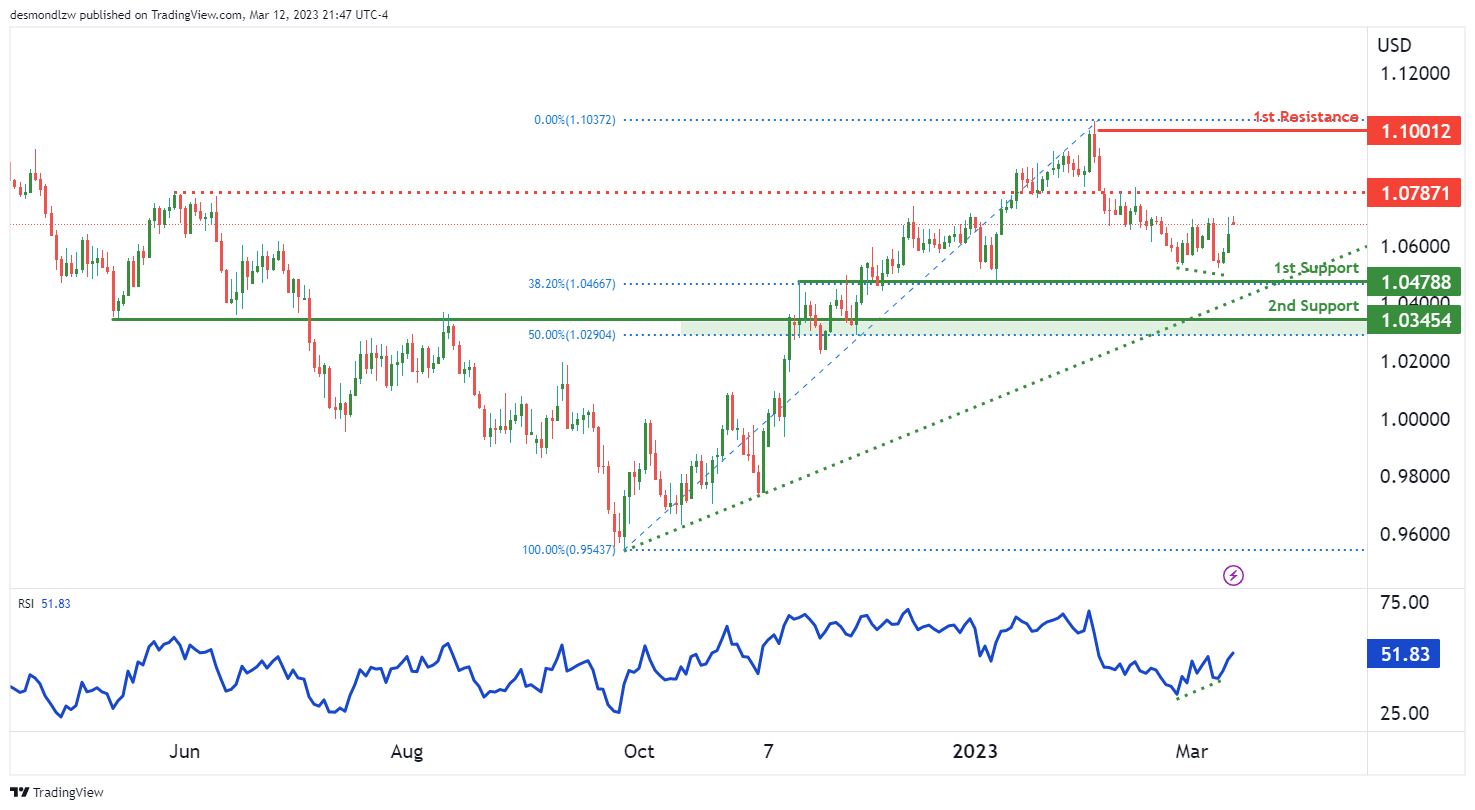
EURUSD has reversed nicely from our 1st support at 1.04788 with lines up the 38.2% Fibonacci retracement and is seeing bullish divergence vs RSI. Price could potentially rise to our intermediate support at 1.0787 if price were to break through, it could push up to our 1st resistance at 1.1001
In terms of support, The first major support is at 1.0478 which is a strong overlap support. If price were to break this level, we could see it drop further to our support at 1.03545
GBP/USD:
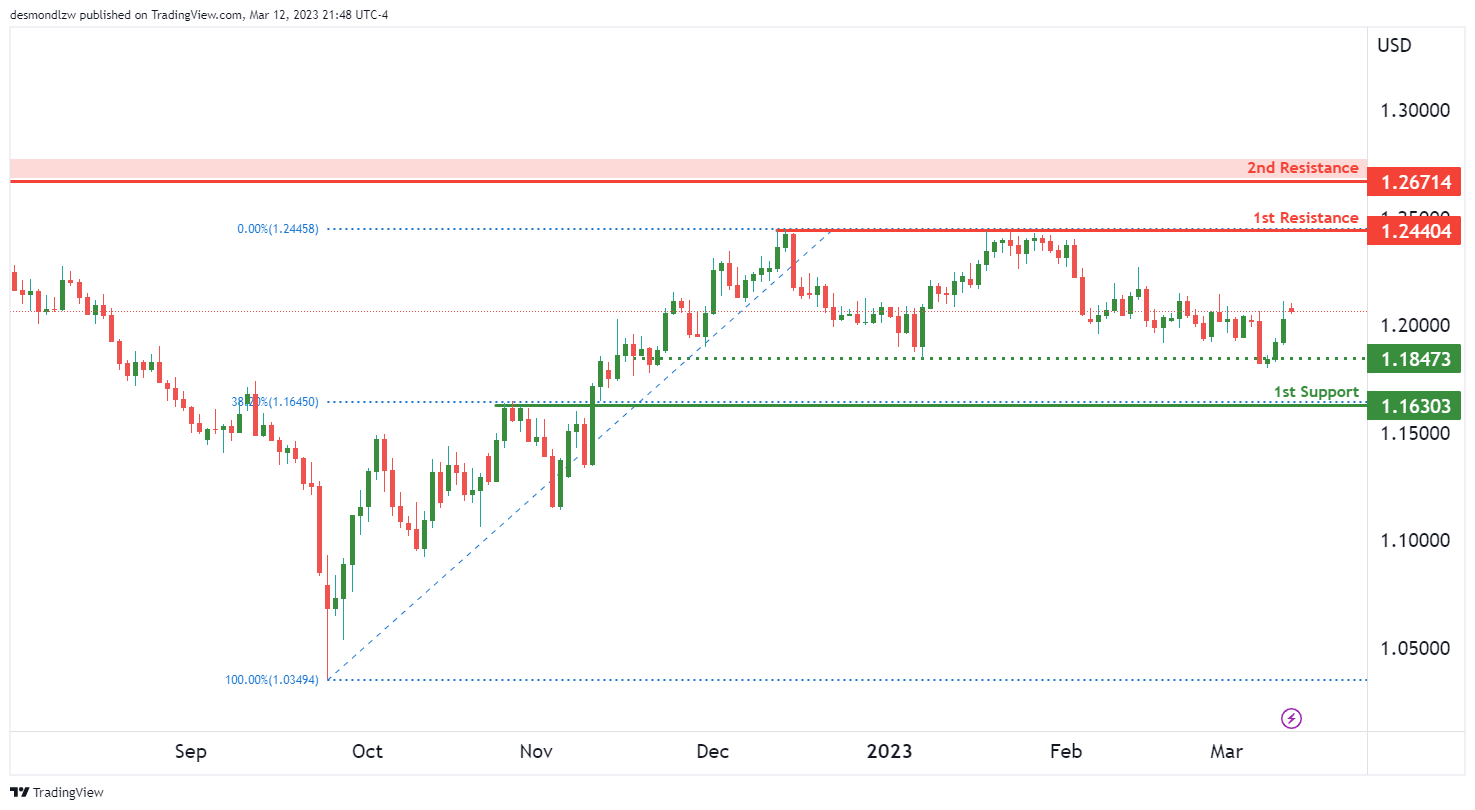
Price has reversed from our intermediate support at 1.184 7, which is an overlap support, it could rise to our 1st resistance at 1.2440 and our 2nd resistance at 1.2671
Regarding support levels, our 1st support is at 1.1630 which is overlap support with lines up the 38.2% Fibonacci retracement
USD/CHF:
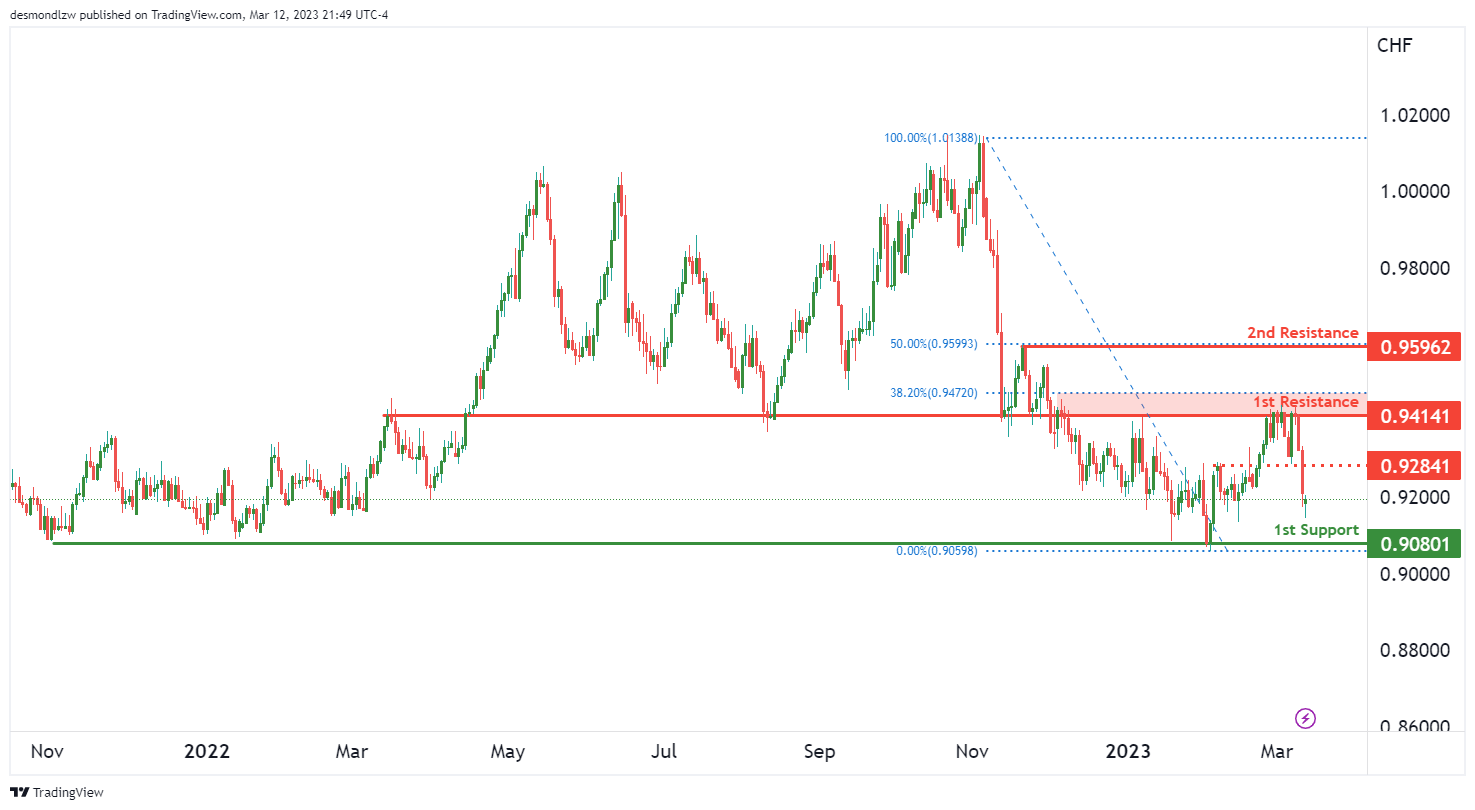
Price seeing that our 1st support level at 0.9080 if price were to reverse from this level, it could rise to our intermediate resistance at 0.9284, if price were to break through, we could see it push up to the 1st resistance at 0.9414..The 2nd resistance level is at 0.9596 with line sup the 50% Fibonacci retracement.
USD/JPY:
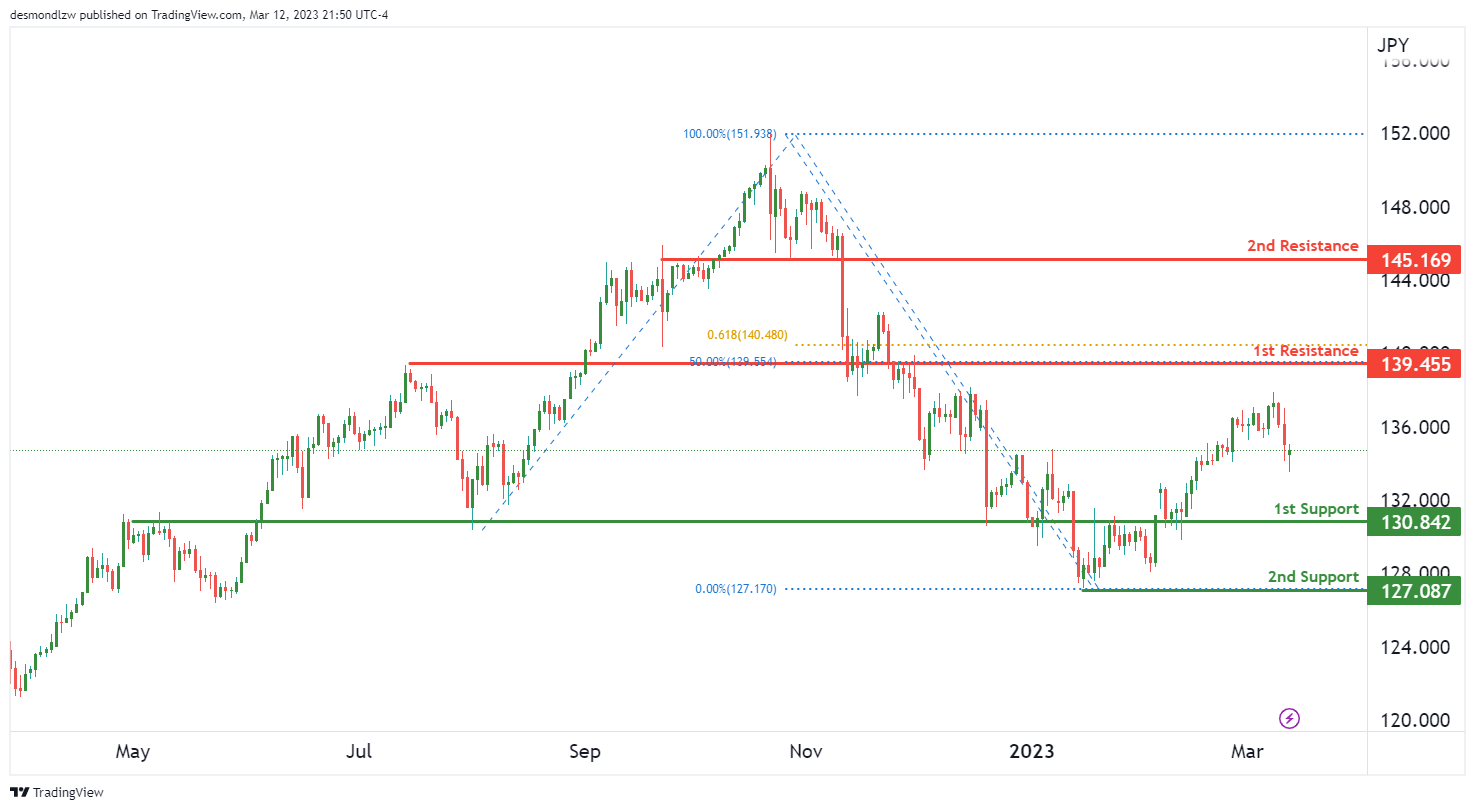
Price is lingering between 1st support at 130.84 which is overlap support and 1st resistance at 139.45 with lines up the 50% Fibonacci retracement, if price were to break through, it could rise to our 2nd resistance at 145.16. Our 2nd support is 127.087
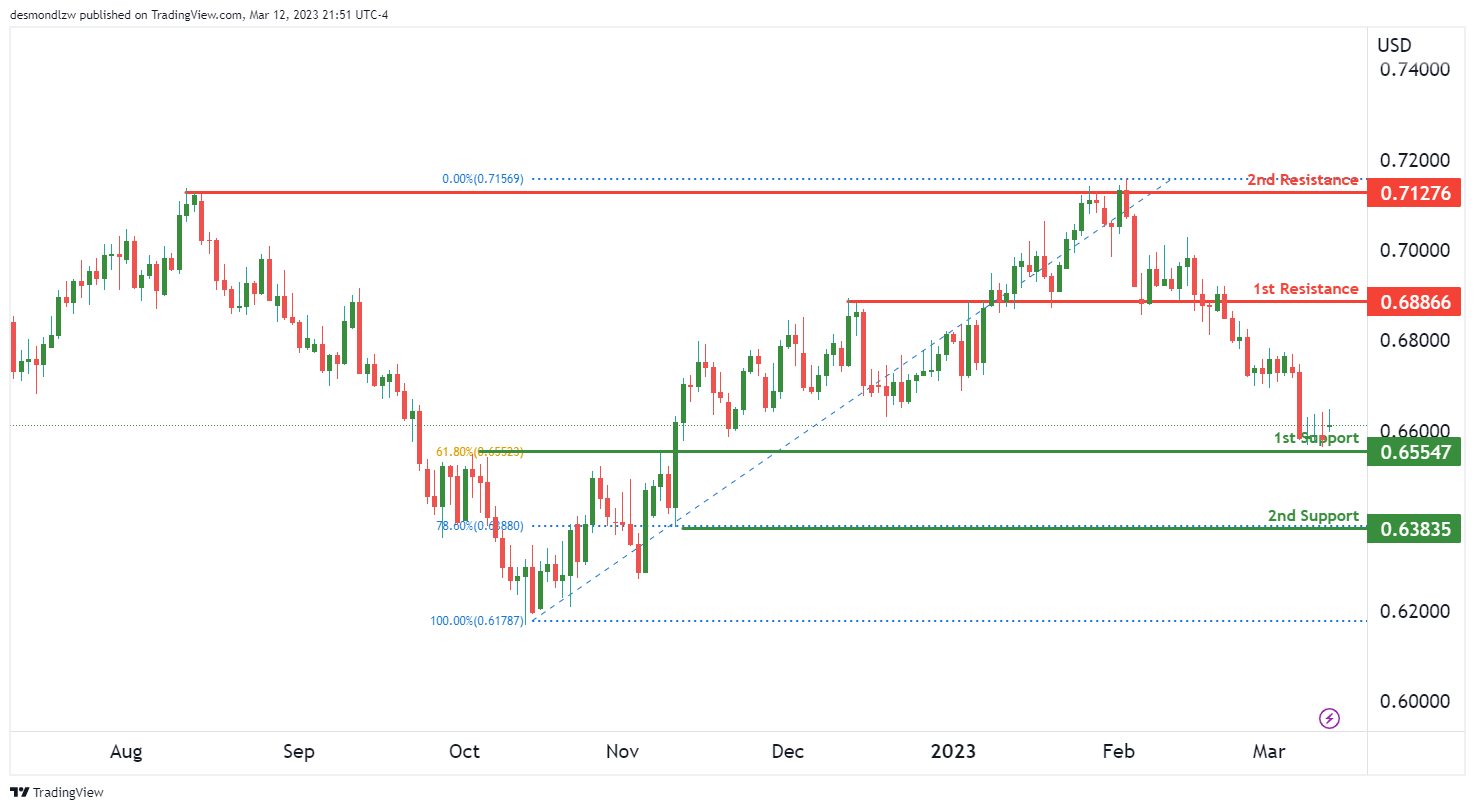
AUD/USD:
Price is lingering in our 1st support area at 0.6554 with lines up the 61.8% Fibonacci retracement, if price were to break through If the price were to break from this level, the next key support level would be at 0.6383, which is another overlap support
Regarding resistance levels, the 1st resistance is at 0.6886 which is a strong Overlap resistance, and the 2nd resistance is at 0.7127 which is a pullback resistance level.
NZD/USD:
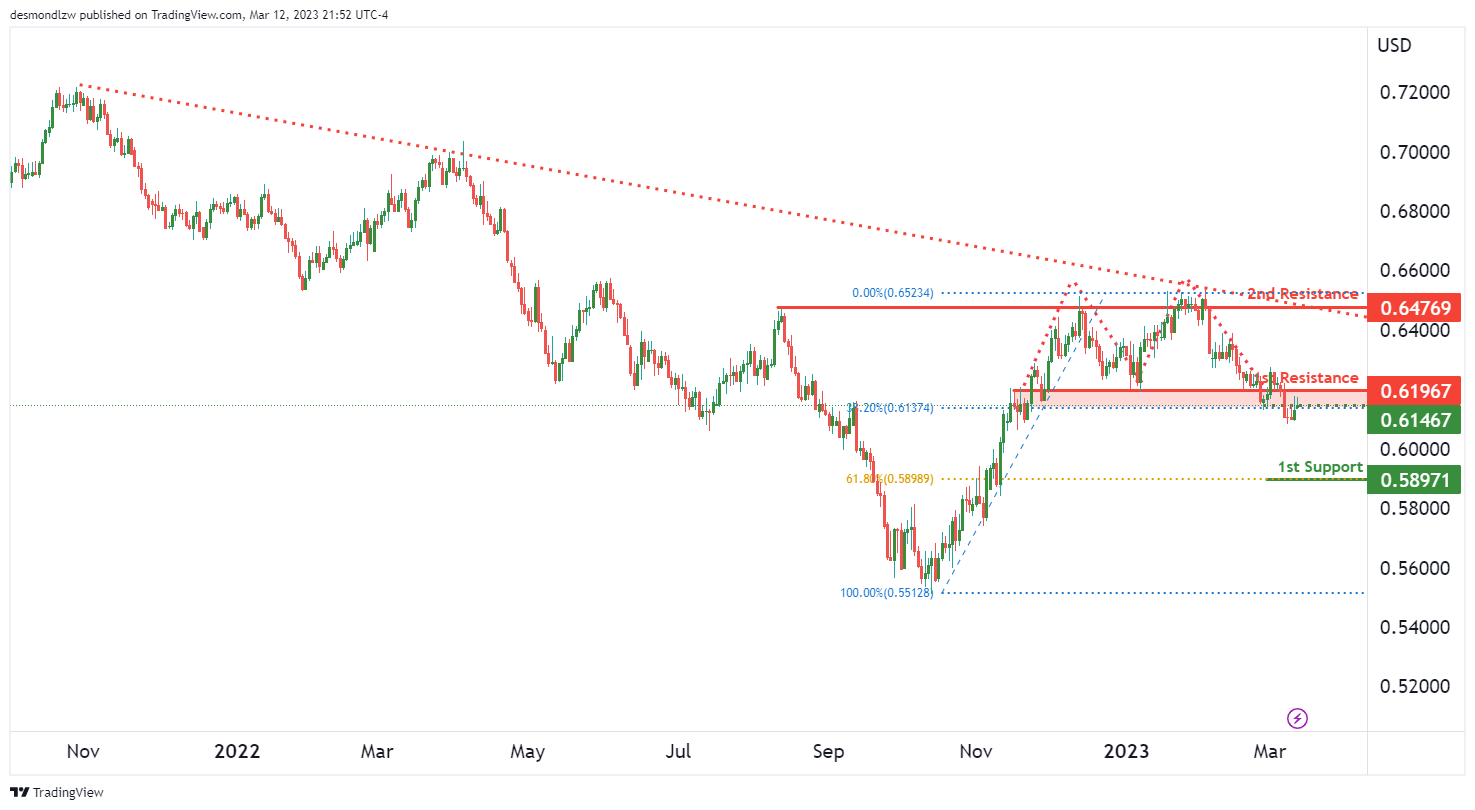
We are seeing a double-top pattern and price has reversed from the neckline that align with our 1st resistance at 0.6196 which lines up the 38.2% Fibonacci retracment, if pierce were to break through, it could push up to our 2nd resistance at 0.6476
Regarding support levels, the 1st support is at 0.5897 with lines up the 61.8% Fibonacci retracment
USD/CAD:
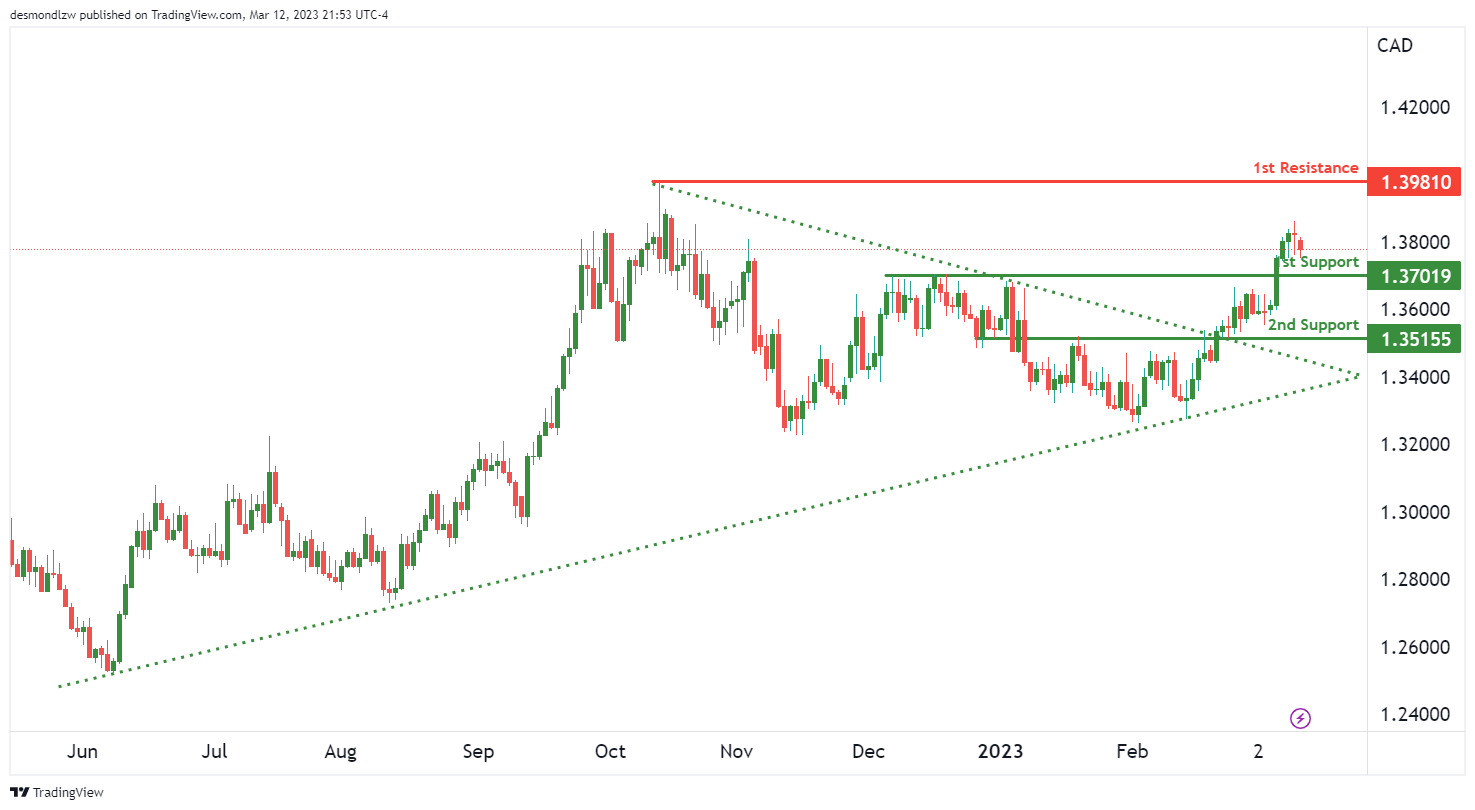
The 1st support we’re looking at is 1.3701 which is a pullback support, if price were to break through, it could drop to our 2nd support at 1.3515 which is overlap support.
In terms of resistance, the 1st resistance is 1.3981 which is a swing high resistance.
DJ30:
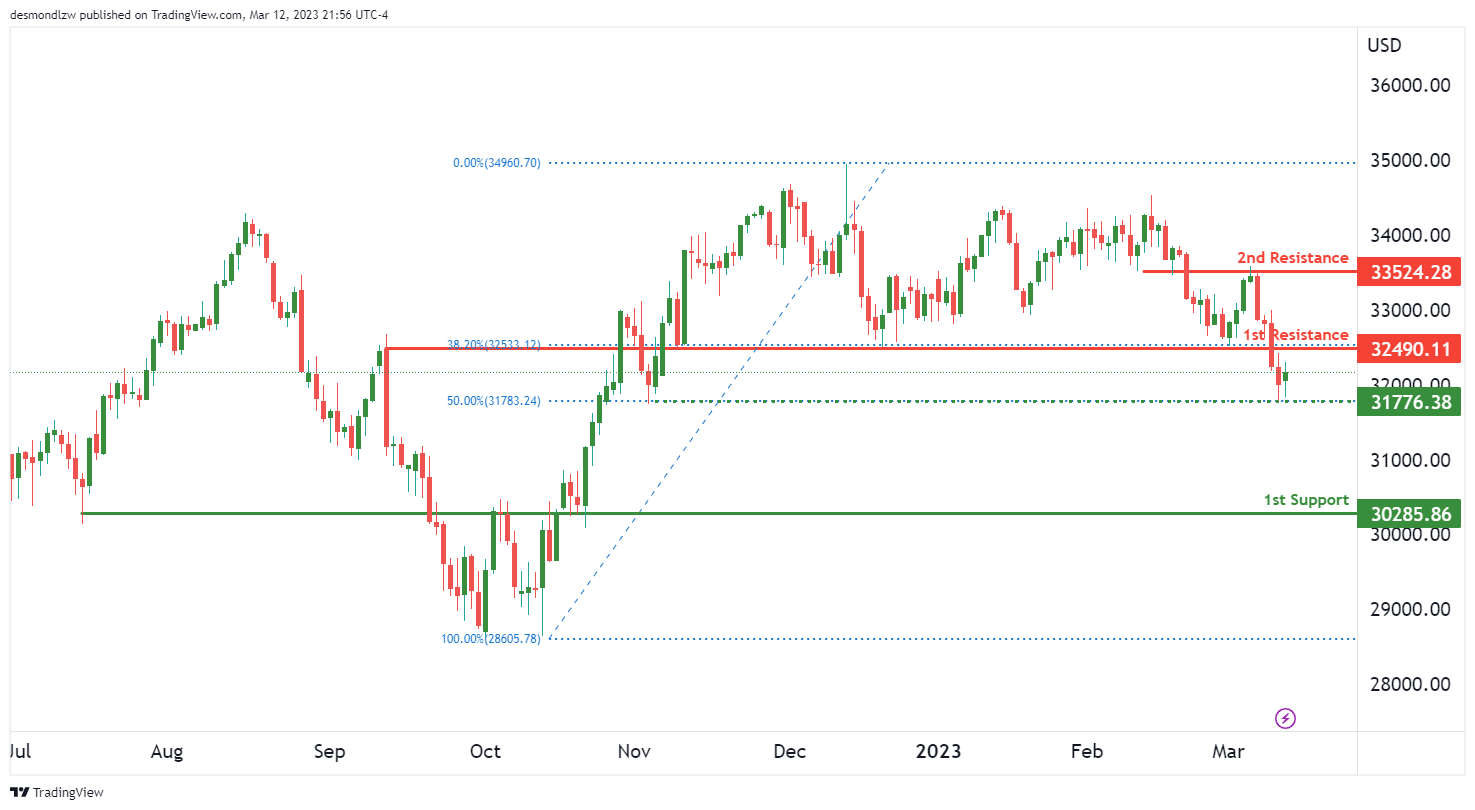
Price has bouched off from our intermediate support at 31776 with lines up the 50% Fibonacci retracement and price could potentially push up to our 1st resistance at 32490 with lines up the 38.2% Fibonacci retracement and 2nd resistance at 33524.
If price were to break from our intermediate support, it could drop further to our 1st support at 30285 which is overlap support
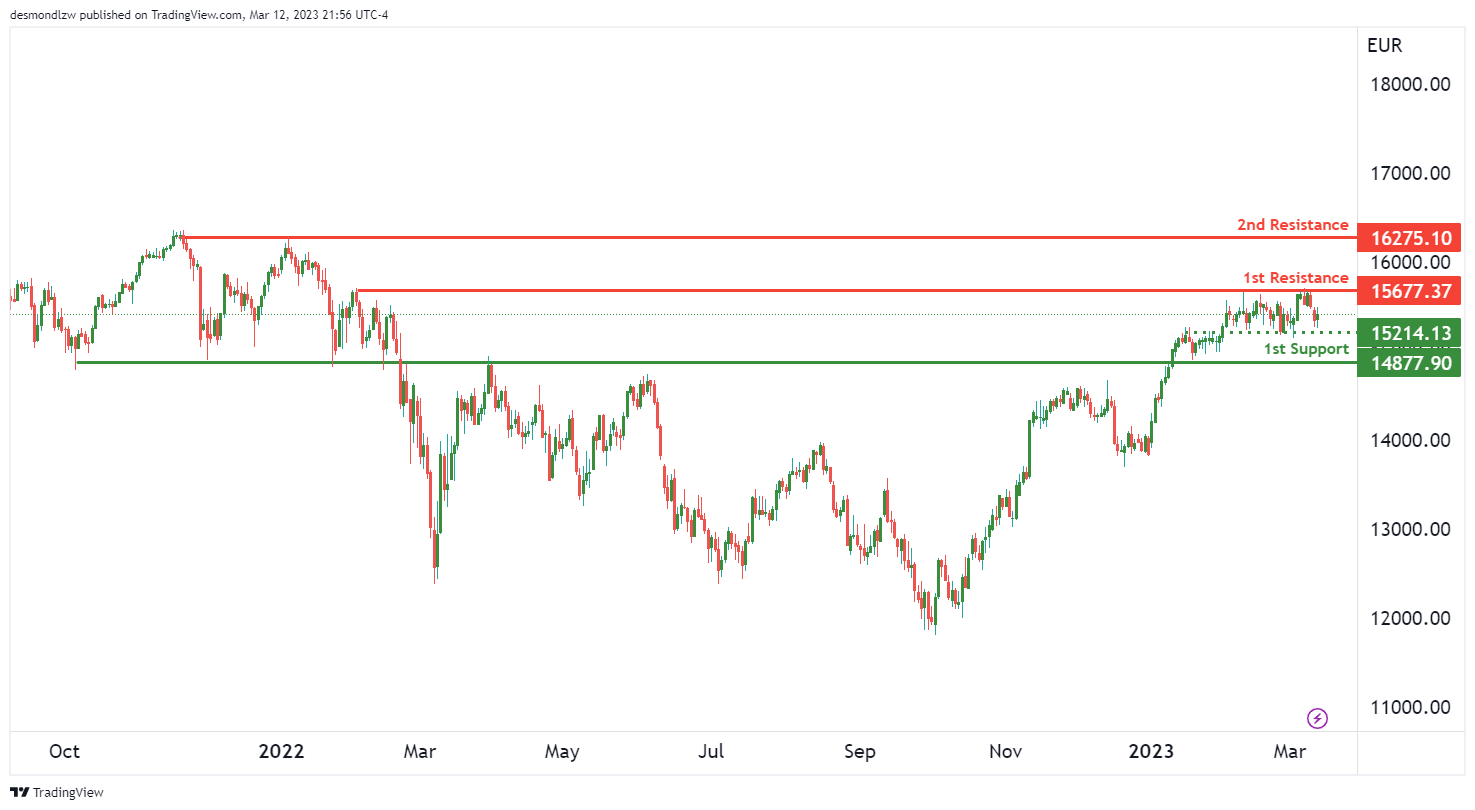
GER30:
Price has reversed from major swing high resistance at 15677 which is a swing high resistance and it currently testing our intermediate support at 15214 which is overlap support if price were to break from this level, it could drop to our 1st support at 14877
In terms of the resistance, our 2nd resistance level is 16275 with is another major swing high resistance
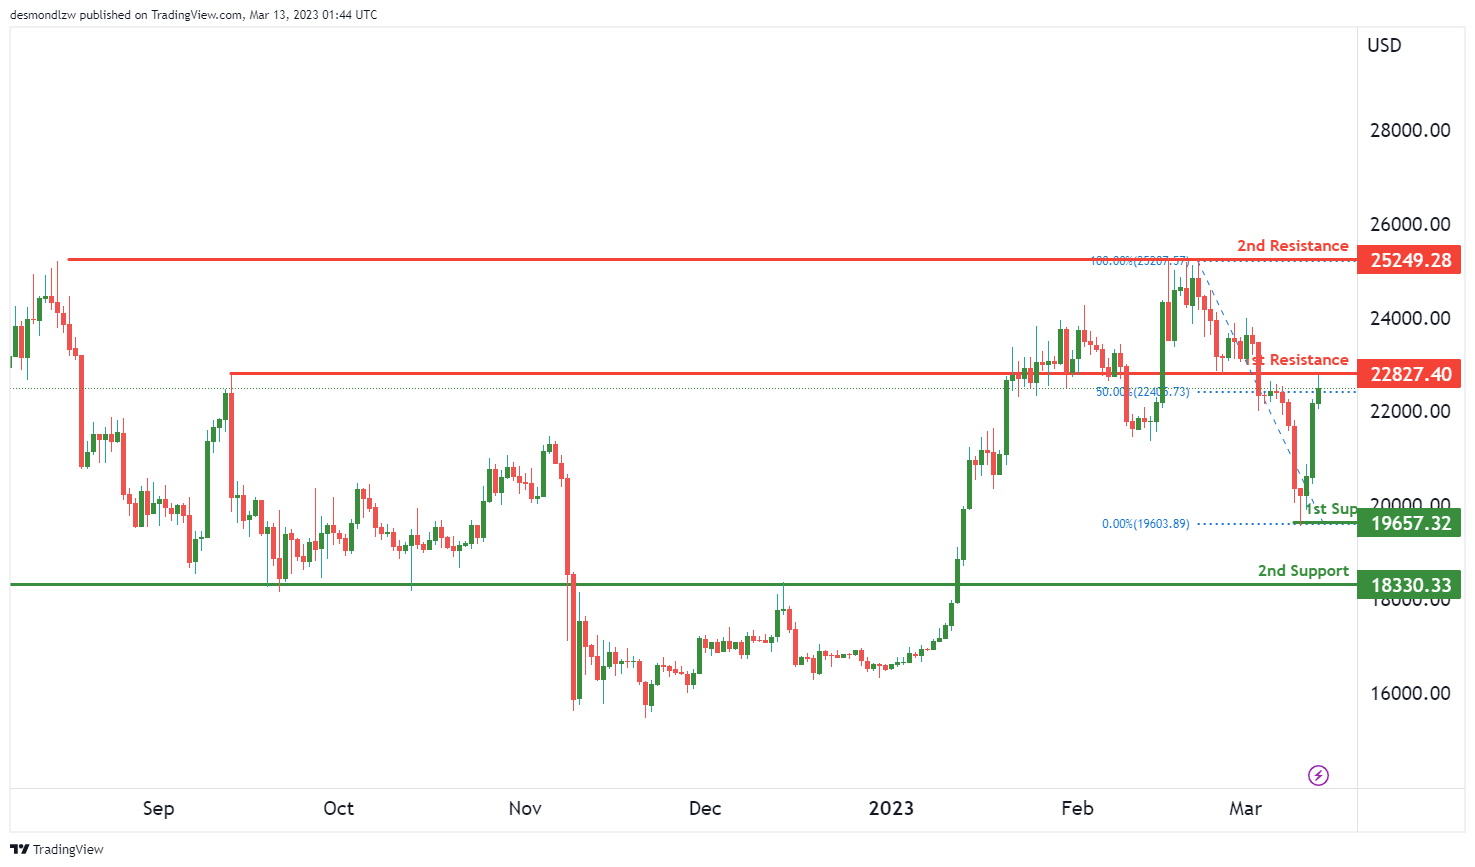
BTC/USD:
Price is testing our 1st resistance at 22827 which is an overlap resistance if price were to break from this level, it could push up to our 2nd resistance is 25249 which is a swing-high resistance
Regarding support level, if price were to reverse from our resistance, it could drop to our 1st support at 19657 and our 2nd support is 18330 which is another major overlap support level.
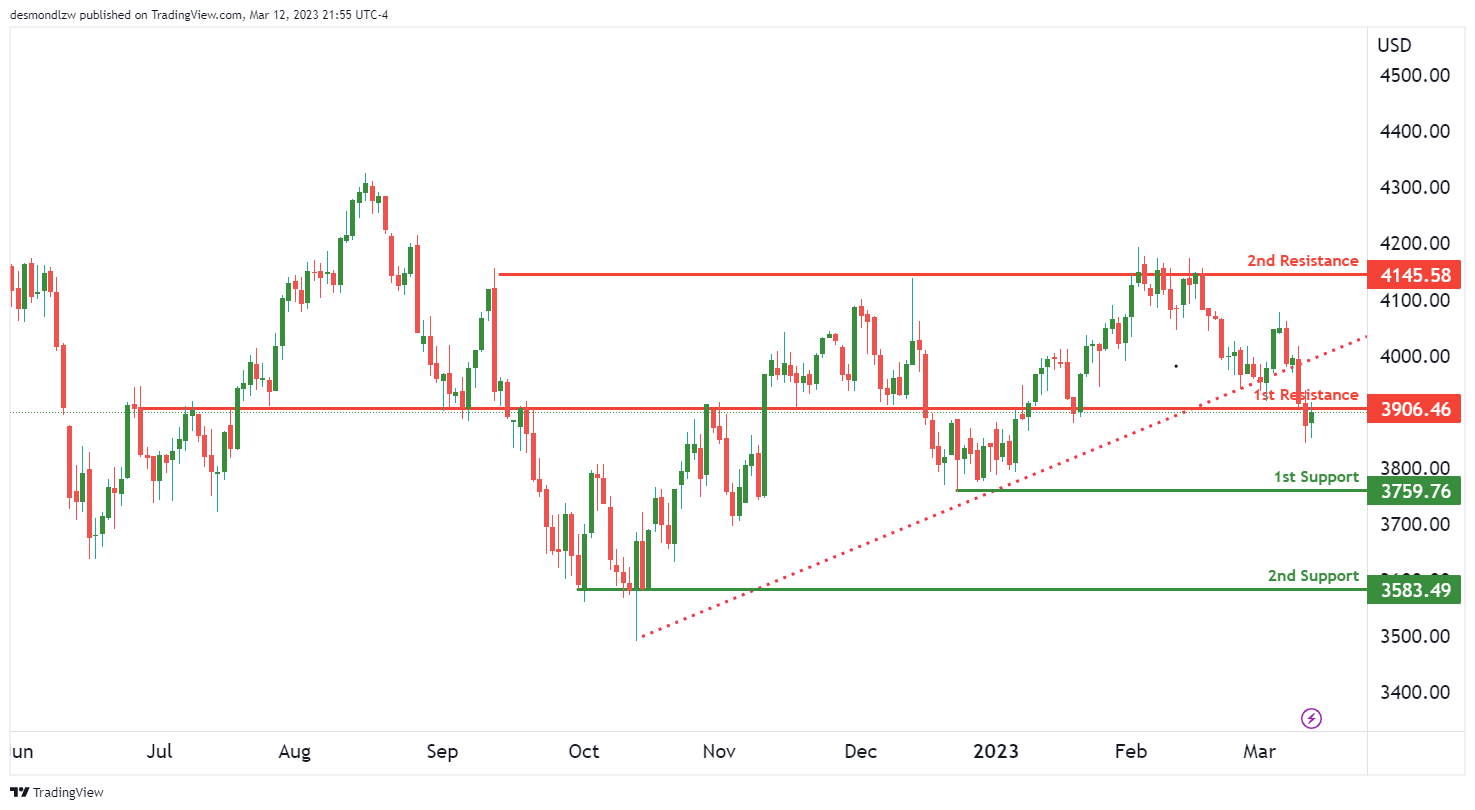
US500
Price is testing our 1st resistance at 3906 which is an overlap resistance, if price were to break through, it could potentially push up to our 2nd resistance at 4245
Regarding support level, If the price were to reverse from the 1st resistance level, our 1st support is 3759 and 2nd support is 3583 which is another swing low support.
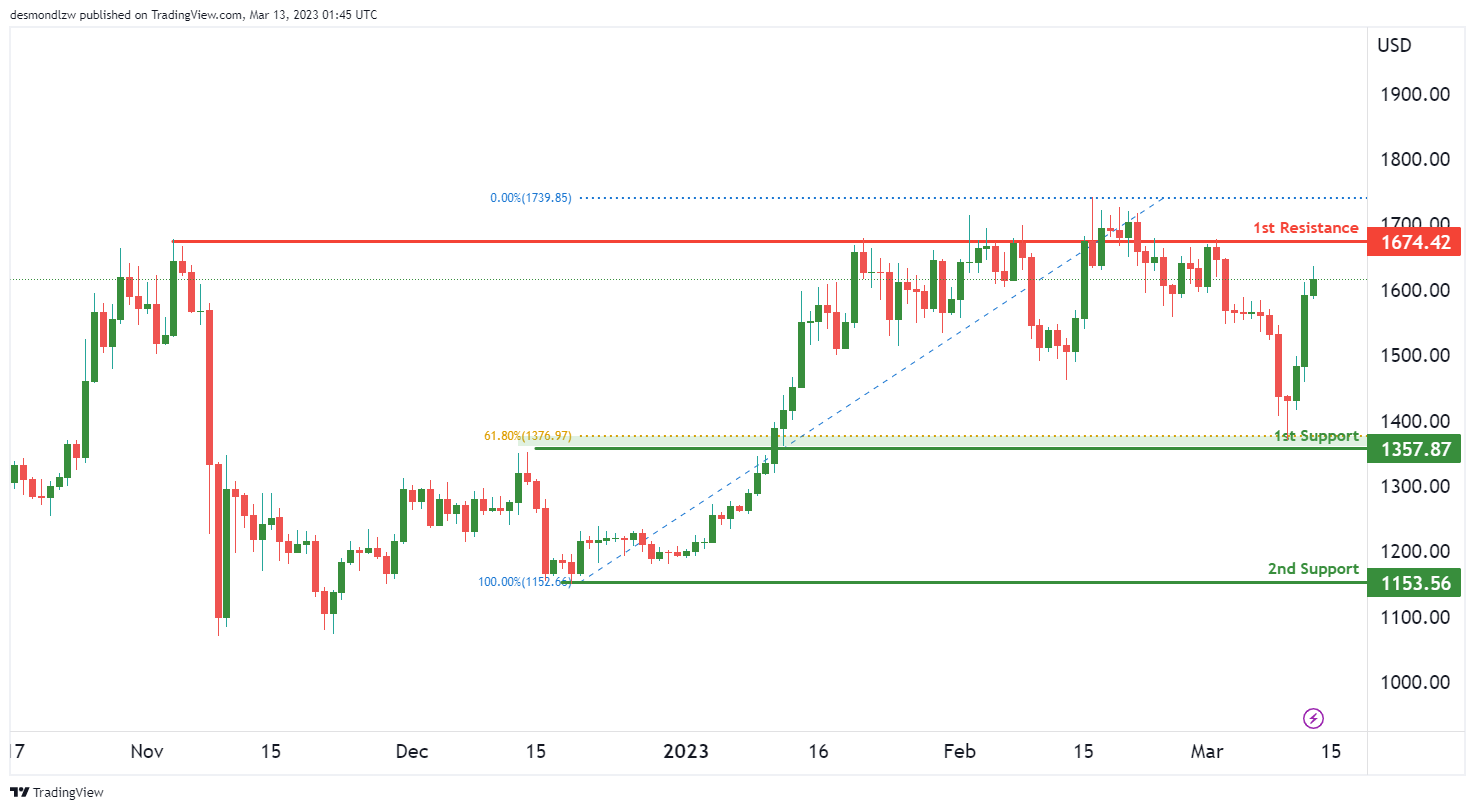
ETH/USD:
Price is approaching our 1st resistance level at 1674, if price were to reverse from here, it could drop down to our 1st support level at 1357 with lines up the 61.8% Fibonacci retracement, which is overlap support and 2nd support is 1153
WTI/USD:
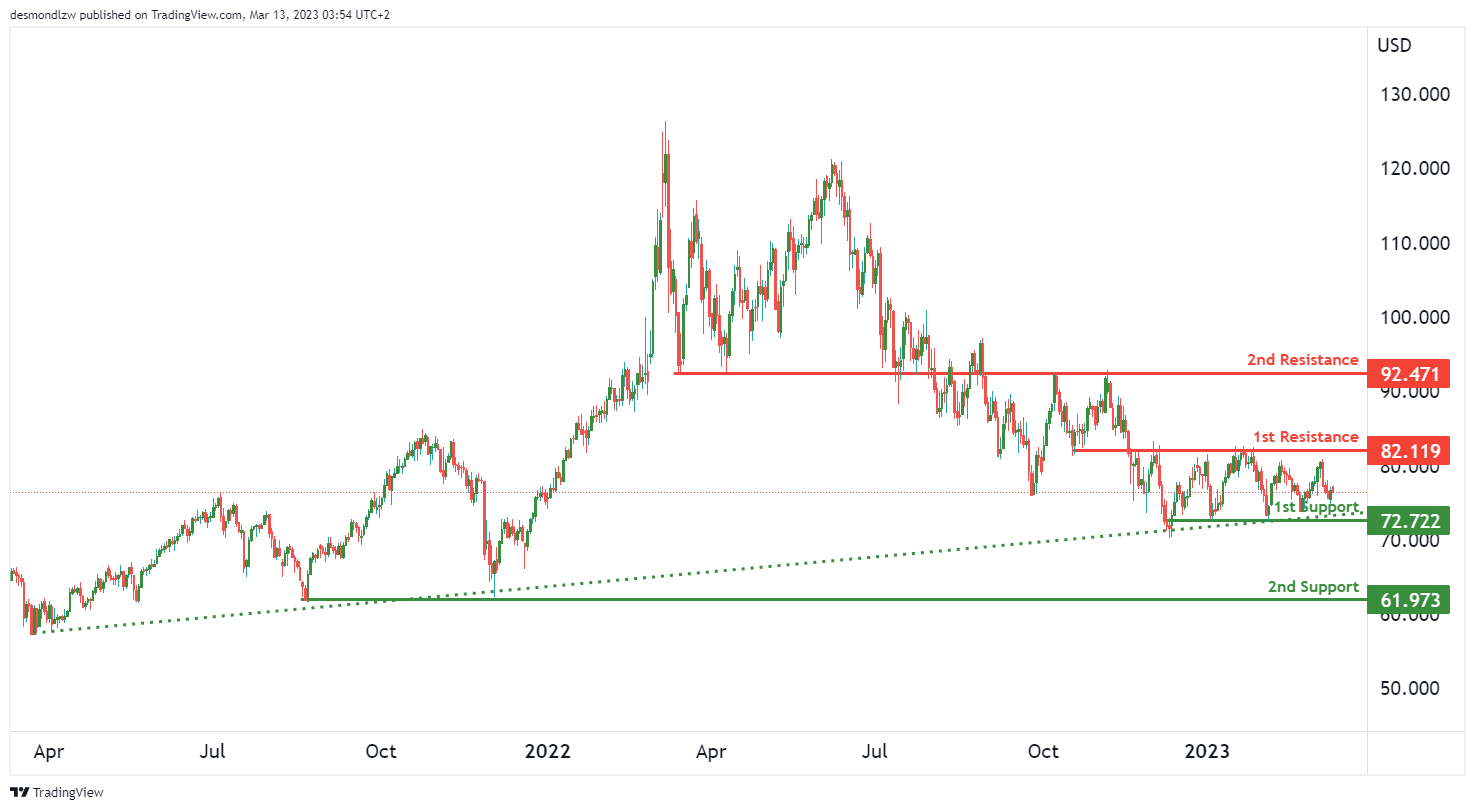
Price is respecting our ascending trendline which lines up with our 1st support level at 72.72, if price were to reverse from this level, it could push up to our 1st resistance at 82.119 which is overlap resistance and 2nd resistance is 92.47 which is another overlap resistance
XAU/USD (GOLD):
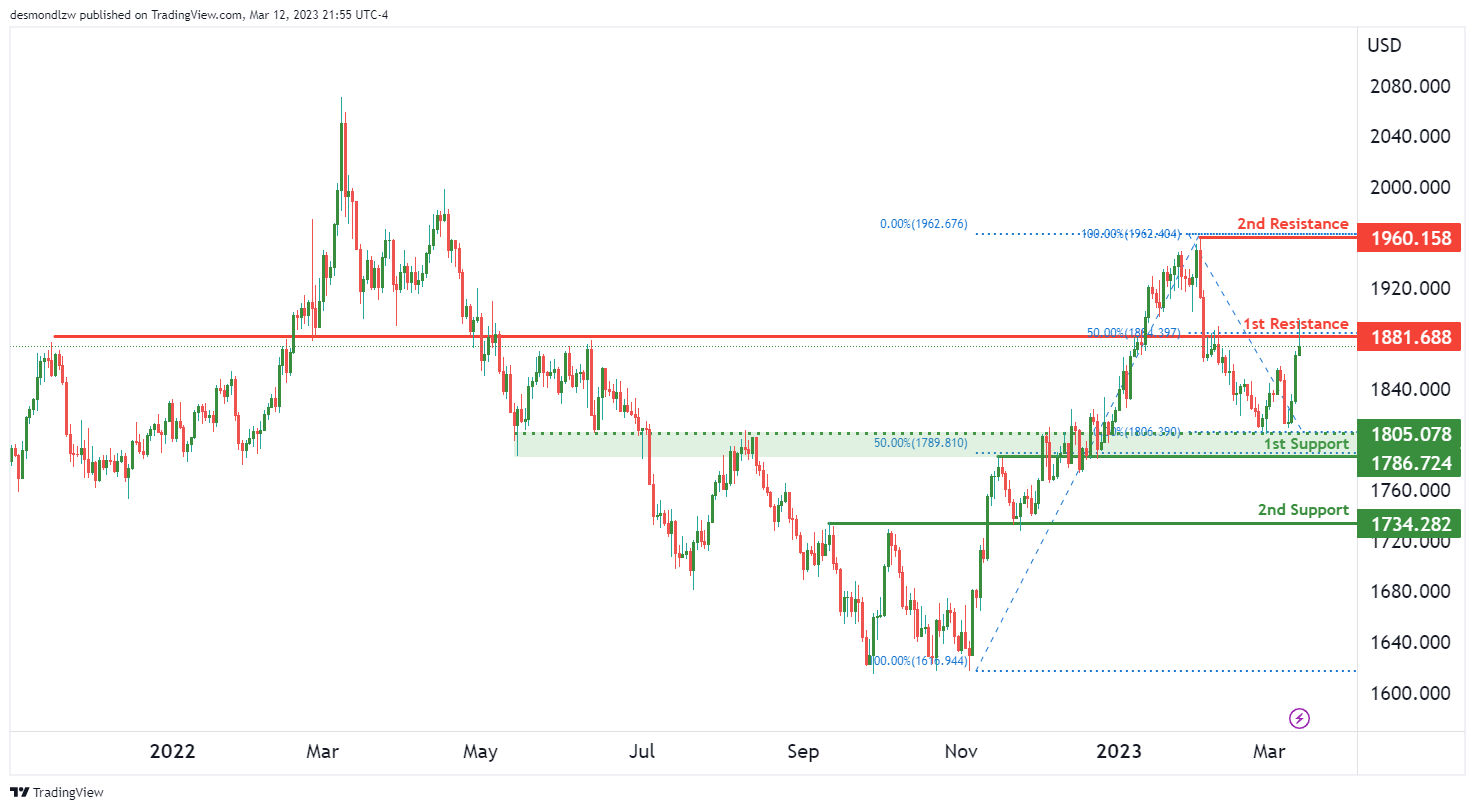
Price has reversed nicely from our 1st support at 1805. Currently, the price is testing our 1st resistance at 181 which lines up with the 50% Fibonacci retracement. If the price were to reverse from this resistance, it could drop to our 1st support at 1805. Our 2nd support is at 1734, which is overlap support.
Our 2nd resistance is at 1960, which is a swing-high resistance.
Gold heading back to 1959 high on weak Dollar
Gold prices surged in the Asian session today, following a 2% rally on Friday. At the same time, Dollar and Treasury yield were also trading lower. The market was rocked by the bankruptcy of Silicon Valley Bank, which triggered panic and furthered risk aversion. Moreover, it lowered expectations for interest rate hikes as the failure of the second-largest collapse of an American lender in history has raised concerns of potential spillover effects on the financial system.
Current development argues that Gold's decline from 1959.47 has completed at 1804.48 already, on bullish convergence condition in 4 hour MACD. The rise back above 55 day EMA is also a bullish signal. Further rally is expected as long as 1858.06 resistance turned support holds. to retest 1959.47 high.
It's still early to call for an upside breakout. But decisive break of 1959.47 will resume whole up trend from 1614.60 to 61.8% projection of 1614.60 to 1959.47 from 1804.48 at 2017.60.
However, break of 1858.06 will mix up the near term outlook.