Sample Category Title
EUR/USD: Euro Advances on Weaker Dollar, Bullish Bias Above Daily Cloud Base
The Euro started trading on Monday with approx. one full figure opening higher, following fresh weakness of the dollar, additionally hit by crisis over collapse of Silicon Valley Bank last Friday.
Bulls peaked at 1.0737, the highest since Feb 15) in Asian trading, but lost traction in European session.
Near-term price action is so far holding within daily Ichimoku cloud, which was penetrated after gap-higher opening and cloud base (1.0661) now marking solid support which is containing dips for now.
Improving daily techs, on rising 14-d momentum now in positive territory and north-heading RSI above neutrality zone, support near-term action, although bulls faced headwinds at pivotal 1.0718 barrier (55DMA / Fibo 38.2% of 1.1032/1.0524).
Sustained break here would reinforce near-term bulls and open way for further retracement of 1.1032/1.0524 bear-leg, with targets laying at 1.0778/1.0838 (Fibo 50% and 61.8% respectively).
Today’s close above daily cloud base is seen as a minimum requirement to keep fresh bulls in play.
Conversely, return and close below cloud base, would make the downside more vulnerable of renewed attack at key support at 1.0524 (Mar 8 low) and unmask next pivotal support at 1.0460 (Fibo 38.2% of 0.9535/1.1032 rally).
Traders focus on US inflation report on Tuesday and ECB’s policy meeting on Thursday, as key events this week.
Res: 1.0718; 1.0778; 1.0803; 1.0838.
Sup: 1.0661; 1.0613; 1.0574; 1.0541.

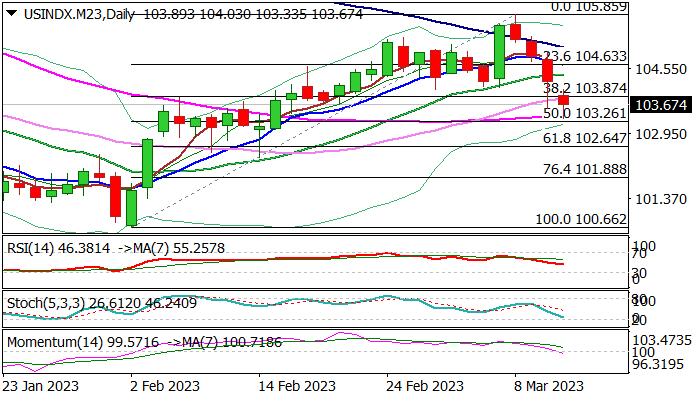
Dollar Index: Dollar Falls Further on Fresh Crisis Over SVB Collapse, US Inflation Data in Focus
The dollar came under increased pressure and opened with gap-lower on Monday, hitting one-month low against the basket of major world currencies.
Already weak dollar’s sentiment was soured further by the sudden collapse of Silicon Valley Bank.
The government launched a set of measures to prevent stronger damage in the banking system.
The US authorities assured customers that they will have access to all their deposits, but the US Finance Minister Janet Yellen said that there will be no bailout and the finance ministry will not cover the losses of the bank, stressing that they are not going to repeat the same mistake like in 2008, when the administration of the President Obama financially supported collapsed banks.
Due to current circumstances, investors lowered their bets for Fed rate hike from 50 to 25 basis points in the policy meeting next week, although the US central bank will remain primarily focused on high inflation, which hasn’t showed significant signs of easing so far.
All eyes are on Tuesday’s US February inflation report, which is expected to give more clues about Fed’s next steps, while the fresh crisis over collapse of SVB is expected to boost volatility in the market.
Technical studies are turning to full bearish configuration on daily chart, as descending 14-d momentum broke into negative territory, RSI is heading south and the price fell below moving averages.
Fresh weakness marked nearly 50% retracement of 100.66/105.85 upleg and broke into daily Ichimoku cloud (spanned between 103.89 and 102.64).
Break of 50% retracement (103.26), where bears found temporary footstep, will expose strong support at 102.64 (daily cloud base / Fibo 61.8%), loss of which would confirm reversal and open way for further weakness.
Today’s close below 103.89 (cloud top / broken Fibo 38.2%) is needed to keep bears intact.
Res: 103.89; 104.38; 104.63; 105.06.
Sup: 103.26; 102.64; 101.88; 100.66.
GBP/USD: Elliott Wave Reversal Pattern
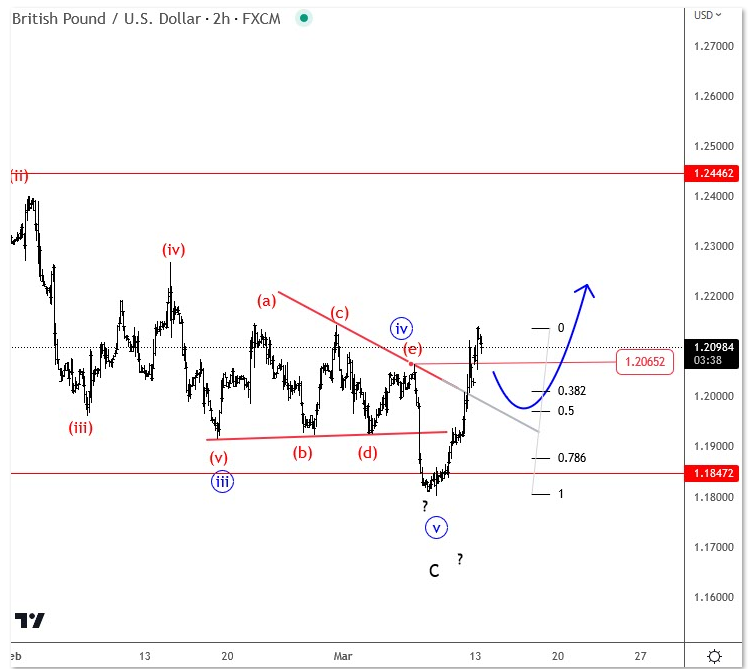
Another currency that looks attractive vs USD as US yeilds come down, can be pound, after a very nice rebound from 1.18 area last week, where market made a failure breakdown. In fact, a reversal from the low is impulsive which already took out the 1.2065 so more gains can be seen after a retracement. Nice technical and also the psychological support can be at 1.2.
Risk aversion intensifies, GBP/CHF and USD/JPY break important support
Swiss Franc and Yen accelerate higher in European as risk aversion appear to intensify again. Major European indexes are down more than -2% at the time of writing, while US futures also reversed earlier gains.
In response to the heightened risk aversion, there is a massive flight-to-safety in bond markets. US 10-year yield has hit the lowest level since February and threatens to take out 3.5%, while Germany 10-year yield also broke the 2.2% handle, hitting the lowest level since early February.
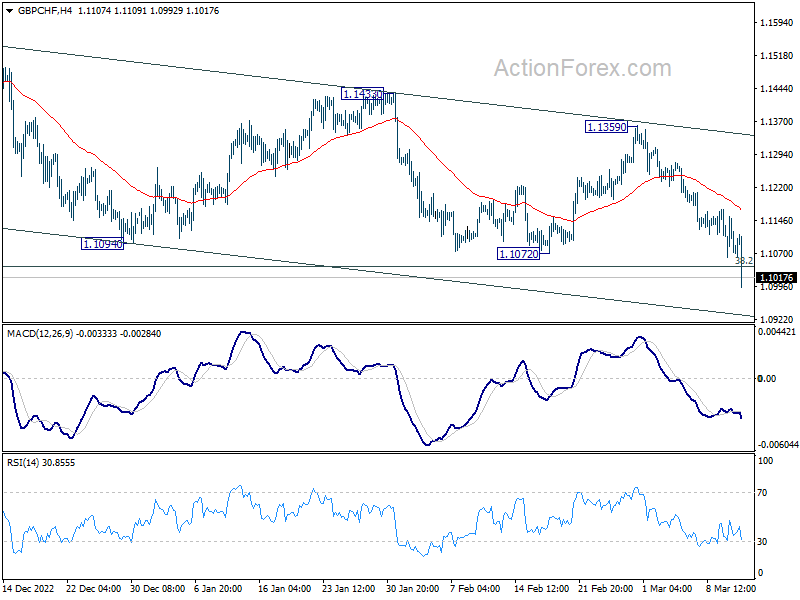
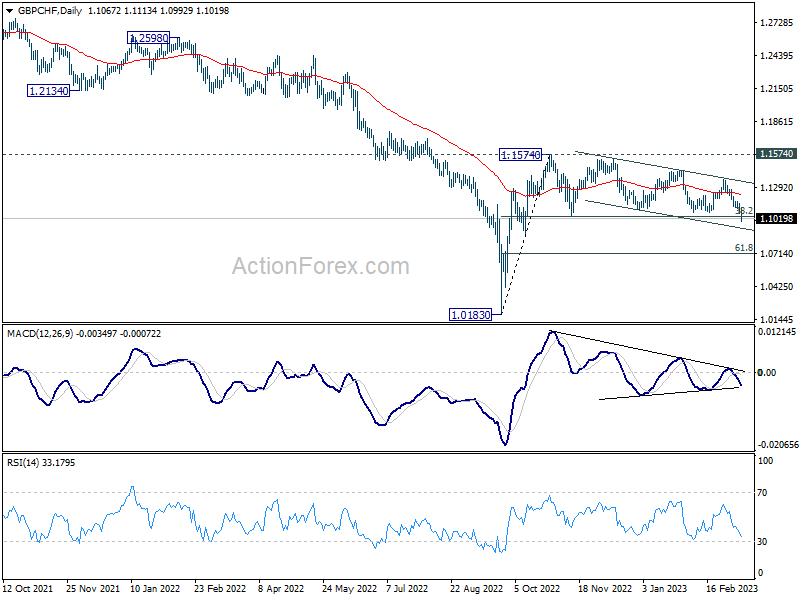
GBP/CHF breaks through an important support level at 38.2% retracement of 1.0183 to 1.1574 at 1.1043. Deeper fall is expected to lower channel support (now at 1.0922). Decisive break there could prompt downside acceleration to 61.8% retracement at 1.0714.
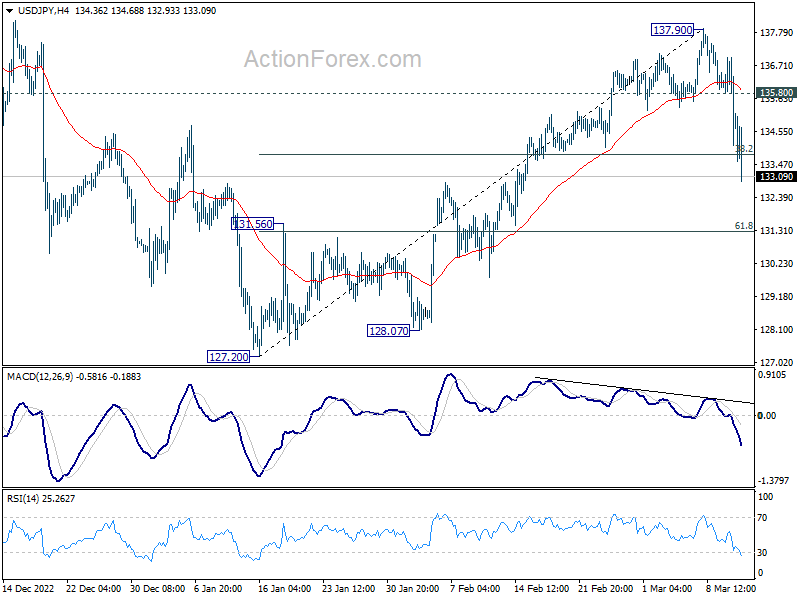
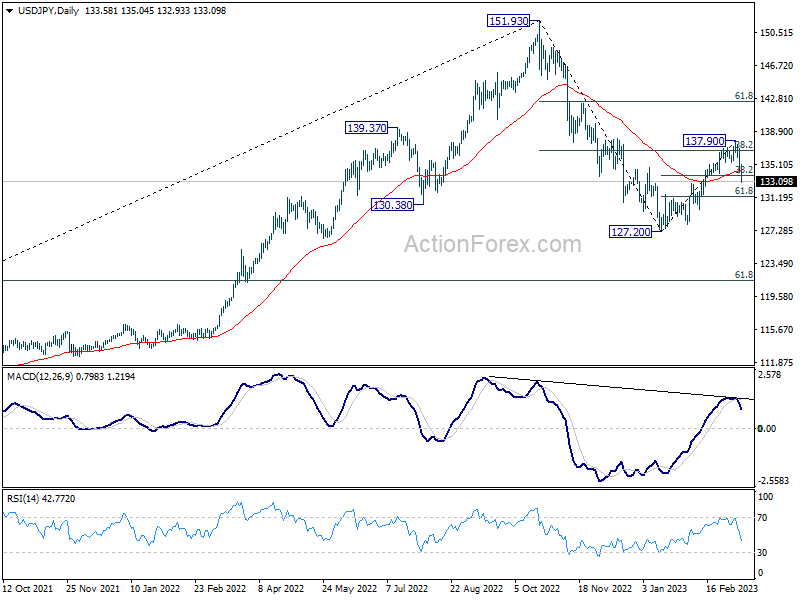
USD/JPY's strong break of 38.2% retracement of 127.20 to 137.90 at 133.81 and 55 day EMA argues that whole rebound from 127.20 has completed at 137.90. Deeper fall should be seen to 61.8% retracement at 131.28. Sustained break there will raise the chance of resumption of whole fall from 151.93 through 127.20 low.
EURUSD Battles With 50-Day SMA
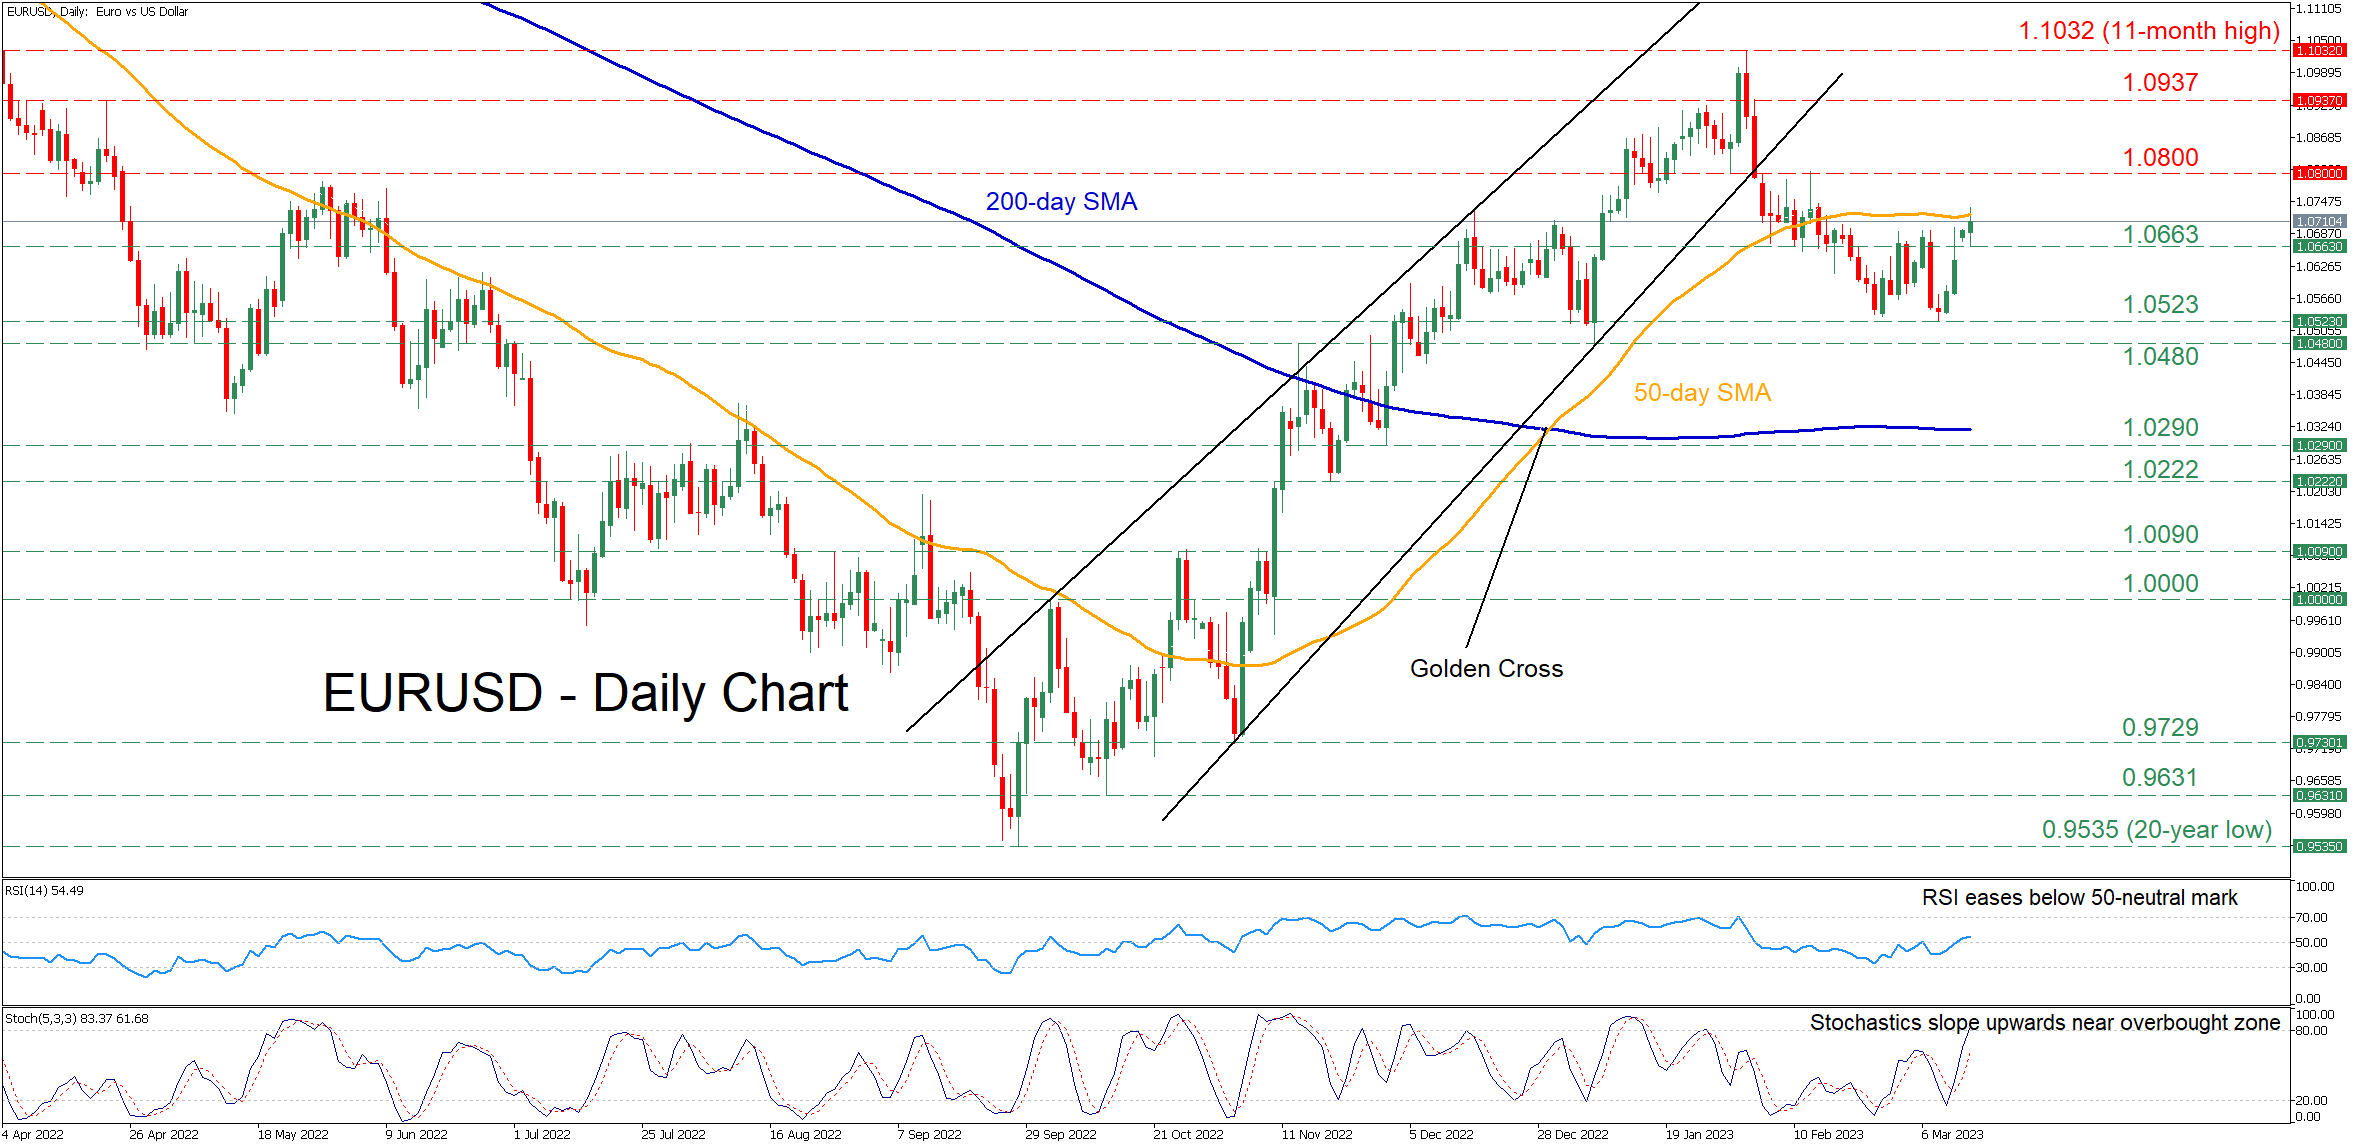
EURUSD has been in a consolidation mode after breaking below its upward sloping channel pattern. Nevertheless, the pair has realised some gains in the past few daily sessions, with the 50-day simple moving average (SMA) capping its upside.
The momentum indicators currently suggest that bullish forces have gained the upper hand. Specifically, the RSI has crossed above its 50-neutral mark, while the stochastic oscillator is ascending near its 80-overbought zone.
If buying pressures persist, initial resistance could be met at the 1.0800 resistance zone. Slicing through that region, the bulls could aim for the crucial 1.0937 region, which also provided strong resistance in April 2022. A violation of that territory might set the stage for the 11-month high of 1.1032.
On the flipside, bearish actions could send the price to test the recent support zone of 1.0663. Should that floor collapse, the pair could descend towards the March low of 1.0523 before the spotlight turns to the January bottom of 1.0480. If the pair fails to halt there, the 1.0290 barricade could provide further downside protection.
In brief, EURUSD seems to have the necessary momentum to edge higher and escape its recent rangebound pattern. For that scenario to materialise, the pair should initially pierce through the 50-day SMA.
Gold Eyes Profit Taking after Bullish Explosion
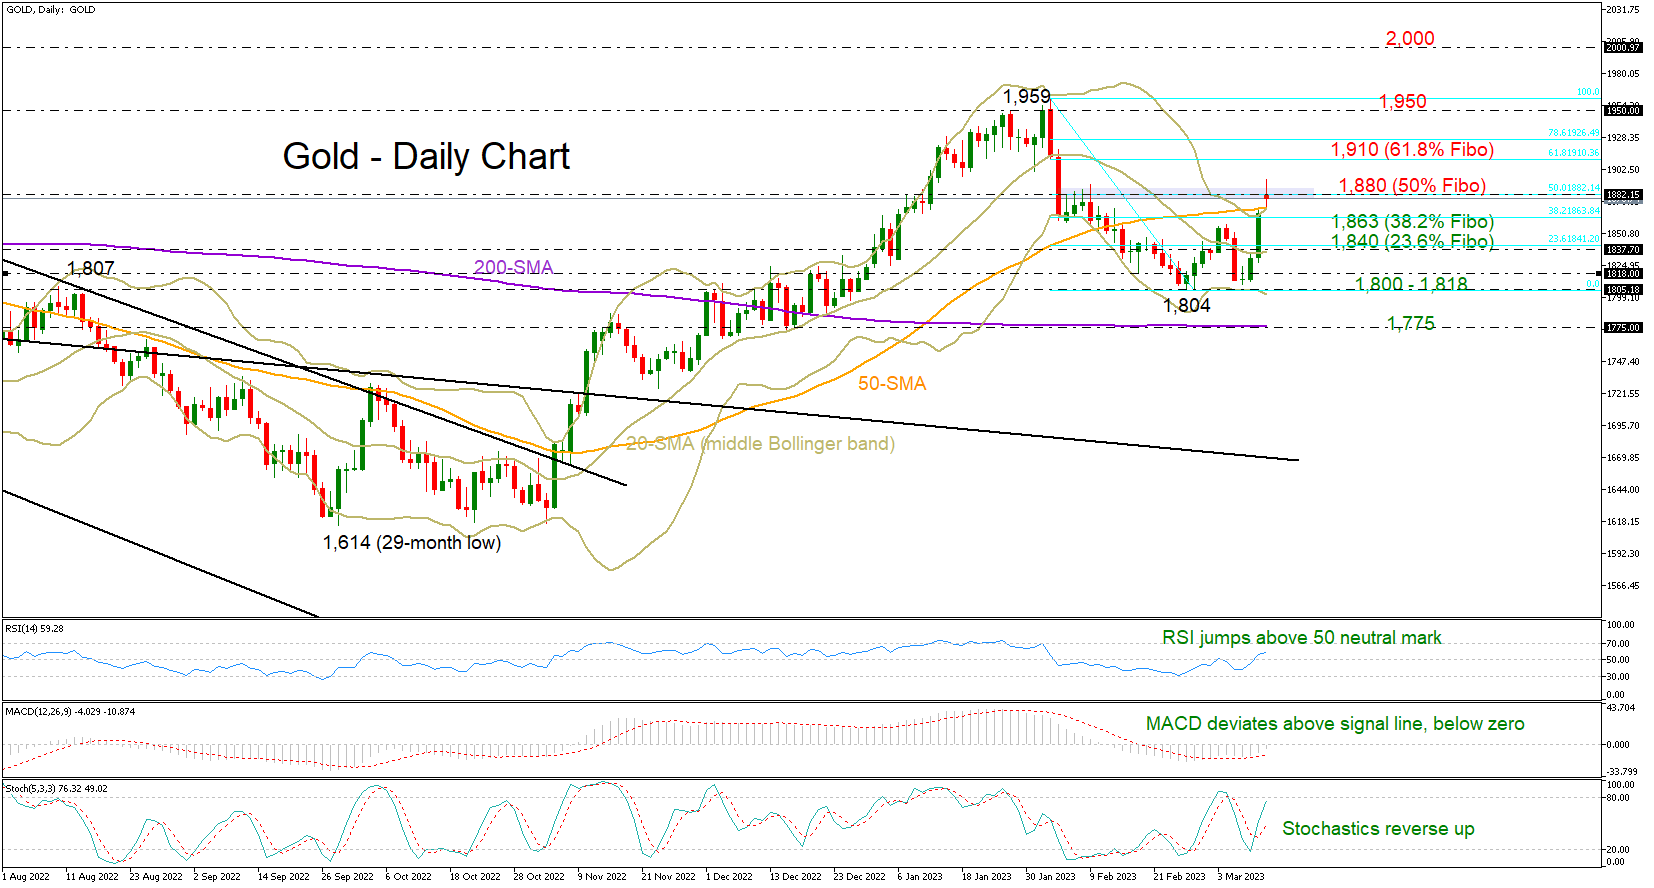
Gold opened higher and above its 50-day simple moving average (SMA) on Monday, stretching Friday’s impressive 2% rally, which was the fastest daily run since November 10, up to a five-week high of 1,894.
The precious metal restored its safe-haven feature in the wake of the Silicon Valley Bank’s fallout, quickly recouping last Tuesday's freefall as investors questioned whether the Fed will be able to deliver a 50 bps rate hike this week.
Technically, the swift upturn pushed the price back into the bullish area. The RSI has jumped back above its 50 neutral mark, while the MACD has strengthened above its red signal line. Yet, with the price trading above the upper Bollinger band - a sign that the latest advance is overdone - there is potential for a downside correction.
Note that the technical indicators on the four-hour chart are flagging overbought conditions.
The 1,880 region, which overlaps with the 50% Fibonacci retracement of the 1,959-1,804 downleg, is currently limiting bullish actions. The area had been a key barrier to upside movements a year ago. Therefore, a decisive close above it is probably required to drive the price towards the 1,900 psychological mark and the 61.8% Fibonacci zone. Running higher, the bulls will aim to resume the uptrend from October above the 1,950 bar. If they succeed, the next resistance could be the crucial 2,000 level.
In the bearish scenario, where the price slides back below the 50-day SMA and the 38.2% Fibonacci level of 1,863, the focus will shift to the 23.6% Fibonacci of 1,840 and the 20-day SMA (middle Bollinger band). Failure to pivot here could squeeze the price back into the 1,818-1,800 region.
All in all, gold seems to have entered a bullish territory, though the resistance around 1,880 could still motivate some profit taking.
Gold Price Started a Fresh Surge Above $1,820
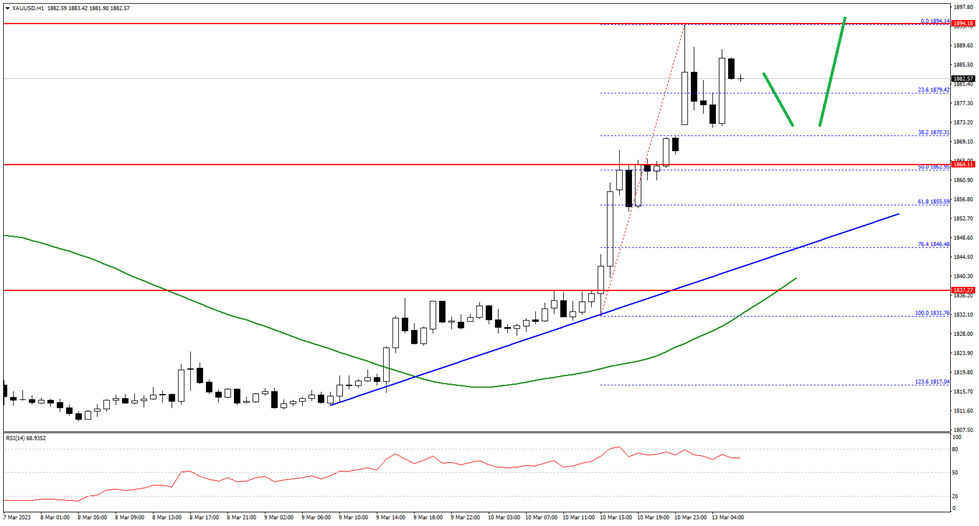
Gold price started a fresh surge above the $1,820 resistance against the US Dollar. The price cleared a major hurdle near $1,850 and the 50 hourly simple moving average.
The price even broke the $1,880 resistance and traded as high as $1,894 high. It is now consolidating gains, with an immediate resistance on the upside near the $1,895 level.
The first major resistance is near the $1,900 level. The next main resistance could be near the $1,920 level, above which the price could start a steady increase towards the $1,935 level. Any more gains might send the price towards $1,950 on FXOpen.
On the downside, an immediate support is near the $1,870 level. The next major support is near the $1,860 level, below which the price might decline towards the $1,850 support level in the near term.
Dax 40 Tests Daily Support
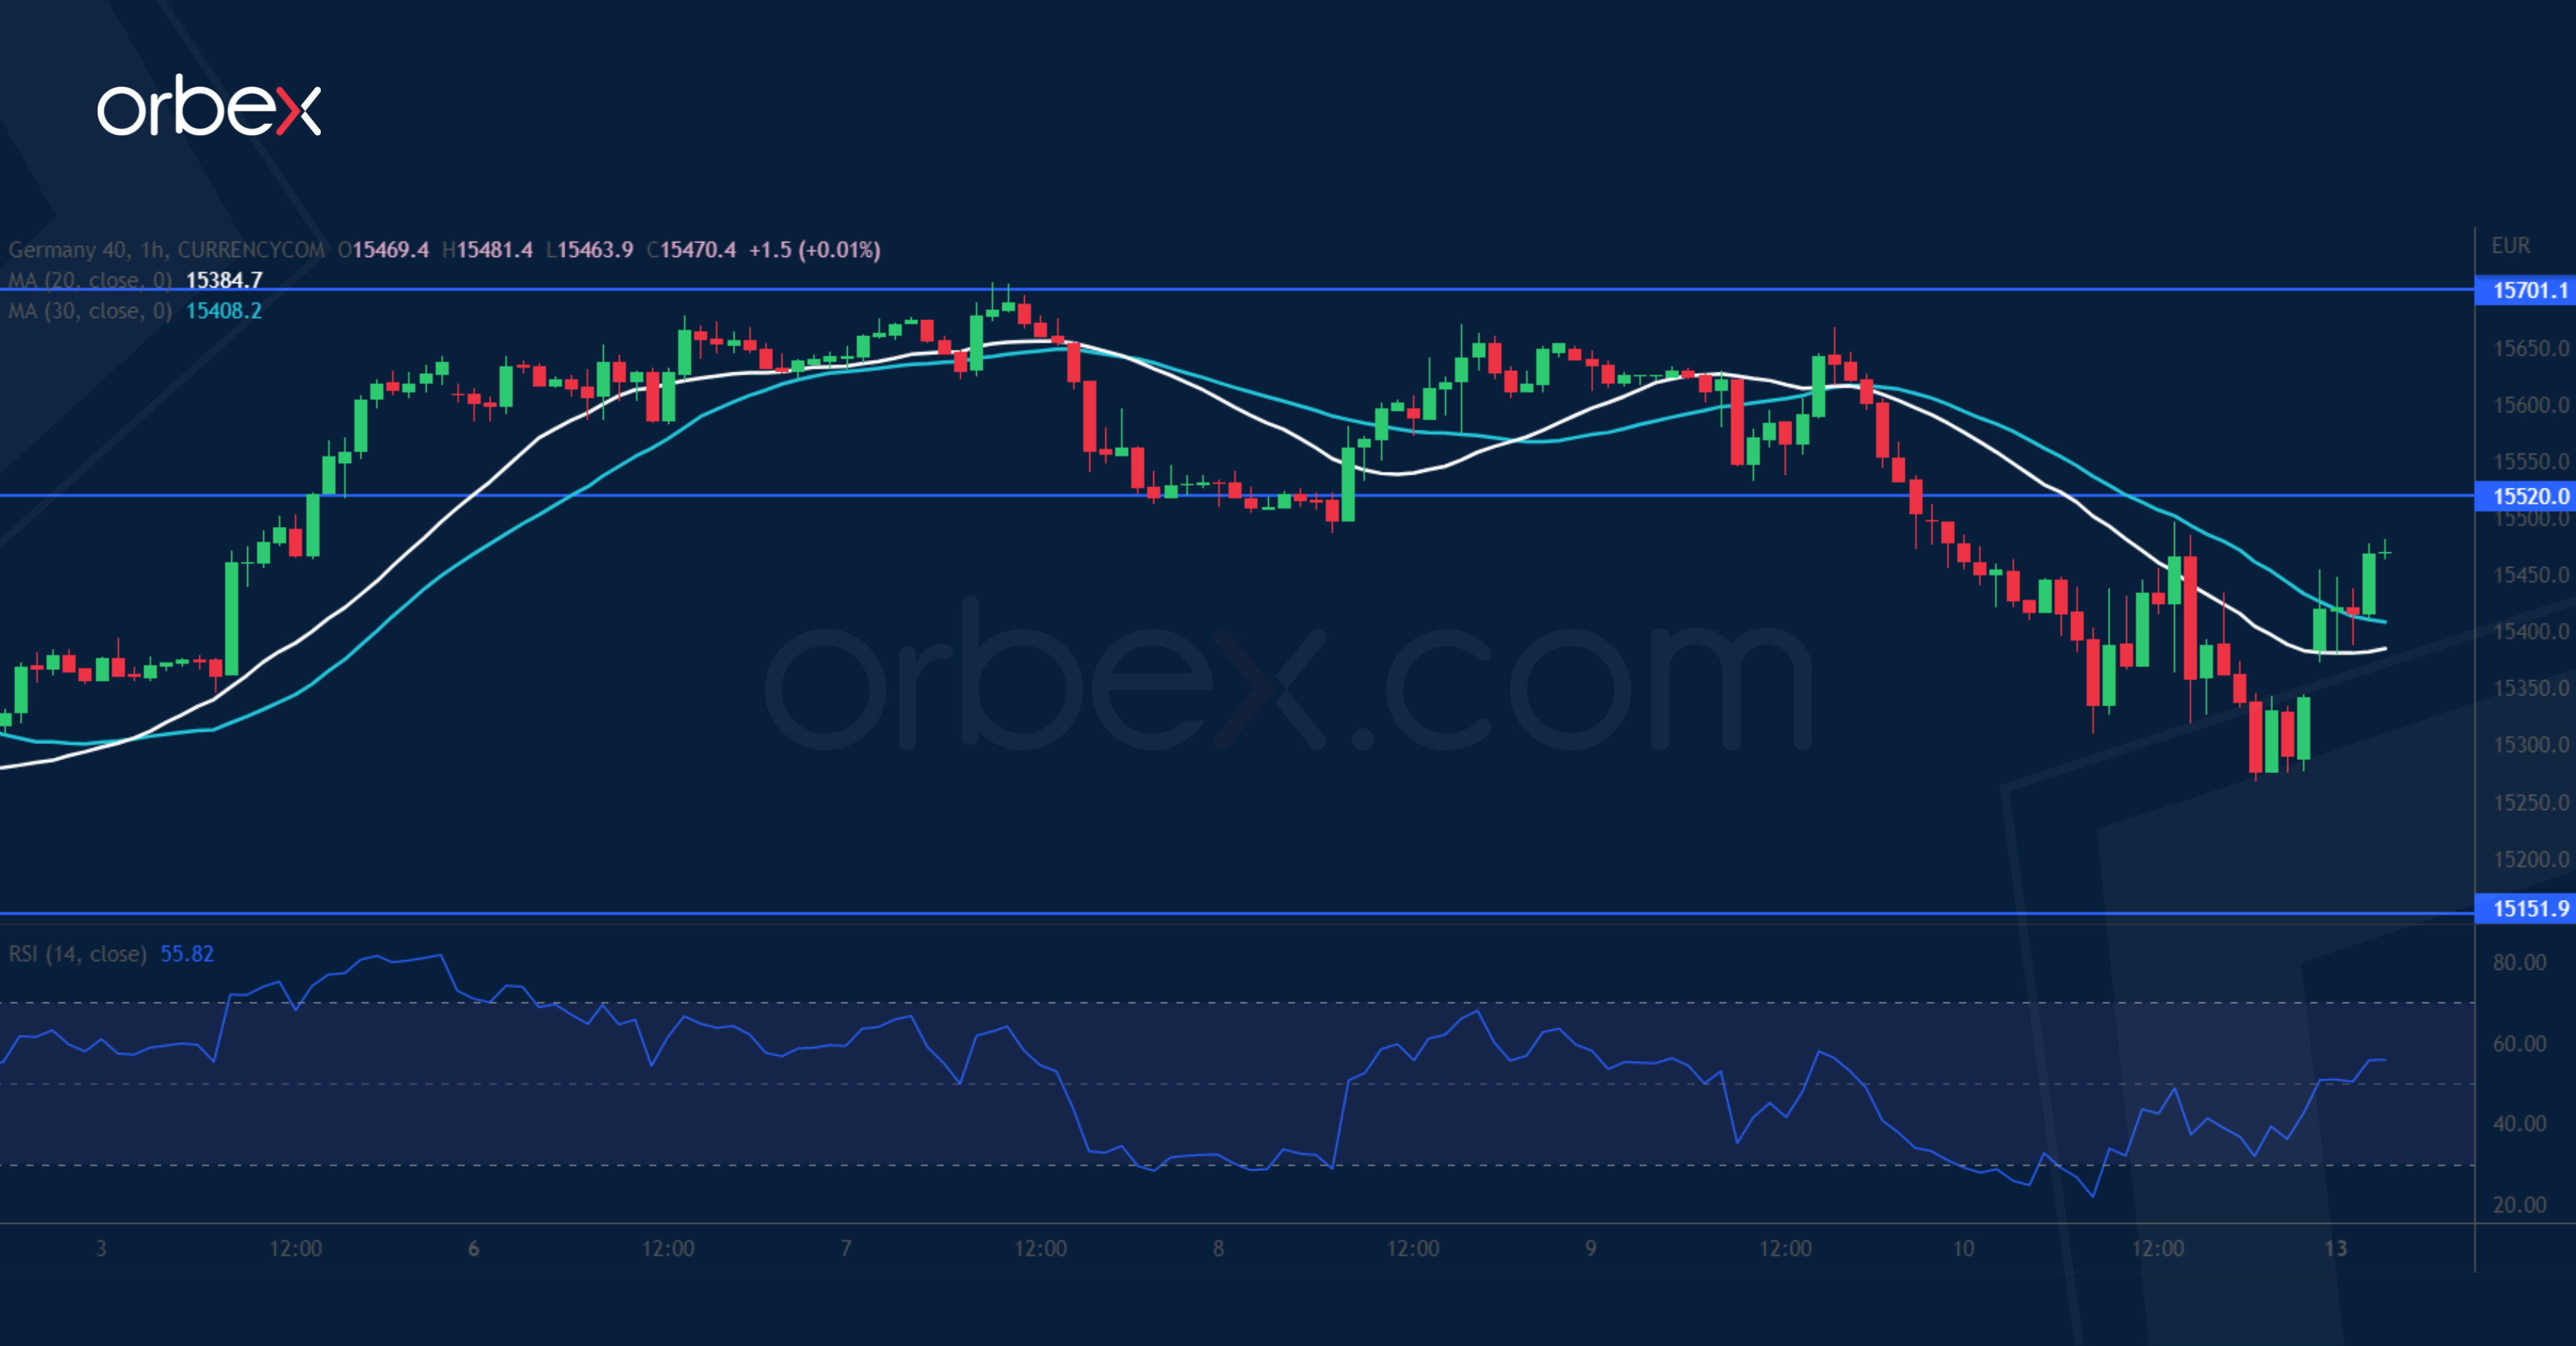
The Dax 40 grinds lower as the SVB crisis causes a flight to safety across the globe. This could be a serious test of the bulls’ commitment as the price is striving to hold on despite the latest sell-off. Bargain hunters were eager to buy the dip, prompting a limited bounce off the resistance-turned-support of 15320. 15150 is a critical floor to keep the index afloat and its breach would force buyers to abandon ship and trigger a liquidation towards 14900. 15520 is the first hurdle to go to ease the downward pressure.
USD/CAD Seeks Support
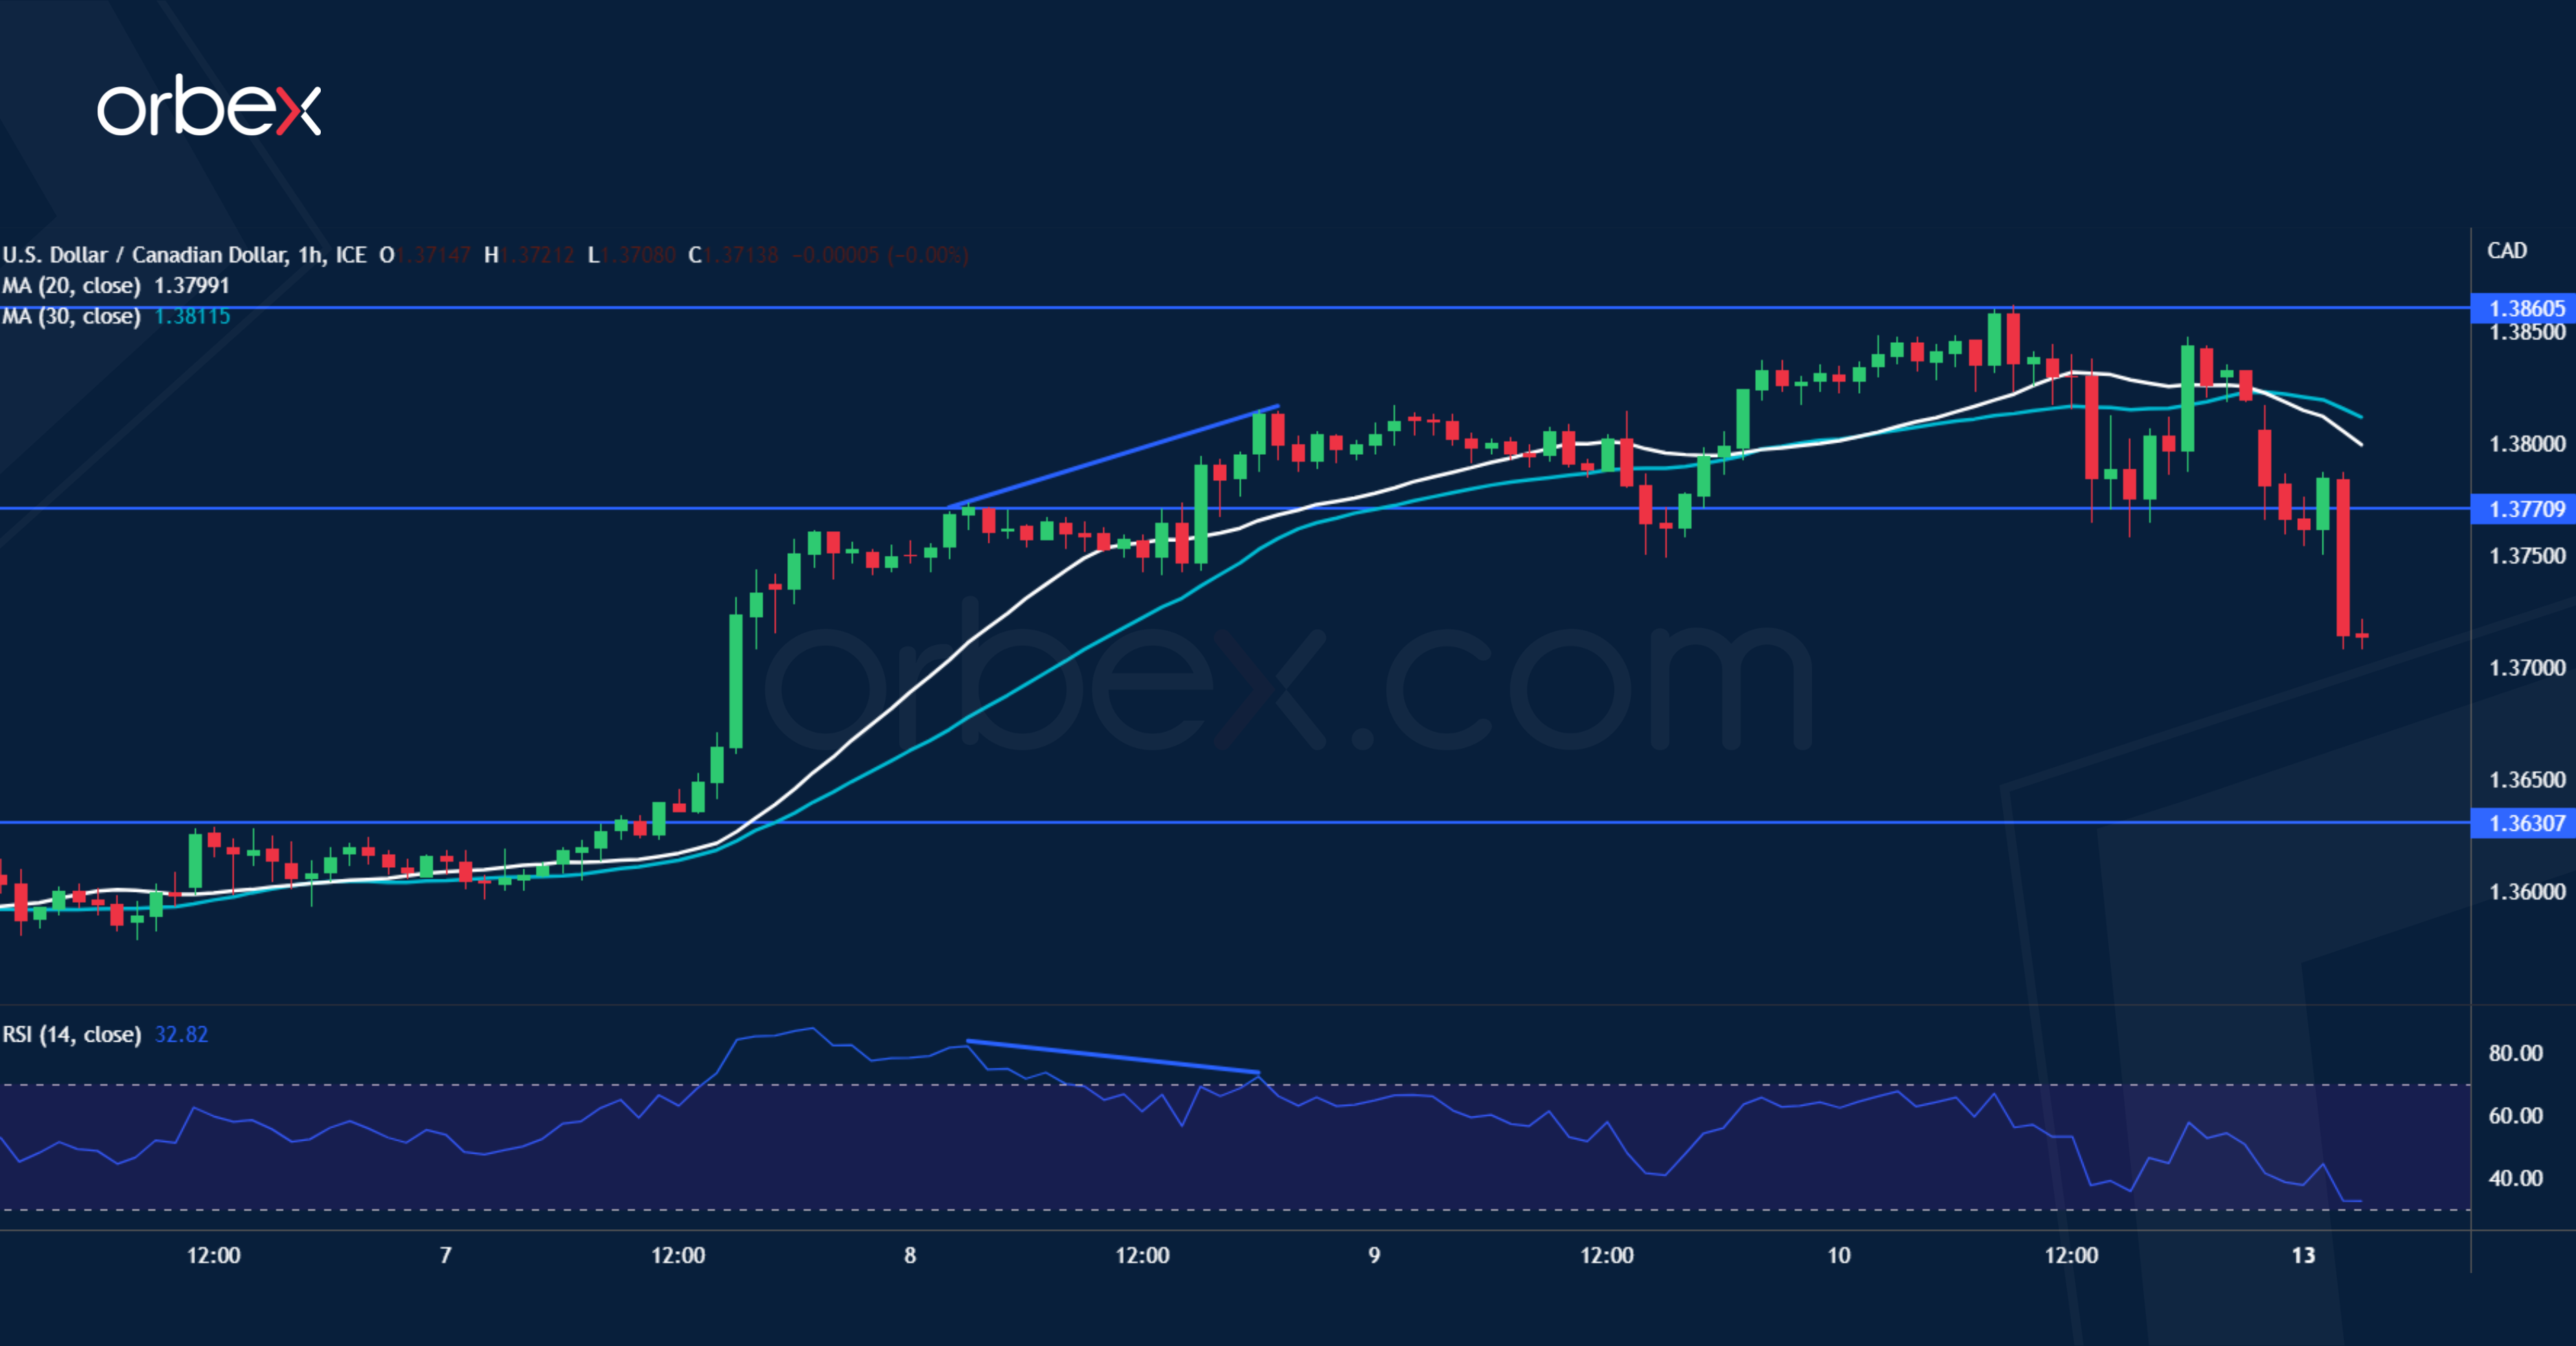
The Canadian dollar softened as the BoC may not budge despite a solid labour market. The pair turned south at 1.3860 as the daily RSI’s overbought condition combined with a bearish divergence on the hourly chart suggests that the price action may need some breathing room. 1.3750 saw some bids as trend followers stepped in at a discount but a deeper correction would send the greenback to the 20-day SMA near 1.3630, which coincides with the origin of the bullish breakout. 1.3770 has become a fresh resistance.
USD/CHF Breaks Lower
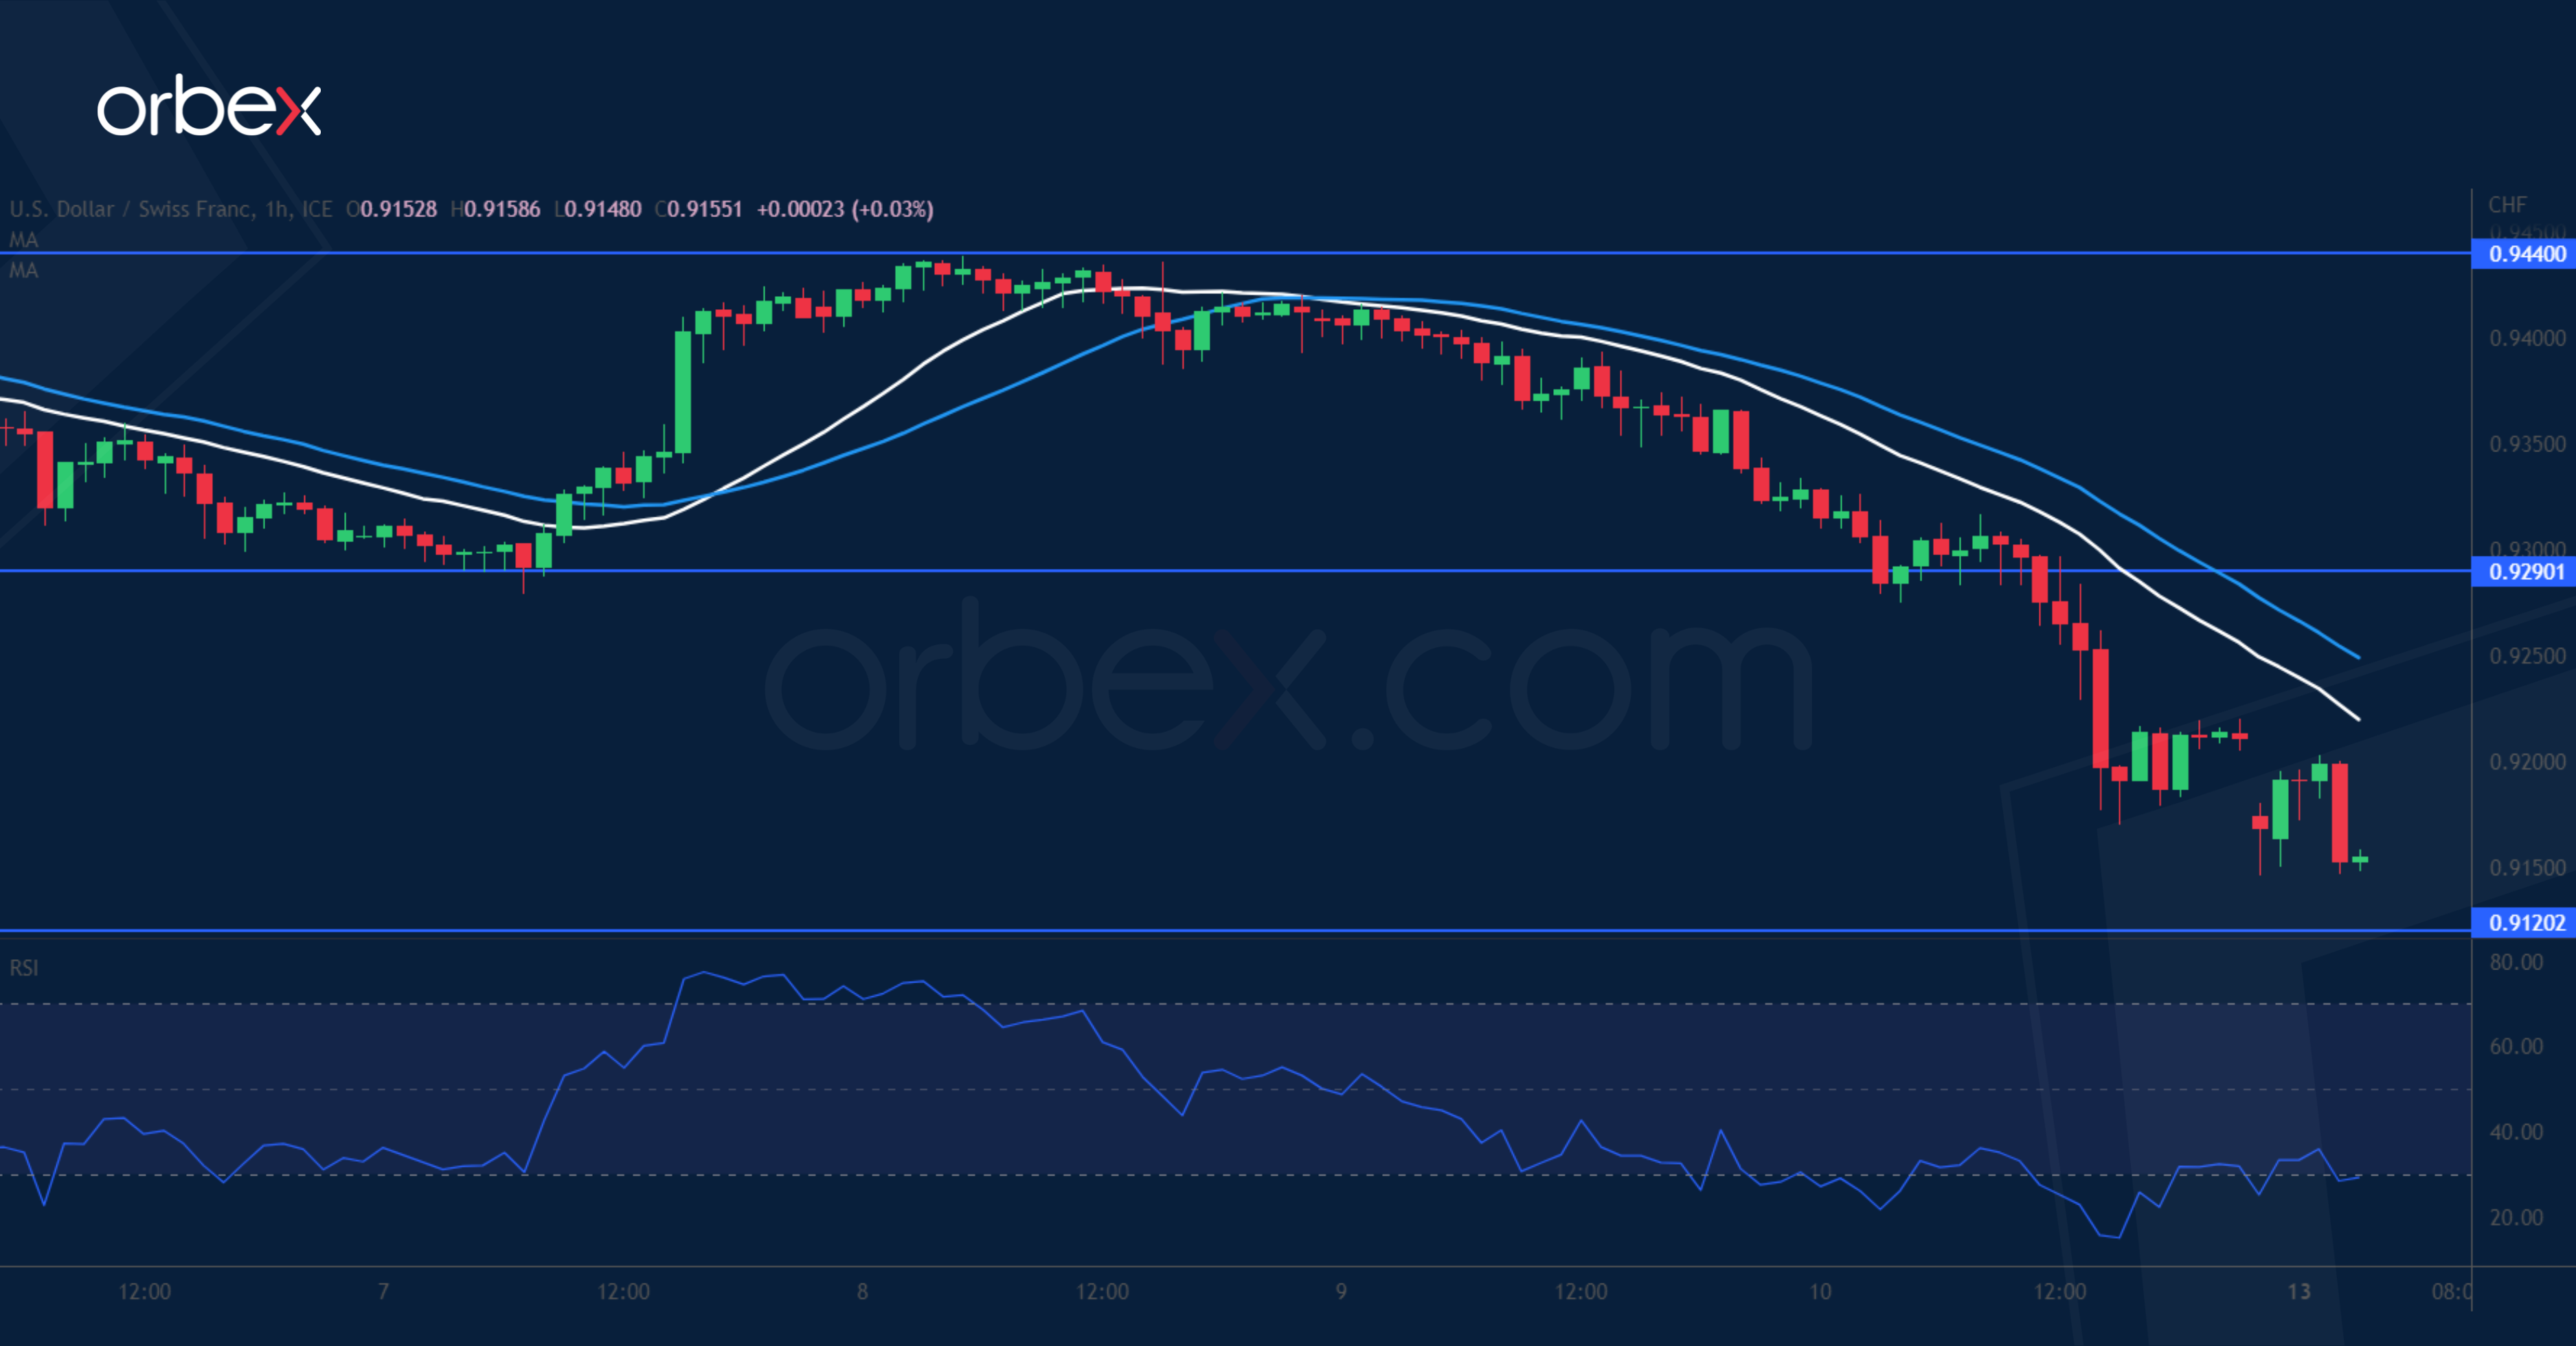
The US dollar tumbled after February’s jobs data showed slower wage growth. A previous fall below 0.9350 was a sign that the buy side had difficulty in holding on to their gains. Coming off the newly formed double top at 0.9440 a break below the swing low of 0.9290 then the daily support of 0.9210 suggests that the bears may have turned the tide. As the RSI bounces back from the oversold area, 0.9120 is the next level to see if any buying interest would emerge and 0.9290 is the first resistance to lift should this happen.