Sample Category Title
How Should the Market React to US CPI?
Monday was yet another ugly day for bank stocks around the world, as the selling pressure continued following the SVB debacle in the US last week.
The money flew into the safe havens.
Treasury yields around the world tumbled sharply. The US 2-year yield tipped a toe below the 4% mark, from above the 5% level last week, after Federal Reserve (Fed) Chair Jerome Powell hinted at potentially faster rate hikes in the US to abate inflation.
That expectation is no longer on the menu du jour.
On the contrary, there is now a massive lack of consensus in the market regarding what the Fed should do, and what the Fed will do. Some think that if today’s inflation data is not sufficiently soft, the Fed should continue hiking by 50bp. Some others think that the Fed should simply hike by another 25bp this month and signal a pause starting from the next meeting – which would be the smoothest solution of all for the market. An increasing number of investors and bank analysts including Goldman Sachs believe that the Fed will skip the March rate hike. Others stretch the ‘no rate’ idea further and think that we will finally get the pause in the US rate hikes that many were hoping for as soon as this month – meaning that the rate hikes will be over for this cycle for the US. And there are some extreme opinions, like Nomura, which think that the Fed could cut by 25bp at next week’s meeting to contain the crisis in the banking sector.
Now, in theory, the worst of the crisis should be behind us, as the US government guaranteed all depositors of the banks that collapsed last week. But the crisis will surely get the Fed to think twice about what to do at next week’s meeting.
For now, the pricing on Fed funds futures suggests that there is slightly more than 70% chance of a 25bp hike next month, and slightly less than 30% chance for no rate hike.
This is a big, big change since last week.
How will the market react to US CPI?
The US CPI data due today could reshuffle the Fed expectations regarding what will happen next week.
Both headline and core inflation are expected to have eased in February, but investors are cautious given that last month’s disappointment could be repeated this month, as the base effect – where we will finally start comparing the war months to the war months won’t be in play until March – as Russia invaded Ukraine by end of February last year.
Plus, Manheim’s used car index, that serves as an indicator of US inflation (though much less powerful than it used to be during the pandemic months) spiked significantly higher in February.
Therefore, it could be another month of a challenging CPI read for the US.
But the logic this time could be different than before last week. A CPI data in line, or ideally softer-than-expected could fuel the expectation of ‘no hike’ from the Fed this month, whereas a stronger-than-expected CPI figure may not fuel the expectation of a rate hike from the Fed, as many investors will be urging the Fed to stop hiking the interest rates and be patient about the impact on inflation that could come with delay.
Volatility mounts but we are nowhere close to panic levels
Turmoil in the market is also reflected through the spike in the volatility index. The VIX hit 30 level yesterday, the highest since October, but note that we are nowhere near the levels that were seen during the 2007/2008 subprime crisis, or the European debt crisis, or the pandemic selloff.
The S&P500 gapped lower on Monday, gained, then gave back gains to close the session slightly in the negative, while Nasdaq 100 – which also gapped lower at the open - closed the session 0.79% higher as the technology stocks rallied on the back of tumbling rate hike expectations and tumbling yields as a result of it.
Apple for example gained 1.33%, while Microsoft rallied more than 2% yesterday. And indeed, a surprise pause in Fed’s rate tightening could further boost the tech stocks that are rate-sensitive, and that have been hammered by the higher rate expectations over the past year.
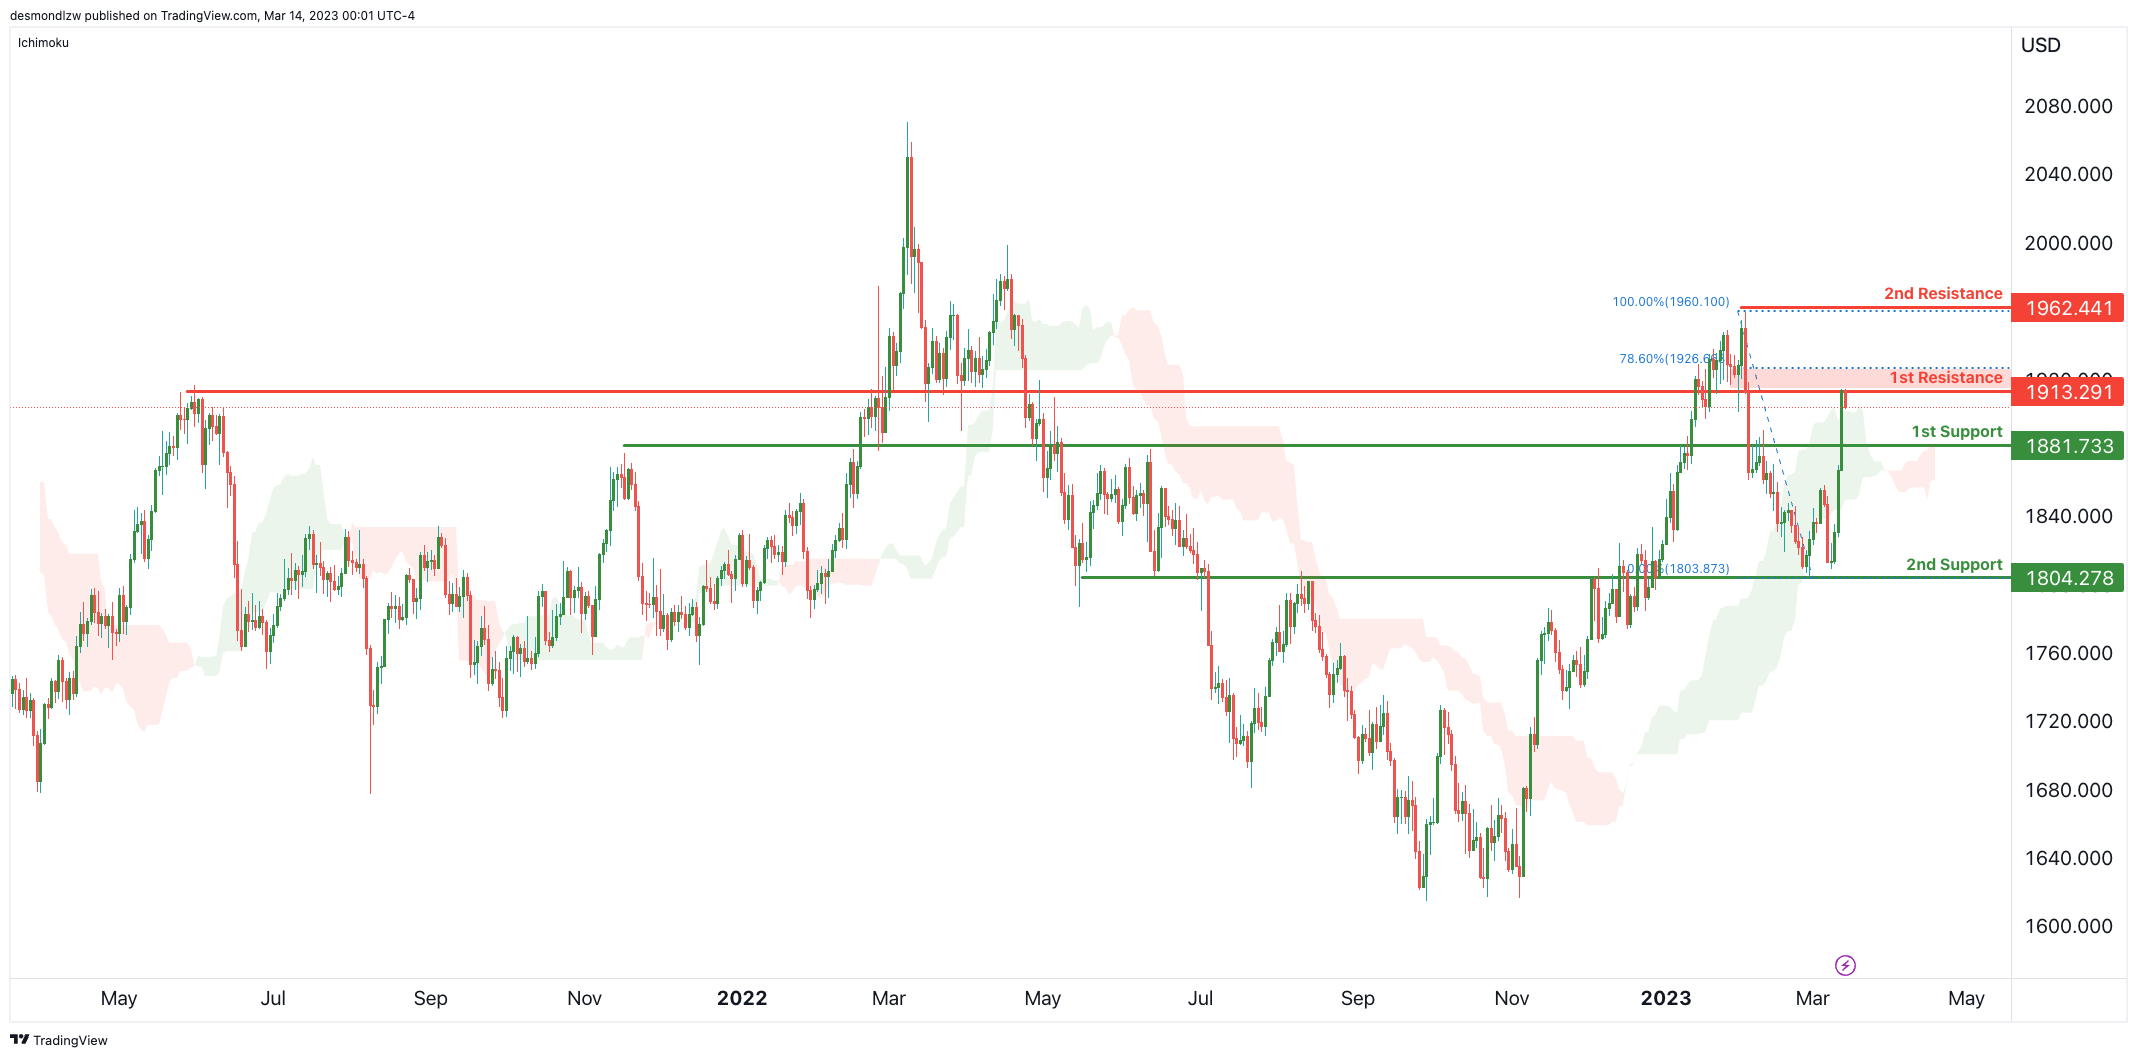
Another asset that benefits from the sharp decline in risk appetite, and the sharp decline in US yields is gold. The price of an ounce rallied by more than $100 since last week, and hit $1914 per ounce yesterday. Yet, the rally will likely lose its power as soon as the calm returns to the market. A correction below the 50-DMA, around $1875, is likely in the next few sessions.
What about the ECB’s 50bp hike?
When the US sneezes, the world catches a cold. The tumbling rate hike expectations in the US are spreading through other parts of the world.
Traders now see less than a 50% chance for another 50bp hike from the European Central Bank (ECB) this Thursday, and the expectation of the peak ECB rate fell below 3.5%, from around 4% last week.
But despite the softening ECB expectations, the EURUSD flirted with 1.0750 yesterday, as the US dollar sank deeper across the board.
And well, in periods of strong price action in the US dollar, the dollar is the main catalyzer of market pricing. Therefore, the ECB expectations could temper the FX moves, but could hardly reverse the direction of the market dictated by the USD.
Fear of an Unfolding Banking Crisis
Market movers today
Apart from all news regarding problems in the banking sector, focus today is on US CPI for February. In line with consensus, we expect 0.4% m/m for both headline and core indices, still clearly above what is compatible with 2% annual inflation and hence supporting further rate hikes, all else equal. Michelle Bowman from the Fed Board of Governors is due to give a speech on modernising the US banking system this evening, potentially interesting in light of the current issues in banking.
Also important, labour market data is out today in the UK. As elsewhere, the labour market has remained tight and several Bank of England (BoE) members have expressed that particularly the wage growth will be key to follow. Wages slightly decreased during December (from high levels) and are expected to drop further in January in combination with a slightly higher unemployment rate. A new uptick in wages would most likely be a big headache for the BoE.
The 60 second overview
Fear of a banking crisis unfolding: Yesterday was a historical day in all aspects as fear spread through the rates markets of the risk of an unfolding US banking crisis among the regional banks could have wider repercussions. Markets took out a full 50bp of the peak ECB policy rate by the end of the day, now standing at 3.28%, while markets repriced Fed expectations by 62bp to 4.76% peak at the end of the day. 10y German Bund yields dropped 25bp to 2.26% after it recovered some 5bp in the latter part of the trading session. The 2y German yield dropped 40bp yesterday, the most on record.
The US Treasury, Federal Reserve and FDIC's attempt to stabilise markets on the back of the measures announced Sunday night was not enough to contain the stress to SVB. Early in the day, it was rumoured that First Republic Bank was also at risk despite its affirmation of significant liquidity buffers. Similar Western Alliance saw similar turmoil.
Looking ahead, we note that the reaction in inflation markets has been remarkably limited with a general steepening of curves. To us, that highlights that lower real rates and a weaker USD in isolation are inflationary by nature. By extension that entails that if/when systemic risk concerns fade there could be plenty of room for markets to price back in rate hikes from central banks. In the very near-term, we do see a slight potential for a relatively firmer and hawkish ECB on Thursday than Fed next week, which could add some 1-2W topside to EUR/USD.
That said, for the time being we prefer a quite humble and nimble approach until we get more clarity on what arguably is a quite binary outcome with respect to systemic risk fears. Either we have reached a limit as to how much central banks and not least Fed can hike; that would mark a complete game changer for the macro environment in the coming quarters - or it might be that regulators and authorities are able to calm markets again, which leaves an immense reversal-trade potential. Either way volatility is here to stay for the coming weeks.
Equities: Equities were mostly lower Monday. However, the interesting story is the massive sell-off in banks and the remarkable reprising of central banks and not least the Fed. This is only day two or day three of the crisis created by SVB and given the massive increase in uncertainty one should also note that a drop of 0.5% MSCI World yesterday is in historical context next to nothing. Banks have led the sell-off with KBW index down almost 12% yesterday and not surprising to see Italy leading the sell-off in Europe. Again, please note that five sectors including tech were in green yesterday. VIX rose by two points to 26.5 in yet another sign of how this is more a sign of increased fear and uncertainty. In US yesterday, Dow -0.3%, S&P 500 -0.2%, Nasdaq +0.5% and Russell 2000 -1.6%. Asian markets are lower this morning led by banks (note, Asian stocks rose yesterday). European and US futures are higher this morning.
FI: With the repricing of central bank expectations, markets are now split on the size of the rate hike from ECB on Thursday. ECB sources yesterday said that the hawks will face stronger opposition to the 50bp rate hike they intended. We still expect ECB to hike 50bp on Thursday, although with significant communication on the risks to the outlook. As regards the Fed, yesterday's repricing has now shown that Fed is more likely to stay on hold than hike at next week's meeting. Overnight, US treasuries have been relatively stable, although we expect a choppy session today waiting for new info on the US banking situation ahead of the US CPI today.
FX: Massive rates volatility with some spill-over to FX, albeit to a lesser extent. Central banks have been completely re-priced, leaving room for potential surprises in either direction. EUR/USD oscillated between 1.0650 and 1.0750 yesterday and is starting the day at 1.0700. Scandies had a really tough first half of the session, but found some support in the afternoon. Broad USD stands out as the clear loser within G10 for the past three days, with CHF and GBP as the top performers
Credit: Credit markets continued in risk-off mode on Monday, following the collapse of Silicon Valley Bank over the weekend. The collapse created a massive sell-off in equities within the banking sector as well as significant widening of credit spreads. Itraxx Main widened 8.5bp to close at 90.0bp, while Xover widened 33.8bp to close at 460.1bp. The negative sentiment also affected primary credit markets, exemplified by Fannie Mae's decision to postpone the sale of USD500m in mortgage-linked bonds.
Nordic macro
In Sweden, focus will be on the parliamentary hearing of the Riksbank, where all board members will participate. The topic is the annual report for 2022 and the February policy decision. The Riksbank reported a total loss of SEK80bn for 2022, driven by the mark-to-market valuation of their bond holdings wiping out the equity position into a negative SEK-18bn. Under the new Riksbank law, the Riksbank will therefore have to ask for a recapitalisation at the latest in spring 2024. There will likely be questions around this and how this will be managed, but we would also expect questions around financial stability risks given the current market turmoil.
AUD/USD Daily Report
Daily Pivots: (S1) 0.6551; (P) 0.6596; (R1) 0.6626; More...
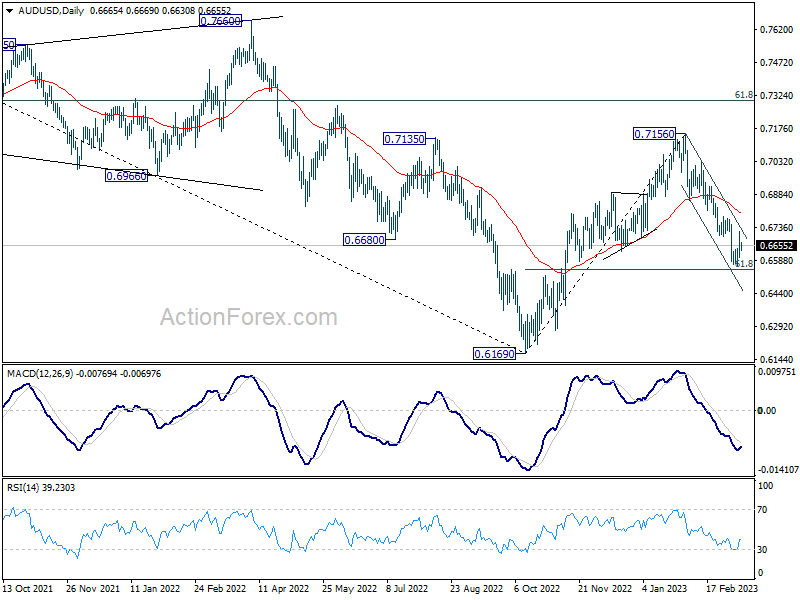
AUD/USD failed to sustain above 0.6694 resistance so far and intraday bias remains neutral. . Focus is on whether 0.6546 fibonacci level would provide strong support to bring reversal. On the upside,firm break of 0.6694 support turned resistance will indicate short term bottoming, and turn bias back to the upside for rebound to 55 day EMA (now at 0.6798). However, sustained break of 0.6546 will carry larger bearish implication and target 0.6169 low.
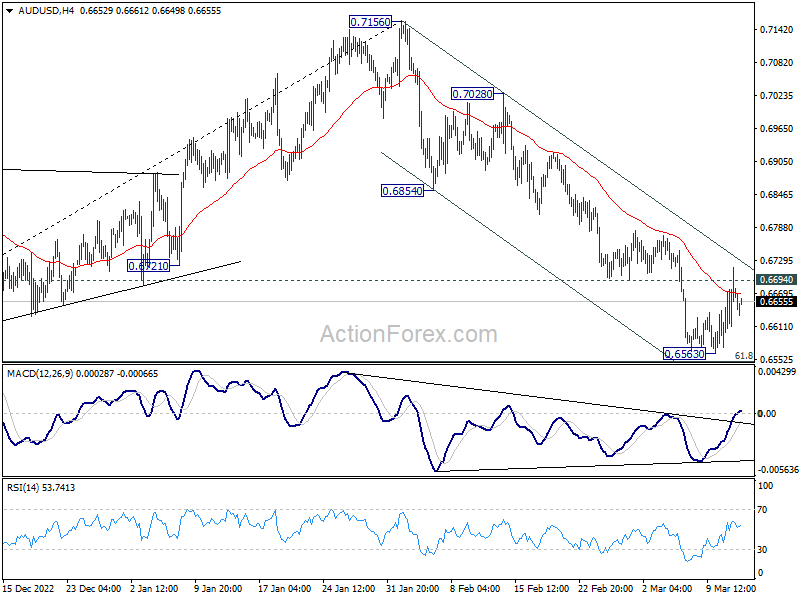
In the bigger picture, rise from 0.6169 (2022 low) has completed at 0.7156, after rejection by 55 month EMA (now at 0.7158). Deeper decline would then be see back to 61.8% retracement of 0.6169 to 0.7156 at 0.6546, even as a corrective fall. Sustained break there will raise the chance of long term down trend resumption through 0.6169 low.
USD/CAD Daily Outlook
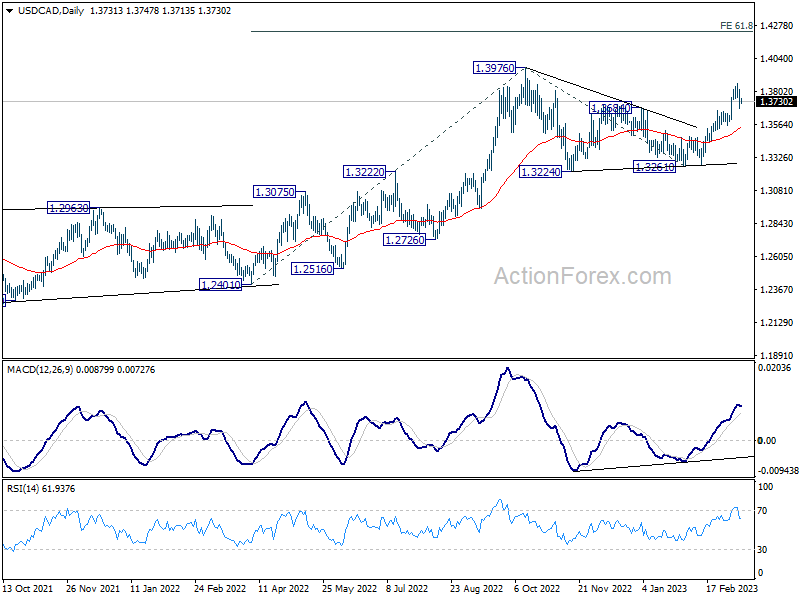
Daily Pivots: (S1) 1.3666; (P) 1.3742; (R1) 1.3805; More....
Intraday bias in USD/CAD remains neutral for the moment. Consolidations from 1.3860 could extend further. But downside should be contained by 1.3664 resistance turned support to bring another rally. On the upside, break of 1.3860 will resume the rally from 1.3261 to retest 1.3976 high. However, firm break of 1.3664 will mix up the near term outlook and bring deeper pullback first.
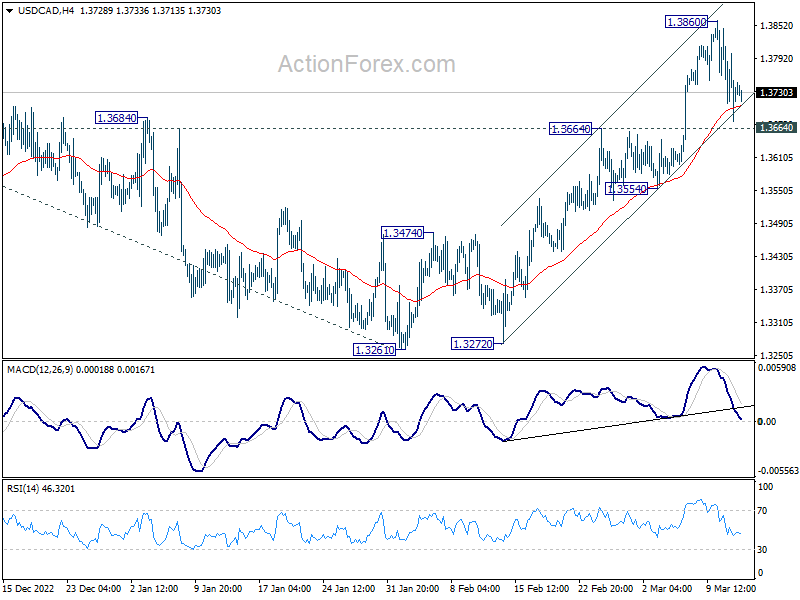
In the bigger picture, the up trend from 1.2005 (2021 low) is still in progress. Break of 1.3976 will confirm resumption and target 61.8% projection of 1.2401 to 1.3976 from 1.3261 at 1.4234. Firm break there will pave the way to long term resistance zone at 1.4667/89 (2016, 2020 highs). On the downside, break of 1.3261 support is needed to confirm medium term topping. Otherwise, outlook will remain bullish even in case of deep pull back.
USD/JPY Daily Outlook
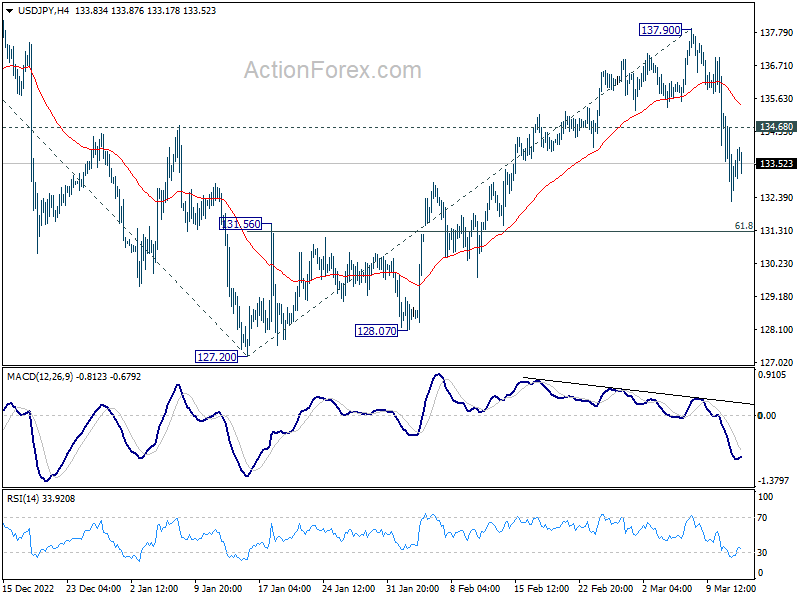
Daily Pivots: (S1) 132.02; (P) 133.53; (R1) 134.76; More...
Intraday bias in USD/JPY stays on the downside at this point. Current fall from 137.90 would target 61.8% retracement of 127.20 to 137.90 at 131.28. Sustained break there will pave the way to retest 127.20 low. On the upside, above 134.68 minor resistance will turn intraday bias neutral first.
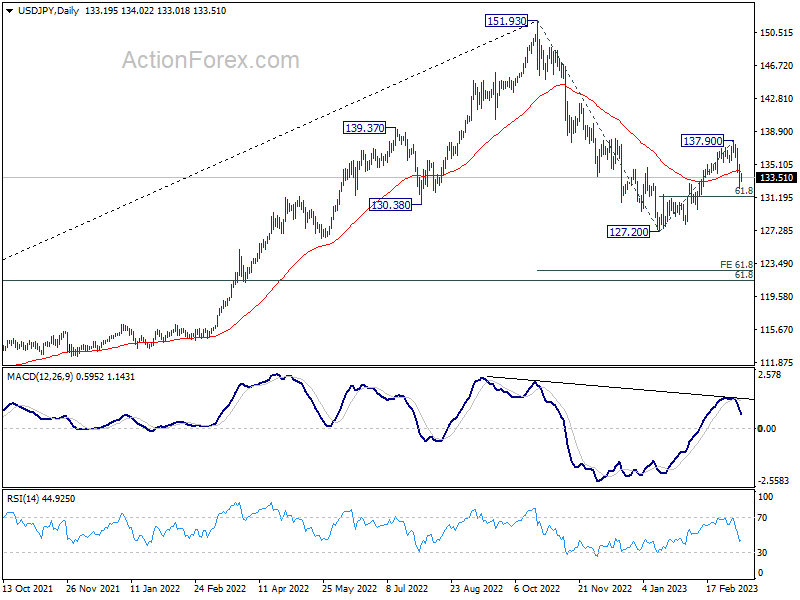
In the bigger picture, rebound from 127.20 should have completed at 137.90 as a corrective move, with strong break of 55 day EMA. The down trend from 151.93 (2022 high) is not over yet. Break of 127.20 will resume this down trend and target 61.8% projection of 151.93 to 127.20 from 137.90 at 122.61. This will now be the favored case as long as 137.90 resistance holds.
USD/CHF Daily Outlook
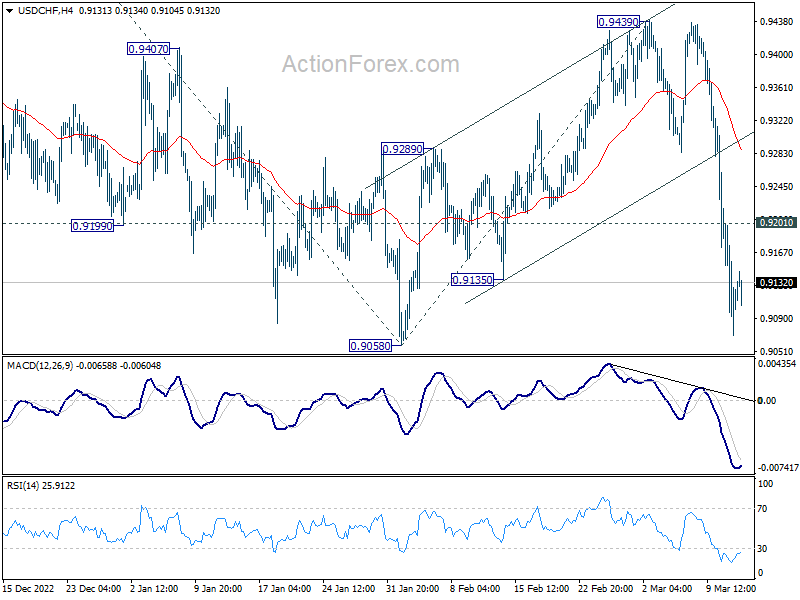
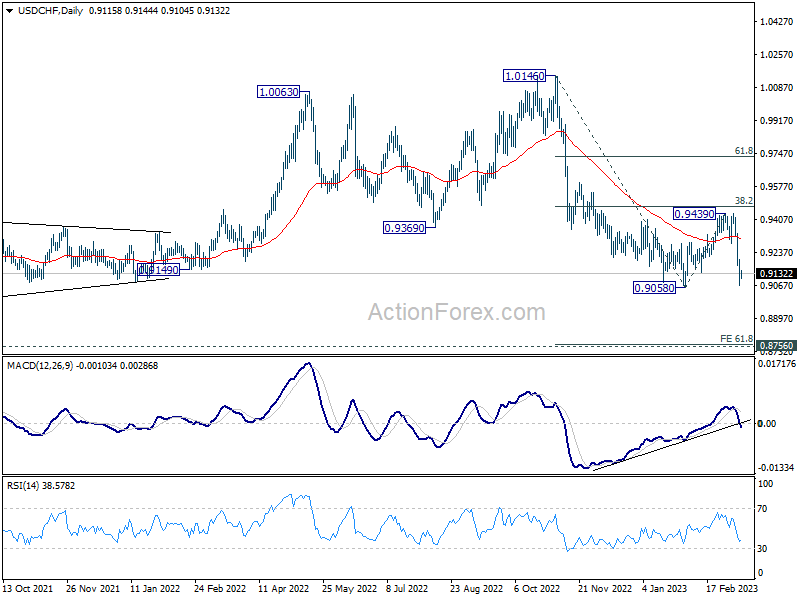
Daily Pivots: (S1) 0.9057; (P) 0.9133; (R1) 0.9194; More...
Intraday bias in USD/CHF remains on the downside with focus on 0.9058 low. Decisive break there will resume larger down trend from 1.0146. Next target is 61.8% projection of 1.0146 to 0.9058 from 0.9439 at 0.8767. On the upside, above 0.9218 minor resistance will turn intraday bias neutral and bring consolidations first, before staging another fall.
In the bigger picture, fall from 1.1046 (2022 high) is should still be in progress with 38.2% retracement of 1.0146 to 0.9058 at 0.9474 intact. Rejection by 55 week EMA is also a medium term bearish sign. Break of 0.9058 will resume such decline towards 0.8756 support (2021 low). But overall, such fall is still as a leg in the long term range pattern from 1.0342 (2016 high). So, downside should be contained by 0.8756 to bring reversal. For now, this will remain the favored case as long as 0.9439 resistance holds.
EUR/USD Daily Outlook
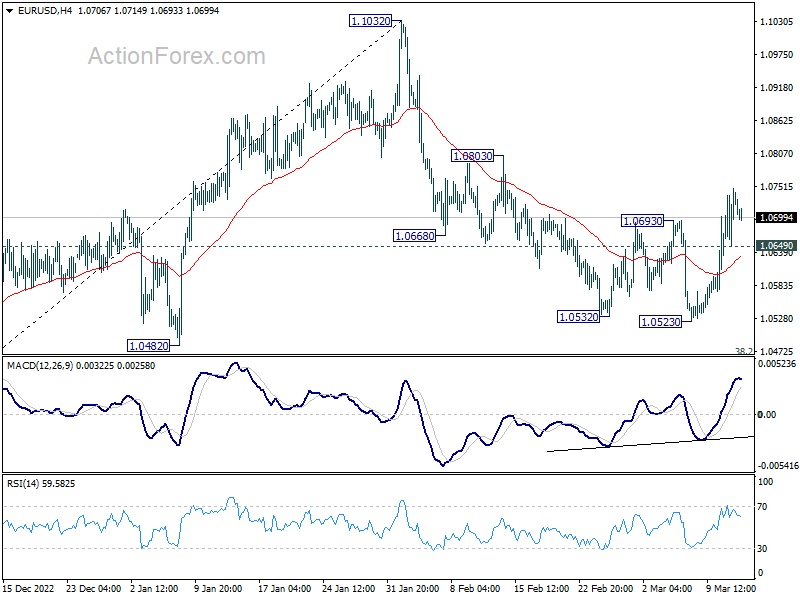
Daily Pivots: (S1) 1.0672; (P) 1.0710; (R1) 1.0771; More...
Intraday bias in EUR/USD remains on the upside for the moment. As noted before, corrective decline from 1.1032 should have completed at 1.5023, ahead of 1.0482 key support. Further rally would be seen to 1.0803 resistance first. Firm break there will target a retest on 1.1032 high. On the downside, below 1.0649 minor support will turn intraday bias neutral. But risk will stay on the upside as long as 1.0523 support holds, in case of retreat.
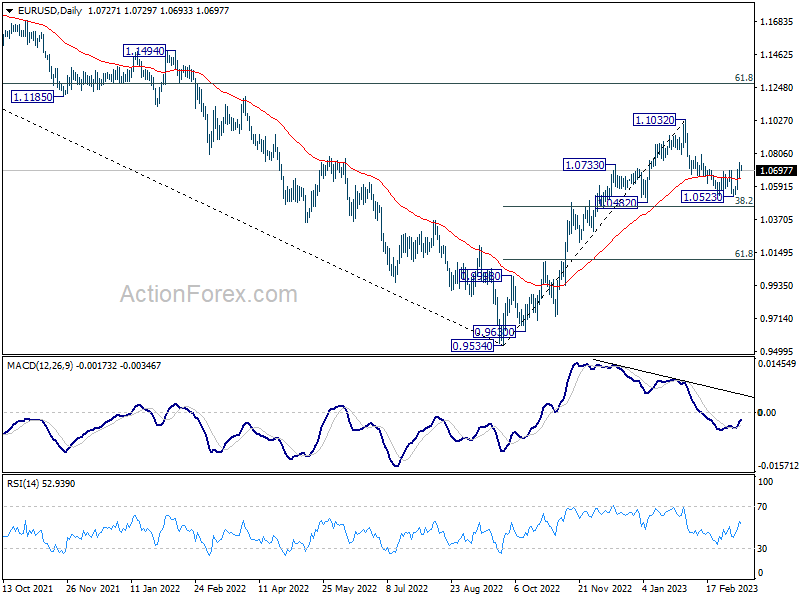
In the bigger picture, as long as 1.0482 support holds, rise from 0.9534 (2022 low) should continue to 61.8% retracement of 1.2348 (2021 high) to 0.9534 at 1.1273. However, sustained break of 1.0482 will bring deeper fall to 61.8% retracement of 0.9534 to 1.1032 at 1.0106, even as a corrective pull back.
GBP/USD Daily Outlook
Daily Pivots: (S1) 1.2087; (P) 1.2143; (R1) 1.2240; More...
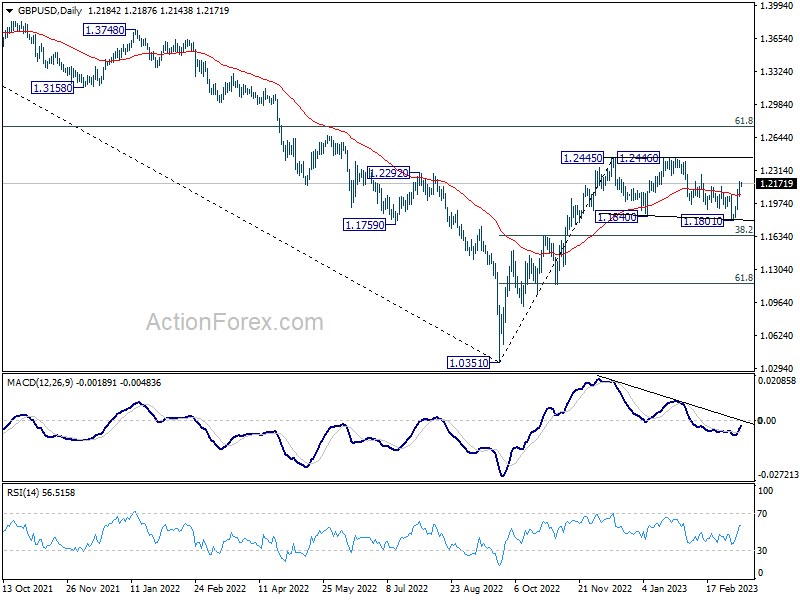
Intraday bias in GBP/USD remains on the upside as rise from 1.1801 is extending. As noted before, the corrective pattern from 1.2445 should have completed with three waves to 1.1801. Further rally should be seen to retest 1.2445/6 resistance zone next. On the downside, below 1.2045 minor support will delay the bullish case and turn intraday bias neutral first.
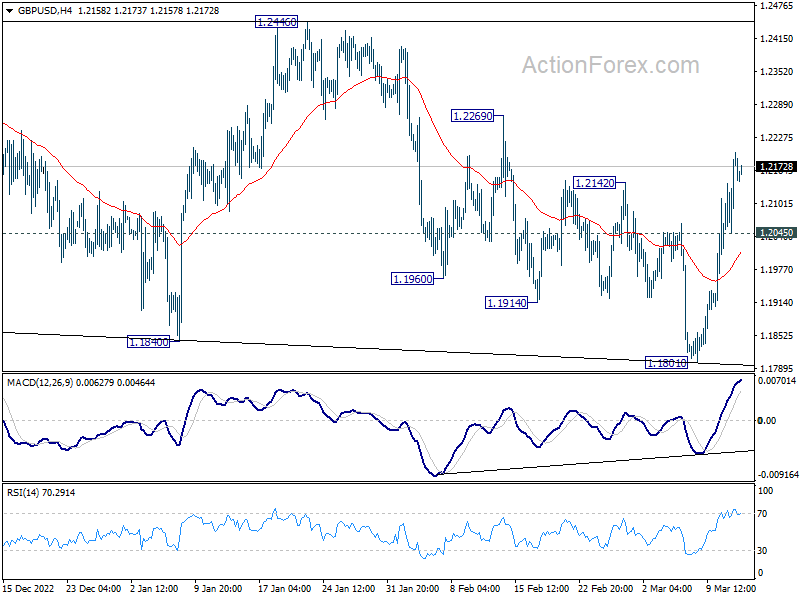
In the bigger picture, price action from 1.2445 are seen as a corrective pattern to rise from 1.0351 medium term bottom (2022 low). Resumption is expected as a later stage and firm break of 1.2446 will target 61.8% retracement of 1.4248 (2021 high) to 1.0351 at 1.2759. This will remain the favored case as long as 38.2% retracement of 1.0351 to 1.2445 at 1.1645 holds.
Banking Crisis Overshadows US CPI Release, Fed Hike Expectations Lowered
Investors are eagerly awaiting the release of February US CPI figures today, although the banking crisis has overshadowed the event. The possibility of a 50bps hike by Fed next week has been priced out by the market. While traders still anticipate a 25bps hike, with a likelihood of over 70% as indicated in the fed funds futures, the chances of no hike at all could rise once again depending on how events unfold in the stock and bond markets.
Major currency pairs and crosses are trading within yesterday's range, waiting for the next round of market turbulence. Dollar has been the weakest performer so far this week, followed by Euro and Canadian Dollar. Australian and New Zealand Dollars are recuperating from recent losses, while Yen and Swiss Franc are consolidating their gains. There is a chance for Yen and Franc to surge further if risk aversion picks up momentum again.
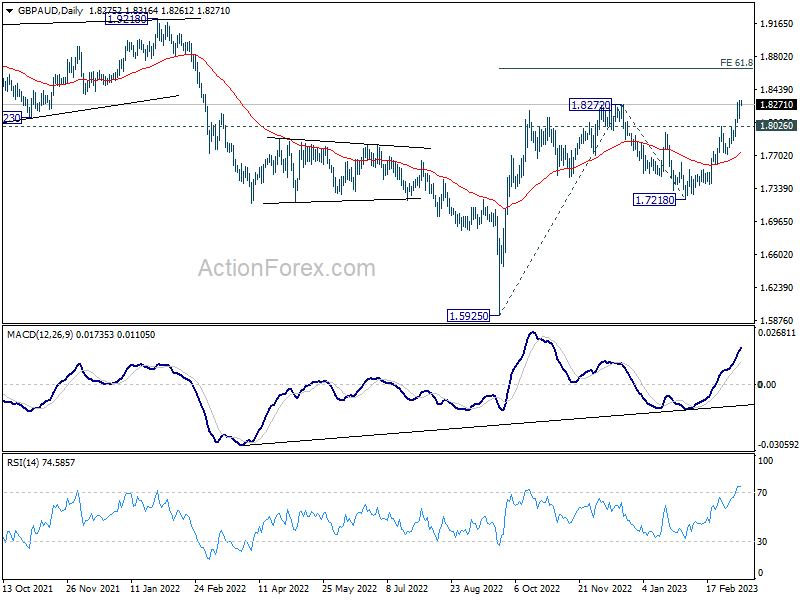
Technically, GBP/AUD is trying to resume the rally from 1.5925 since late last week, but couldn't get rid of 1.8272 resistance clearly yet. The next move would very much depend on how risk sentiment evolves. For now, further rise is expected as long as 1.8026 support holds. Next target is 61.8% projection of 1.5925 to 1.8272 from 1.7218 at 1.8668.
In Asia, at the time of writing, Nikkei is down -2.37%. Hong Kong HSI is down -2.11%. China Shanghai SSE is down -0.87%. Singapore Strait Times is down -0.22%. Japan 10-year JGB yield is down -0.0489 at 0.257. Overnight,DOW dropped -0.28%. S&P 500 dropped -0.15%. NASDAQ rose 0.45%. 10-year yield dropped -0.18 to 3.515.
US yield curve inversion unwinding quickly, imminent recession concerns
US Treasury yield has experienced a significant decline as funds continue to pour into bonds due to the collapse of Silicon Valley Bank. Overnight, the 2-year yield dropped by -0.585 to 4.030, after breaching the 4% handle. This is the worst one-day drop since the 2008 global financial crisis. The yield fell by nearly 100 basis points from Wednesday's 5.066, which was the most significant three-day decline since the 1987 market crash.
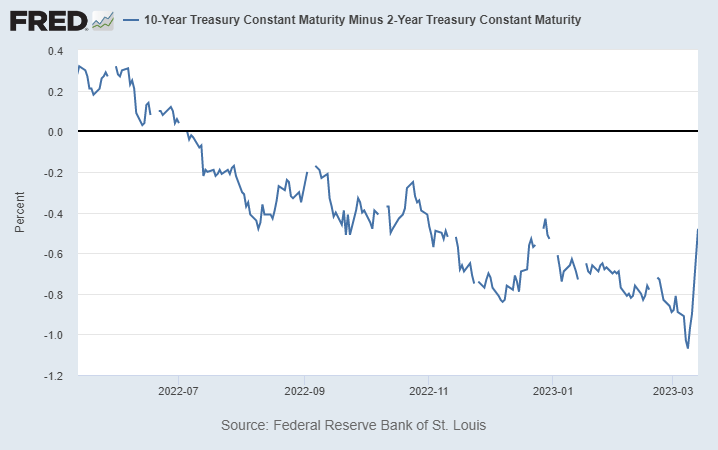
However, an even more critical development is the rapid unwinding of the yield curve inversion. Last week, the 10-year yield was more than 100 basis points below the 2-year yield. But now, it's around 50 basis points below. It's still too early to tell if the yield curve is normalizing, but recent history suggests that a recession in the US is imminent if that is the case.
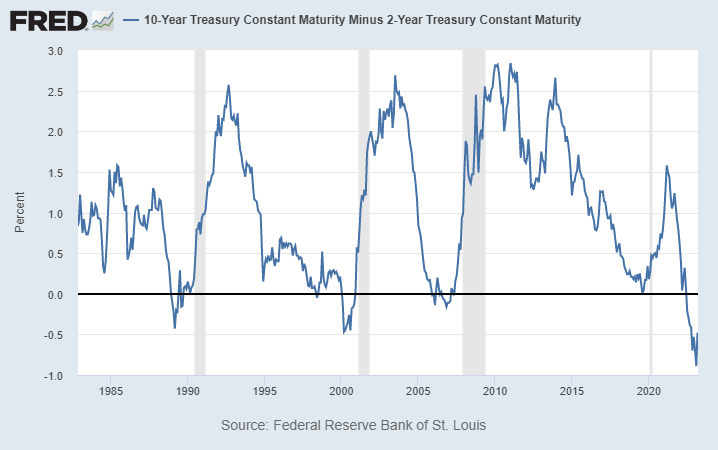
In the first example, for the 1988/90 inversion period, yield curve can be considered fully normalized in April 1990. Recession officially began in July 1990, three months later.
In the second example, for the 2000 inversion period, yield curve can be considered fully normalized in January 2001, and recession started in March 2001, three months later.
In the third example, for the 2006/2007 inversion period, yield curve can be considered fully normalized in June 2007. Recession officially started in December, six months later.
Australia Westpac consumer sentiment unchanged at 78.5, second sub-80 read in a row
Australia Westpac Consumer Sentiment Index was unchanged at 78.5 in March, a second month of extremely weak reading, near historical lows. Areas of most concern remain inflation, interest rates, and the economy.
Westpac noted that there were only one month of sub-80 reading during the COVID pandemic and the global financial crisis period. Runs of sub-80 have only been seen during the recession during the 1980s and 1990s.
Regarding RBA policy, Westpac will wait after release of data on employment, inflation, spending, and confidence, before deciding to change the expectation of a 25bps hike in April. But Westpac maintained the forecast of another 25bps hike in May.
Australia NAB business confidence fell to -4, conditions down to 17
Australia NAB Business Confidence dropped sharply from 6 to -4 in February. Business Conditions dropped from 18 to 17. Looking at some details, trading conditions were unchanged at 27. Profitability conditions dropped from 18 to 14. Employment conditions rose from 11 to 12.
"Overall, the survey confirms the ongoing resilience of the economy through the first months of 2023, though we continue to expect a more material slowdown in demand later in the year when the full effect of rate rises has passed through," said NAB.
Looking ahead
UK employment data will be the main focus in European session while Swiss will release PPI and Italy will release industrial output.
Later in the day, US CPI will take center stage. Canada will publish manufacturing sales.
GBP/USD Daily Outlook
Daily Pivots: (S1) 1.2087; (P) 1.2143; (R1) 1.2240; More...
Intraday bias in GBP/USD remains on the upside as rise from 1.1801 is extending. As noted before, the corrective pattern from 1.2445 should have completed with three waves to 1.1801. Further rally should be seen to retest 1.2445/6 resistance zone next. On the downside, below 1.2045 minor support will delay the bullish case and turn intraday bias neutral first.
In the bigger picture, price action from 1.2445 are seen as a corrective pattern to rise from 1.0351 medium term bottom (2022 low). Resumption is expected as a later stage and firm break of 1.2446 will target 61.8% retracement of 1.4248 (2021 high) to 1.0351 at 1.2759. This will remain the favored case as long as 38.2% retracement of 1.0351 to 1.2445 at 1.1645 holds.
Economic Indicators Update
| GMT | Ccy | Events | Actual | Forecast | Previous | Revised |
|---|---|---|---|---|---|---|
| 23:30 | AUD | Westpac Consumer Confidence Mar | 0.00% | -6.90% | ||
| 00:30 | AUD | NAB Business Conditions Feb | 17 | 18 | ||
| 00:30 | AUD | NAB Business Confidence Feb | -4 | 6 | ||
| 07:00 | GBP | Claimant Count Change Feb | -12.4K | -12.9K | ||
| 07:00 | GBP | ILO Unemployment Rate (3M) Jan | 3.80% | 3.70% | ||
| 07:00 | GBP | Average Earnings Excluding Bonus 3M/Y Jan | 6.60% | 6.70% | ||
| 07:00 | GBP | Average Earnings Including Bonus 3M/Y Jan | 5.70% | 5.90% | ||
| 07:30 | CHF | Producer and Import Prices M/M Feb | 0.50% | 0.70% | ||
| 07:30 | CHF | Producer and Import Prices Y/Y Feb | 3.40% | 3.30% | ||
| 09:00 | EUR | Italy Industrial Output M/M Jan | -0.40% | 1.60% | ||
| 11:00 | USD | NFIB Business Optimism Index Feb | 91.2 | 90.3 | ||
| 12:30 | CAD | Manufacturing Sales M/M Jan | -0.40% | -1.50% | ||
| 12:30 | USD | CPI M/M Feb | 0.40% | 0.50% | ||
| 12:30 | USD | CPI Y/Y Feb | 6.00% | 6.40% | ||
| 12:30 | USD | CPI Core M/M Feb | 0.40% | 0.40% | ||
| 12:30 | USD | CPI Core Y/Y Feb | 5.50% | 5.60% |
Technical Outlook and Review
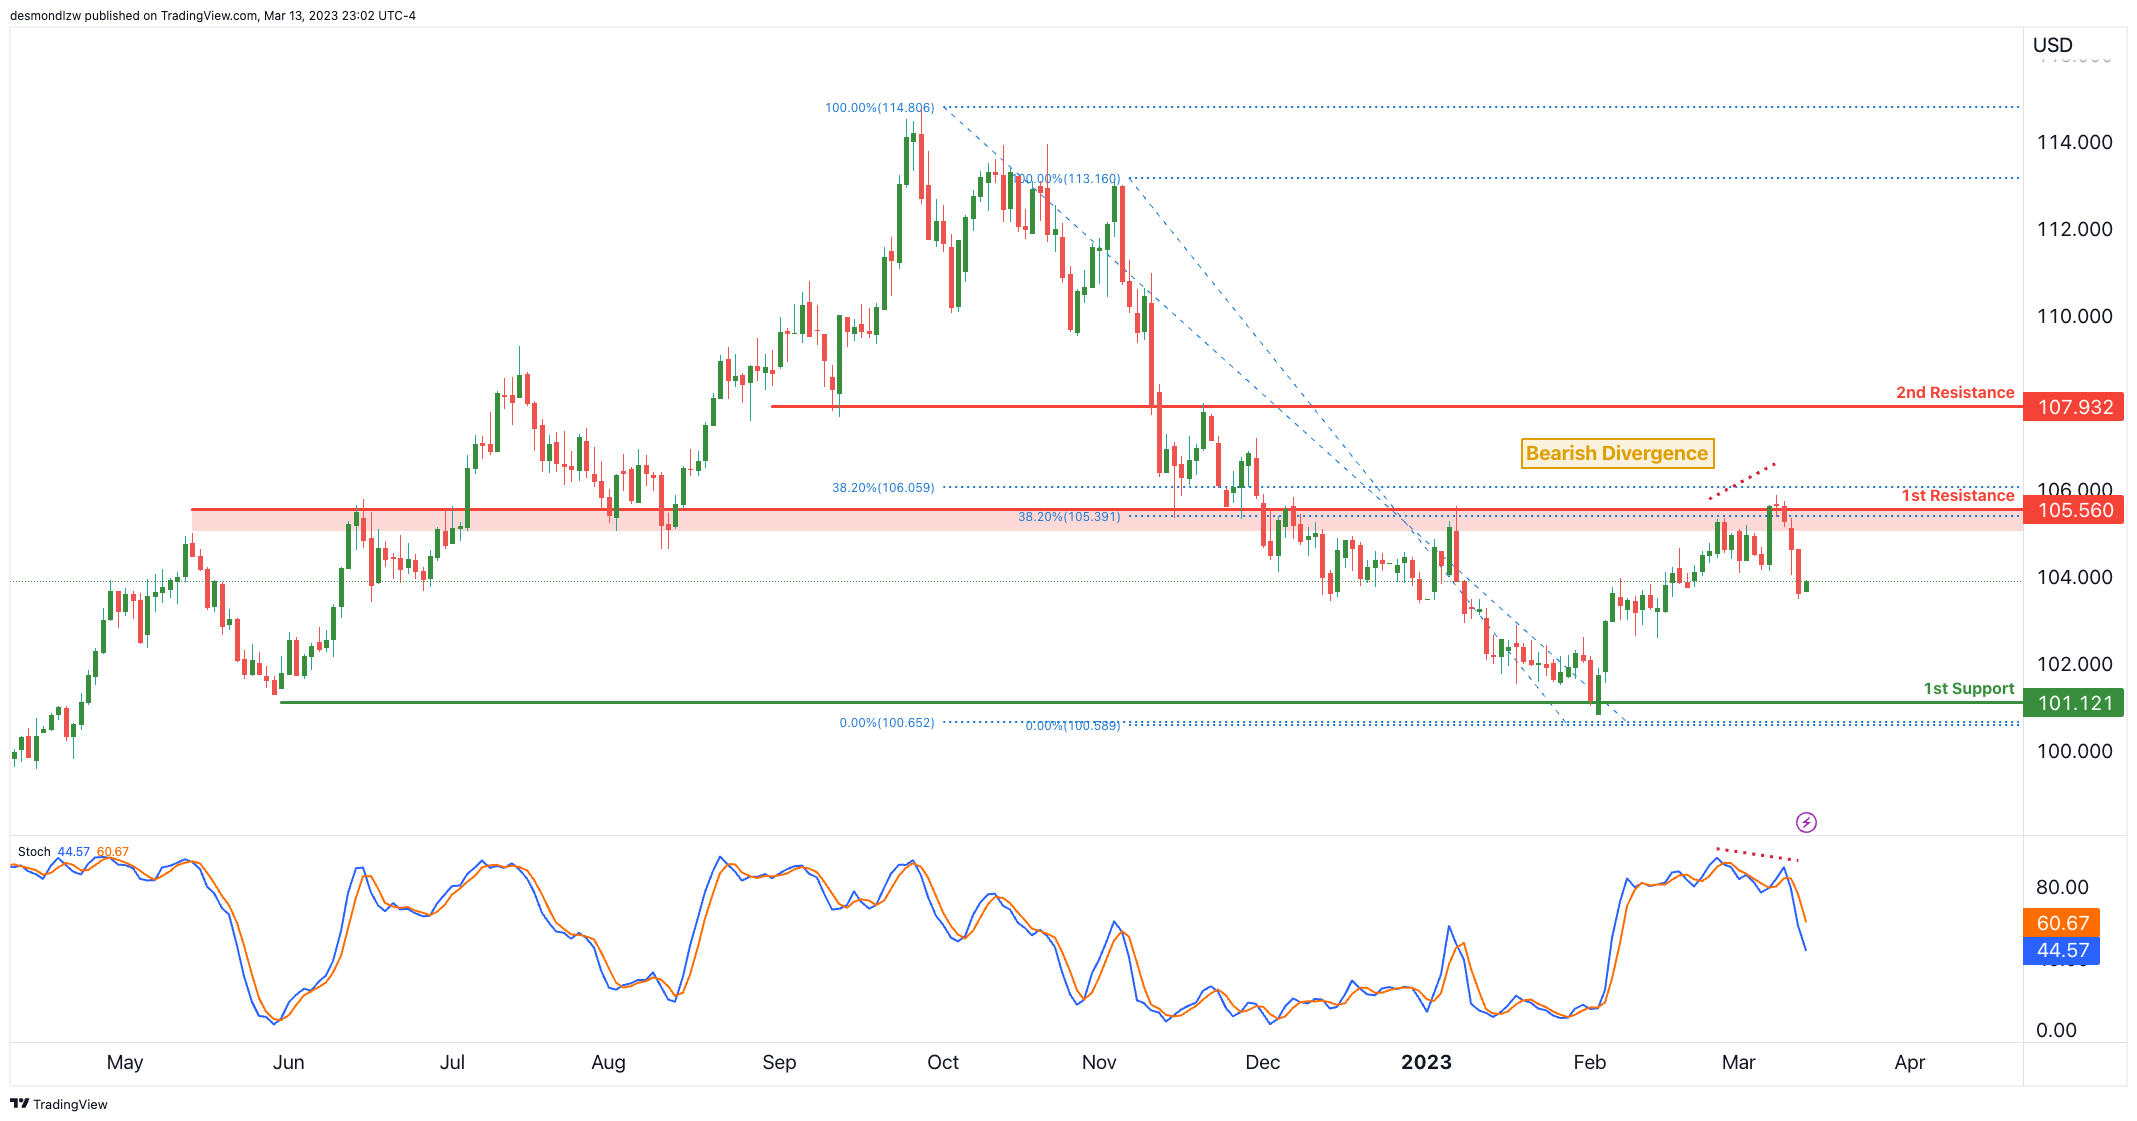
DXY:
Price has started to reverse from our 1st resistance at 105.56 really nicely and has also started to form a bearish divergence vs Stochastic. We could see a reversal from this level to push prices all the way down to 1st support which is a multi-swing low support.
Stochastic is also reversing from an overbought zone with significant downside potential.
EUR/USD:
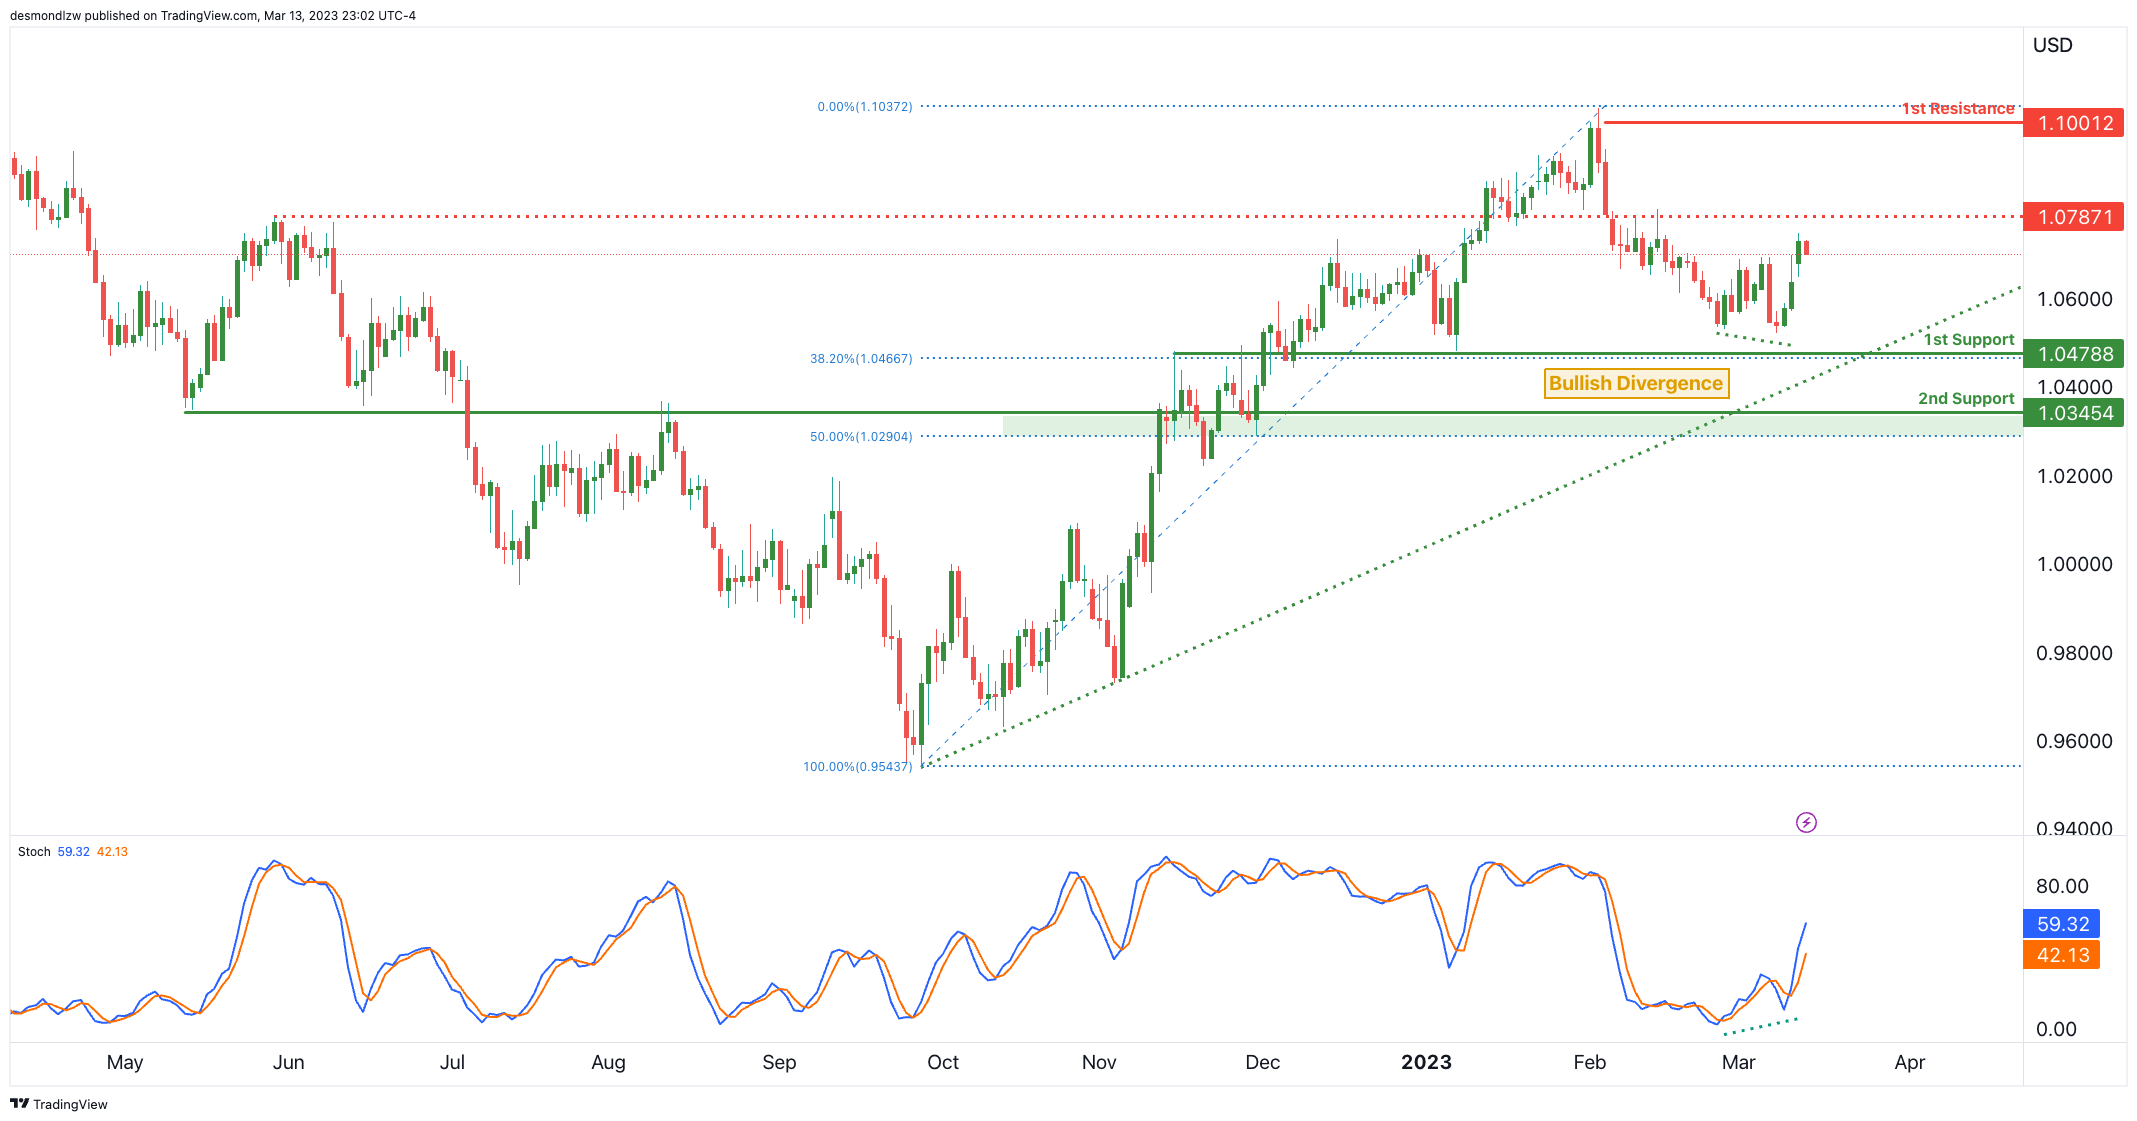
Price has started to bounce nicely off 1st support and at the same time, is displaying bullish divergence vs Stochastic suggesting that there might be a further move up. We see an ascending trend line suggesting there’s a bit more bullish momentum for EURUSD.
In terms of resistance, there is an intermediate resistance at the 1.0787 level where price needs to break past to trigger a further move to 1.1000 level which is a swing high resistance and big figure.
GBP/USD:
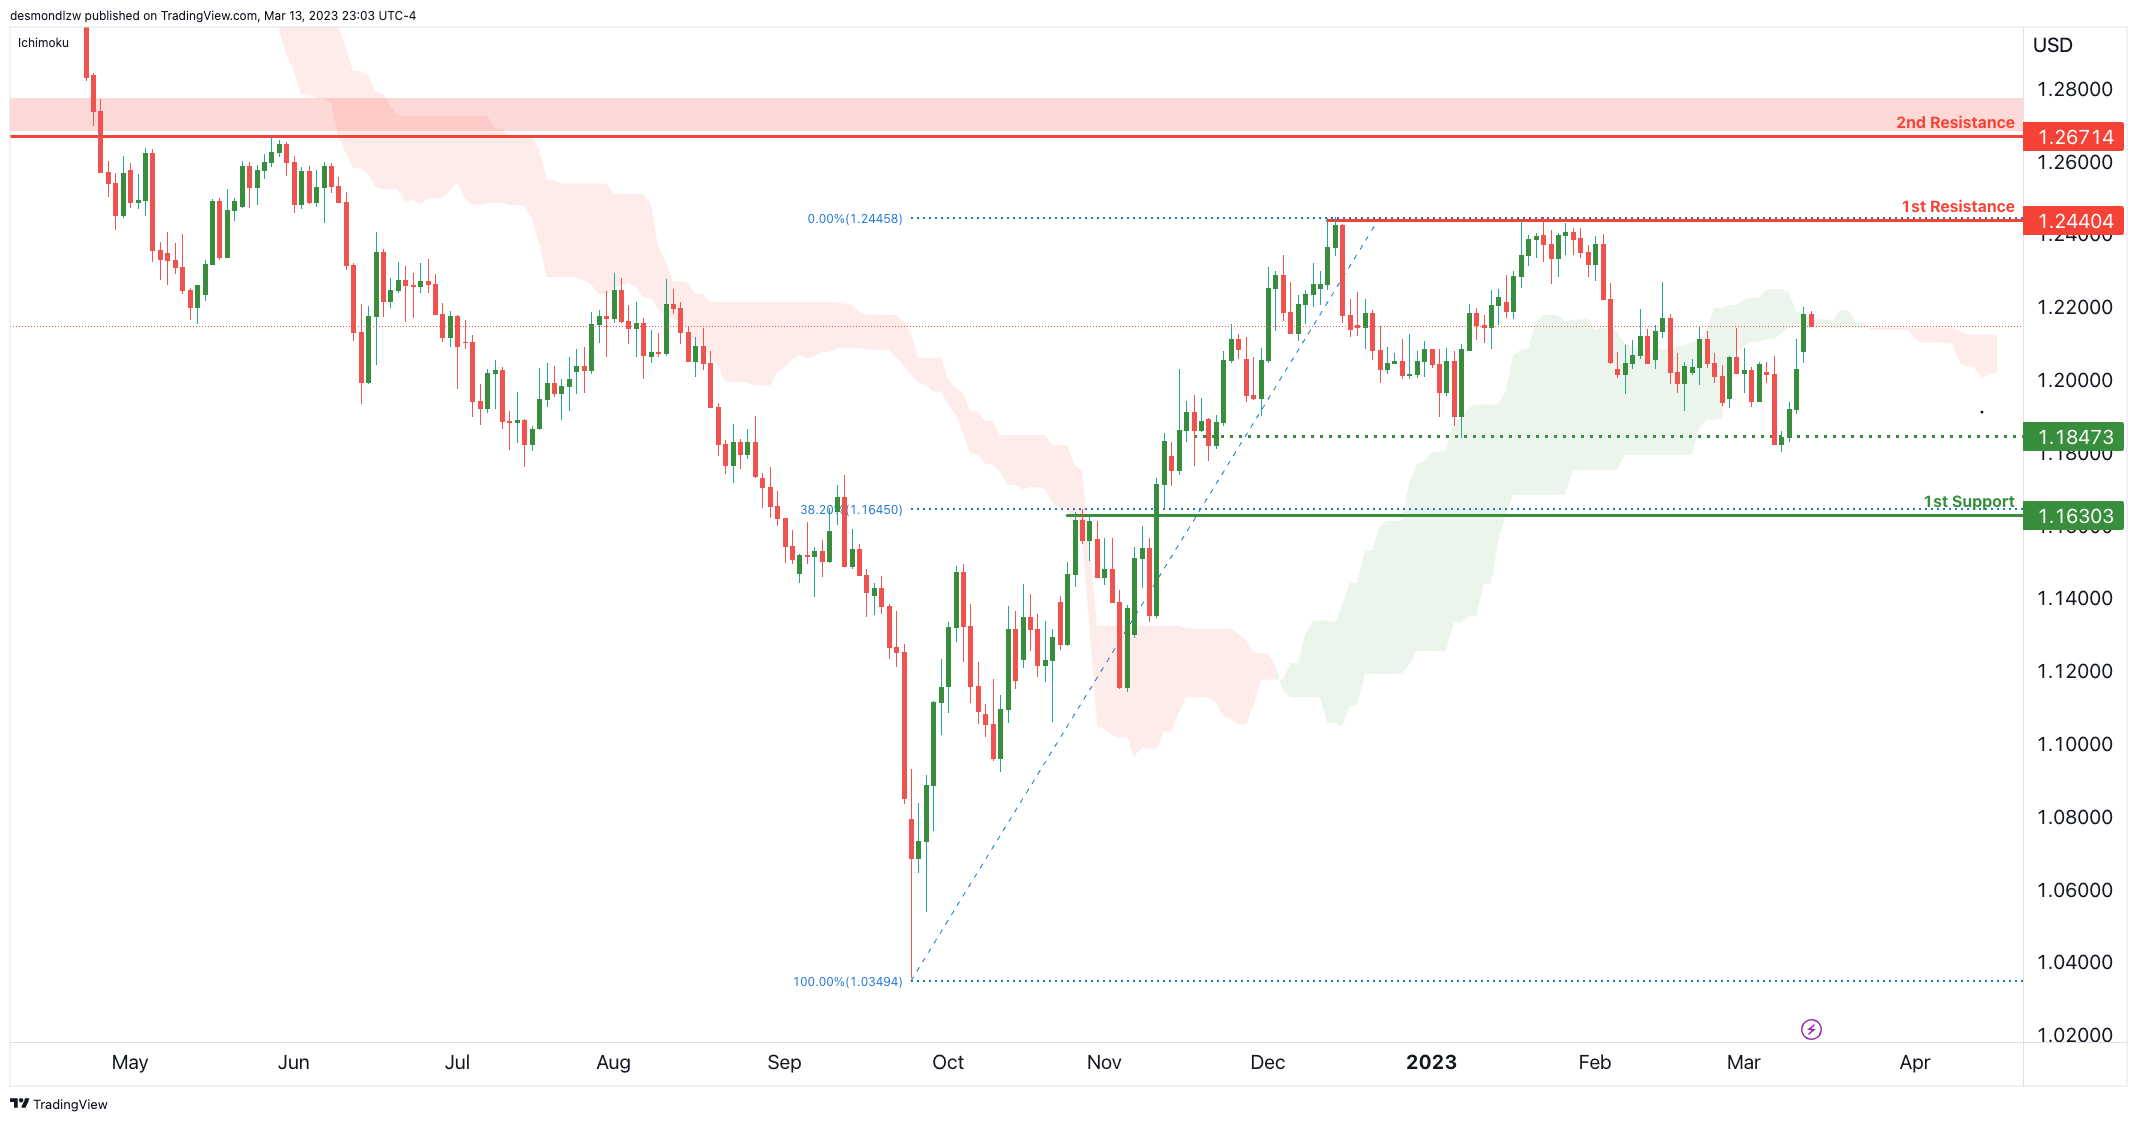
Price continues to hold well above our intermediate support at 1.1847 which needs to be broken to trigger a double top reversal. It has also crossed below the Ichimoku cloud suggesting there might be more bearishness in this move.
1st resistance remains at 1.2440 which is a multi-swing high resistance level that price needs to break past to reach the 2nd long-tern resistance at 1.2671.
USD/CHF:
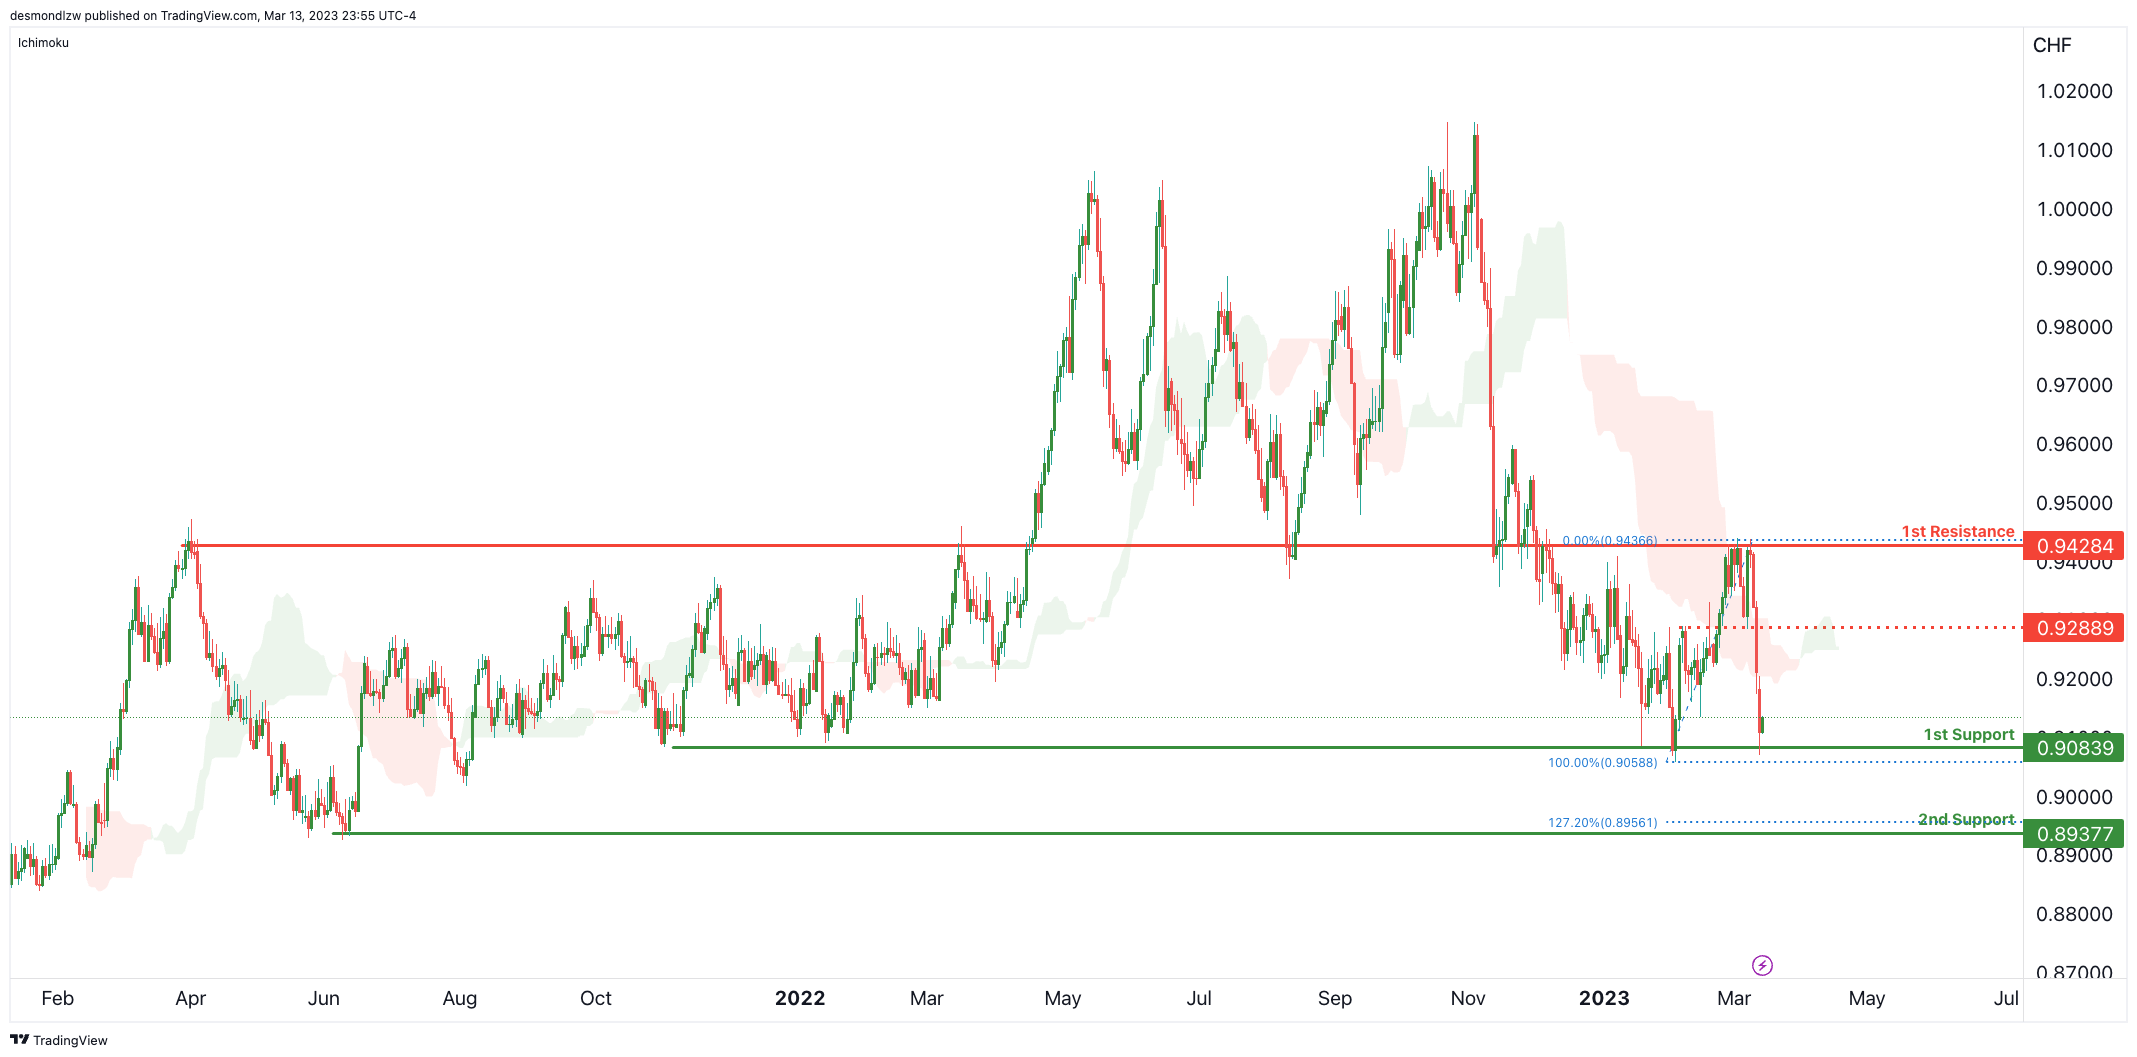
Price has dropped really nicely from our forecasted 1st resistance at 0.9428 previously and is back at major support at 0.9083 which is a multi-swing low support. It’s worth noting that price has also dropped below the Ichimoku cloud suggesting a bit more bearishness.
Price needs to brak the 1st support to trigger the next move down to 2nd support at 0.8937 which is a major swing low support from June 2021.
USD/JPY:
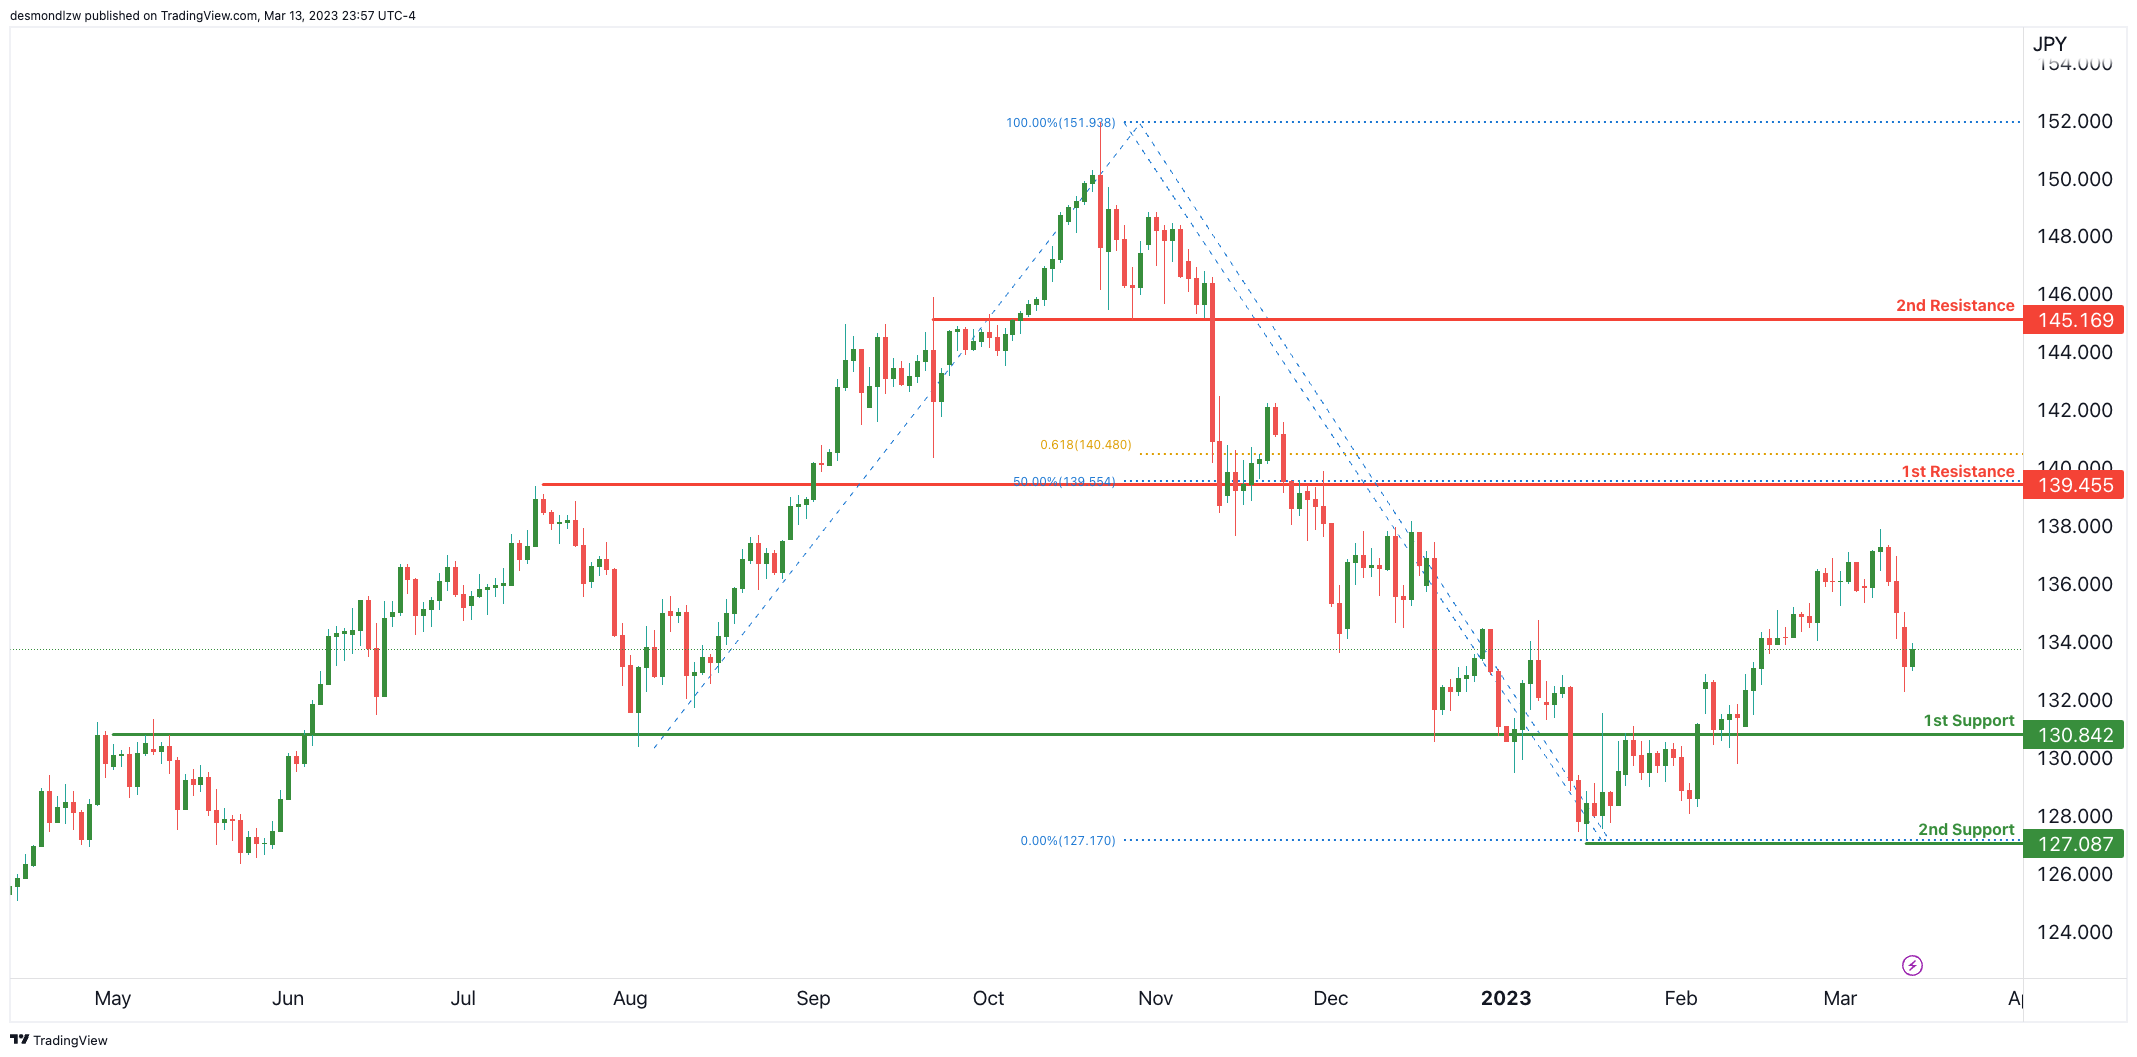
Price has dropped strongly and is fast approaching a major overlap support at 130.84. This level needs to be broken to trigger a drop to 2nd support at 127.08 which is the recent major swing low support.
In terms of resistance, there’s 1st resistance at 139.45 which is an overlap resistance and a 50% Fibonacci retracement along with a 61.8% Fibonacci projection.
AUD/USD:
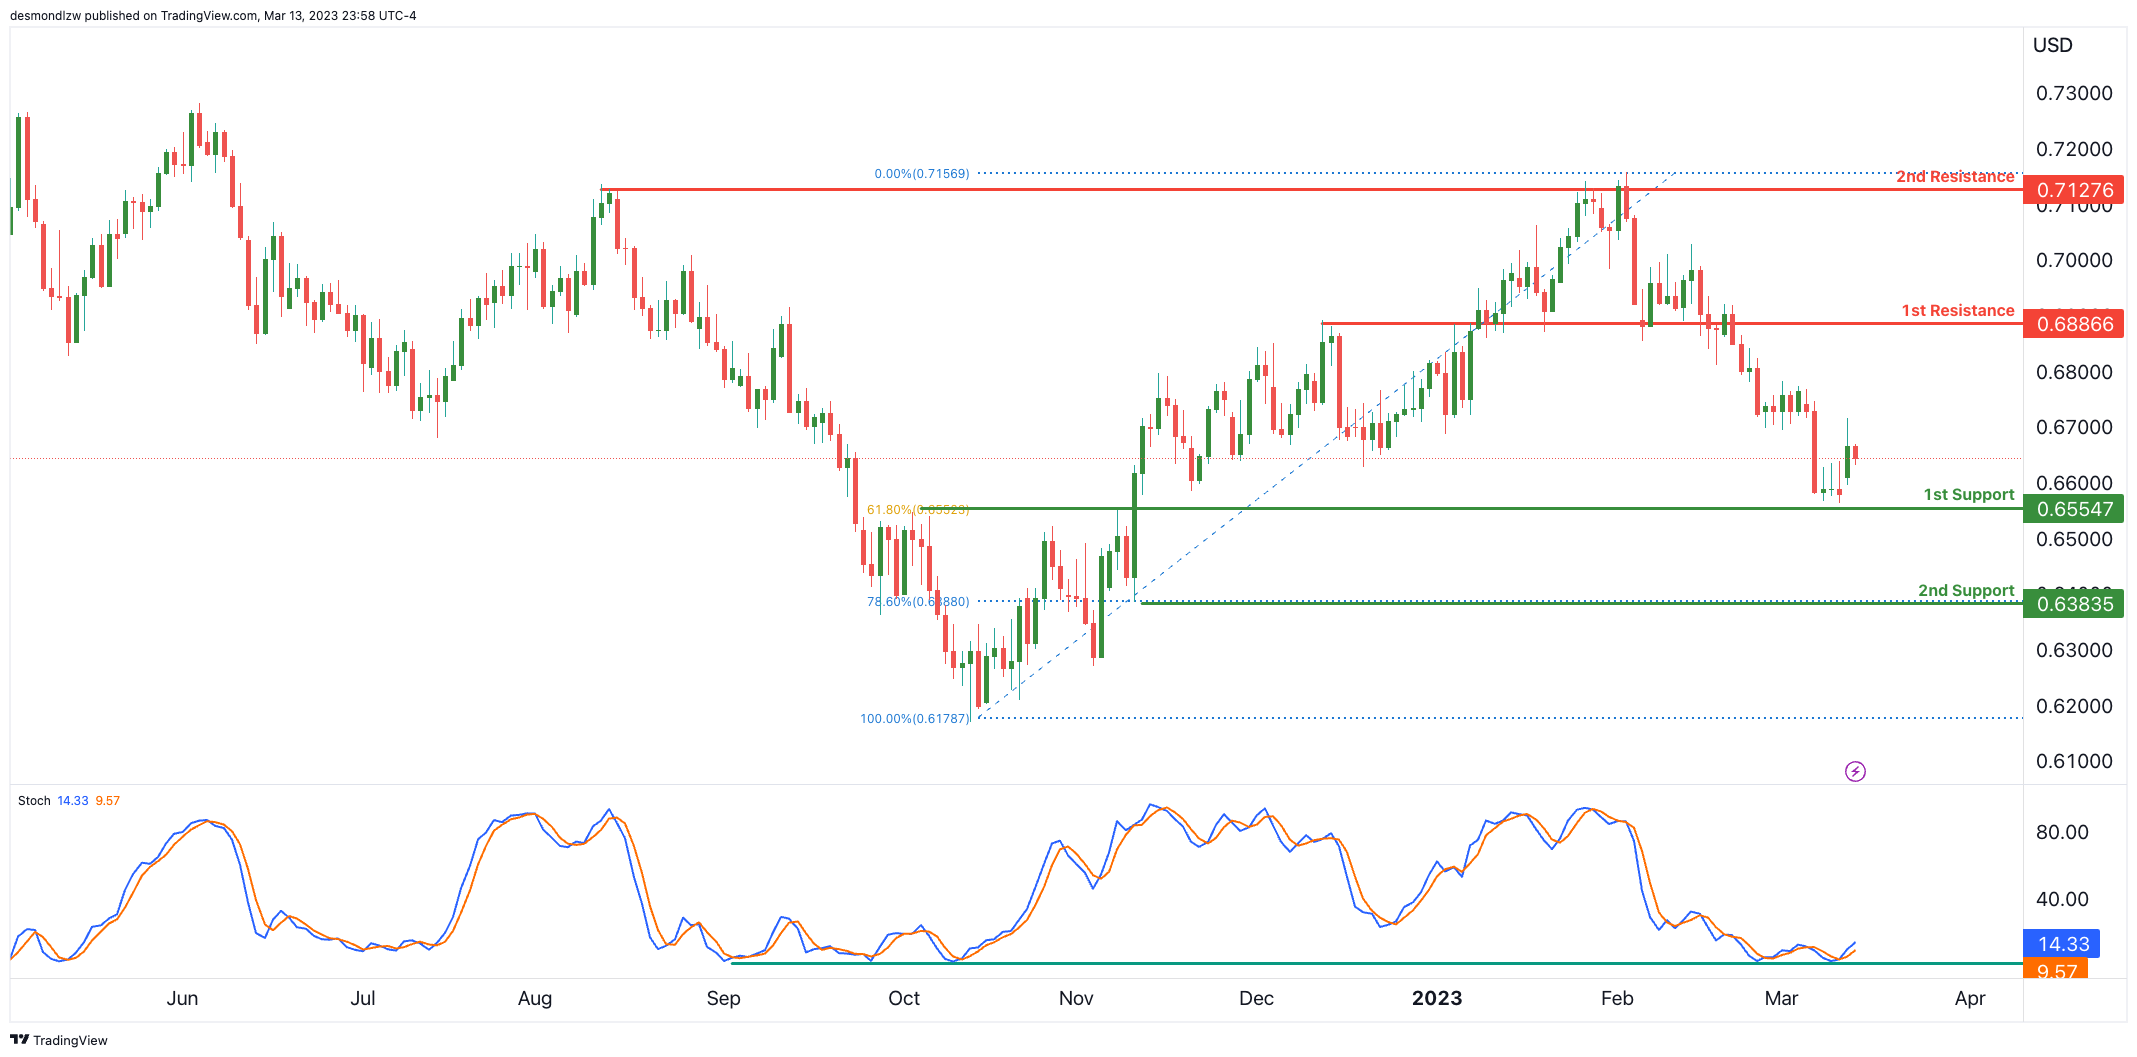
Price is lingering above our 1st support area at 0.6554 which lines up the 61.8% Fibonacci retracement, if price were to break through it, the next key support level would be at 0.6383, which is another overlap support that lines up with the 78.6% Fibonacci retracement.
Regarding resistance levels, the 1st resistance is at 0.6886 which is a strong Overlap resistance, and the 2nd resistance is at 0.7127 which is a multi-swing high resistance level.
It’s worth noting that Stochastic is right on major support and could suggest a bounce is coming soon.
NZD/USD:
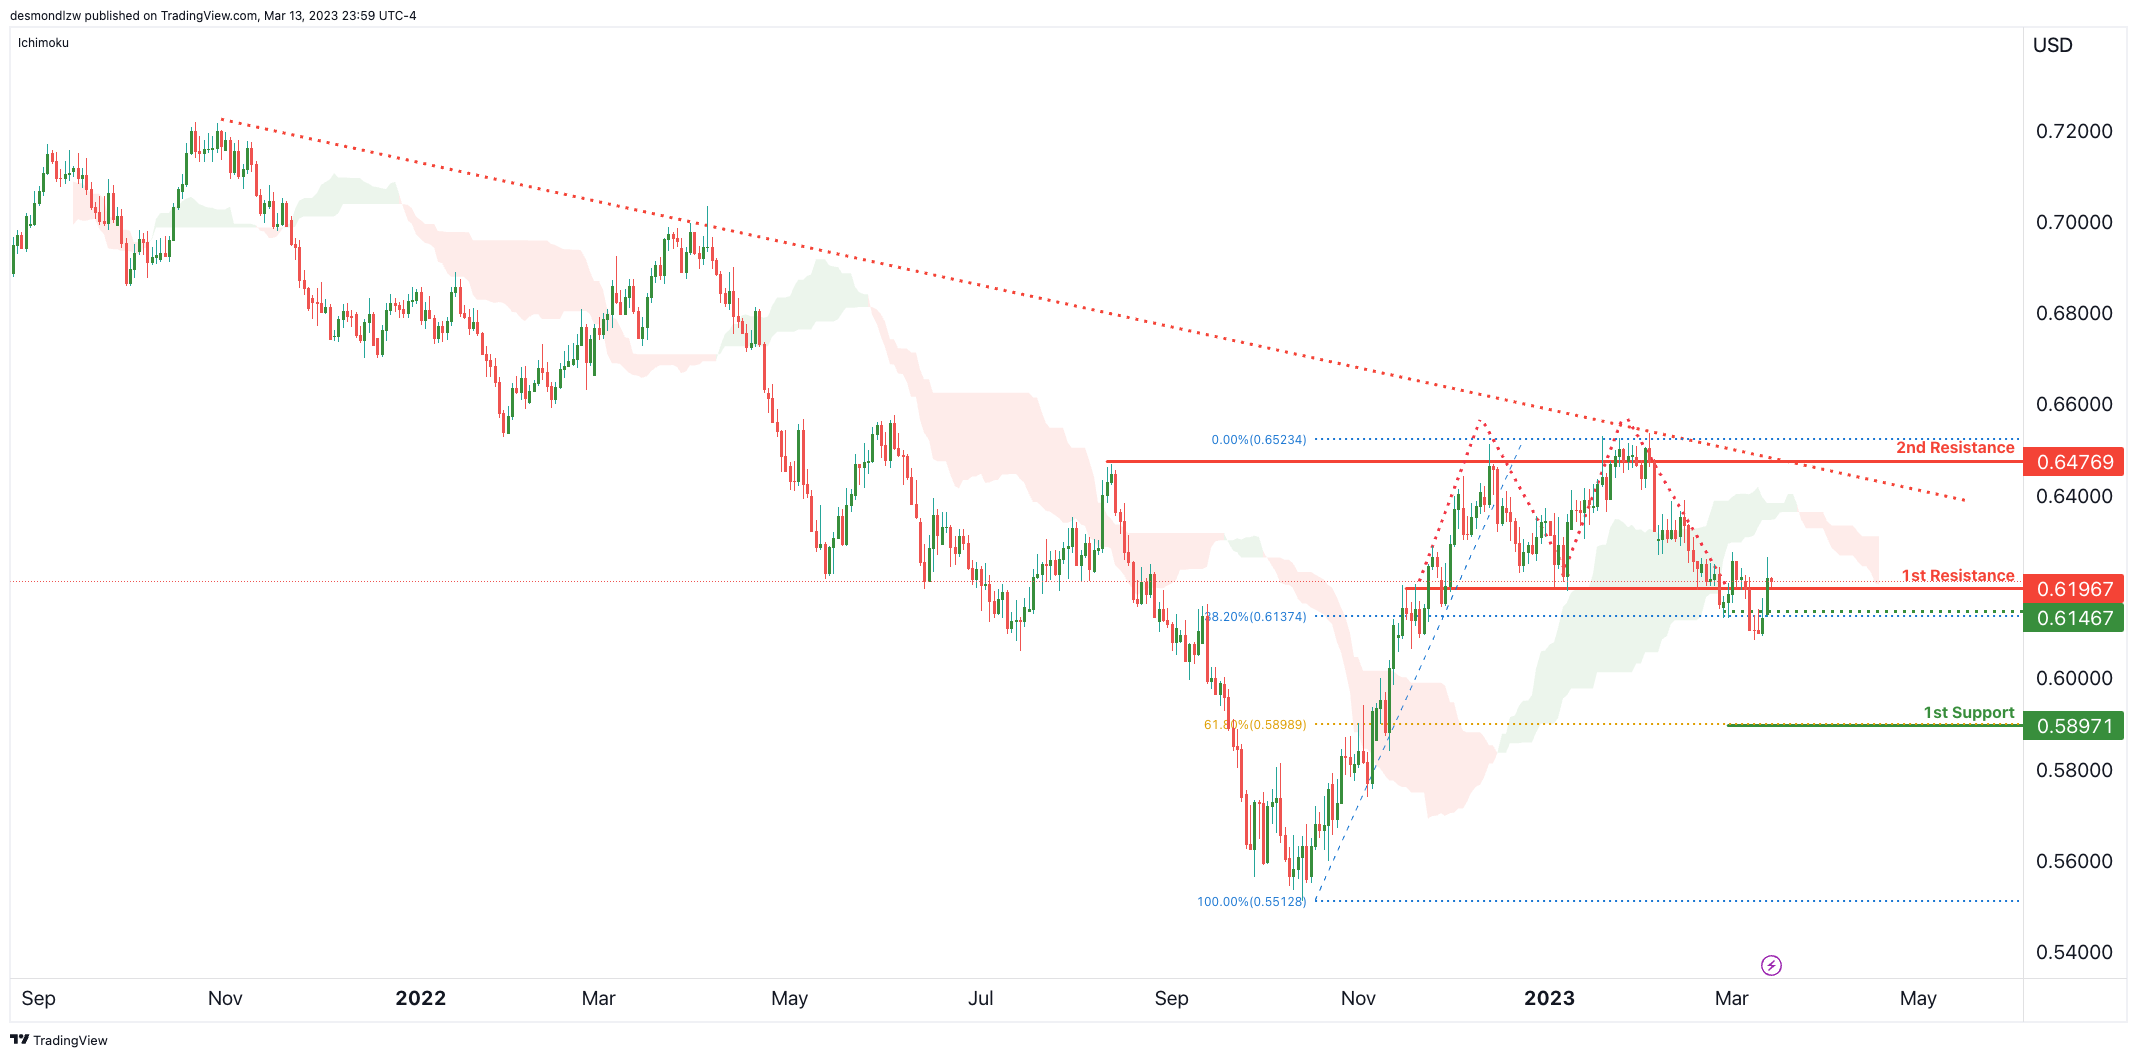
Price is seeing a long term descending resistance line push prices lower and a cross below the Ichimoku cloud + double top breakout level suggests further bearishness might be on the cards. If prie is able to break the 38.2% Fibonacci retracement at 0.6137, we could see a further move down to 1st support at 0.5897.
USD/CAD:
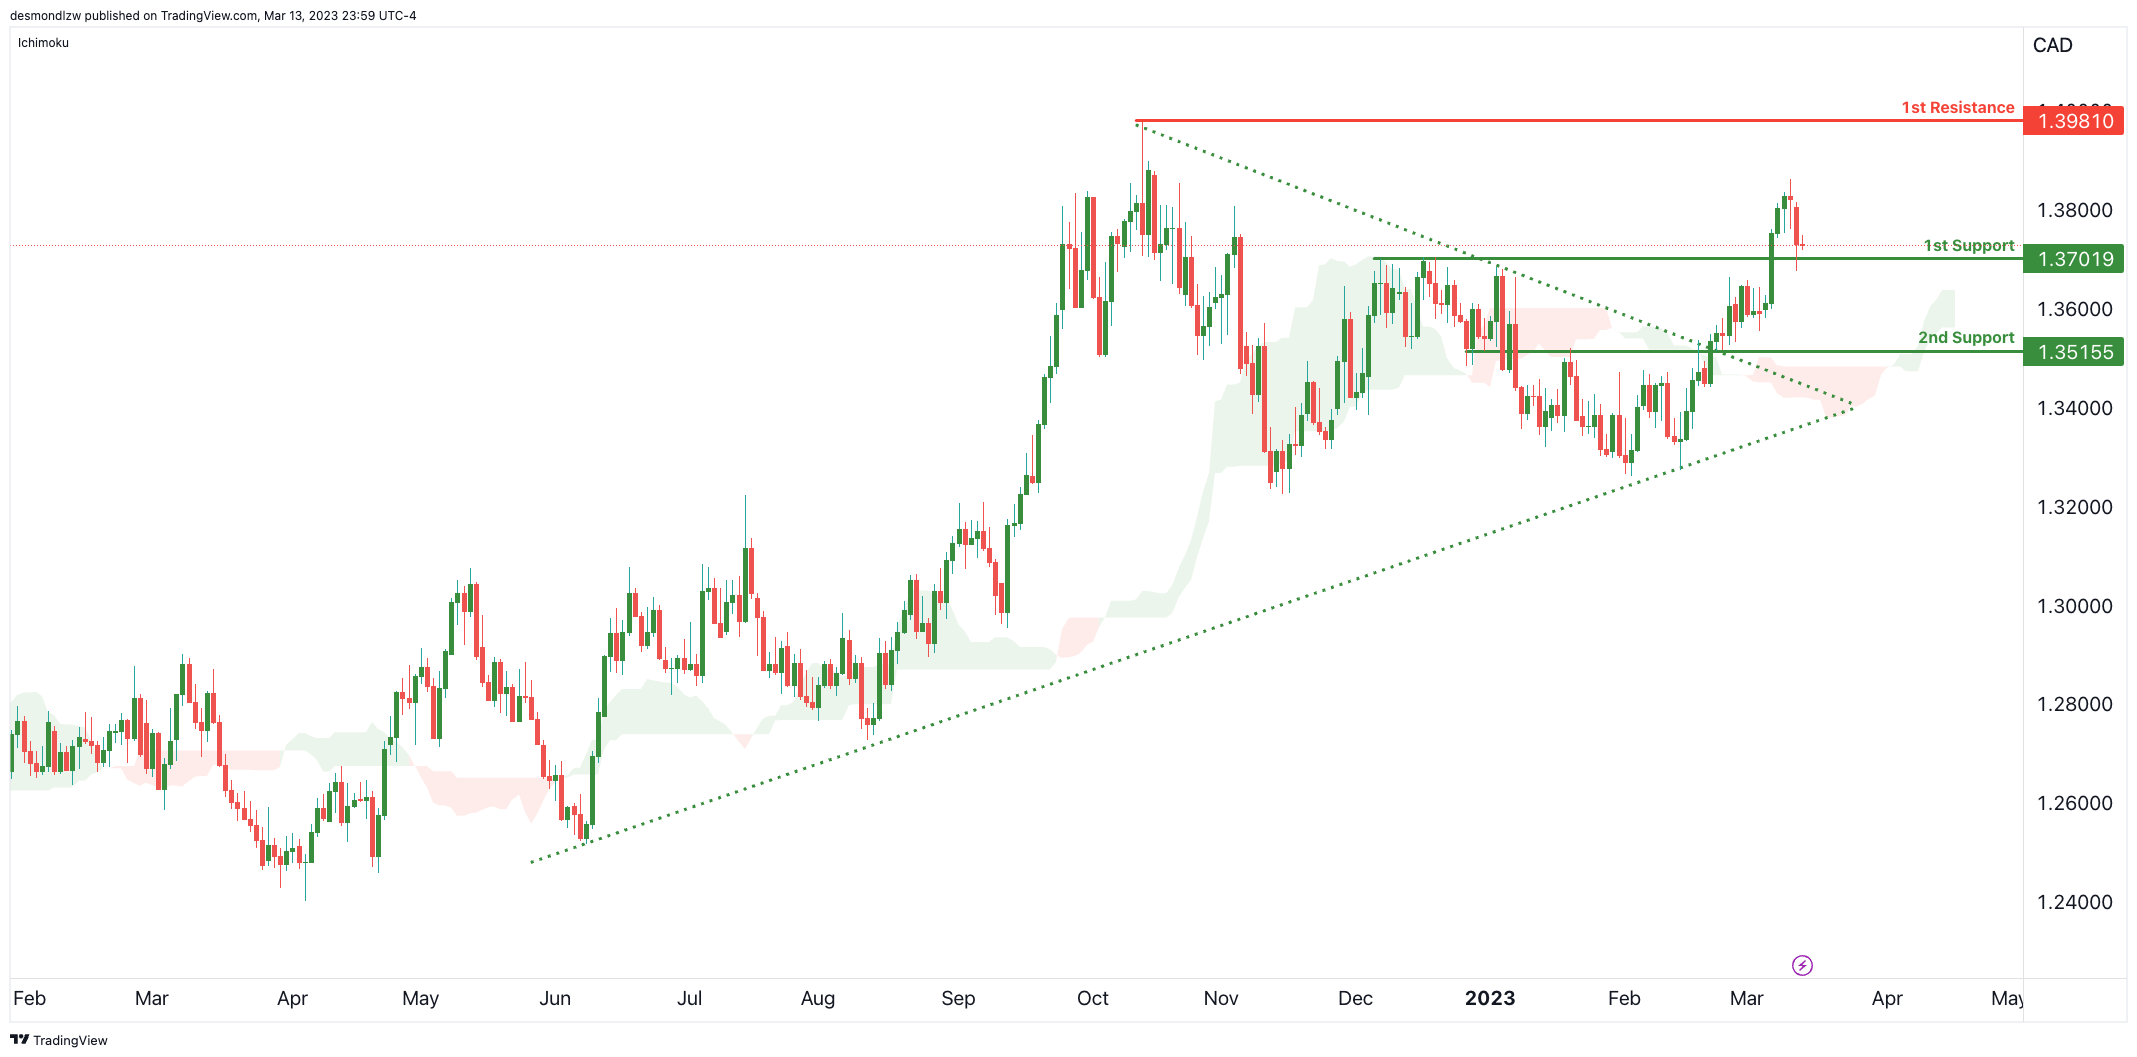
Price is back on major support at 1.3701 which is a pullback support. The ascending support line continues to hold prices up suggesting a further push up to 1st resistance at 1.3981 which is the major swing high resistance.
If price were to break the 1st support level, we could see a drop to 2nd support at 1.3515 which is the short term overlap support.
DJ30:
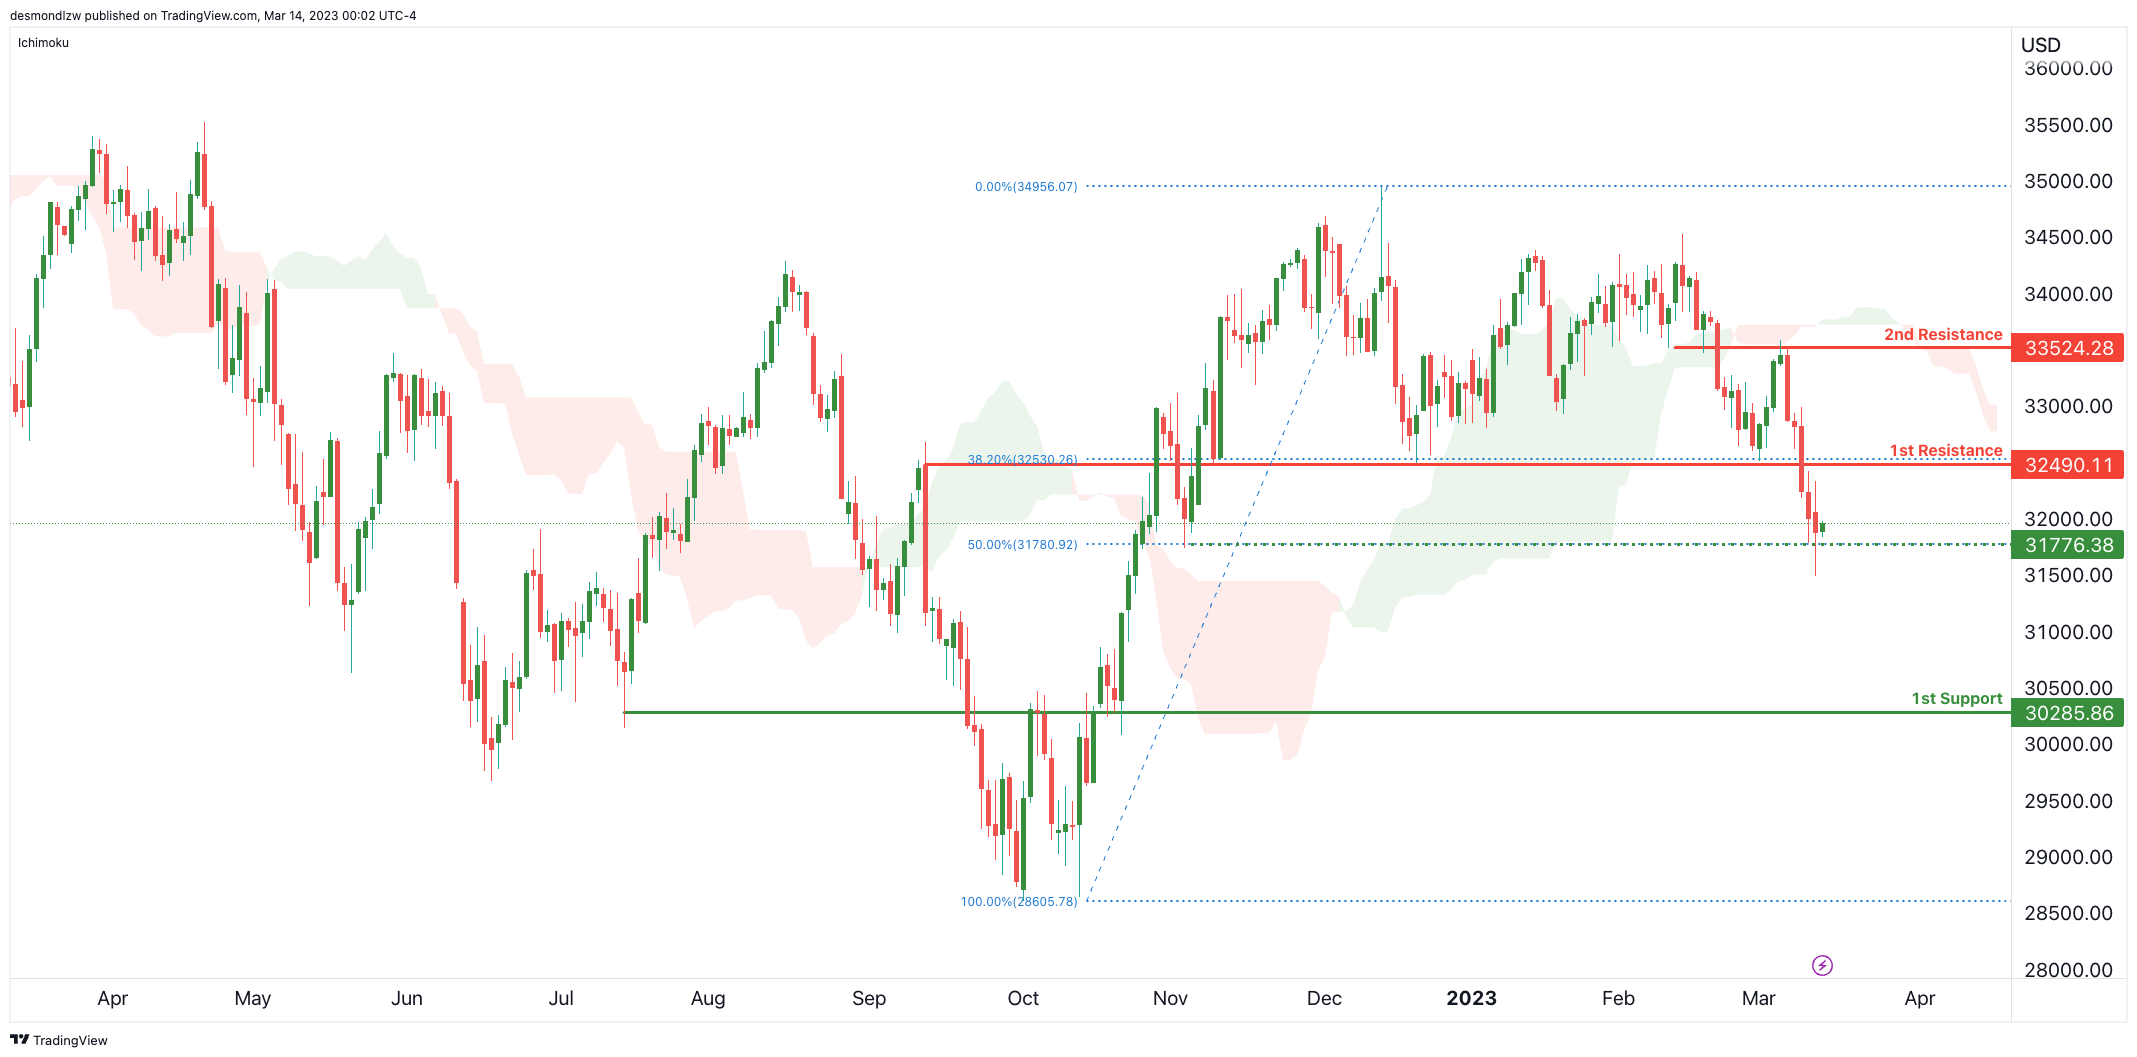
Price has broken the 1st support-turned-resistance at 32490 which has triggered a sort of double-top reversal – suggesting that prices might drop strongly towards the 30285 level. However, there’s an intermediate support level down at 31776 which is a small swing low + 50% Fibonacci retracement. This level needs to be broken to trigger a potential bigger move down.
GER30:
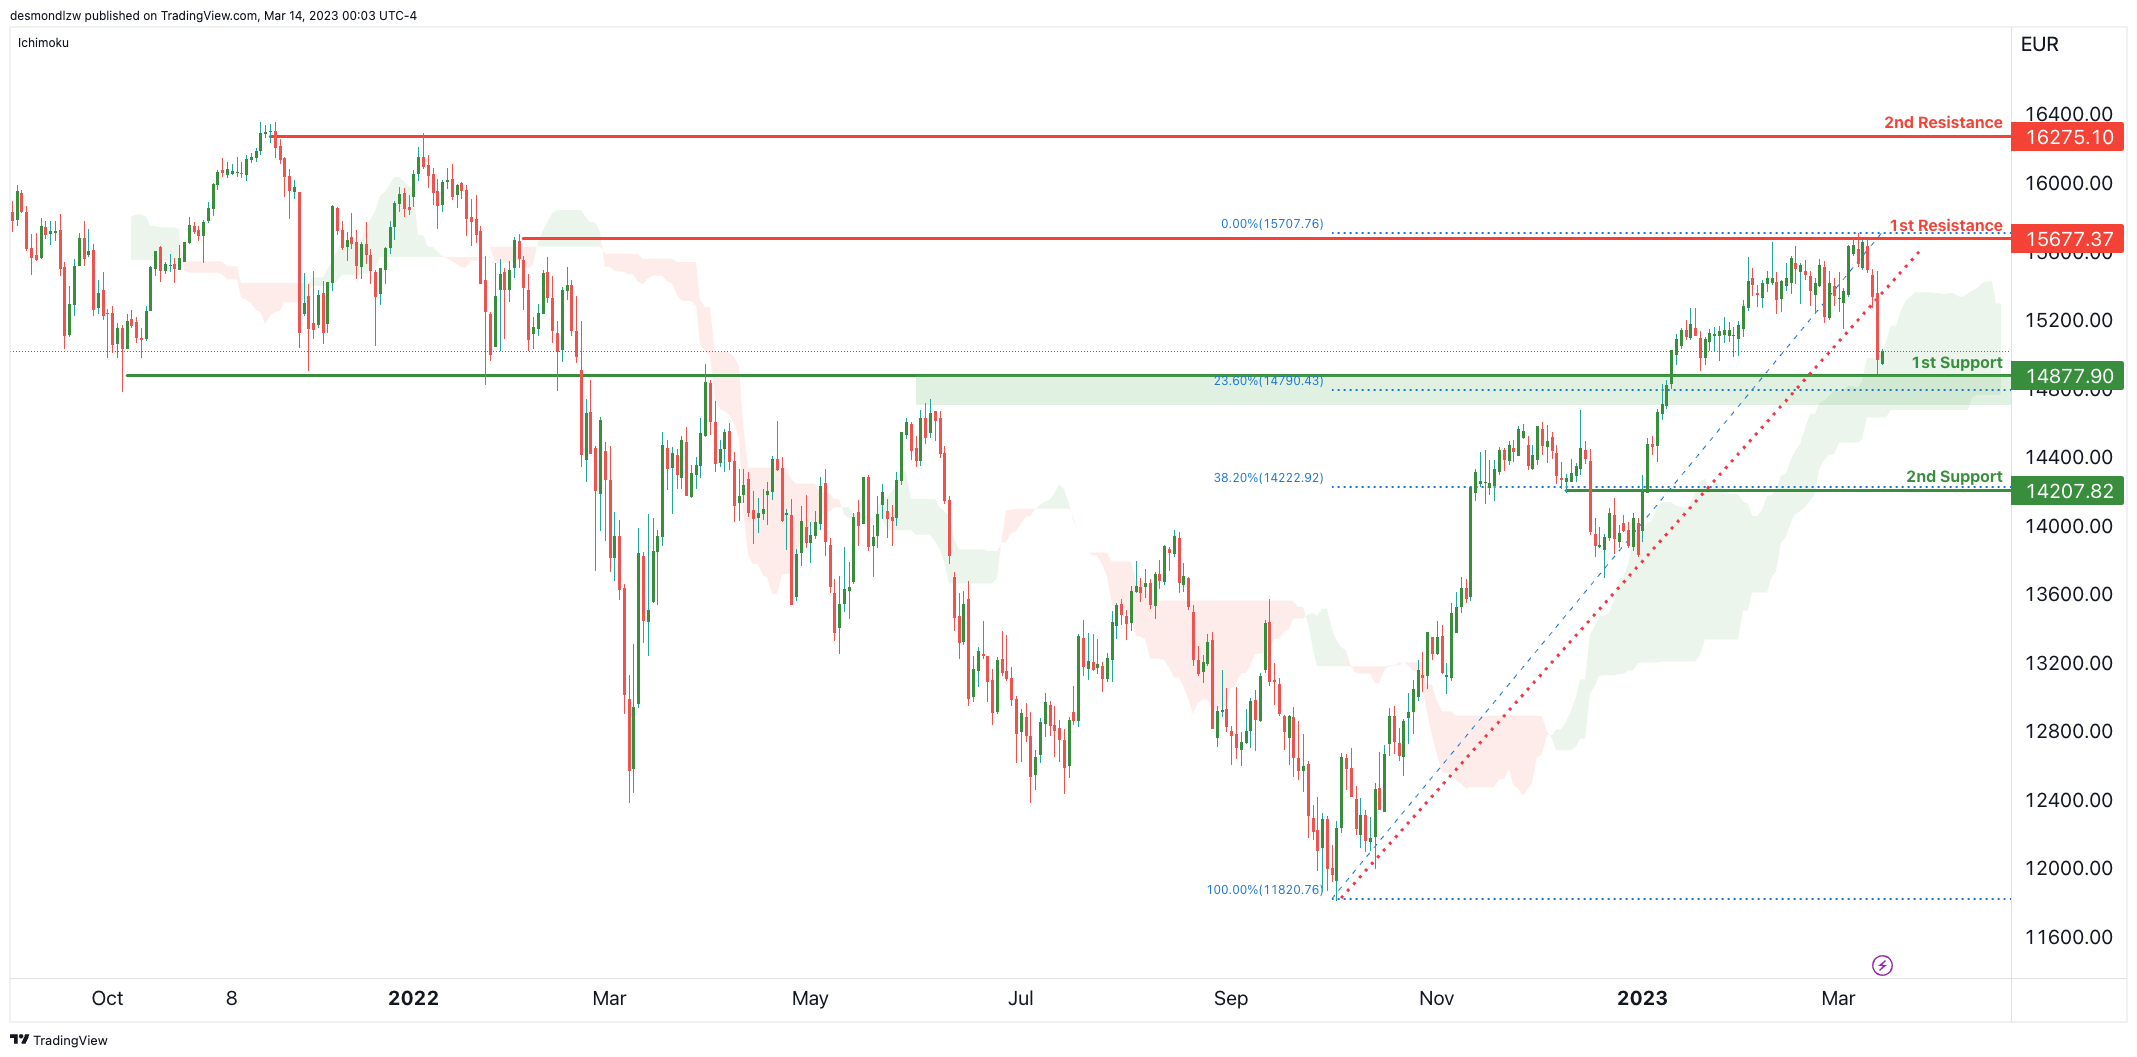
Price has broken a long term ascending support line that stretches back to October 2022. However, it is currently being held up by the 1st support at 14877 which is an overlap support and a 23.6% Fibonacci retracement – along with that, there is a strong bullish Ichimoku cloud that is holding prices up too.
Price would need to break the 14877 area to potentially trigger a move down to 2nd support at 14207 which is the 38.2% Fibonacci retracement and a small overlap support.
BTC/USD:
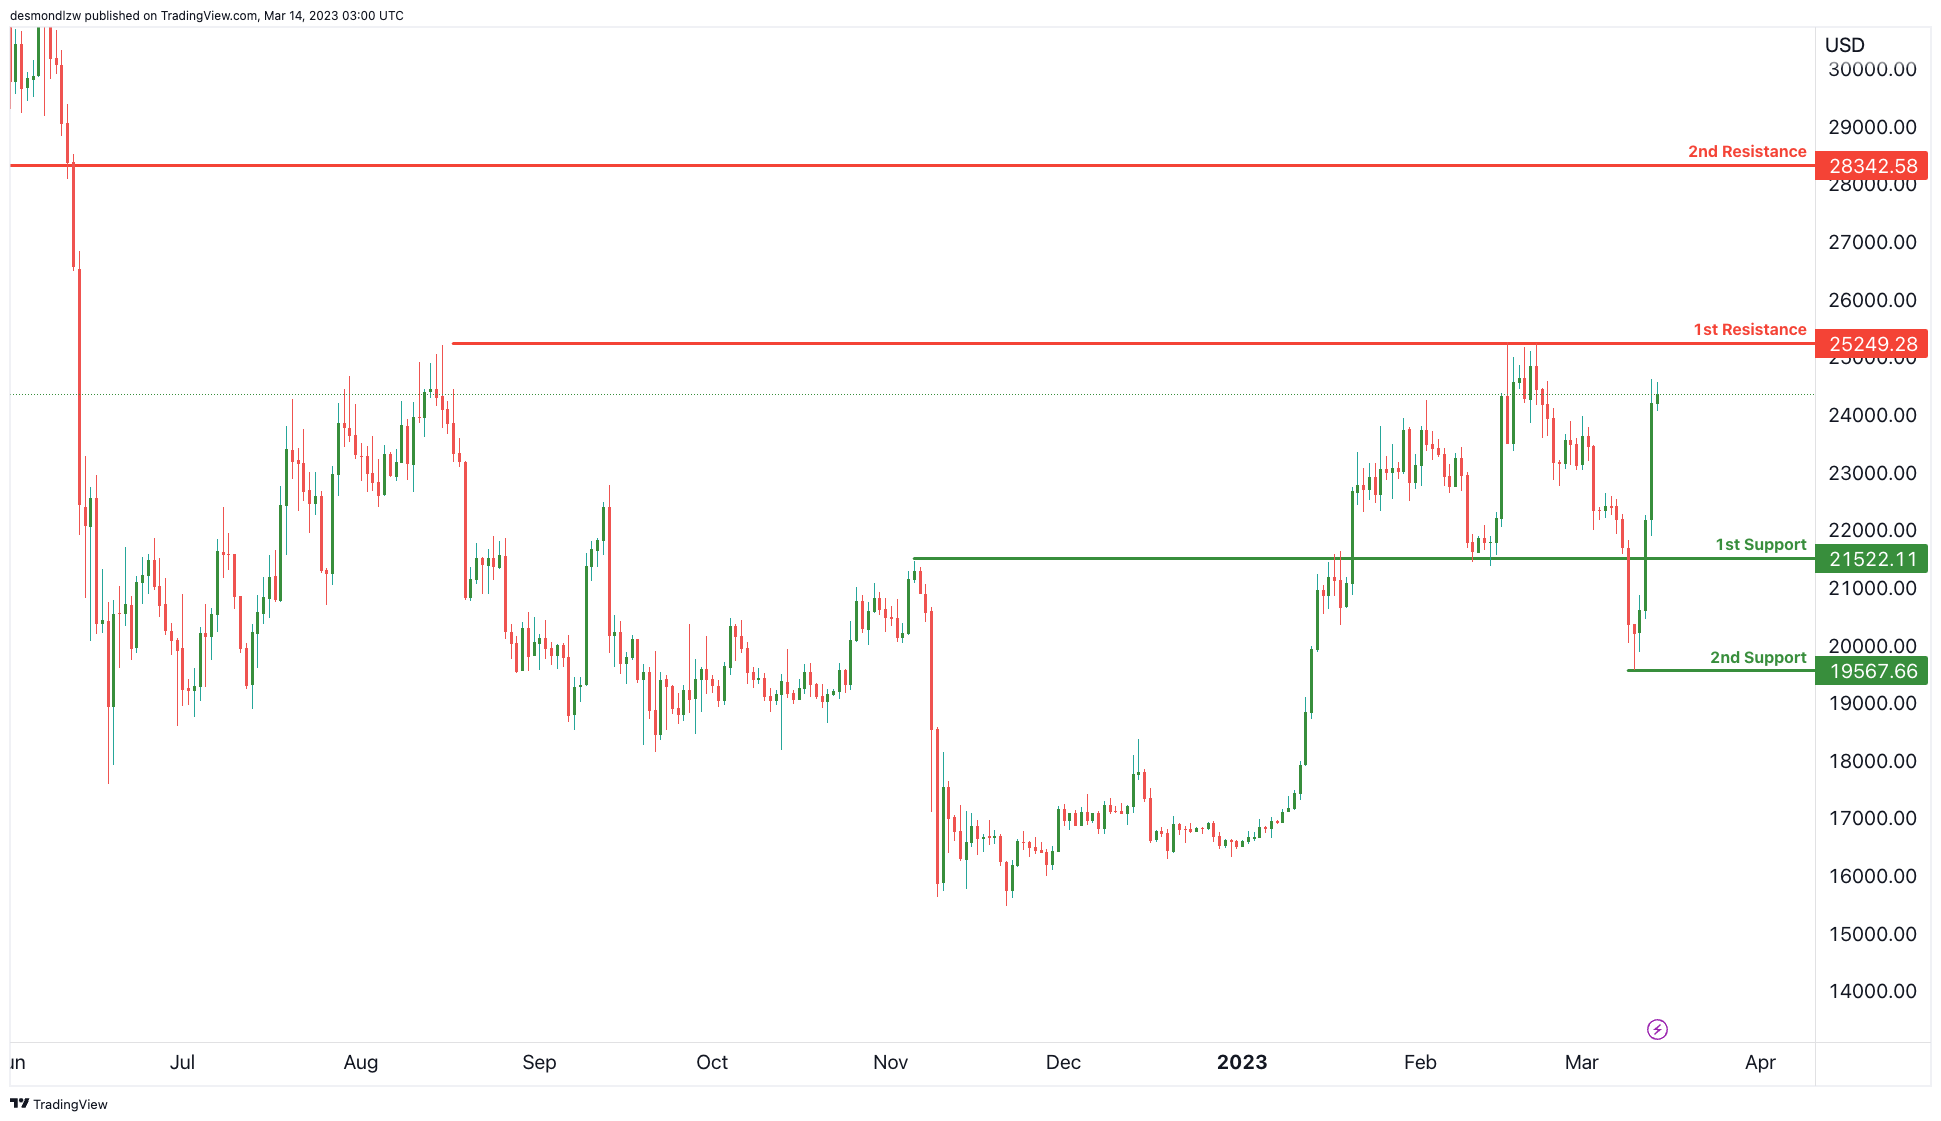
Price is approaching our 1st resistance at 25249 which is a multi-swing high resistance. If price were to break that level, the next big resistance is at 28342 which is a major overlap resistance and Fibonacci retracement.
In terms of support, the first support is at 21522 which is an overlap support that price recently broke. A break of that level would then suggest a move down to 19567.
US500
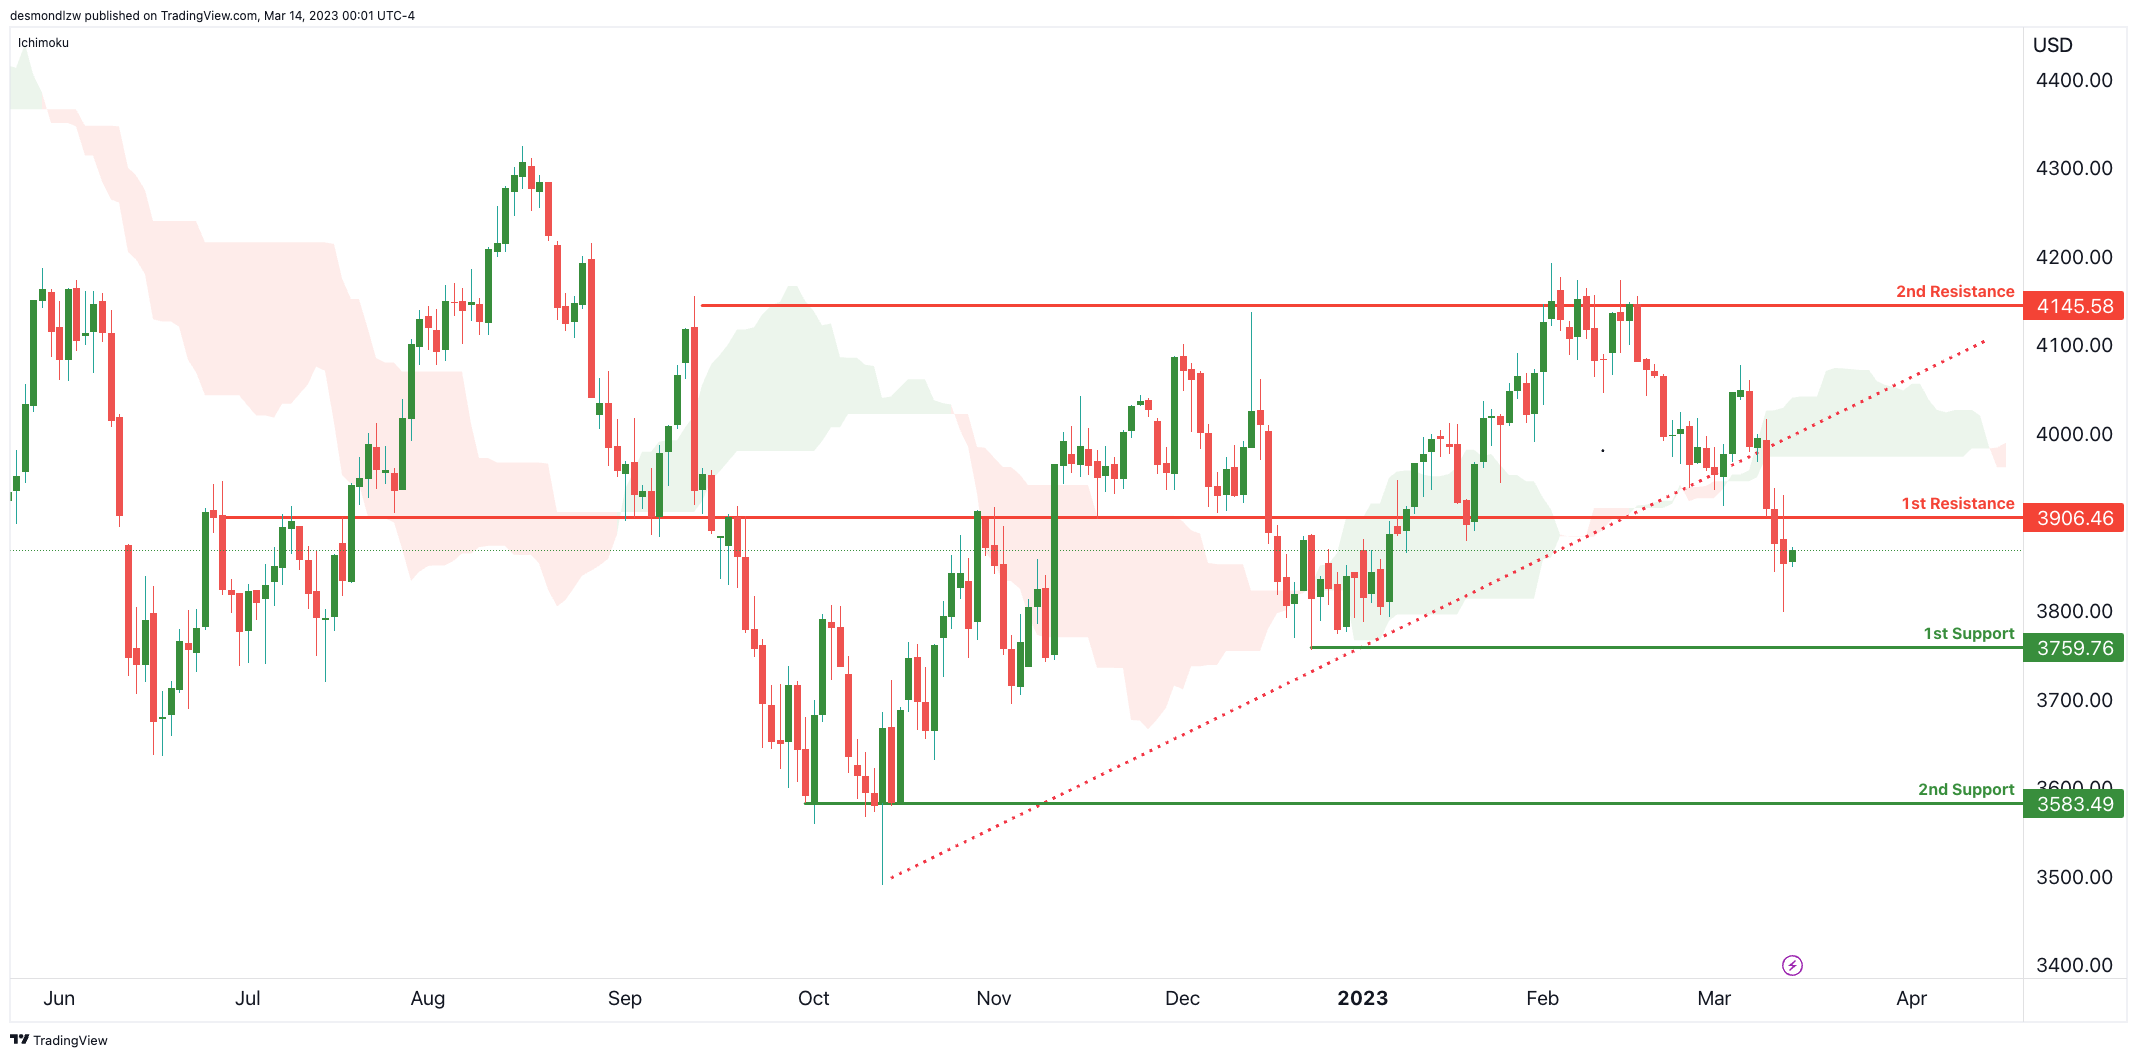
Price recently broke an ascending support-turned-resistance line and crossed below the Ichimoku cloud – suggesting there might be some bearishness coming into play. It iis also currently testing our 1st resistance at 3906 which is an overlap resistance, if price were to break through, it could potentially push up to our 2nd resistance at 4145 which is a multi-swing high resistance.
Regarding the support levels, If the price were to reverse from the 1st resistance level, our 1st support is 3759 and 2nd support is 3583 which is another swing low support.
ETH/USD:
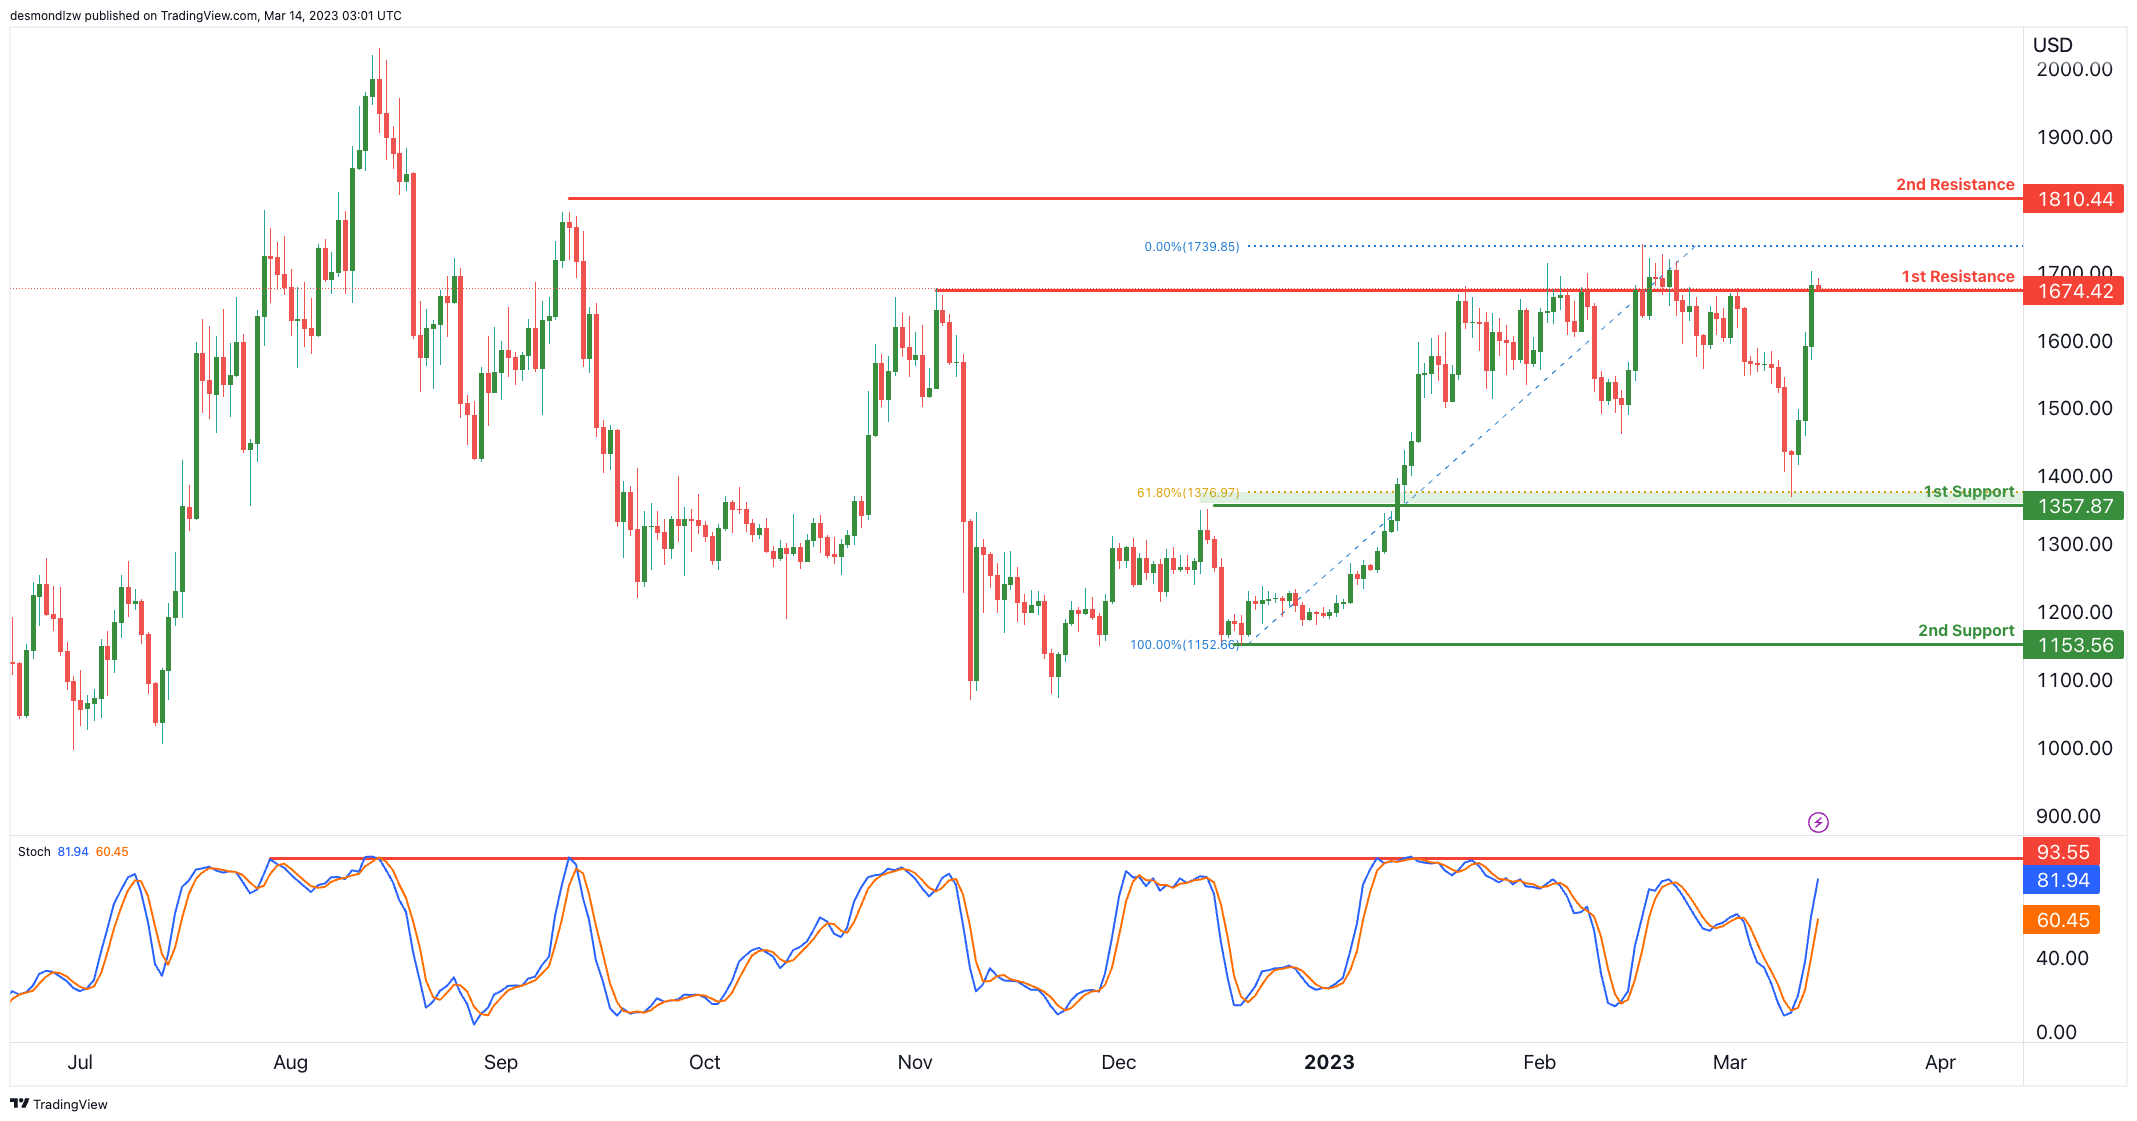
Price is testing a major resistance level at 1674 which is a multi-swing high resistance. If price were to break through this level, the next resistance would be at 1810.
Reversing from this level, we could see price drop to 1st support at 1357 which also lines up with a 61.8% Fibonacci retracement. Breaking that, the next major support would be at 1153.
WTI/USD:
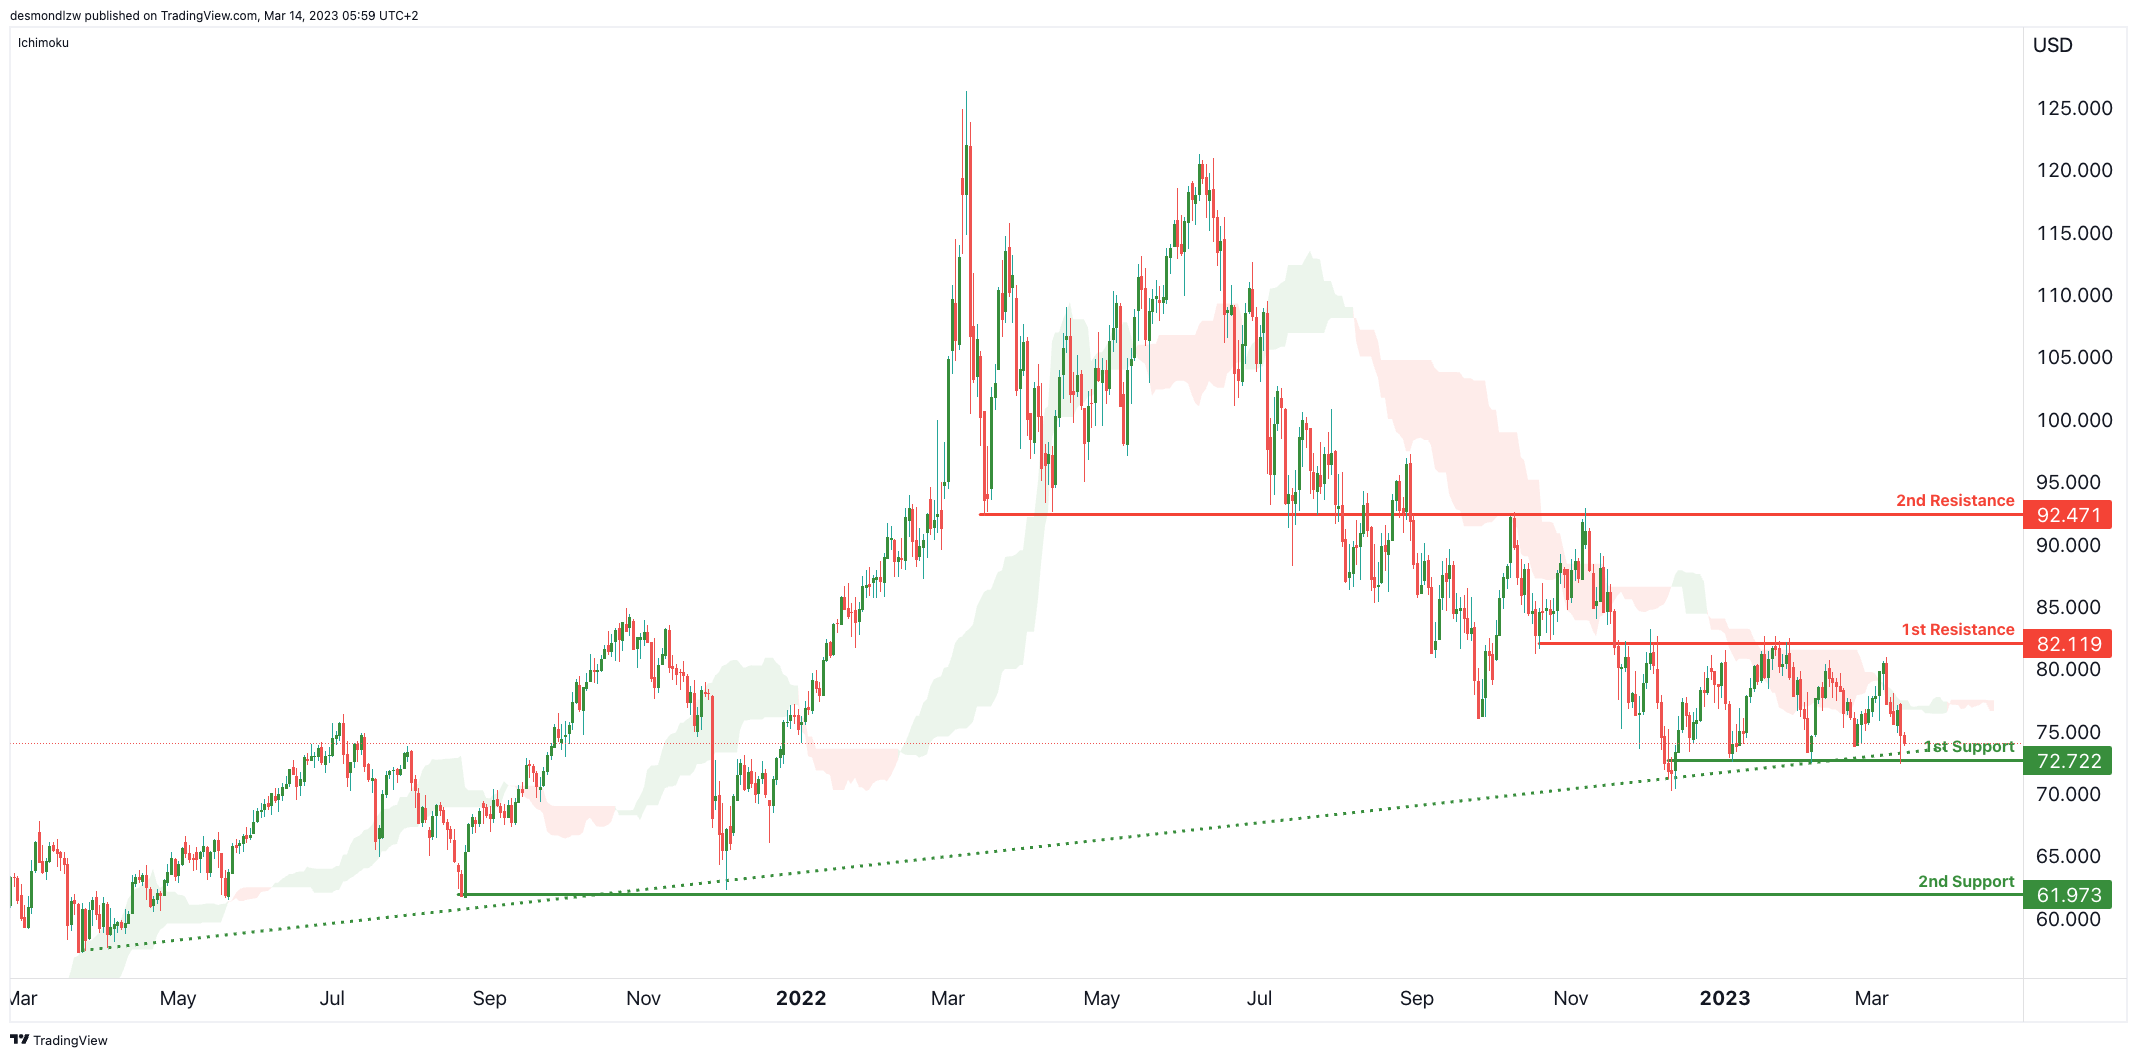
Price is respecting our ascending trendline which lines up with our 1st support level at 72.72, if price were to bounce from this level, it could push up to our 1st resistance at 82.119 which is an overlap resistance. Breaking that resistance, we could see a bigger move up to 2nd resistance at 92.47 which is a strong overlap resistance and 50% Fibonacci retracement.
If price were to break the ascending support and our 1st support at 72.72, we could see a bigger drop to 61.97 which is a major multi-swing low support.
XAU/USD (GOLD):
Price is now testing a major overlap resistance at 1913 which is slightly below the 78.6% short term Fibonacci retracement. A break of this level could suggest a move up to 1962 is possible – which is the recent swing high resistance.
However, a reversal from this resistance level could see support at 1881 which is also another nice overlap support – breaking this level could trigger a move down to 2nd support at 1804 which is now only an overlap support, but a Fibonacci retracement too.