

Sample Category Title
Inflation Pressures Continued to Moderate in the U.S. in February
- Headline and "core" ex-food and energy CPI both lower, at 6% and 5.5%
- Details firmer: price pressures broadened, and Powell’s preferred measure ticked higher
- Firm inflation print confronts gathering concerns over financial instability as the Fed draws closer to ending the hiking cycle
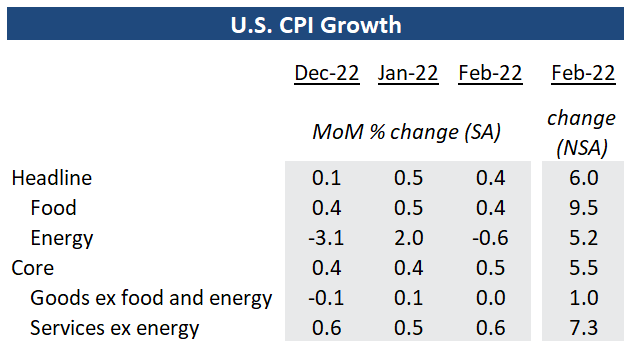
February’s inflation report came slightly above consensus expectations, with headline CPI growth ticking lower to 6.5% year-over-year. Food inflation at 9.5% was still elevated but has also continued to moderate after peaking in August 2022. Energy CPI growth slowed to 5.2% year over year, the slowest pace in two years, thanks to declines in fuel oil and utility gas prices. Excluding those more volatile components, “core” inflation slowed to 5.5% year-over-year. The monthly increase however, reaccelerated to 0.5% from January on a seasonally adjusted basis again with 70% of the gain driven by an increase in rent costs. Offsetting some of that strength was weakness in used cars and medical services, both of which saw prices decline again in February.
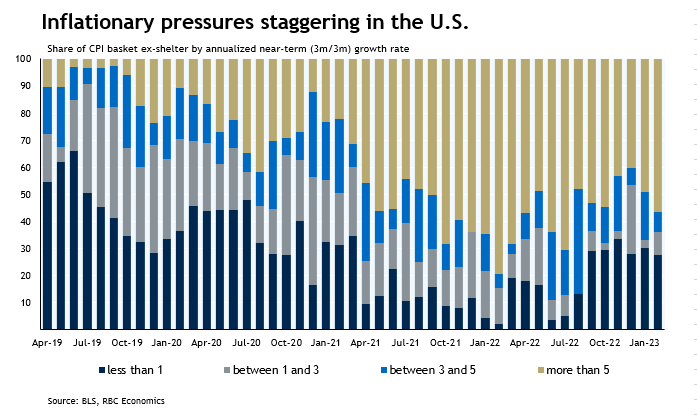
Details behind the CPI prints were firmer. Based on our diffusion measure, the breadth of inflation pressure in the U.S. widened in early 2023 after improving through much of last year. Powell’s preferred inflation gauge – core services ex-rent also grew at a faster 0.5% monthly pace, matching the increase in core CPI. Moving forward, the fact that most of the near-term strength in monthly CPI still reflects past increases in market rents suggests core readings should continue to come down. BLS estimated that the CPI rent measure lags market observed rents by roughly 4 quarters – yearly growth in those market rent measures has already peaked in February 2022.
Strong labour market outturns since the beginning of 2023, alongside elevated wage gains and renewed strength in consumer spending have all been adding upward pressure to the outlook for inflation through this year and next. But much of the impact from monetary tightening to-date has just started to surface – the collapse of three U.S. regional banks over the weekend that rattled bond markets is a prime example. Market pricing after this morning’s report is leaning toward a 25 bp hike for next week’s Fed’s meeting.
US Banks Collapse: FBS Explains
On Friday, March 10, the 16th largest US bank suddenly burst. The bankruptcy became the second largest in history among American commercial banks. In this article, we look at what happened and how it could affect all of us.
History of the bank
Forty years ago (in 1983), a bank appeared in California. It decided to serve mainly big-headed guys who created new promising businesses and raised much money from venture investors.
The business occurred in Silicon Valley, and the bank was called Silicon Valley Bank (SVB). This business model was highly successful as, for the next few decades, startups rowed money literally with a shovel and put this money in the bank.
In 2020-2021, the technology industry in the United States experienced another boom: under the slogan of combating covid, the Federal Reserve threw unprecedentedly huge amounts of money into the financial system. A significant part of it went precisely to fast-growing tech companies. The Nasdaq-100 index has almost doubled in these two years, and startups raced to conduct initial public offerings (IPOs) and raise money directly from venture capital investors on an industrial scale.
As a result, the business of SVB, which serves all these tech startups, also grew. Its client deposits more than tripled over that period (as did the bank's stock price) to reach roughly $200 billion by early 2022, making Silicon Valley Bank the 16th largest bank in the US (and second in California).
Any bank, of course, is happy when they bring a lot of money to it. But with big money comes a big responsibility: you have to decide where to invest them so that they earn a nice profit in the pocket of the owners of this bank.
What to do with the money?
The classic business model of any bank is to collect more deposits at a lower rate and distribute this money to reliable companies in the form of loans at a higher rate. In the case of Silicon Valley Bank, this was problematic. Most startups from Silicon Valley do not look much like "safe businesses" with stable cash flows. Moreover, these startups had enough money. In 2020–2021, investors lined up to fill such companies with cash.
Therefore, SVB decided that the money would be logical to invest in the stock market. Of course, they did not go to buy Tesla shares with leverage - that would be too much. However, they decided to buy reliable bonds from the US government (US Treasuries) or mortgage-backed debt securities with suitable collateral in the form of real estate.
And now, let's remember what yields gave reliable dollar bonds during that period:
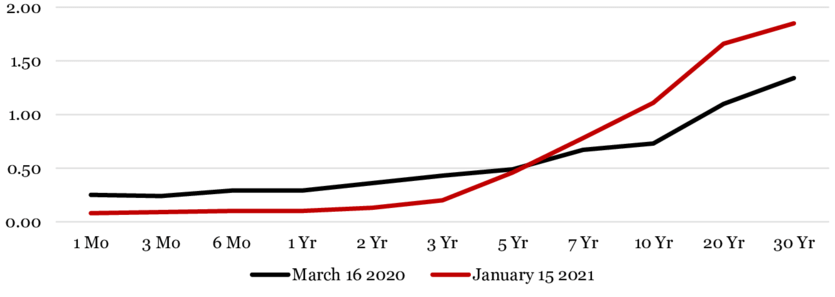
Yield on US government bonds as a percentage (vertical scale) depending on their maturity (horizontal scale) in 2020-2021
The US Federal Reserve then drowned the interest rate to almost zero (to save the economy from covid horrors), so placing money in reliable US Treasuries on the horizon of a year or two could bring about zero profit.
So, the bankers from Silicon Valley Bank thought that you wouldn't earn much by investing at 0%. The solution was simple - the bankers invested most of the capital into longer bonds with a 5-10 years maturity, which at that time had a yield slightly above 1.5% per annum.
How rising rates killed bonds
Any financier knows that when you buy long bonds, you take on the risk of rising interest rates.
Why is this happening? Suppose a company issues a $100 value bond with a 1% coupon (the market level at the time), maturing in 50 years, and you buy it. A year later, the level of rates increased, and now these companies are lent at 2% per annum.
Can you sell your bond to someone for $100? Of course not. But for $50, such a bond will be bought from you without any problem. After all, a coupon of $1 per year will yield 2% on the “current market value” of the paper at $50.
This happened in 2022 when the US Federal Reserve raised the interest rate from about zero to almost 5%.
As a result, the bond portfolio of Silicon Valley Bank showed a drawdown from 9 to 17%, which already, as it were, exceeded the size of the bank’s capital (the difference between existing assets and liabilities).
Investors caused the bankruptcy
It is interesting that, in itself, this loss has yet to be fatal for the bank. Accounting standards allow losses to be recognized after a while. And there is even logic in this: because of the rate increase, the bonds sink not forever but temporarily. If you hold them until maturity, they will recover over time, and everything will be ok.
But this logic only works if the bank has "the ability to wait." And here is the time to remember that most of the deposits in Silicon Valley Bank can be withdrawn by the customers at any time.
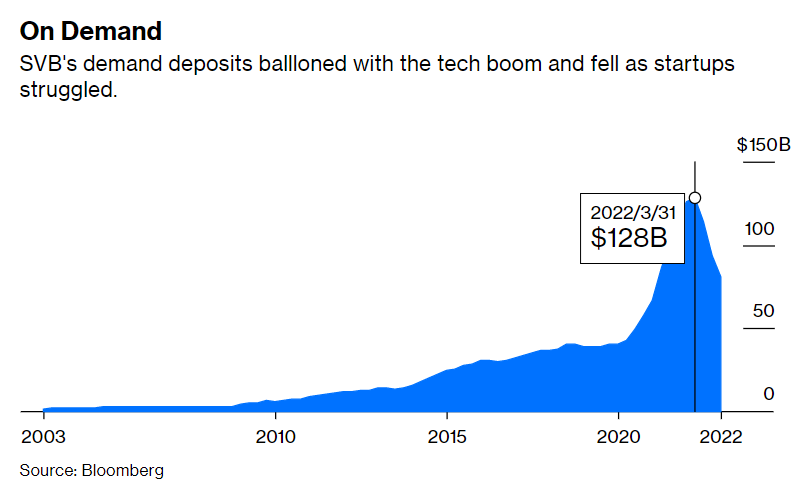
The systematic outflow of such deposits from the bank began in mid-2022. The tech industry began to decline, and attracting new investors' money was no longer easy.
But for SVB, this felt like a gradual activation of a time bomb. The faster the outflow of deposits became, the clearer that simply “sitting out to maturity” in these bonds would not work. Sooner or later, they would have to be sold at a loss to receive funds to return money to customers.
This is what happened. In 2023 the bank had to start selling these long bonds at a loss, and then it suddenly became very clear to everyone that there would not be enough money for everyone. Venture start-ups from Silicon Valley began to call each other and advise urgently to remove all the money from Silicon Valley Bank.
The concentration of SVB in one sector played a cruel joke on the bank: if they had many small retail clients, they might have passed. But since IT startups in the Valley communicate very closely, there was a full run on the bank when everyone tried to get their money out early (because the last one in this line may not get anything).
As a logical result - on March 10, banking regulators in the United States began, de facto, the bankruptcy procedure for SVB.
What is next?
The collapse of the SVB has undermined investor confidence in the US banking sector. Clients began withdrawing money from other banks, fearing a repetition of the situation, and already on Monday, some banks lost from 20% to 80% of their share price.
Such behavior of investors can provoke more than one bankruptcy — the following contenders: the American First Republic Bank, Pacific Westerns, and Western Alliance.
During the weekends, the US officials clarified that the situation is manageable and promised "cheap" loans for the banking sector. As a result, the US dollar declined as cheap loans involved running a "printing press". Moreover, markets are now pricing the Federal Reserve to leave the rate at the same level on March 22, which could send the US dollar even deeper.
Many investors turned to Bitcoin, which rose 14% on Monday as US stock indices fell. This trend could continue if the banking story continues and the Fed keeps stimulating the economy with bailout money.
Conclusion
Times of crisis are always times of opportunity. The impossibility of determining the fair valuation of the company can be compensated by the possibility of speculative operations on the market.
Fortunately, trading FBS allows you to profit on rising and falling markets. FBS gives traders a significant advantage due to a wide range of instruments, low commissions, and analytical support.
USD/JPY Mid-Day Outlook
Daily Pivots: (S1) 132.02; (P) 133.53; (R1) 134.76; More...
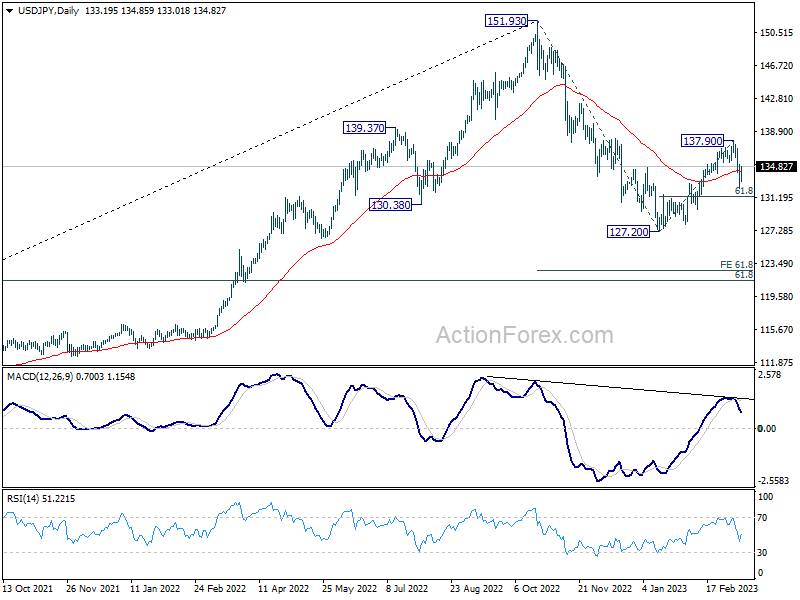
USD/JPY's recovery from 132.27 extends higher today and with break of 134.68 minor resistance, intraday bias is turned neutral first. Fall from 137.90 could still extend lower and break of 132.27 will target 61.8% retracement of 127.20 to 137.90 at 131.28. Break of 137.90 resistance is needed to confirm resumption of the rally from 127.20, or risk will stay mildly on the downside.
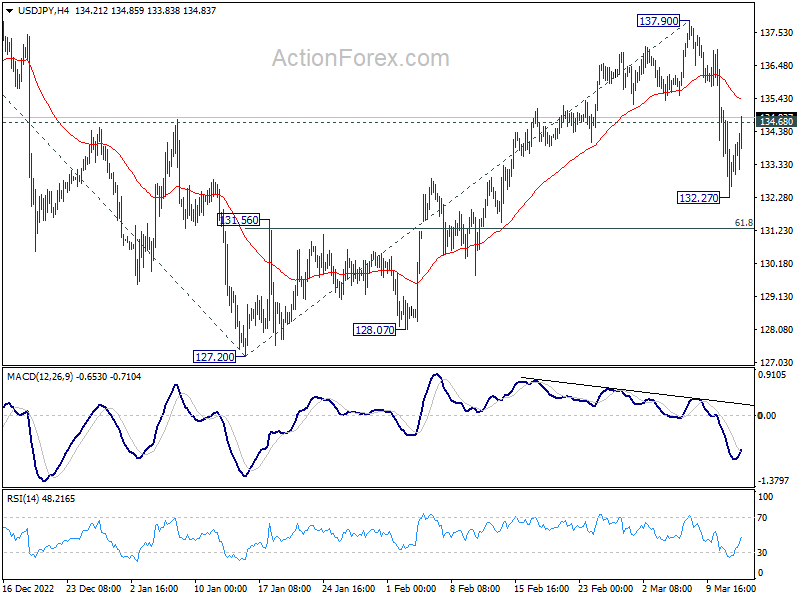
In the bigger picture, rebound from 127.20 should have completed at 137.90 as a corrective move, with strong break of 55 day EMA. The down trend from 151.93 (2022 high) is not over yet. Break of 127.20 will resume this down trend and target 61.8% projection of 151.93 to 127.20 from 137.90 at 122.61. This will now be the favored case as long as 137.90 resistance holds.
USD/CHF Mid-Day Outlook
Daily Pivots: (S1) 0.9057; (P) 0.9133; (R1) 0.9194; More...
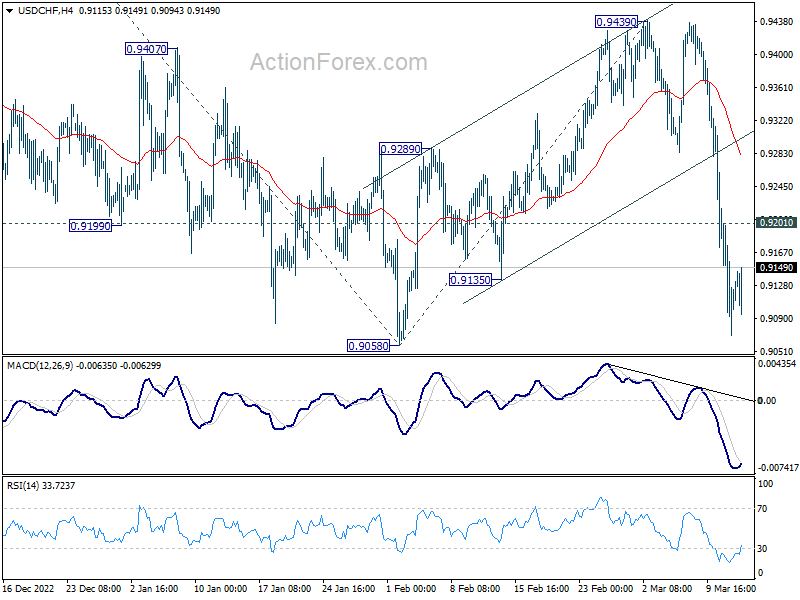
Intraday bias in USD/CHF remains on the downside for the moment. Decisive break of 0.9058 low will resume larger down trend from 1.0146. Next target is 61.8% projection of 1.0146 to 0.9058 from 0.9439 at 0.8767. On the upside, above 0.9218 minor resistance will turn intraday bias neutral and bring consolidations first, before staging another fall.
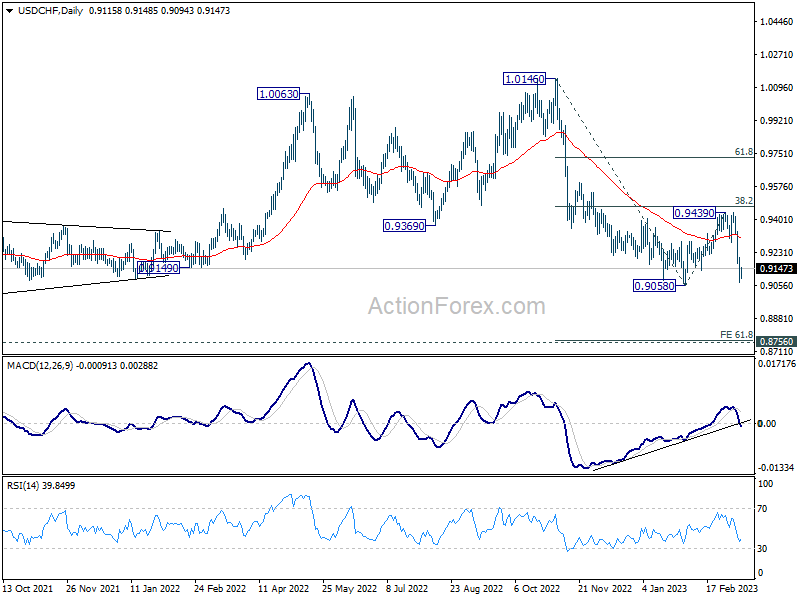
In the bigger picture, fall from 1.1046 (2022 high) is should still be in progress with 38.2% retracement of 1.0146 to 0.9058 at 0.9474 intact. Rejection by 55 week EMA is also a medium term bearish sign. Break of 0.9058 will resume such decline towards 0.8756 support (2021 low). But overall, such fall is still as a leg in the long term range pattern from 1.0342 (2016 high). So, downside should be contained by 0.8756 to bring reversal. For now, this will remain the favored case as long as 0.9439 resistance holds.
GBP/USD Mid-Day Outlook
Daily Pivots: (S1) 1.2087; (P) 1.2143; (R1) 1.2240; More...
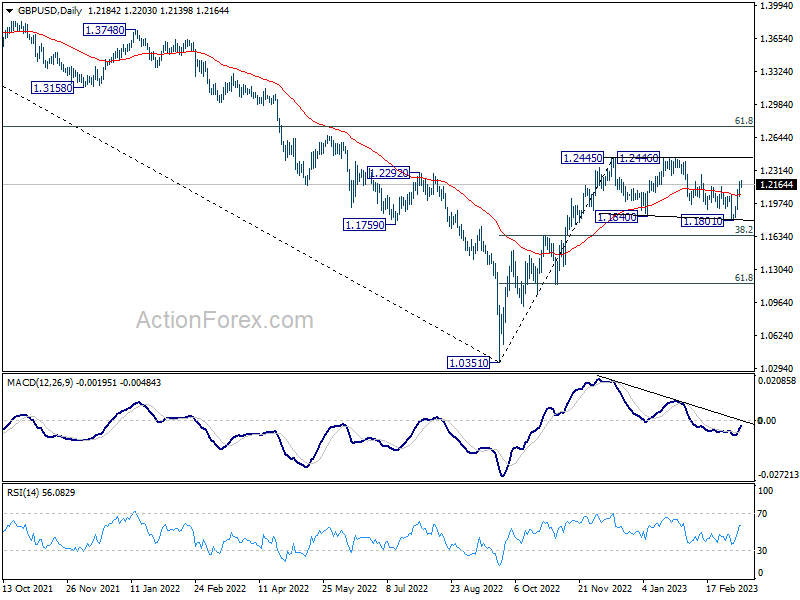
Intraday bias in GBP/USD stays on the upside at this point. Rise from 1.1801 is still in progress. As noted before, the corrective pattern from 1.2445 should have completed with three waves to 1.1801. Further rally should be seen to retest 1.2445/6 resistance zone next. On the downside, below 1.2045 minor support will delay the bullish case and turn intraday bias neutral first.
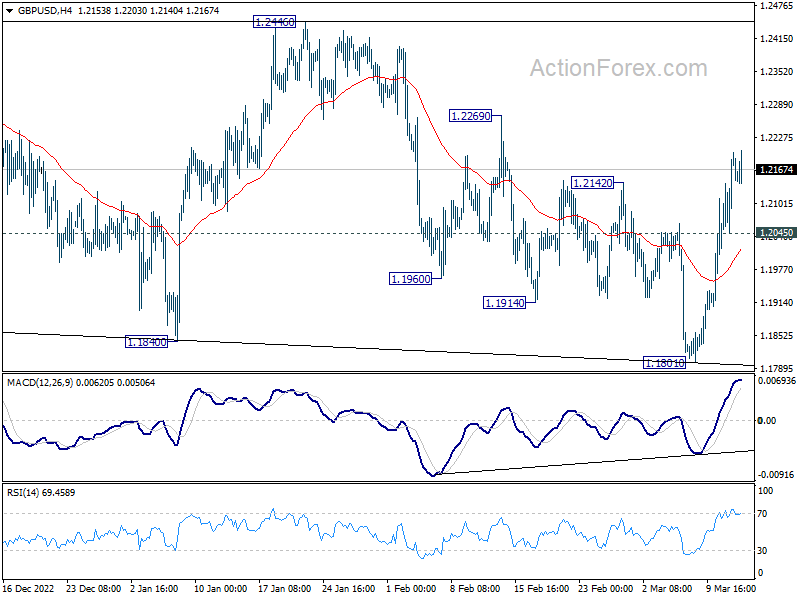
In the bigger picture, price action from 1.2445 are seen as a corrective pattern to rise from 1.0351 medium term bottom (2022 low). Resumption is expected as a later stage and firm break of 1.2446 will target 61.8% retracement of 1.4248 (2021 high) to 1.0351 at 1.2759. This will remain the favored case as long as 38.2% retracement of 1.0351 to 1.2445 at 1.1645 holds.
US: Inflation Shows Greater Staying Power in February
The Consumer Price Index increased 0.4% month-on-month (m/m) in February, in line with the consensus forecast. The 12-month change continued to edge lower, falling to 6.0% (down from 6.4% the month prior).
Energy prices fell 0.6% m/m, as energy services (-1.7% m/m) were lower on the month – largely due to a sharp 8.0% m/m decline in utility gas service. Meanwhile, gasoline prices edged higher by 1.0% m/m. Food prices moderated slightly from January, rising 0.4% m/m but remain 10.2% higher on a year-over-year (y/y) basis.
Core inflation (excludes food & energy) was up 0.5% m/m – a slight acceleration from January's gain of 0.4% m/m and a tick higher than the consensus forecast. Compared to last February, core inflation is up 5.5% - a tenth of a percentage point lower than the 5.6% recorded the month prior.
Price growth across services (+0.6% m/m) accelerated on the month, as shelter costs rose 0.8% m/m thanks to strong gains from rent of primary residence (+0.8% m/m) and owners' equivalent rent (+0.7% m/m). Lodging away from home (+2.3% m/m) also accelerated on the month.
- Stripping out shelter and medical services, the cyclical service component (aka "super" core) rose 0.8% m/m – an acceleration from the 0.65% gain in January.
Core goods prices were flat in February, largely owing to another sharp decline in used vehicle prices (-2.8% m/m). However, most other goods categories continued to register sizeable gains last month, with home furnishings (+0.8% m/m), apparel (+0.8% m/m), new vehicle prices (+0.2% m/m) and recreation commodities (+0.4% m/m) all meeting or exceeding January's gains.
Key Implications
Inflationary pressures refuse to go away quietly. The three-month annualized change on core rose to 5.2% in February, marking the second consecutive month of acceleration. Over the near-term, it is unlikely that we see much reprieve. Much of the disinflationary force on goods prices has been the result of falling used vehicle prices, but with the wholesale Manheim UVPI having shown steady gains in recent months, it's unlikely that we see further price declines in the months ahead. Unless we see more disinflationary pressure from other categories, goods prices will again start making positive contributions to core inflation. Making matters worse, the cyclical component on services continues to accelerate and will require some cooling in the labor market before we see these pressures ease. Based on last Friday's employment numbers, this is still a way out.
The recent flow of economic data continues to point to an economy that can certainly support further increases in interest rates. However, the collapse of two regional banks in just the last few days has exposed a vulnerability across a small sub-segment of the banking sector. As a result, market pricing for next week's FOMC decision has narrowed significantly, with a 25 basis-point hike only 75% priced. Prior to the collapse of SVB, markets had attached a similar probability to a 50-bps hike! Provided there's no further contagion, and financial market confidence is restored over the coming week, we suspect the FOMC will likely push ahead with another 25-bps hike. That said, it has become abundantly clear that the Fed will need to balance both the economic and financial stability implications with each further increase in the policy rate.
EUR/USD Mid-Day Outlook
Daily Pivots: (S1) 1.0672; (P) 1.0710; (R1) 1.0771; More...
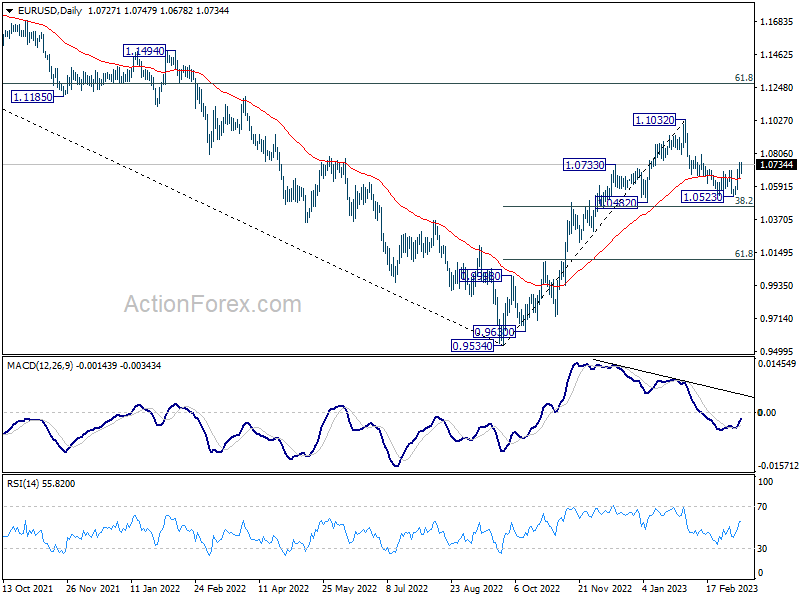
EUR/USD's rally from 1.0523 is still in progress and intraday bias stays on the upside. As noted before, corrective decline from 1.1032 should have completed at 1.5023, ahead of 1.0482 key support. Break of 1.0803 resistance will bring retest of 1.1032 high next. On the downside, below 1.0649 minor support will turn intraday bias neutral. But risk will stay on the upside as long as 1.0523 support holds, in case of retreat.
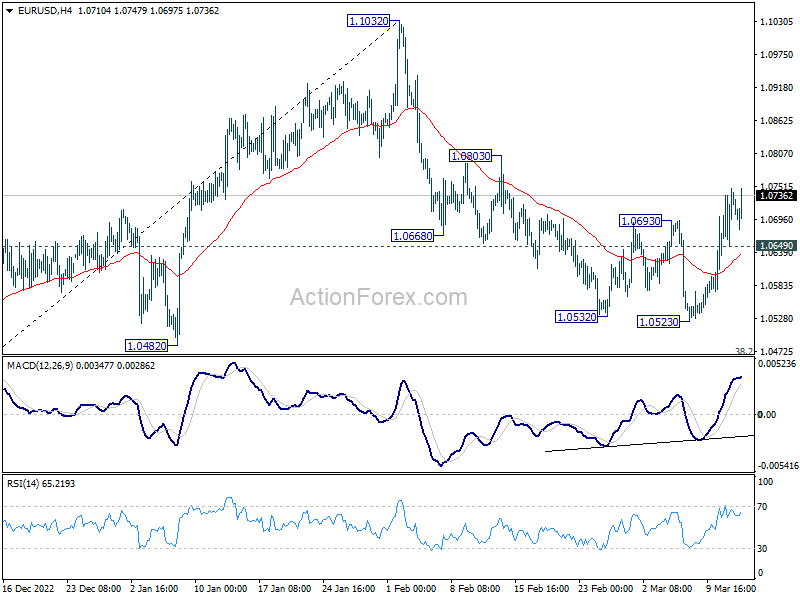
In the bigger picture, as long as 1.0482 support holds, rise from 0.9534 (2022 low) should continue to 61.8% retracement of 1.2348 (2021 high) to 0.9534 at 1.1273. However, sustained break of 1.0482 will bring deeper fall to 61.8% retracement of 0.9534 to 1.1032 at 1.0106, even as a corrective pull back.
Dollar Weakens as CPI Slowed as Expected, Easing Pressure on Fed
Dollar weakened slightly in early US session, following the release of economic data which showed that consumer inflation slowed in February to the level as expected. The absence of an upside surprise in the CPI readings means that Fed should be in a more comfortable position to address uncertainties over the banking system. This could make a 50bps rate hike look much less necessary to policymakers, while the markets have already priced it out. US futures rose after the release, indicating a potential rebound. However, Treasury yields remained steady.
In the currency markets, Canadian Dollar is the strongest performer today so far, followed by New Zealand and Australian Dollars. Yen was the worst performer, reversing all gains made against all currencies except the greenback. Euro and Dollar were the next weakest performers. Euro, in particular, is lacking some firepower as the markets question whether ECB will deliver on its promise of a 50 basis points rate hike this Thursday.
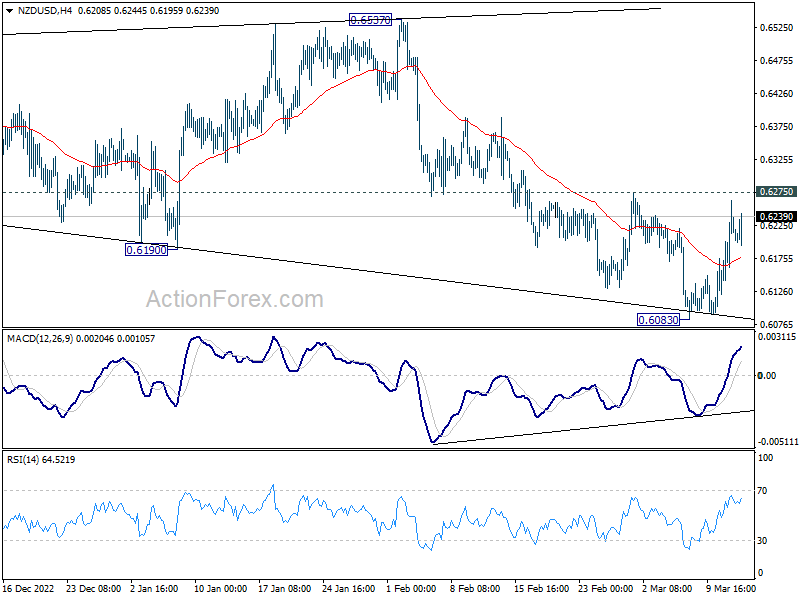
Technically, a major focus is still on whether Dollar would break through near term support levels against commodity currencies, to alight with the near term bearish outlook against others. The levels to watch include 0.6694 resistance in AUD/USD, 0.6725 resistance in NZD/USD, and 1.3664 support in USD/CAD. Decisive break of these levels is need to confirm underlying weakness in Dollar.
In Europe, at the time of writing, FTSE is up 0.55%. DAX is up 1.63%. CAC is up 1.42%. Germany 10-year yield is up 0.1451 at 2.403. Earlier in Asia, Nikkei dropped -2.19%. Hong Kong HSI dropped -2.27%. China Shanghai SSE dropped -0.72%. Singapore Strait Times dropped -0.08%. Japan 10-year JGB yield dropped -0.0226 to 0.283.
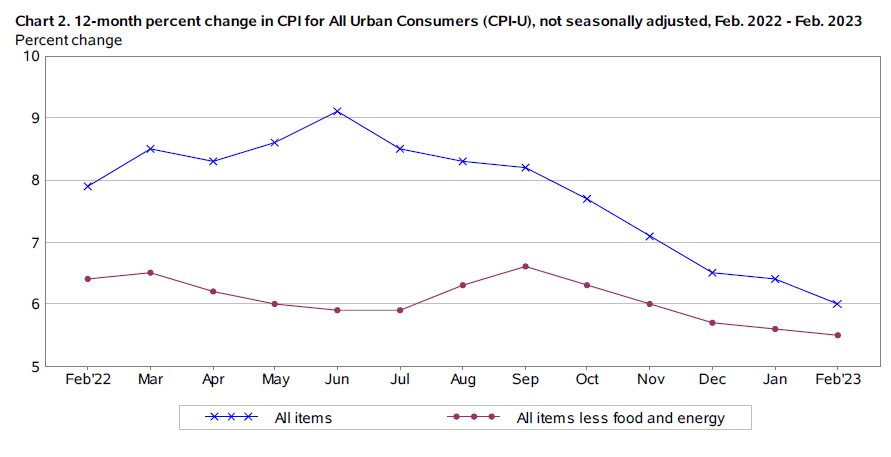
US CPI slowed to 6.0% yoy in Feb, core CPI down to 5.5% yoy
US CPI slowed from 6.4% yoy to 6.0% yoy in February, matched expectations. That's also the lowest reading since September 2021. Core CPI (all items less food and energy) slowed slightly from 5.6% yoy to 5.5% yoy, matched expectations, and was the lowest since December 2021. Energy index rose 5.2% yoy while food index rose 9.5% yoy.
For the month, CPI rose 0.4% mom while core CPI rose 0.5% mom. Food index rose 0.4% mom and energy index decreased 0.6% mom.
UK payrolled employment rose 98k in Feb, unemployment rate unchanged at 3.7% in Jan
In February, UK payrolled employment rose 98k or 0.3% mom. Comparing to the same month a year ago, payrolled employment rose 1040k or 3.6% yoy. Median monthly pay rose 6.7% yoy. Claimant count dropped -11.2k versus expectation of -12.4k.
In the three month to January, unemployment rate was unchanged at 3.7%, better than expectation of a rise to 3.8%. Average earnings excluding bonus rose 6.5%, below expectation of 6.6%. Average earnings including bonus rose 5.7%, matched expectations.
Australia Westpac consumer sentiment unchanged at 78.5, second sub-80 read in a row
Australia Westpac Consumer Sentiment Index was unchanged at 78.5 in March, a second month of extremely weak reading, near historical lows. Areas of most concern remain inflation, interest rates, and the economy.
Westpac noted that there were only one month of sub-80 reading during the COVID pandemic and the global financial crisis period. Runs of sub-80 have only been seen during the recession during the 1980s and 1990s.
Regarding RBA policy, Westpac will wait after release of data on employment, inflation, spending, and confidence, before deciding to change the expectation of a 25bps hike in April. But Westpac maintained the forecast of another 25bps hike in May.
Australia NAB business confidence fell to -4, conditions down to 17
Australia NAB Business Confidence dropped sharply from 6 to -4 in February. Business Conditions dropped from 18 to 17. Looking at some details, trading conditions were unchanged at 27. Profitability conditions dropped from 18 to 14. Employment conditions rose from 11 to 12.
"Overall, the survey confirms the ongoing resilience of the economy through the first months of 2023, though we continue to expect a more material slowdown in demand later in the year when the full effect of rate rises has passed through," said NAB.
EUR/USD Mid-Day Outlook
Daily Pivots: (S1) 1.0672; (P) 1.0710; (R1) 1.0771; More...
EUR/USD's rally from 1.0523 is still in progress and intraday bias stays on the upside. As noted before, corrective decline from 1.1032 should have completed at 1.5023, ahead of 1.0482 key support. Break of 1.0803 resistance will bring retest of 1.1032 high next. On the downside, below 1.0649 minor support will turn intraday bias neutral. But risk will stay on the upside as long as 1.0523 support holds, in case of retreat.
In the bigger picture, as long as 1.0482 support holds, rise from 0.9534 (2022 low) should continue to 61.8% retracement of 1.2348 (2021 high) to 0.9534 at 1.1273. However, sustained break of 1.0482 will bring deeper fall to 61.8% retracement of 0.9534 to 1.1032 at 1.0106, even as a corrective pull back.
Economic Indicators Update
| GMT | Ccy | Events | Actual | Forecast | Previous | Revised |
|---|---|---|---|---|---|---|
| 23:30 | AUD | Westpac Consumer Confidence Mar | 0.00% | -6.90% | ||
| 00:30 | AUD | NAB Business Conditions Feb | 17 | 18 | ||
| 00:30 | AUD | NAB Business Confidence Feb | -4 | 6 | ||
| 07:00 | GBP | Claimant Count Change Feb | -11.2K | -12.4K | -12.9K | -30.3K |
| 07:00 | GBP | ILO Unemployment Rate (3M) Jan | 3.70% | 3.80% | 3.70% | |
| 07:00 | GBP | Average Earnings Excluding Bonus 3M/Y Jan | 6.50% | 6.60% | 6.70% | |
| 07:00 | GBP | Average Earnings Including Bonus 3M/Y Jan | 5.70% | 5.70% | 5.90% | 6.00% |
| 07:30 | CHF | Producer and Import Prices M/M Feb | -0.20% | 0.50% | 0.70% | |
| 07:30 | CHF | Producer and Import Prices Y/Y Feb | 2.70% | 3.40% | 3.30% | |
| 09:00 | EUR | Italy Industrial Output M/M Jan | -0.70% | -0.40% | 1.60% | 1.20% |
| 11:00 | USD | NFIB Business Optimism Index Feb | 90.9 | 91.2 | 90.3 | |
| 12:30 | CAD | Manufacturing Sales M/M Jan | 4.10% | -0.40% | -1.50% | -2.10% |
| 12:30 | USD | CPI M/M Feb | 0.40% | 0.40% | 0.50% | |
| 12:30 | USD | CPI Y/Y Feb | 6.00% | 6.00% | 6.40% | |
| 12:30 | USD | CPI Core M/M Feb | 0.50% | 0.40% | 0.40% | |
| 12:30 | USD | CPI Core Y/Y Feb | 5.50% | 5.50% | 5.60% |
US CPI slowed to 6.0% yoy in Feb, core CPI down to 5.5% yoy
US CPI slowed from 6.4% yoy to 6.0% yoy in February, matched expectations. That's also the lowest reading since September 2021. Core CPI (all items less food and energy) slowed slightly from 5.6% yoy to 5.5% yoy, matched expectations, and was the lowest since December 2021. Energy index rose 5.2% yoy while food index rose 9.5% yoy.
For the month, CPI rose 0.4% mom while core CPI rose 0.5% mom. Food index rose 0.4% mom and energy index decreased 0.6% mom.
ECB Meeting: Is a 50bps Hike Still a Done Deal?
Following the sudden collapse of the Silicon Valley Bank (SVB) in the US, investors have become increasingly concerned about the health of the banking system as borrowing costs continue to rise. While they have dramatically scaled back their bets with regards to the Fed’s future course of action, they are also doubting whether the ECB should proceed as aggressively as it signaled at its latest policy meeting. Is the telegraphed 50bps hike indeed a done deal? And if it is, will officials present a different agenda for the coming months? How will the outcome affect the euro?
Underlying inflation remains uncomfortably high
When they last met, ECB policymakers agreed to raise interest rates by 50bps as was widely anticipated, with President Lagarde explicitly saying that they intend to raise them by another 50bps at their next gathering and then evaluate the future path on a meeting-by-meeting basis. She acknowledged that supply bottlenecks are gradually easing, but she also warned that the delayed effects are still pushing up goods price inflation.
Since then, preliminary CPI data showed that headline inflation in the Euro area slowed by less than expected in February to 8.5% y/y from 8.6% and that the core rate rose to 7.4% y/y from 7.1%. Headline inflation could continue to cool down as the year-over-year change in energy prices dives deeper in the negative territory, but the spotlight seems to be on underlying metrics, which have yet to show any signs of cooling.
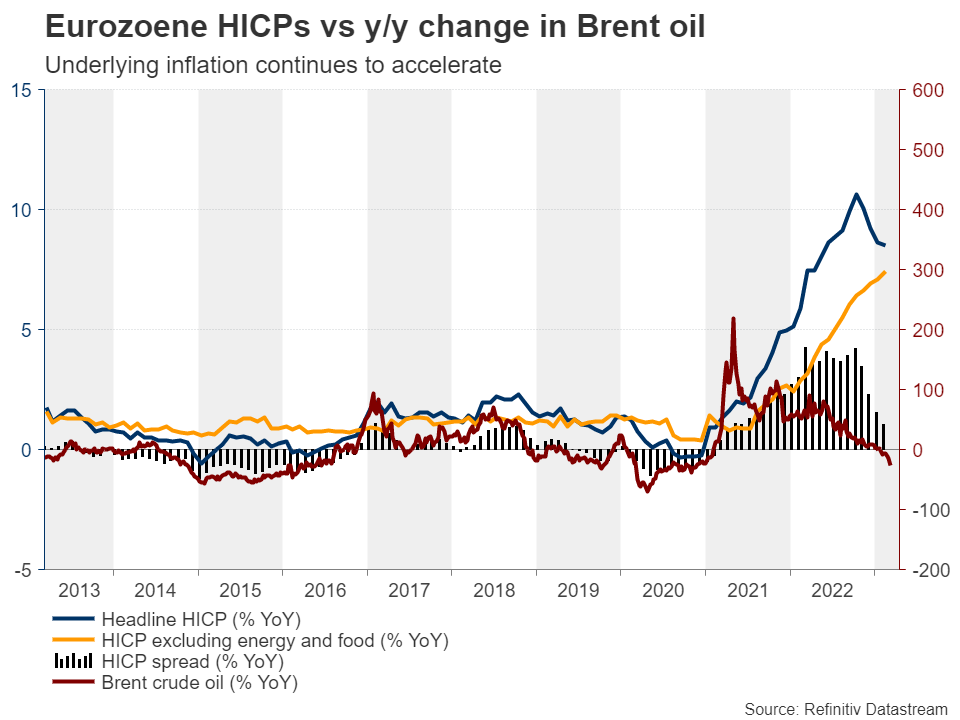
Indeed, just last week, President Lagarde stressed that a 50bps increase is now “very very likely”, adding that underlying inflation could stay uncomfortably high even as the overall inflation rate drops in the coming months. This likely suggested that a 50bps hike in March may not be enough to bring inflation down, and combined with optimism that a previously feared recession may be sidestepped, allowed market participants to add more basis points to their hike bets for this year. At some point last week, they were seeing an aggregate of 165 basis points worth of additional rate hikes by December.
SVB crisis sparks speculation of a smaller hike
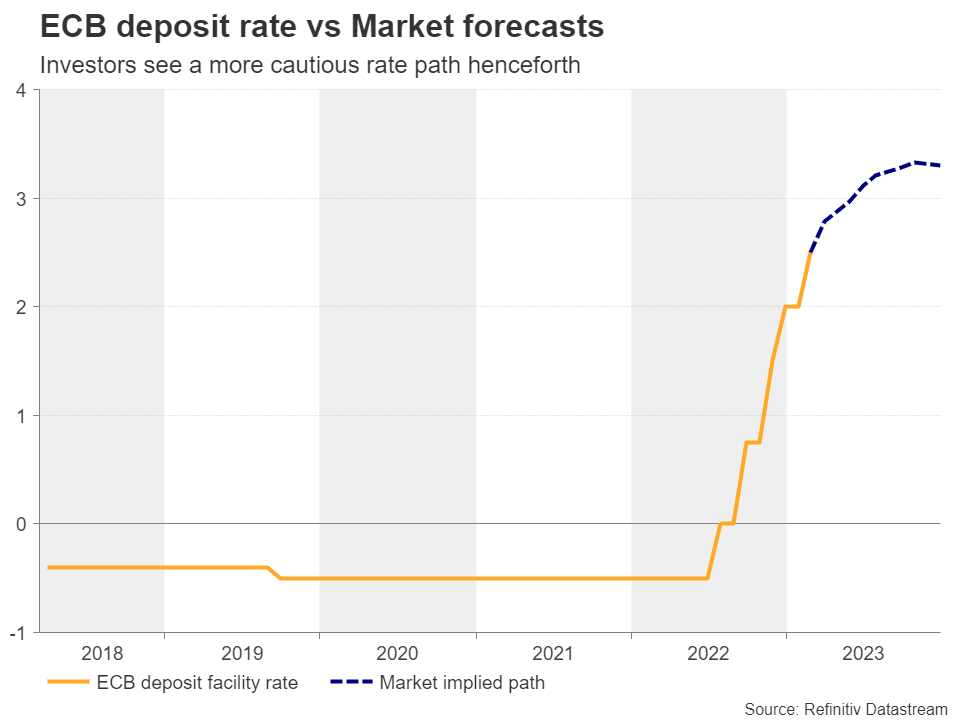
Having said all that though, the outlook on how the ECB may proceed henceforth was dramatically altered after a US lender, the Silicon Valley Bank (SVB), collapsed and spread panic among investors. Even after the prompt response of the Fed and US Treasury to announce contingency plans, market participants remained concerned and scaled back their hike bets with regards to every major central bank. Now, the ECB is expected to raise rates by only another 85bps by the end of the year, with investors split between 25 and 50bps on the size of Thursday’s hike.
A 50bps hike could support the euro
Ergo, a potential 50bps hike is not the market’s base case scenario now and should it materialize, the euro could gain. With France’s Finance and Economy Minister and Germany’s finance watchdog saying that the event does not pose any threat to Eurozone’s financial stability, a double hike may be more likely than the market pricing currently suggests.
Nonetheless, whether the currency can hold onto any decision-related gains may depend on hints and signals about the upcoming meetings, but also on the updated economic projections. Based on the latest economic data, the new macroeconomic projections may be subject to upward revisions, which might allow ECB President Lagarde to sound hawkish at the press conference, even as several of her colleagues believe that proceeding with smaller increments is wiser.
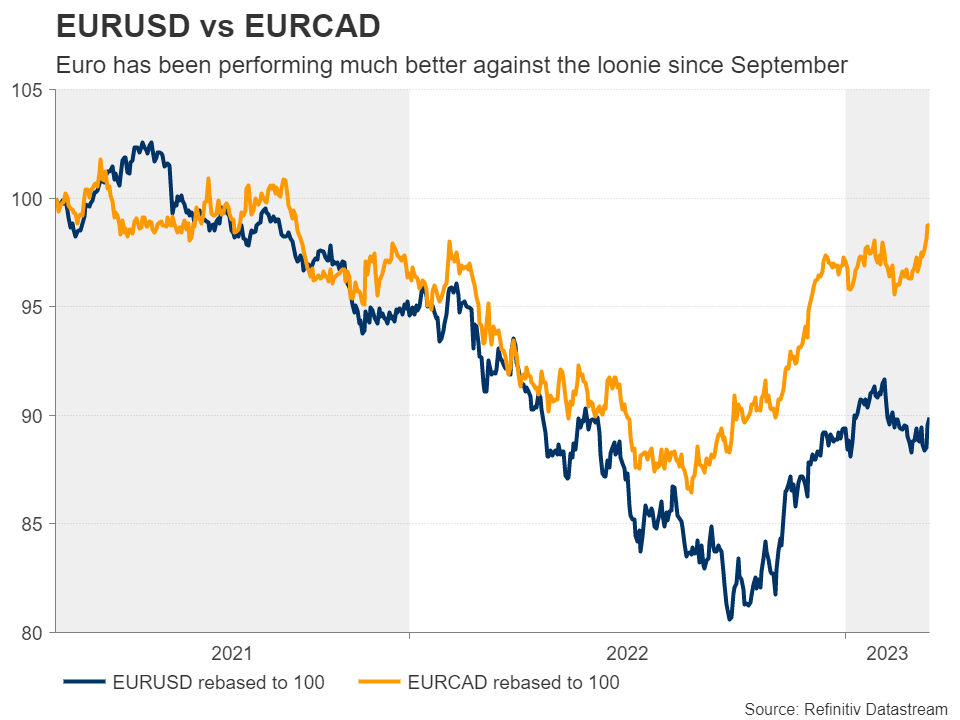
Euro/dollar may not be the best choice for exploiting any further euro gains as today’s US CPI figures could well reshape expectations about the Fed’s plans. A safer counterpart may be the Canadian dollar, whose central bank refrained from pressing the hike button at its last meeting and hinted that it could stay sidelined for the months to come.
Euro/loonie tests levels last seen in 2021
Euro/loonie emerged above the key resistance zone of 1.4635 last week, testing territories last seen in September 2021. Although it is now pulling back, it remains above that key zone, and well above the uptrend line drawn from the low of August 25. This keeps the likelihood of a rebound firmly on the table and if indeed the bulls regain control, they may try to reach the 1.5100 zone, which acted as a ceiling between July 17 and September 20.
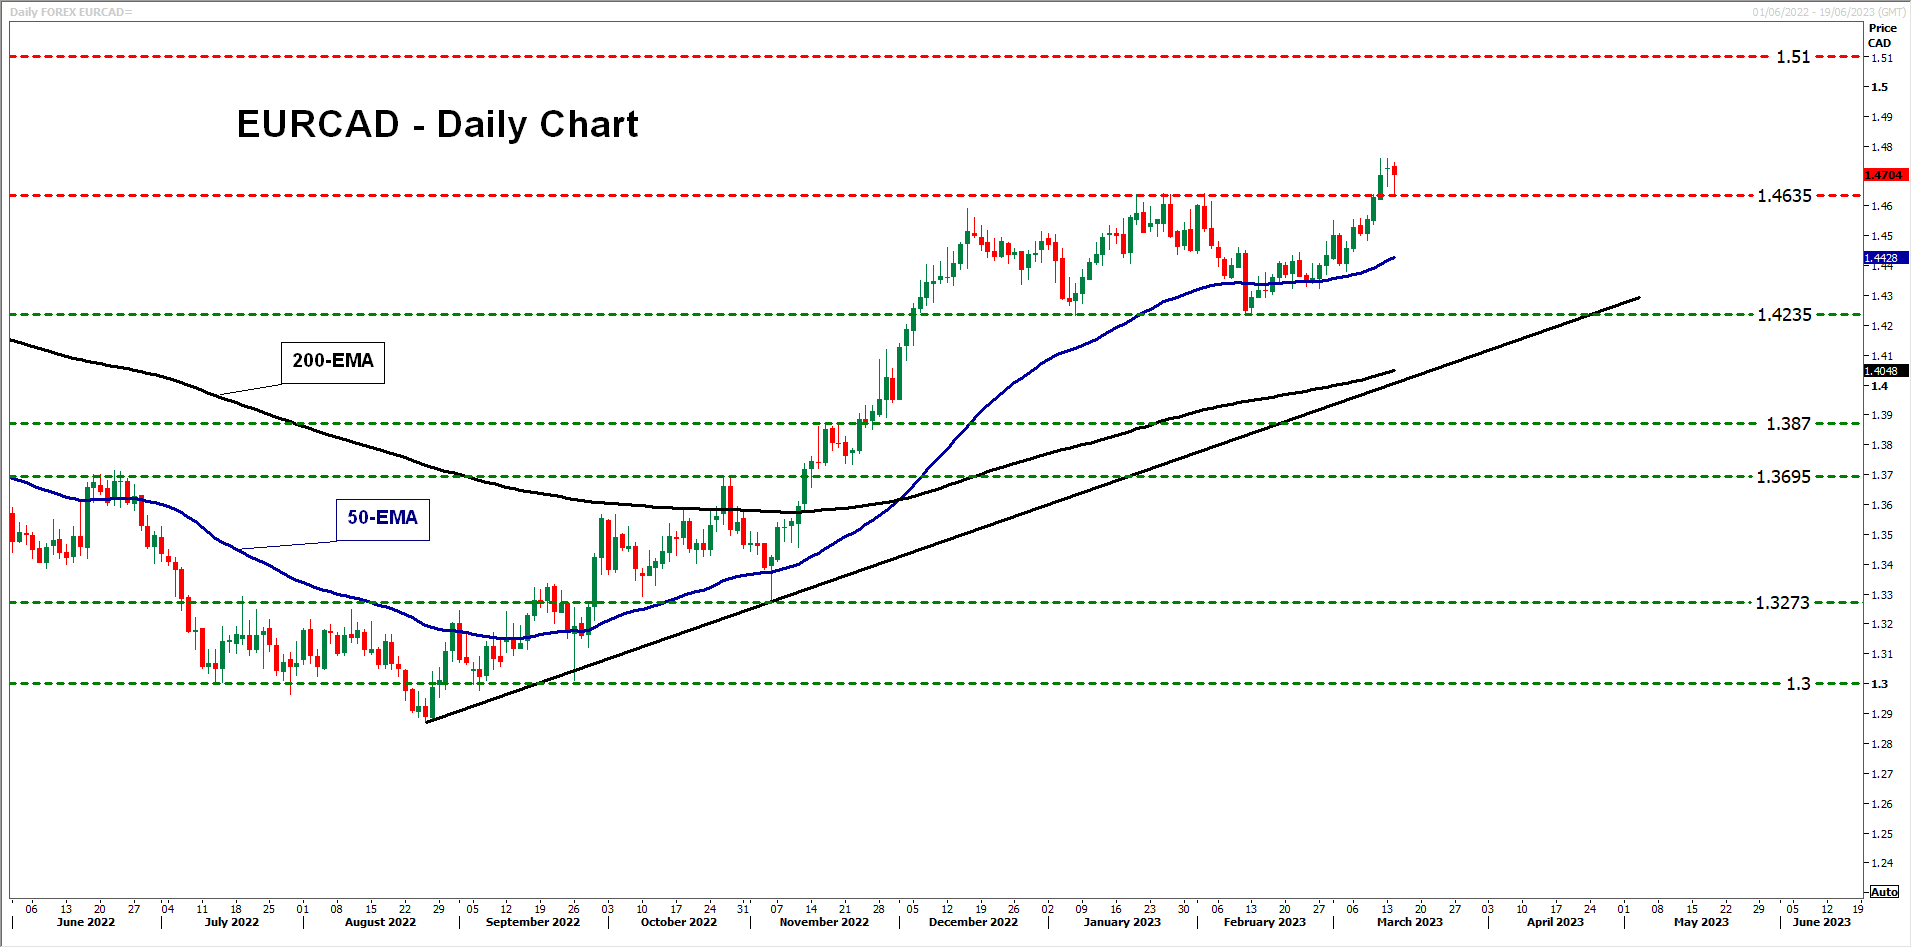
The downside risk arising from this ECB meeting is for policymakers to hint that they will opt for smaller hikes, even if they hike by 50bps now, due to financial stability concerns. Euro/loonie could dip back below the 1.4635 territory and travel all the way down to the 1.4235 barrier, which supported the pair on January 6 and February 13.