Sample Category Title
EUR/GBP Fails to Rebound
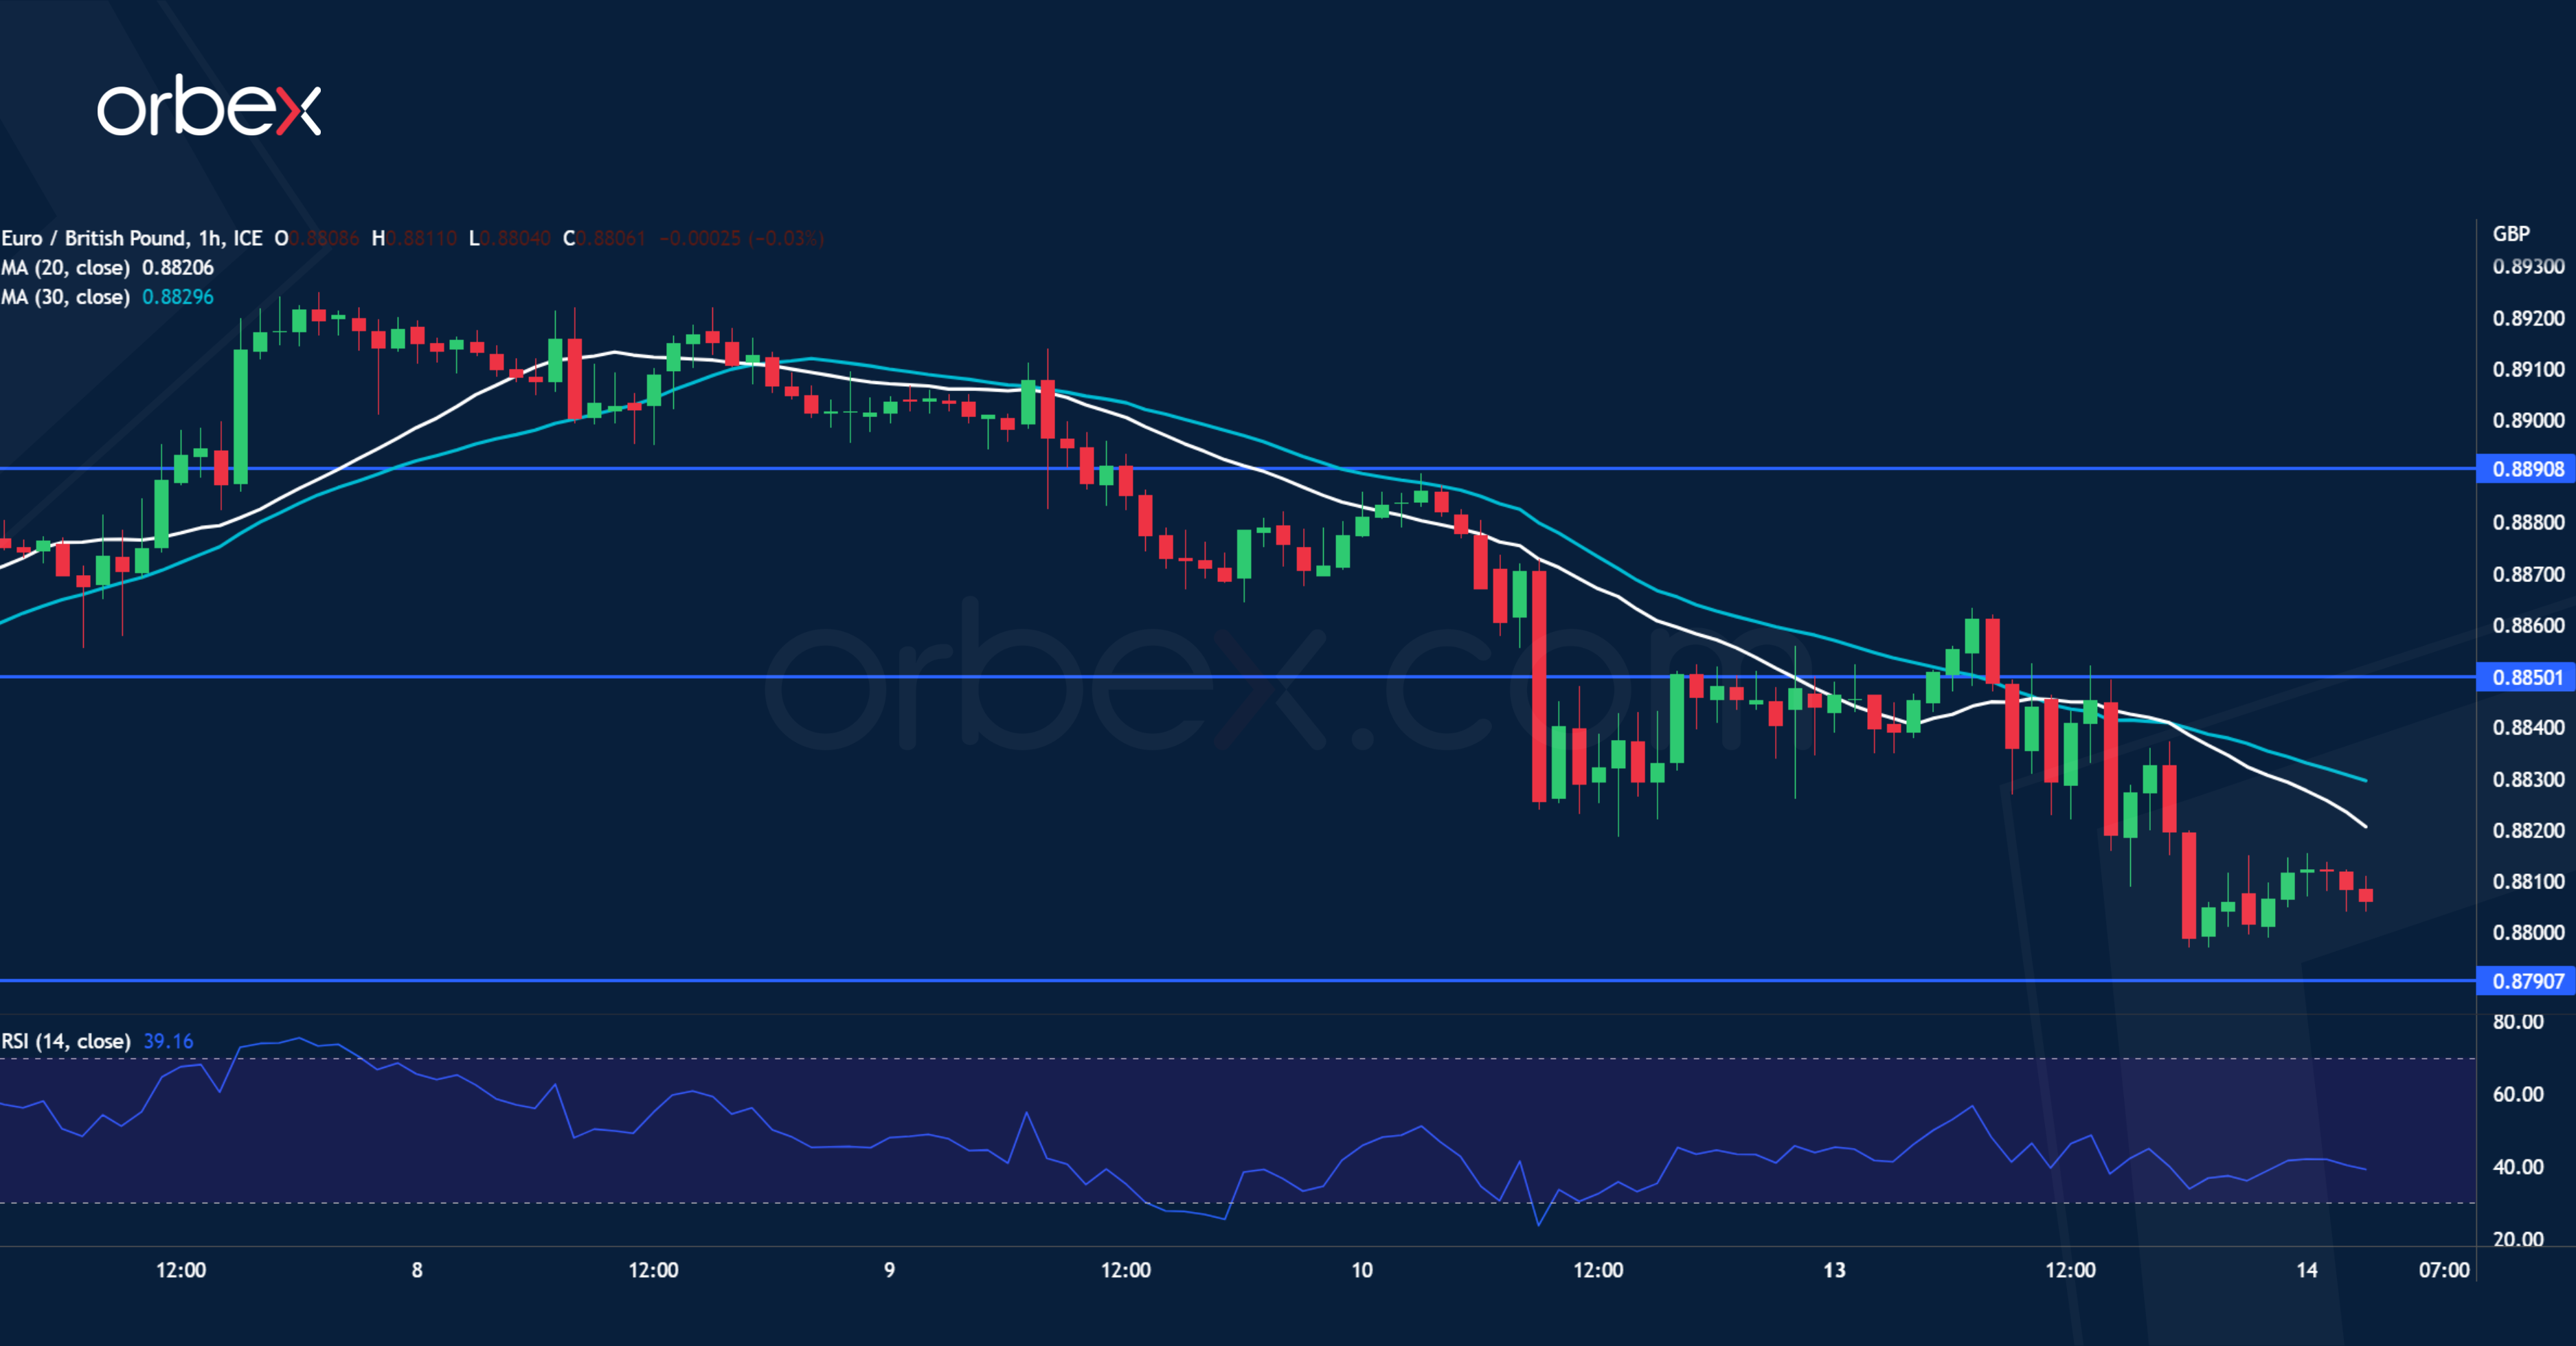
The euro fell as the bloc’s bond yields tumbled in fear of a financial crisis. From the daily chart’s perspective, the pair is still inching up despite a choppy path. On the hourly chart, a break below 0.8825 continues to put intraday bulls on the defensive. The demand zone around 0.8790 at the origin of the March breakout rally is a major level to keep the directional bias up. Otherwise, a fall below the daily support of 0.8760 may cause a bearish reversal. 0.8850 is the first hurdle and only a close above 0.8890 would turn sentiment around.
USD/JPY Struggles for Support
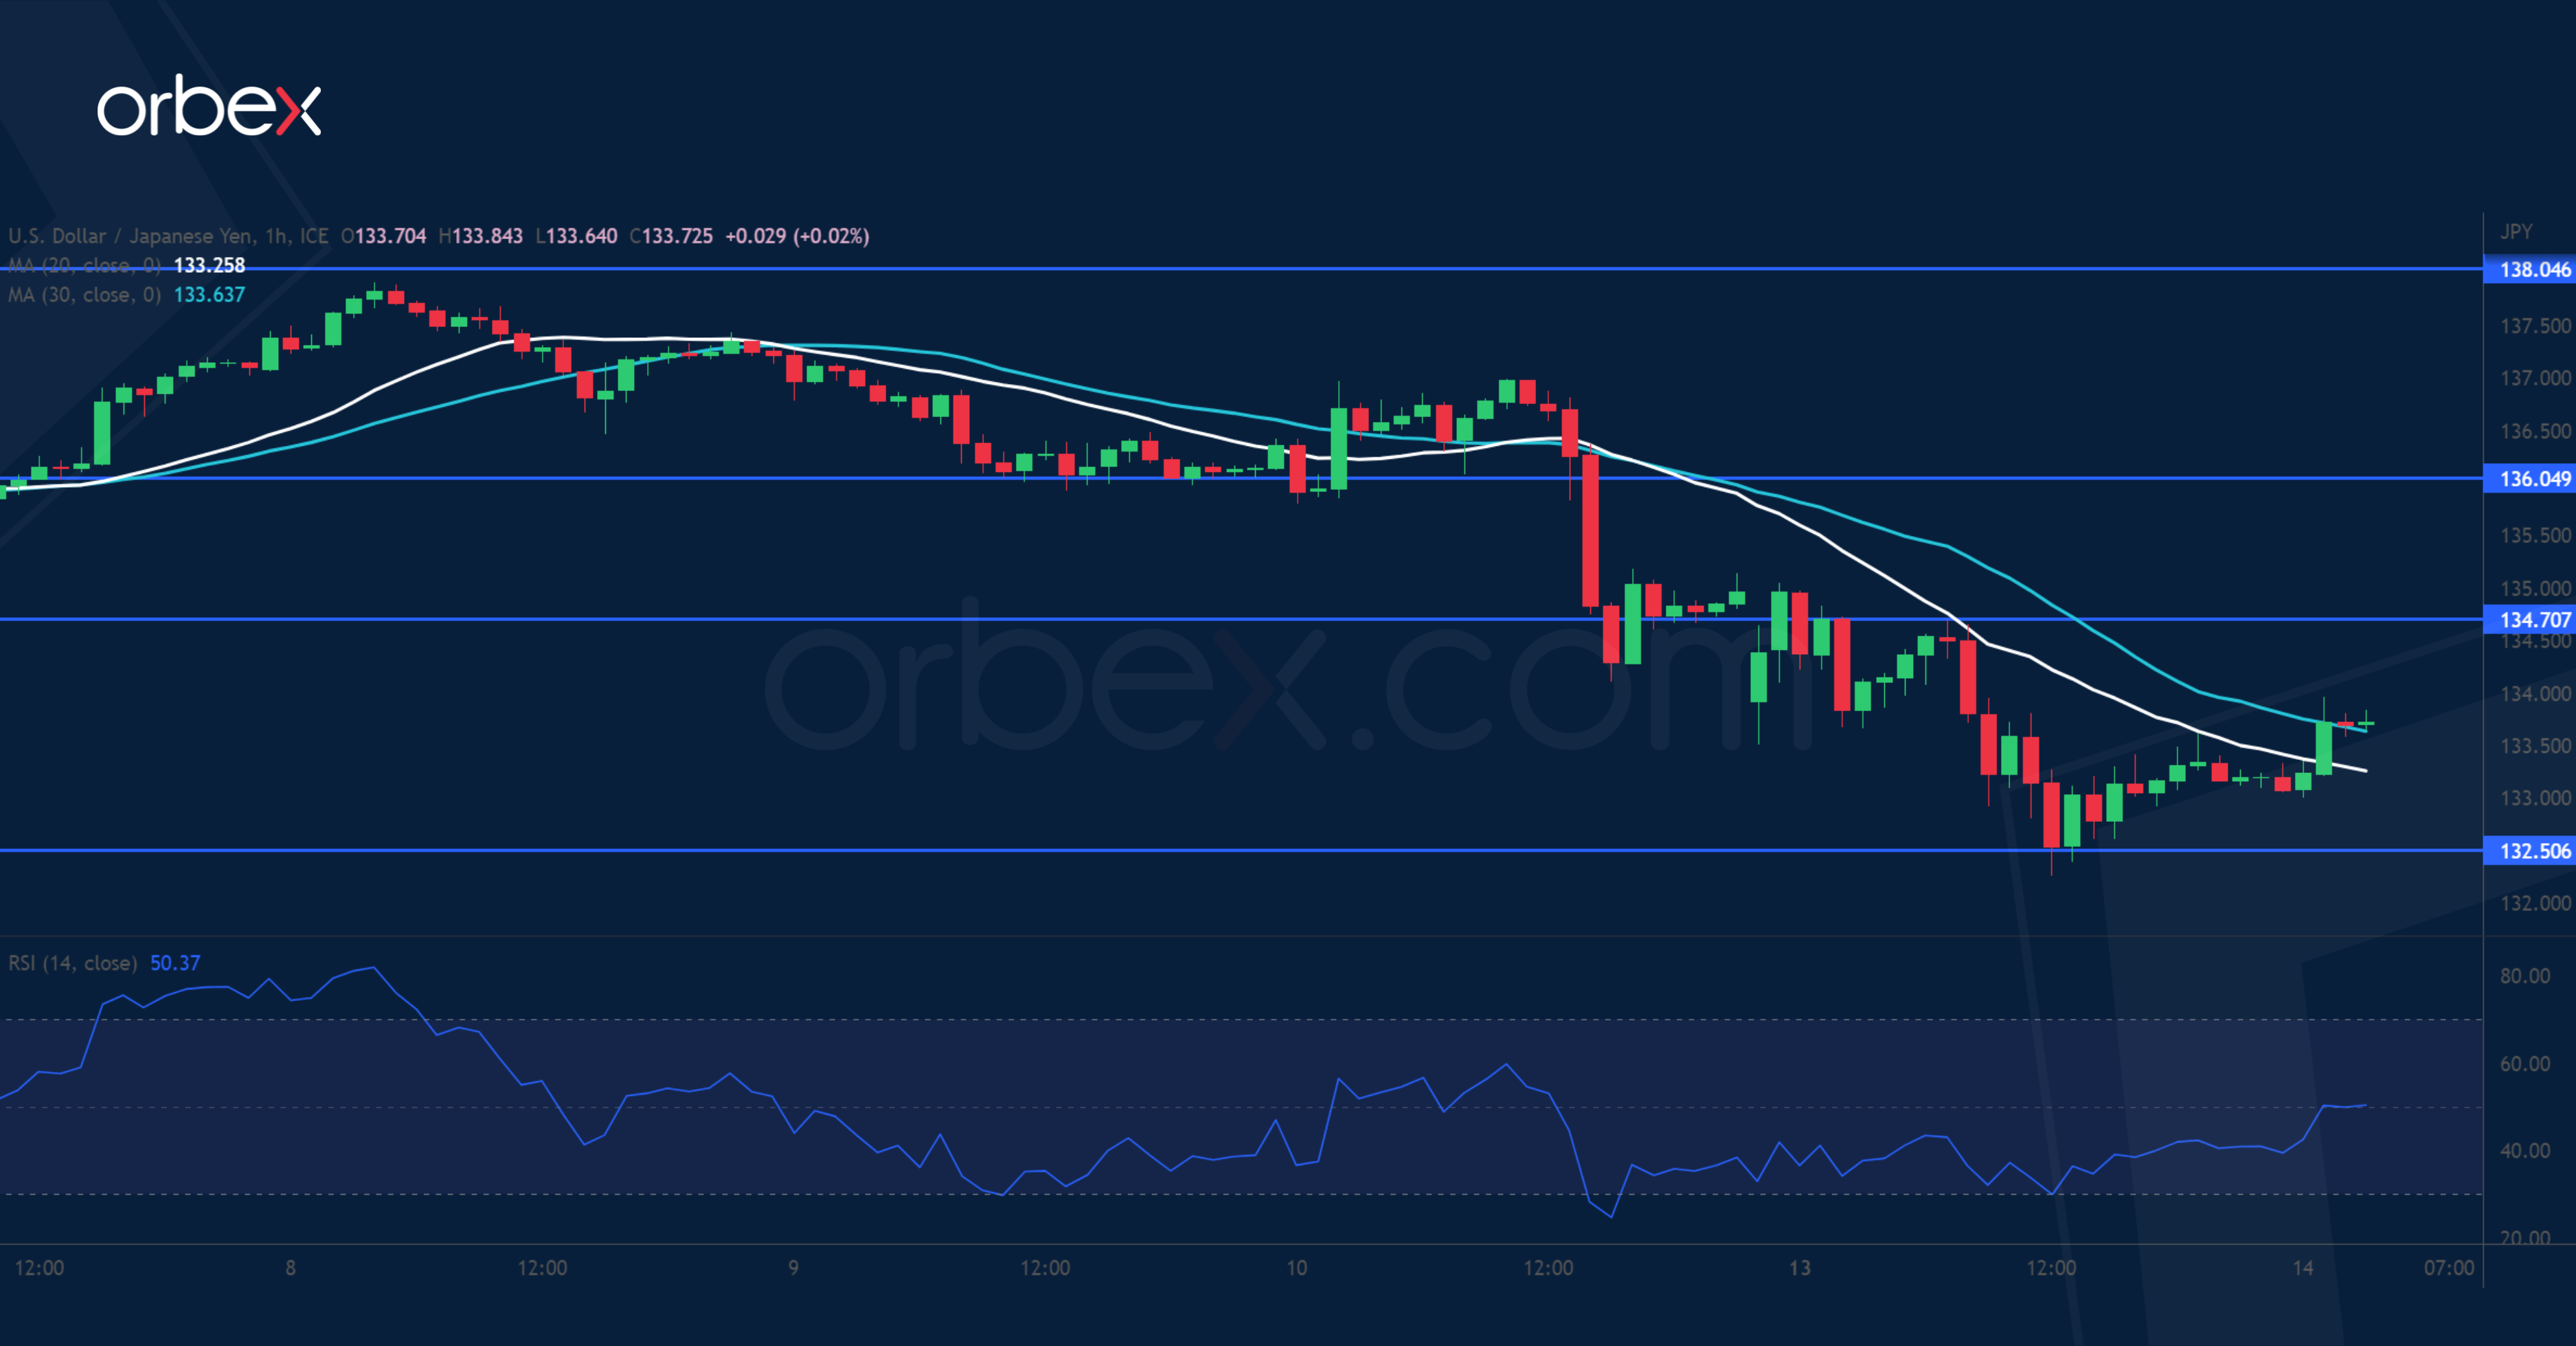
The US dollar grinds lower as efforts to avert a banking crisis after the collapse of SVB cut short rate hike expectations. December’s highs around 138.00 have proven to be a tough hurdle to lift. A subsequent break below 135.60 triggered a wave of sell-off and a combination of profit-taking and fresh selling compounds the amplitude of the liquidation. 132.50 is the next level to see if buyers would make a comeback. Failing that, 131.00 could be in the bears’ crosshairs. On the upside, 134.70 has turned into a fresh resistance.
Impulsive Elliott Wave Decline in FTSE Calling More Downside
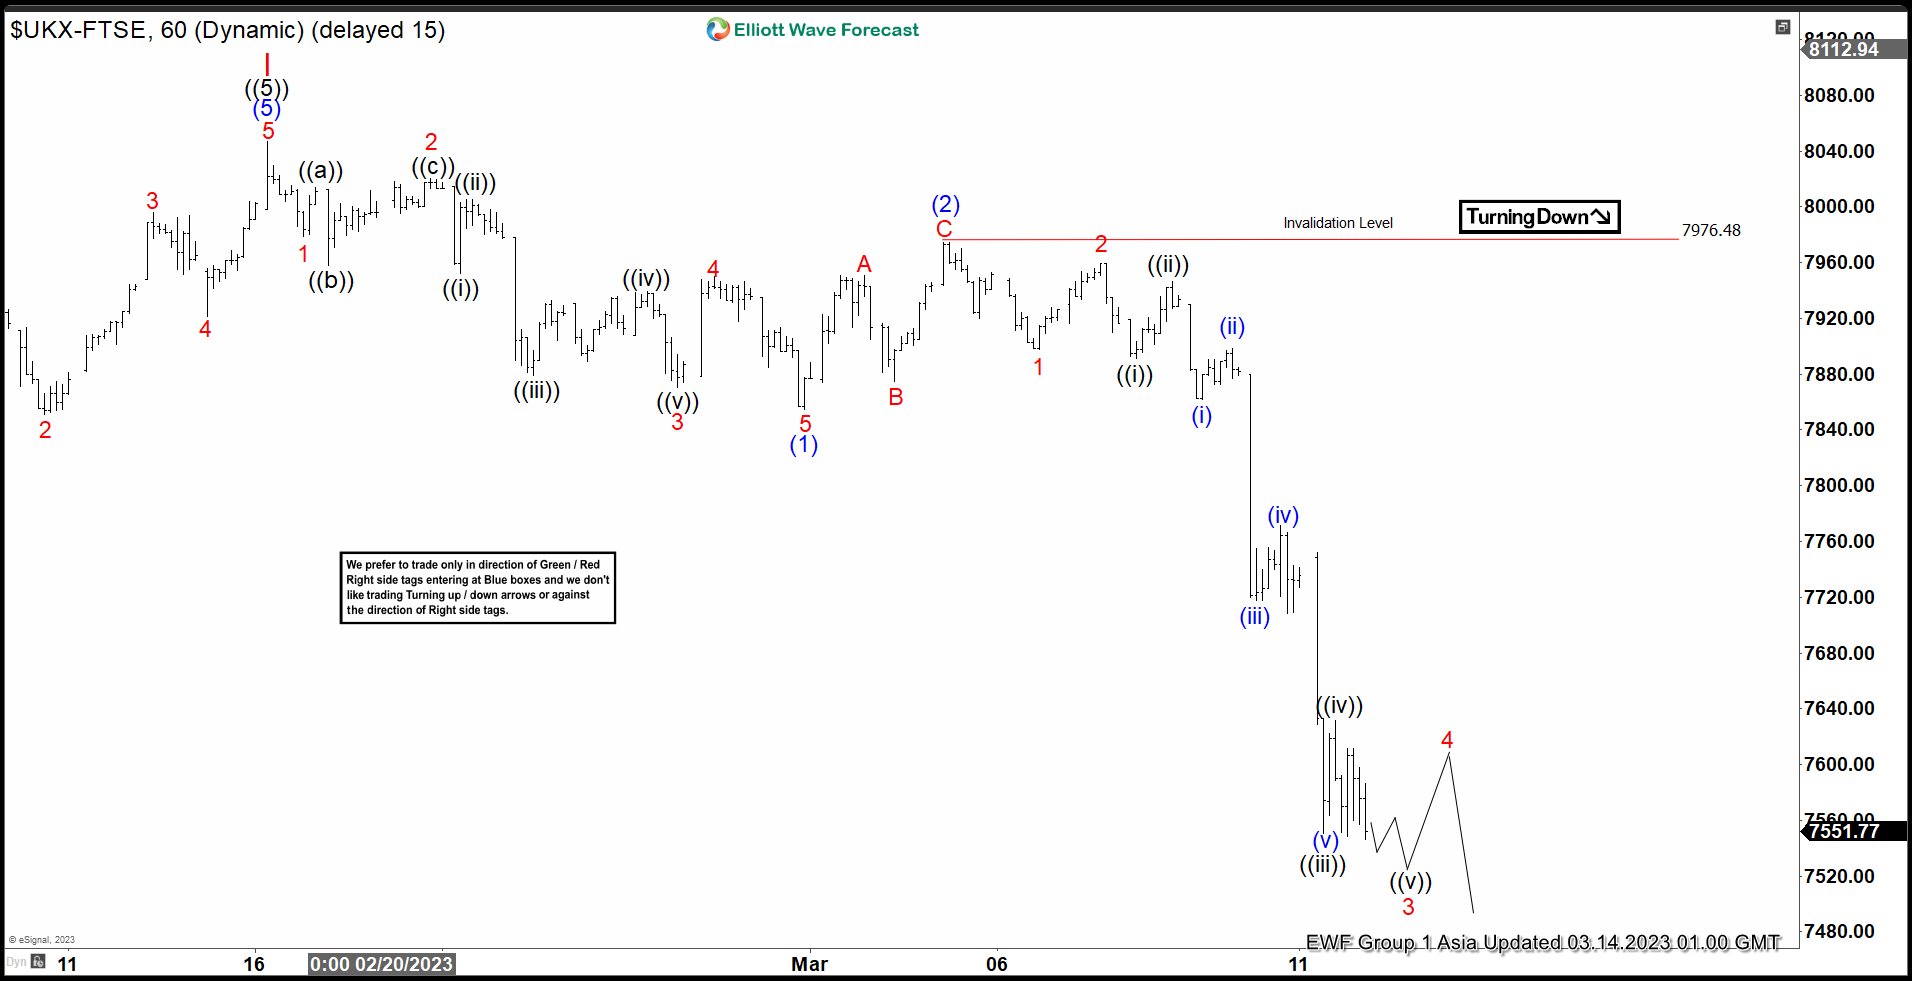
FTSE ended cycle from 3.16.2020 low with wave I at 8047.06. The Index is now in the process of correcting this 3 year rally in wave II. The internal subdivision of wave II is unfolding as a zigzag Elliott Wave structure. A zigzag structure is a 5-3-5 structure with ((A))-((B))-((C)) as the label. Wave ((A)) and ((C)) in this case subdivides into 5 waves impulse. In the 1 hour chart below, FTSE is still within wave ((A)) of II with subdivision as 5 waves. Down from wave I, wave 1 ended at 7978.61 and wave 2 ended at 8020.13.
The Index then resumes lower in wave 3 towards 7870.39, and wave 4 ended at 7949.97. Final leg lower wave 5 ended at 7854.82 which completed wave (1). Rally in wave (2) ended at 7976.48 with subdivision as a zigzag structure. Up from wave (1), wave A ended at 7950.69 and pullback in wave B ended at 7875.03. Wave C higher ended at 7976.48 which completed wave (2). The Index resumes lower in wave (3). Down from wave (2), wave 1 ended at 7897.45 and rally in wave 2 ended at 7959.77. Expect the Index to extend lower 1 more time to end wave 3, then it should rally in wave 4 and extends lower again. Near term, as far as pivot at 7976.48 high stays intact, expect rally to fail in 3, 7, or 11 swing.
FTSE Elliott Wave Chart
FTSE Elliott Wave Video
https://www.youtube.com/watch?v=CpkPlMFQBSs
Sharp ‘Post-SVB’ Repositioning Continued Unabatedly
Markets
Yesterday, the sharp ‘post-SVB’ repositioning, especially on interest rates markets, continued unabatedly even as US authorities during the weekend took measures to protect depositors and facilitated more easy refinancing for banks that face negative asset valuations due to the global rise in yields/inversion of the yield curves. However, in a first reaction, it didn’t help to prevent investors from scaling back exposure to the financial sector inside and outside the US. This outflow triggered a further run to safe haven assets. Especially US short term yields again tumbled sharply (2-y closed at 4.19%, minus 61 bpn) in a steeping move. Declines further out were more modest (10-y minus 12.5 bps). The 30-y even closed little changed (0.3 bps). The US 10-y real yield again lost about 8.5 bps. Money markets now only discount one additional Fed rate hike this month or at the May meeting. German yields showed a similar picture tumbling between 40.7 bps (2-y ) and 9.6 bps (30-y). Declines in EMU swap yields were more modest (from -24.3 bps to -9.6 bps) suggesting that at least part of move was due to safe haven flows and not fully the result of a change in expectations on ECB policy going forward. Markets see about a 50/50 chance between a 25 and a 50 bps ECB rate hike this week and a peak policy rate in the 3.25/3.50% area. Even despite recent turmoil, we don’t see a strong case for the ECB to deviate from its 50 bps guidance. The Euro Stoxx 50 still lost more than 3.0%. US indices finally entered calmer waters (Dow -0.28%, Nasdaq +0.45%). The dollar underperformed the other majors (close EUR/USD 1.0731, USD/JPY 133,21, DXY 103.60). Sterling outperformed as UK short-term yields declined less compared to the US or EMU (EUR/GBP close 0.881).
The risk-off continues in Asia with Japan (Topix -2.7%) and Korea underperforming and China outperforming (CSI 300 -0.25%). Japanese yields also dropped sharply (10-y at 0.28% vs still testing the 0.50% barrier early Friday). 2-y US Treasuries still trade extremely volatile (currently little changed, initially +20 bps). The dollar regains a few ticks (EUR/USD 1.07, USD/JPY 133.55). Later today, the US February CPI will be released. Until recently it was supposed to provide decisive guidance on whether the Fed should raise rates next week by 25 or 50 bps. Both for core and headline CPI a monthly rise of 0.4% is expected. Headline Y/Y CPI is expected to ease to 6.0% (from 6.4%). Core is expected to decline only marginally (5.5% from 5.6%). Financial stability probably will prevail as a driver for markets. Even so, especially in case of a CPI in line or above expectations, the Fed is at risk of facing another credibility issue if it would abruptly call an end to its anti-inflation campaign. In current environment, higher than expected inflation highlighting the need for more tightening, won’t be good news for risk assets. Even in case of a countermove/ rebound in short-term US yields, will doubt it will be a big support for the dollar. UK labour market data this morning were solid (monthly payrolls + 90k; employment rate 3.7%, Average weekly earnings +5.7%). EUR/GBP is slipping below the 0.88 big figure.
News and views
China has taken another step in returning to pre-Covid normality. It will reopen its borders to foreign tourists for the first time since the outbreak by restoring the issuance of all types of visas from tomorrow on. It’s the last cross-border control measure that was in place and should help boost tourism and growth by removing it. In 2022 some 116 million cross-borders trips were made in and out China with foreigners accounting for only 4.5 million. In 2019, before Covid arrived, 670 million trips were registered with almost 100 million coming on the account of foreigners. China’s new premier Li Qiang hailed China’s less than two months “smooth transition” from zero-Covid to normality. USD/CNY this morning gains slightly, mainly as the dollar regained a bid after selling of for two days. The pair trades around 6.87.
Euro area finance ministers on Monday backed last week’s recommendation of the Commission to start tightening fiscal policy. They said that while there is uncertainty surrounding the outlook, risks to growth appear more balanced than previously. In a context of high inflation and tighter financing conditions, they added that broad-based fiscal stimulus to aggregate demand is not warranted. Instead member states should pursue prudent fiscal policies over 2023-2024 aimed at ensuring medium-term debt sustainability.
GBP/JPY Daily Outlook
Daily Pivots: (S1) 160.57 (P) 161.82; (R1) 163.58; More...
GBP/JPY recovered notably after dipping to 160.02 and intraday bias is turned neutral first. Outlook is unchanged that fall from 165.99 is probably developing into another falling leg of the corrective pattern from 172.11. Risk will stay on the downside as long as 165.99 resistance holds. Below 160.02 will target 156.70 support first, and then 155.33 low.
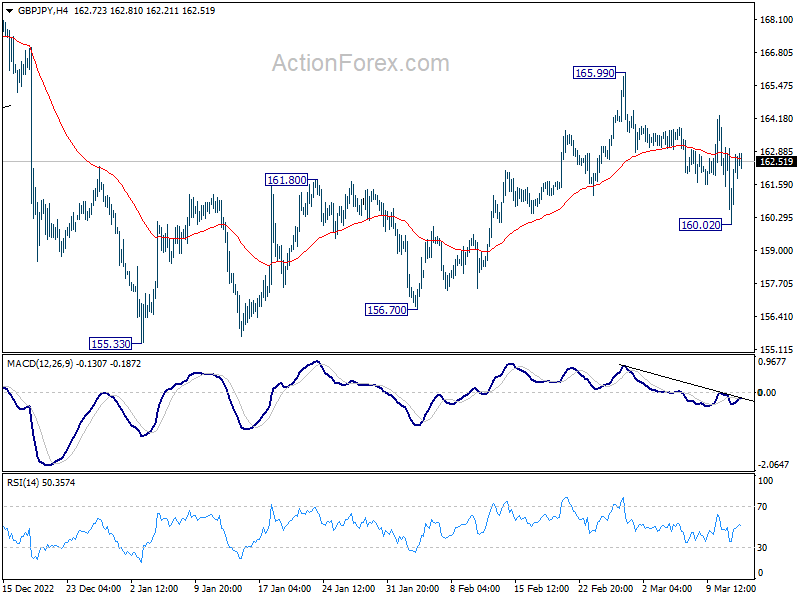
In the bigger picture, as long as 38.2% retracement of 123.94 (2020 low) to 172.11 (2022 high) at 153.70 holds, medium term bullishness is retained. That is, larger up trend from 123.94 (2020 low) is still in progress. Break of 172.11 high to resume such up trend is expected at a later stage.
EUR/JPY Daily Outlook
Daily Pivots: (S1) 141.46; (P) 142.93; (R1) 144.47; More....
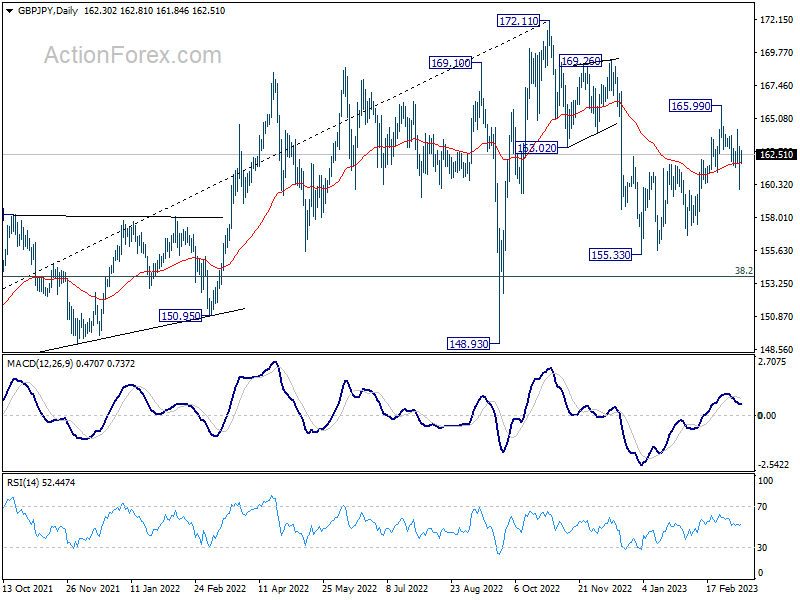
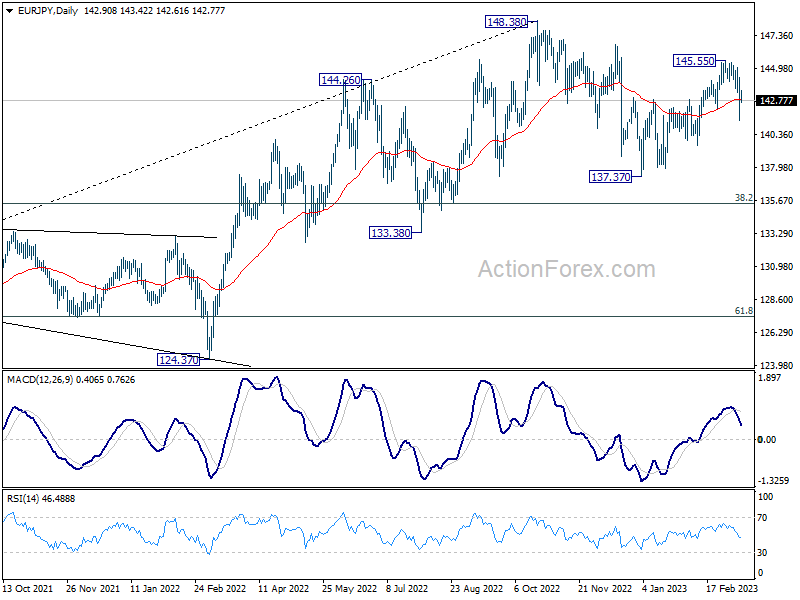
EUR/JPY recovered notably after dipping to 141.36 and intraday bias is turned neutral first. Outlook is unchanged that fall from 145.55 is probably developing into the the third leg of the corrective pattern from 148.3. Risk will stay on the downside as long as 145.55 resistance holds. Below 141.36 will target 139.54 support first. Firm break there will target a retest on 137.37 next.
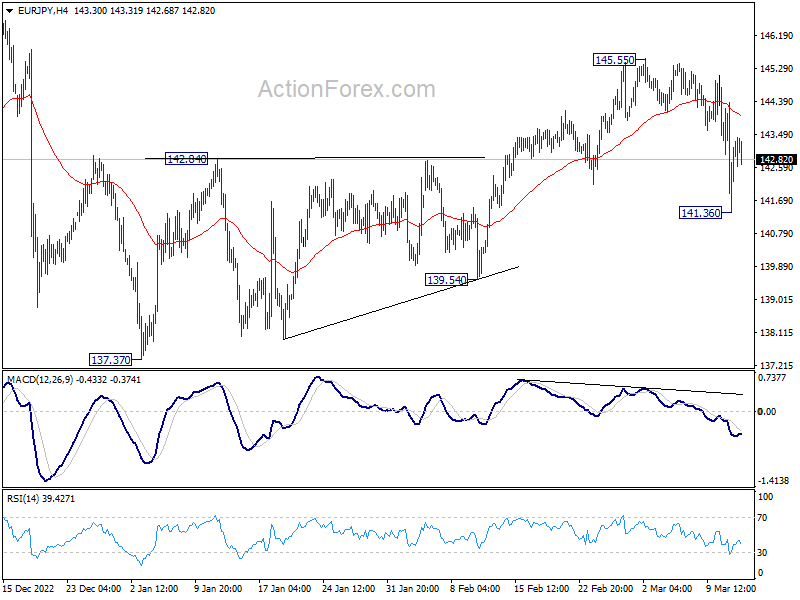
In the bigger picture, as long as 55 week EMA (now at 139.54) holds, larger up trend from 114.42 (2020 low) is still in progress for 149.76 long term resistance. However, firm break of 55 week EMA will bring deeper fall to 38.2% retracement of 114.42 to 148.38 at 135.40. Sustained break there will raise the chance of trend reversal, and target 61.8% retracement at 127.39.
EUR/GBP Daily Outlook
Daily Pivots: (S1) 0.8784; (P) 0.8824; (R1) 0.8848; More...
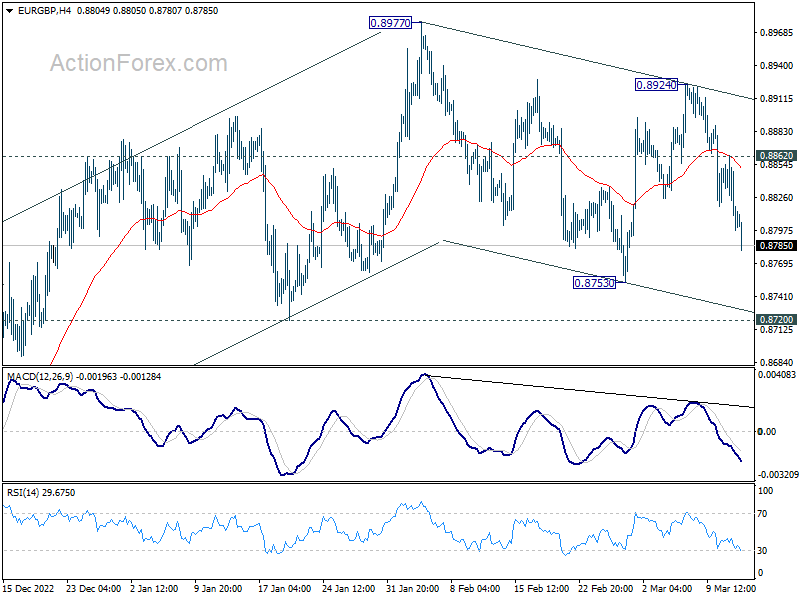
Intraday bias in EUR/GBP stays on the downside as fall from 0.8924 is extending. This decline is seen as the third leg of the corrective pattern from 0.8977. Deeper fall should be seen to 0.8753 support and below. But strong support is expected from 0.8720 to contain downside and bring rebound. On the upside, above 0.8862 minor resistance will turn intraday bias neutral again first.
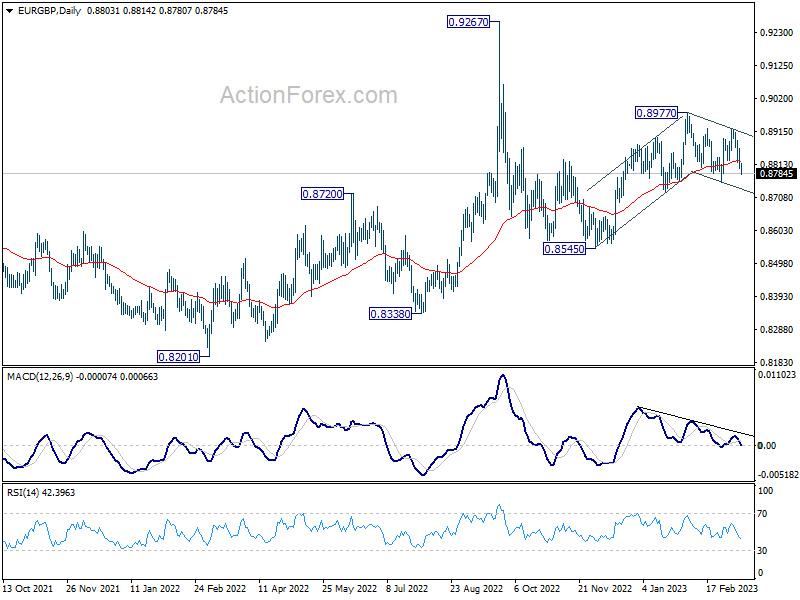
In the bigger picture, outlook is rather mixed for now, except that price actions from 0.9267 (2022 high) are part of the long term range pattern from 0.9499 (2020 high). With 0.8720 support intact, rise from 0.8545 is in favor to continue through 0.8977. However, firm break of 0.8720 will argue that such rebound has completed, and open up deeper fall through this support level.
EUR/AUD Daily Outlook
Daily Pivots: (S1) 1.5974; (P) 1.6094; (R1) 1.6216; More...
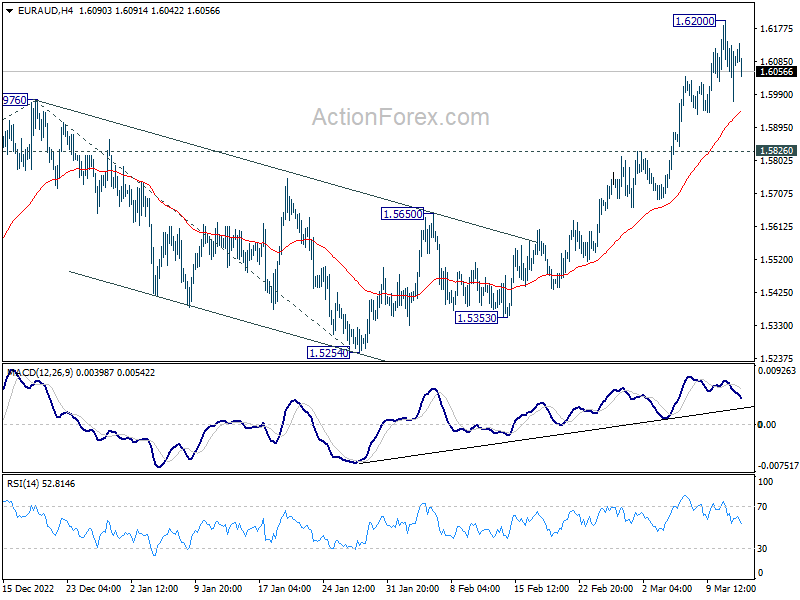
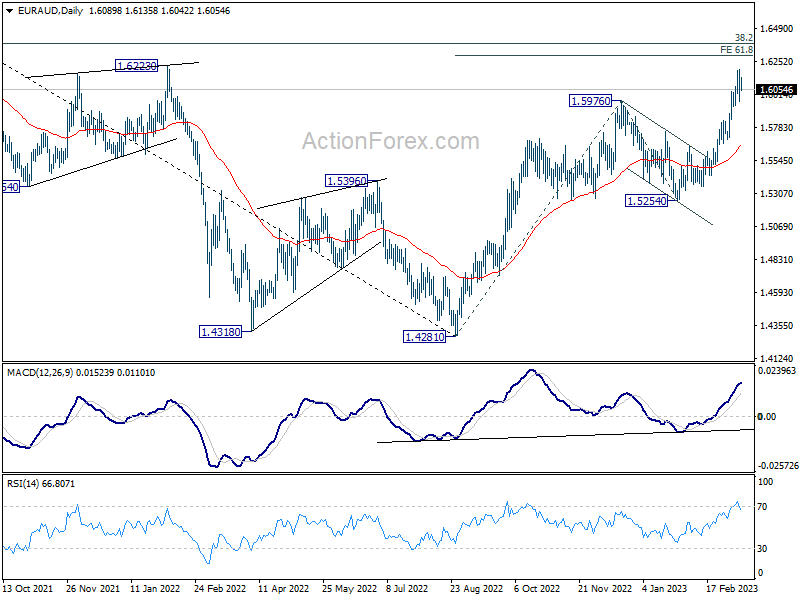
A temporary top is formed at 1.6200 in EUR/AUD with current retreat and intraday bias is turned neutral for consolidations. Downside of retreat should b contained by 1.5826 support to bring another rally. Break of 1.6200 will resume the larger rise from 1.4281 to 61.8% projection of 1.4281 to 1.5976 from 1.5254 at 1.6302 next.
In the bigger picture, the strong support from 55 week EMA (now at 1.5396) is raising the chance of bullish trend reversal. Focus is now on 1.6434 cluster resistance (38.2% retracement of 1.9799 to 1.4281 at 1.6389). Sustained break there should confirm that whole down trend from 1.9799 (2020 high) has completed. Further rally should then be seen to 61.8% retracement at 1.7691. However, rejection by this cluster resistance will make medium term outlook neutral at best.
EUR/CHF Daily Outlook
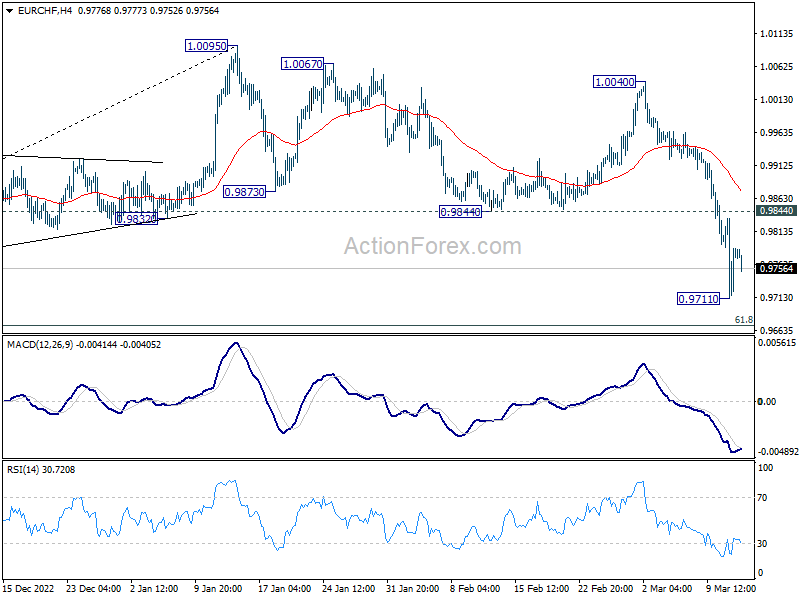
Daily Pivots: (S1) 0.9722; (P) 0.9778; (R1) 0.9843; More...
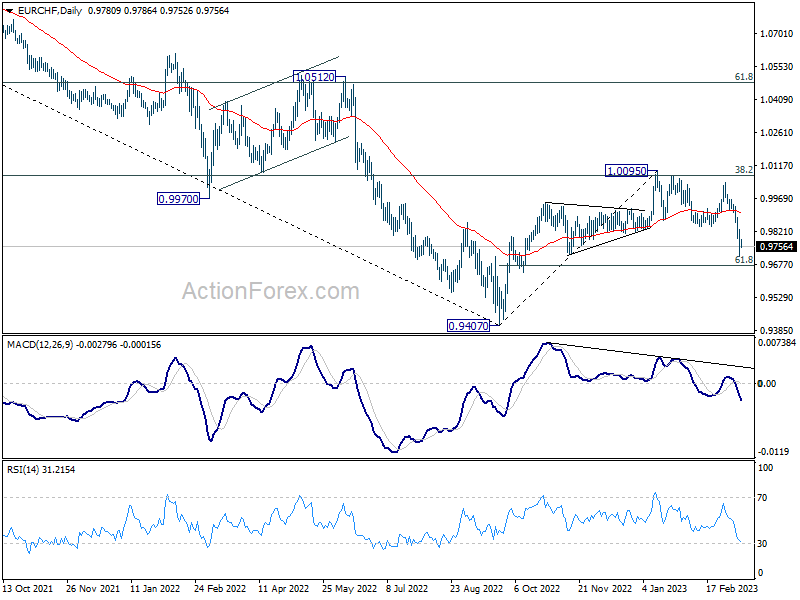
Intraday bias in EUR/CHF is turned neutral first as it recovered after hitting 0.9711. Upside of recovery should be limited by 0.9844 support turned resistance to bring another decline. As noted before, rebound 0.9407 could have completed at 1.0095 already. Below 0.9711 will target 61.8% retracement of 0.9407 to 1.0095 at 0.9670. Sustained break there will bring deeper fall to retest 0.9407 low. Overall, risk will stay on the downside as long as 55 day EMA (now at 0.9906) holds.
In the bigger picture, rejection by 55 week EMA (now at 1.0011) and 38.2% retracement of 1.1149 to 0.9407 at 1.0072 suggests that medium term outlook is staying bearish. That is, down trend from 1.2004 is not completed yet and is in favor to resume through 0.9407 at a later stage. For now, this will be the favored case as long as 1.0095 resistance holds.
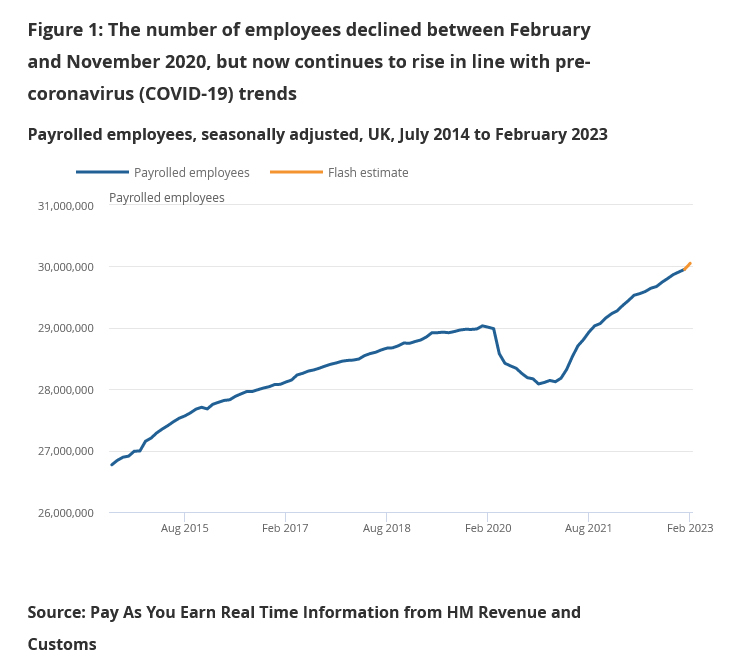
UK payrolled employment rose 98k in Feb, unemployment rate unchanged at 3.7% in Jan
In February, UK payrolled employment rose 98k or 0.3% mom. Comparing to the same month a year ago, payrolled employment rose 1040k or 3.6% yoy. Median monthly pay rose 6.7% yoy. Claimant count dropped -11.2k versus expectation of -12.4k.
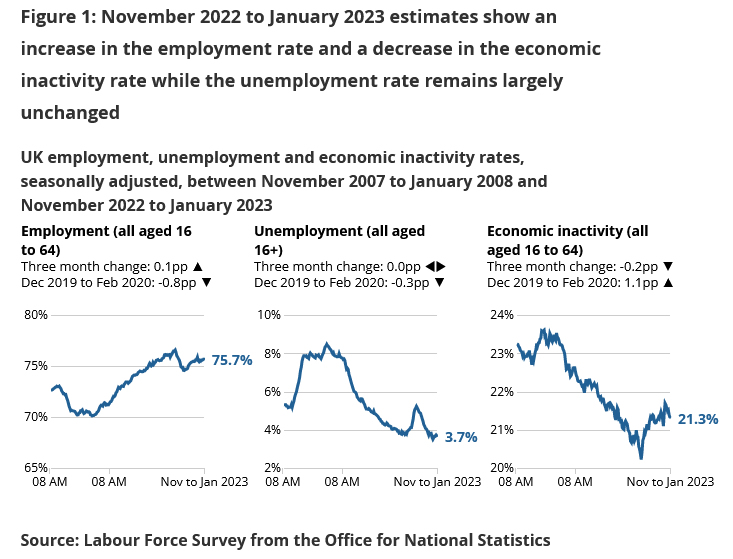
In the three month to January, unemployment rate was unchanged at 3.7%, better than expectation of a rise to 3.8%. Average earnings excluding bonus rose 6.5%, below expectation of 6.6%. Average earnings including bonus rose 5.7%, matched expectations.