Sample Category Title
UK Labour Market Remains Strong
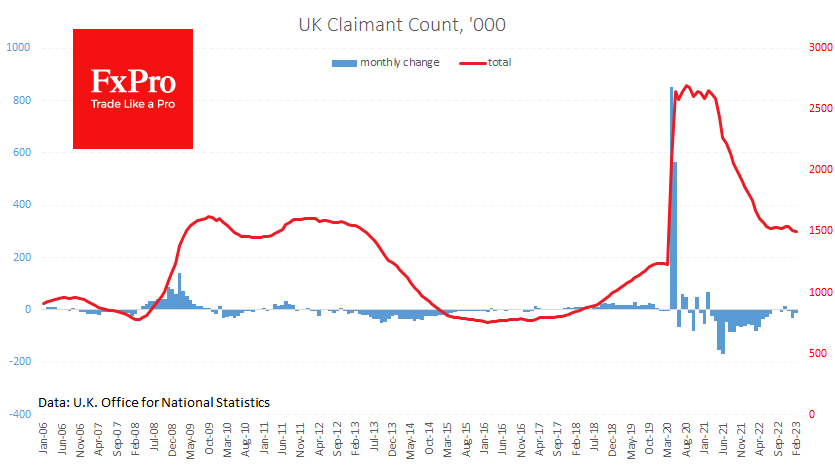
Unemployment claims in the UK fell by 11.2k in February, against analysts’ average forecast of a rise of 12.5K. Jobless claims have fallen by nearly 50K over the past three months after a sustained period of stabilisation, a sure sign that the economy is firmer than previously thought.
Unemployment remained at 3.7% in the three months to January, close to a nearly 50-year low. Demand in the labour market continues to push up wages. In the three months to January, earnings including bonuses, were 5.7% higher than a year earlier – below last year’s peak but well above the inflation target.
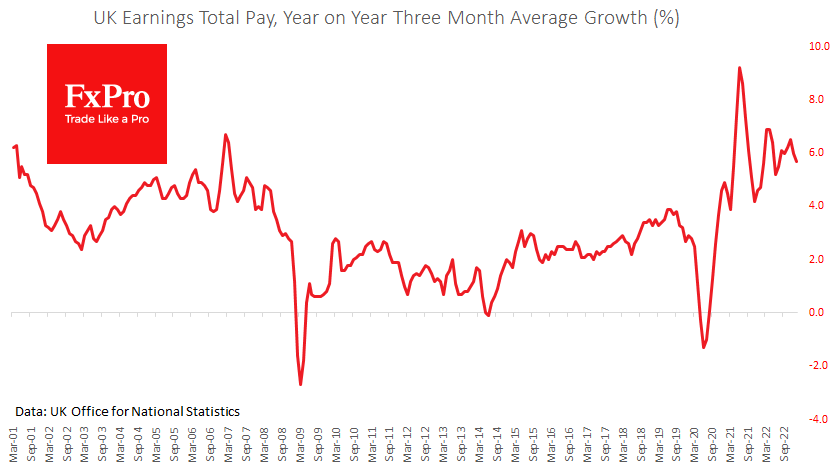
A very high earnings growth reinforces the expectation of further policy tightening by the Bank of England. Short-term market liquidity concerns drove yesterday’s repricing of market expectations for the rate. A surge in demand for short-term gilts indicates that markets are waiting for a significant tone softening.
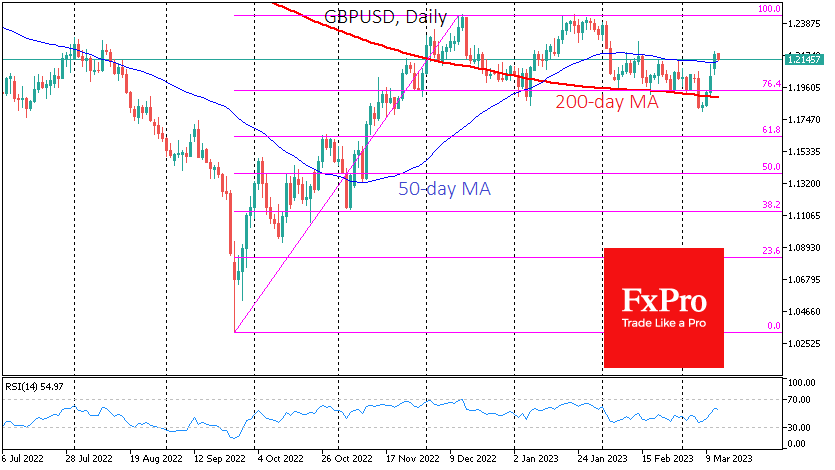
Robust employment data provides local support for the Pound, fueling the rally. The technical picture for the GBPUSD remains bullish. Late last week, the pair was bought on a break below the 200-day moving average, potentially ending a shallow correction and consolidation in the pair since the beginning of the year.
The pair closed above its 50-day average on Monday, confirming a bullish medium-term sentiment. The Pound may now have an open path to 1.2400, repeating the December and February highs. However, a solid move higher will likely require a divergence in monetary policy between the Bank of England and the Fed. We may get that divergence in the next few weeks if the UK continues struggling with inflation and the Fed suddenly shifts to banking sector problems.
British Pound’s Rally Fizzles as Markets Settle Down
The British pound has reversed directions after an impressive rally that saw GBP/USD climb 370 points. In the European session, GBP/USD is trading at 1.2154, down 0.24%.
US dollar recovers
The collapse of the Silicon Valley Bank (SVB) on Friday sent the financial markets into turmoil on Monday. US bank stocks declined sharply, while safe-haven gold powered higher. The US dollar retreated against the major currencies and the 2-year Treasury yield fell almost a full point. Tuesday has brought better news, as the markets appear to have settled down. The US dollar has regrouped and is higher against the majors.
There is an uneasy calm in the air, but that doesn’t necessarily mean that this latest crisis is behind us. Investors are on alert and will be very sensitive to new developments and any negative news could renew market volatility. The Fed and Treasury Department acted quickly to protect depositors and President Biden sent a reassuring message at an impromptu television address, but the collapse of the 16th largest lender in the US means it’s unlikely to be “business as usual” for some time.
It was just a week ago that Fed Chair Powell’s hawkish testimony on the Hill raised expectations of the Fed delivering a 50-bp increase at the March 22 meeting. Those expectations have vanished into smoke, with the markets now expecting a 25-bp hike, with an outside chance of a pause. We could see further market repricing after today’s CPI report, with headline CPI expected to fall to 6.0%, down from 6.4%.
In the UK, the employment report was within expectations. The unemployment rate remained at 3.7%, shy of the estimate of 3.8%. Hourly earnings fell to 5.7%, as expected, down from an upwardly revised 6%. The pound hasn’t reacted to the release and the data is unlikely to change minds at the Bank of England, which is expected to raise rates by 25 bp at the March 23 meeting.
GBP/USD Technical
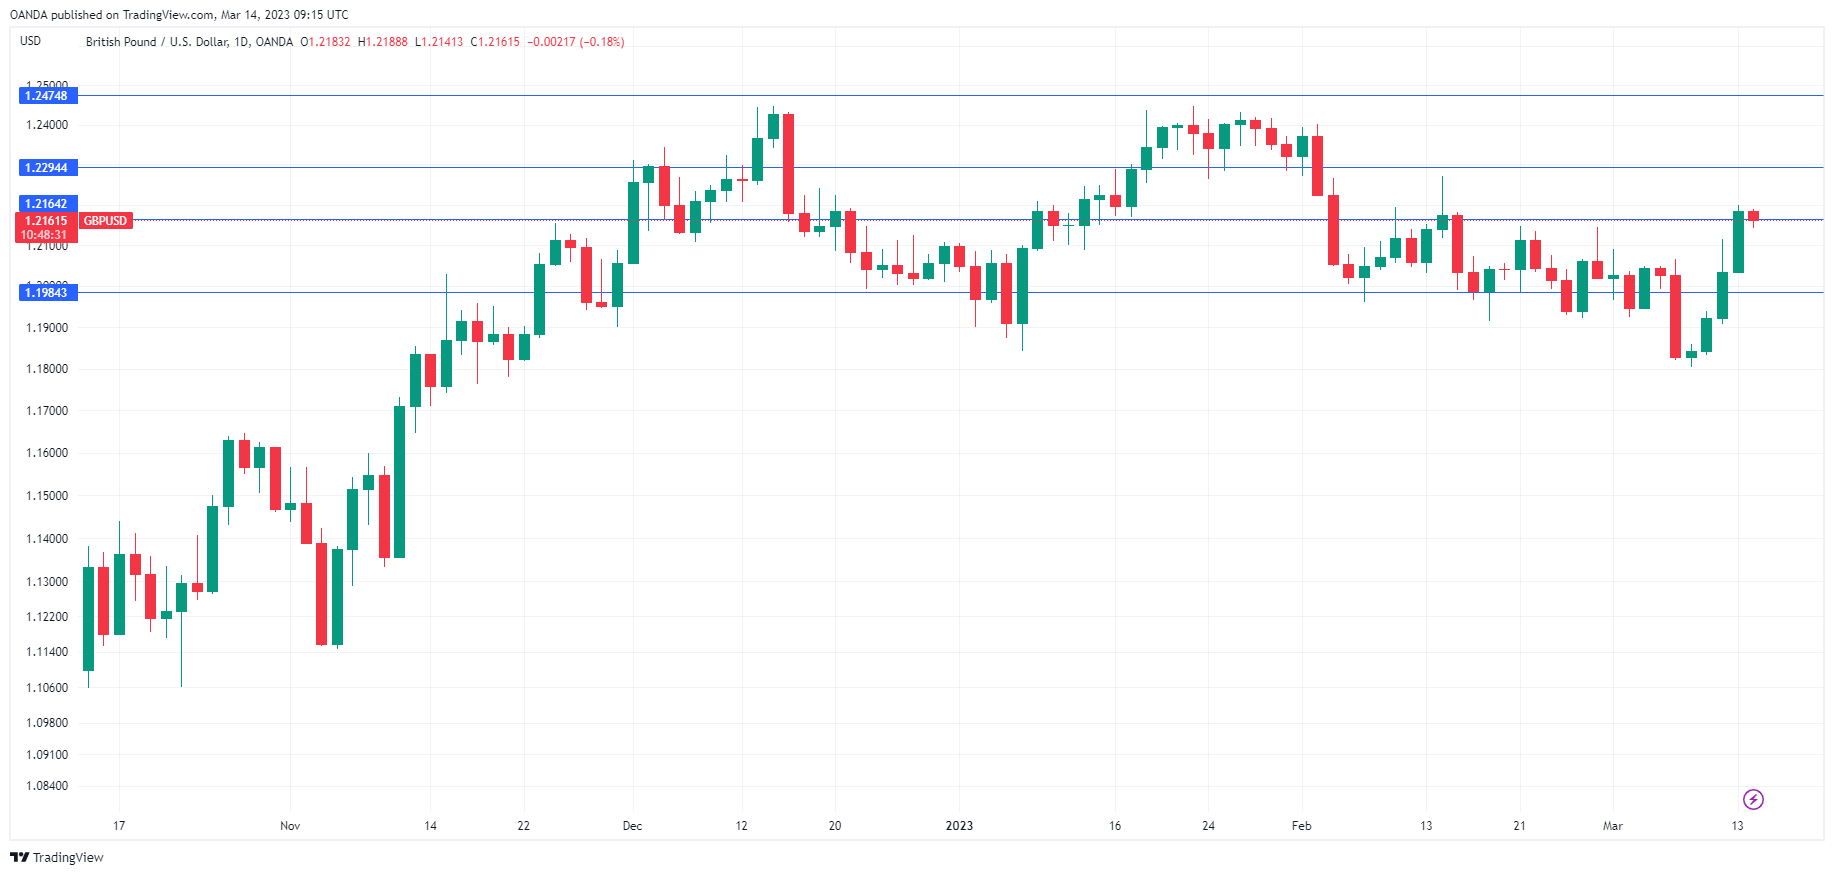
- GBP/USD tested resistance at 1.2113 earlier in the day. Above, there is resistance at 1.2294
- There is support at 1.1984 and 1.1854
USD/JPY: Bears Pausing Ahead of US Inflation Report
The USDJPY edges higher in early trading on Tuesday, after steep fall in past three days pushed the price to the lowest in one month.
Partial profit-taking lifts dollar as traders await today’s key event – release of US inflation report for February.
Economists expect US price growth to remain strong in February, with annualized inflation forecasted to grow by 6.0%, compared to 6.4% increase previous month while core inflation likely increased by 5.5% vs 5.6% in January.
The report comes one week ahead of Fed’s policy meeting and will provide an additional information to the central bank, after last week’s job report showed that the labor market is tight, though with cooling wage inflation.
Inflation remains Fed’s top priority but fresh turbulence in the markets after collapse of two reginal banks and subsequent measures taken by the government to prevent deeper crisis and eroding confidence in the banking system, mark another big problem that the US policymakers face.
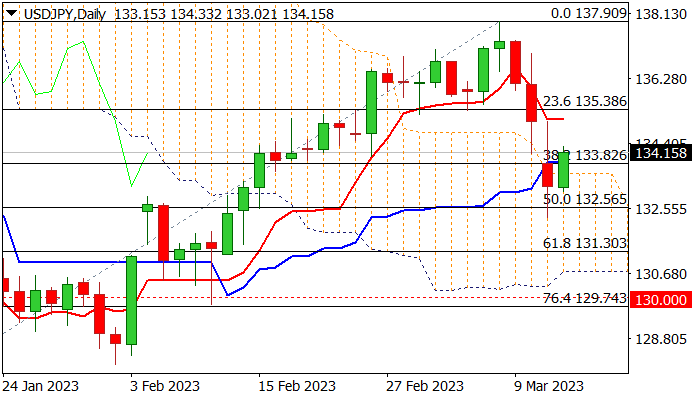
Daily chart shows prevailing bearish tone as 14-d momentum remains in negative territory and Monday’s close below significant support at 133.82 (Fibo 38.2% of 127.22/137.90) and within daily cloud (spanned between 130.74 and 133.55) generated bearish signal.
Weak tone is expected to persist as long as Monday’s gap remains unfilled, however bears would need firm break of cracked Fibo support at 132.56 (50% retracement of 127.22/137.90, reinforced by 55DMA) for confirmation.
Pivotal barrier lays at 135.04 (daily Tenkan-sen / last Friday’s closing price) and should cap extended upticks to keep near-term bias with bears.
Conversely, sustained break above 135.04 would sideline bears and shift near-term focus to the upside.
Res: 135.04; 135.38; 135.76; 136.51.
Sup: 133.82; 133.55; 133.02; 132.56.
US 100 Cash Index Hovers Above Key Level
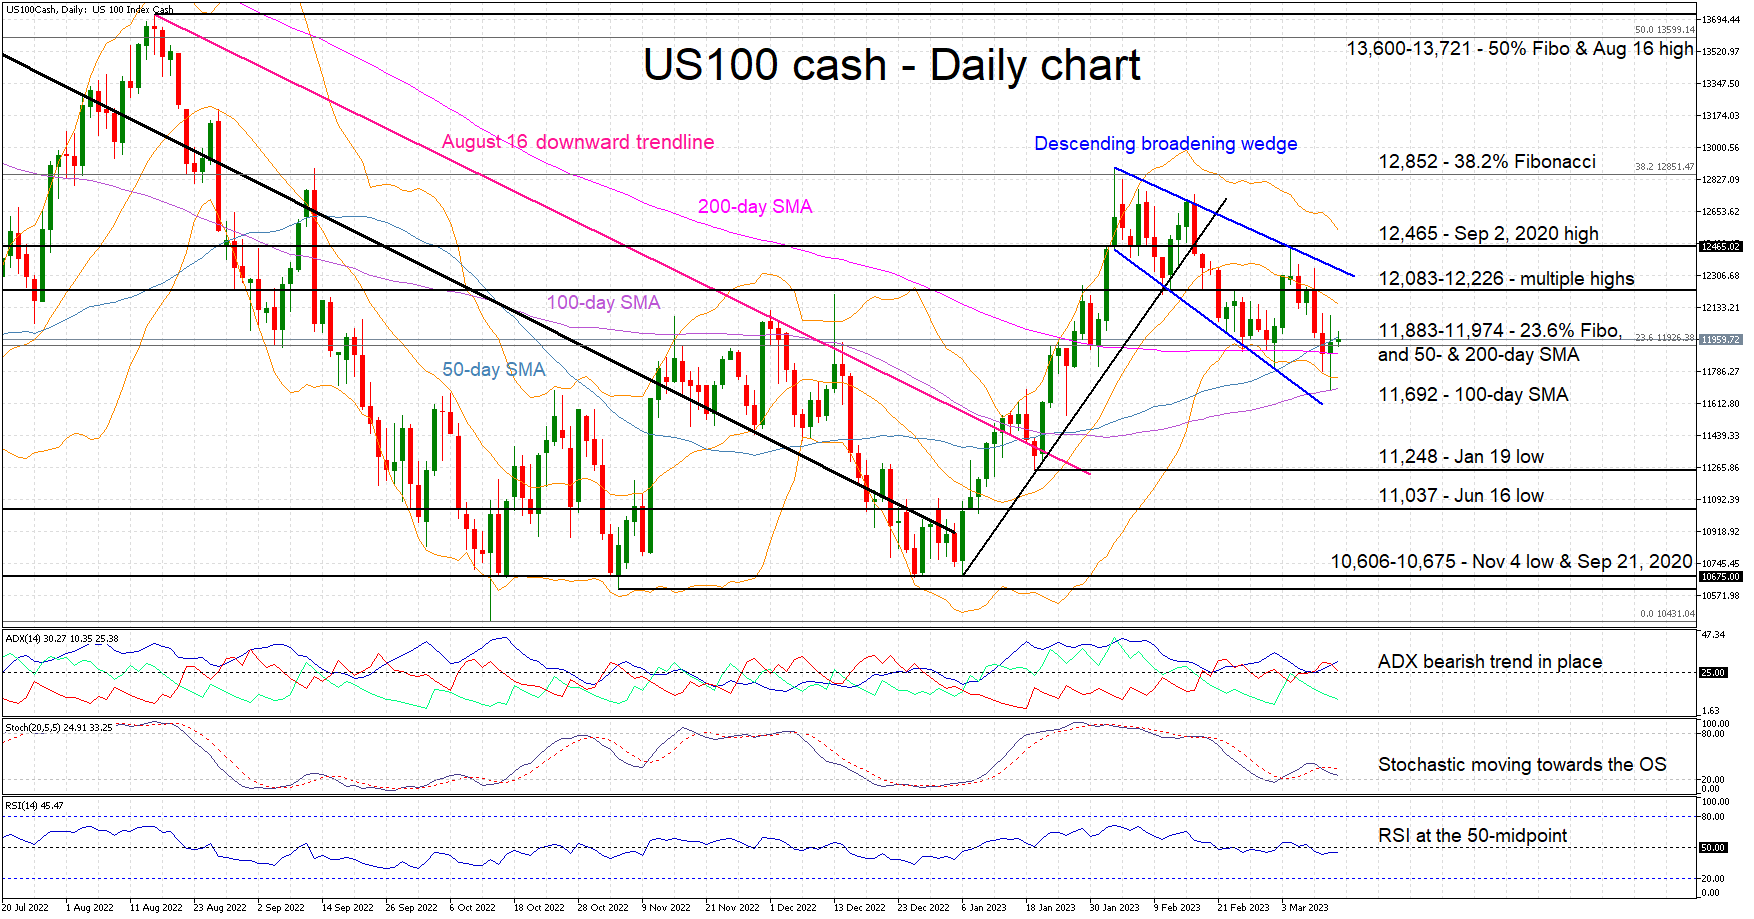
The US 100 cash index is trying to find a new balance following the recent market developments. It is currently trading above the 200-day simple moving average (SMA) and the 23.6% Fibonacci retracement level of the November 22, 2021 – October 13 downtrend. This is the second attempt from the bulls to resist the bearish pressure that is dominating market sentiment since the February 2 high of 12,894.
The bulls cannot rely on the Average Directional Movement Index (ADX) for support as this continues to signal a muted bearish trend. With the RSI hovering around its 50-midpoint, the burden once again falls on the stochastic oscillator. It is trying to drop back inside its oversold territory and potentially support another bearish move. Interestingly, a descending broadening wedge has been developing that could lend a helping hand to the bulls. This type of pattern tends to break upwards, but its performance improves significantly after a failed breakout on either side.
Should the bulls take the market reins, the first target would be at the 12,083-12,226 range set by multiple highs during 2020. Higher, the September 2, 2020 high of 12,465 could trouble the bulls before they potentially set their eyes on the 38.2% Fibonacci retracement of 12,852.
On the other hand, the first goal for the bears remains the 11,883 level set by the 200-day SMA. If successful in breaking this level, they could have a look at the 100-day SMAs at 11,692, before aiming for the January 19 low of 11,248.
To sum up, the US 100 cash index is trying to stay above the 11,883-11,974 area as the bearish pressure appears to remain well in place.
GBPUSD Hovers Around 50-SMA as Advance Falters
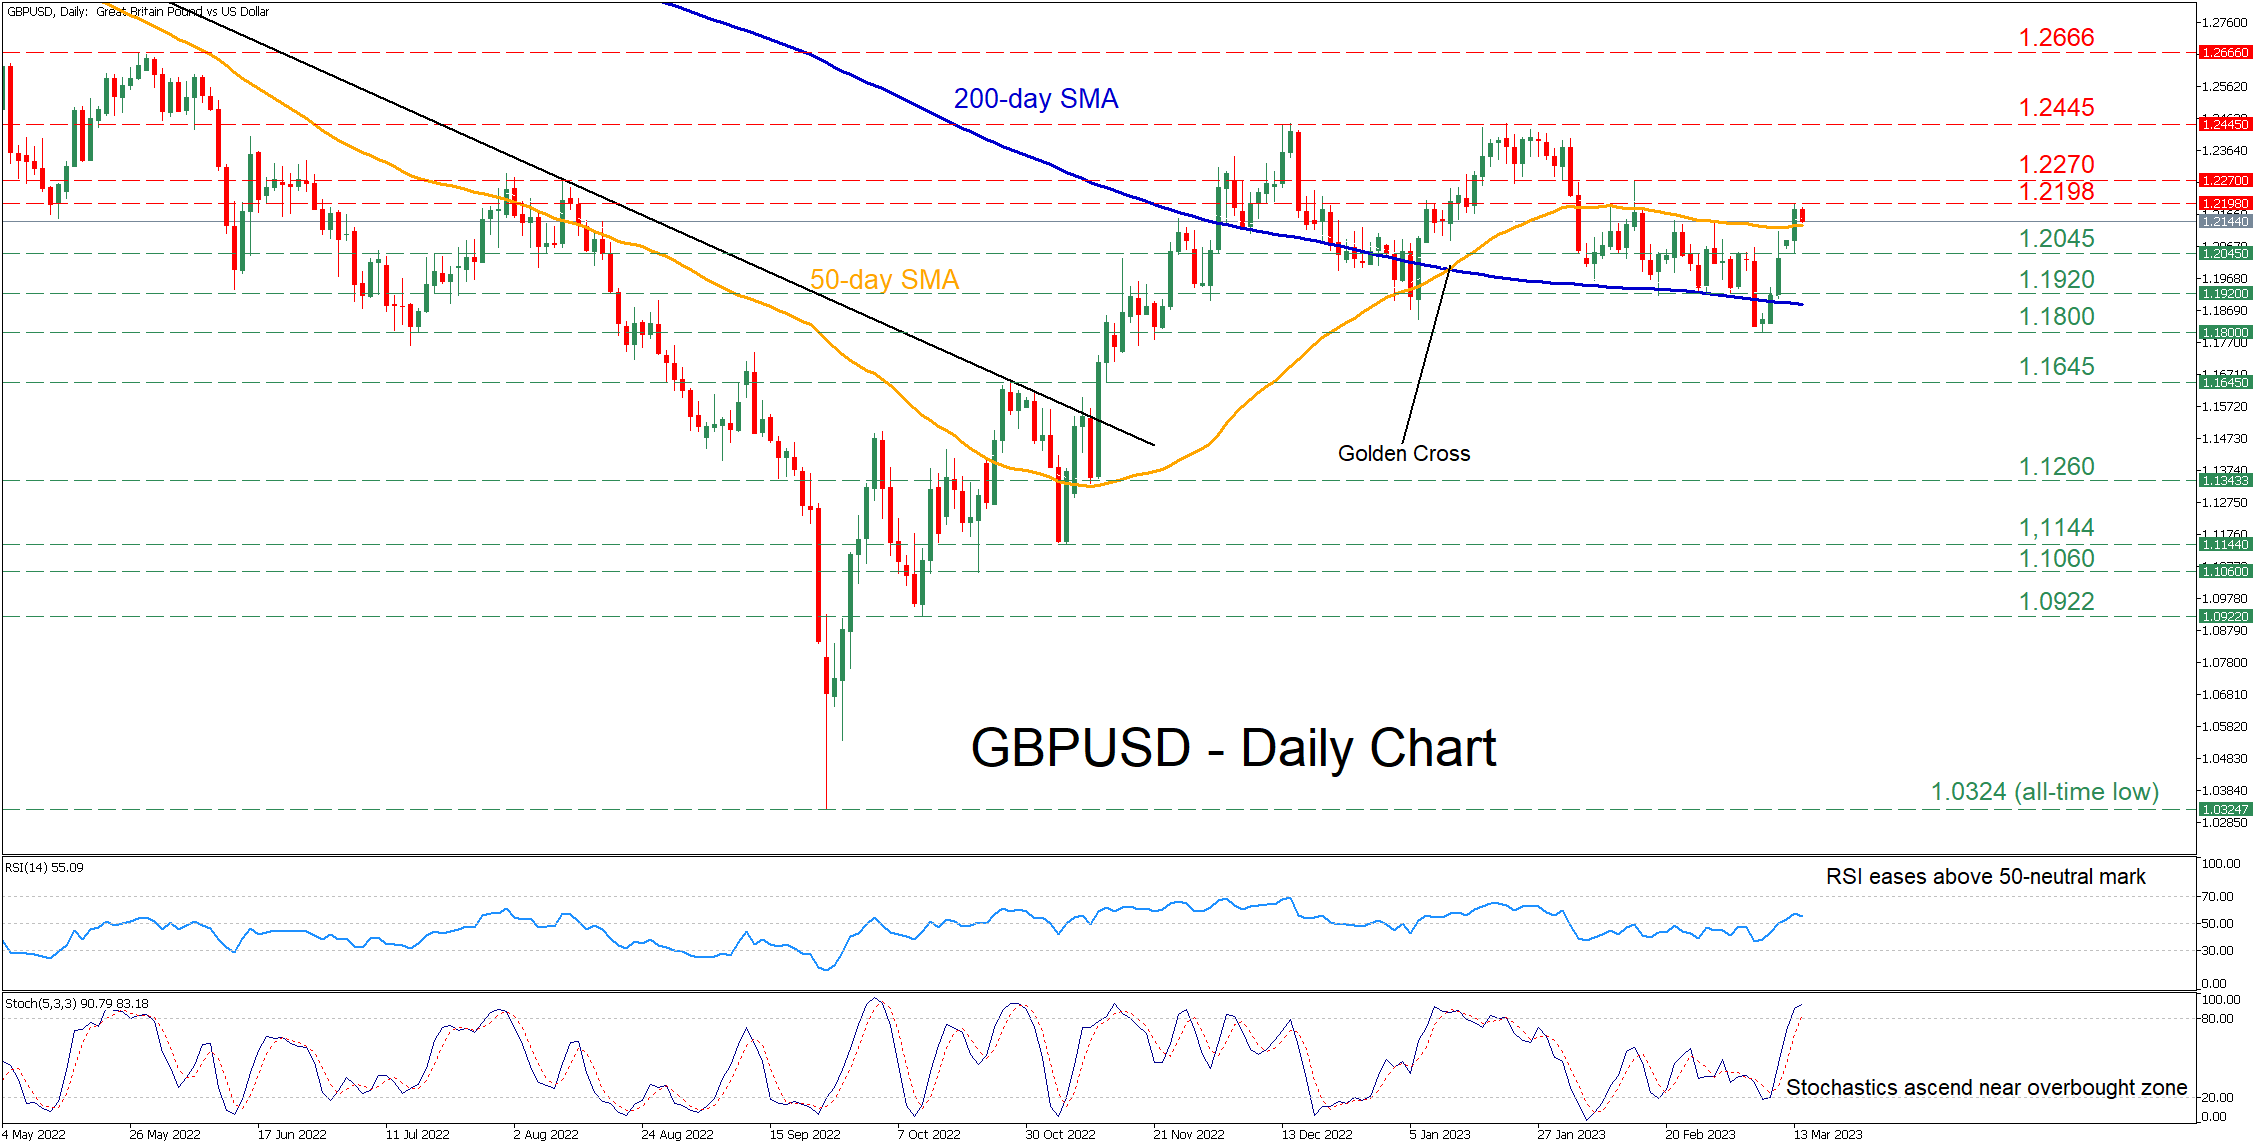
GBPUSD had been on a steady decline after its upside movement got rejected twice at the 1.2445 region. However, the pair has been gaining ground in the last few daily sessions, with the price jumping above its 50-day simple moving average (SMA) before paring some of its gains.
The momentum indicators currently suggest that near-term risks remain tilted to the upside. Specifically, the RSI has flatlined above its 50-neutral mark, while the stochastic oscillator is sloping upwards near its 80-overbought zone.
If the upside pressures persist, the pair could test the recent resistance of 1.2198. Conquering this barricade, the bulls might aim for 1.2270 before the crucial rejection zone of 1.2445 comes under examination. A break above the latter could turn the spotlight to the May high of 1.2666.
On the flipside, should the price reverse lower and dive beneath its 50-day SMA, the recent support of 1.2045 may act as the first line of defense. Sliding beneath that floor, the pair could descend towards 1.1920 or lower to test the 2023 bottom of 1.1800. If this barrier fails, further declines could cease at the October resistance of 1.1645, which could act as support in the future.
In brief, GBPUSD appears to have found traction after bouncing off its 2023 low, but the 50-day SMA has been acting as strong resistance. Hence, a clear close above this hurdle could open the door for more gains.
EURJPY Aims to Start its Next Bullish Wave
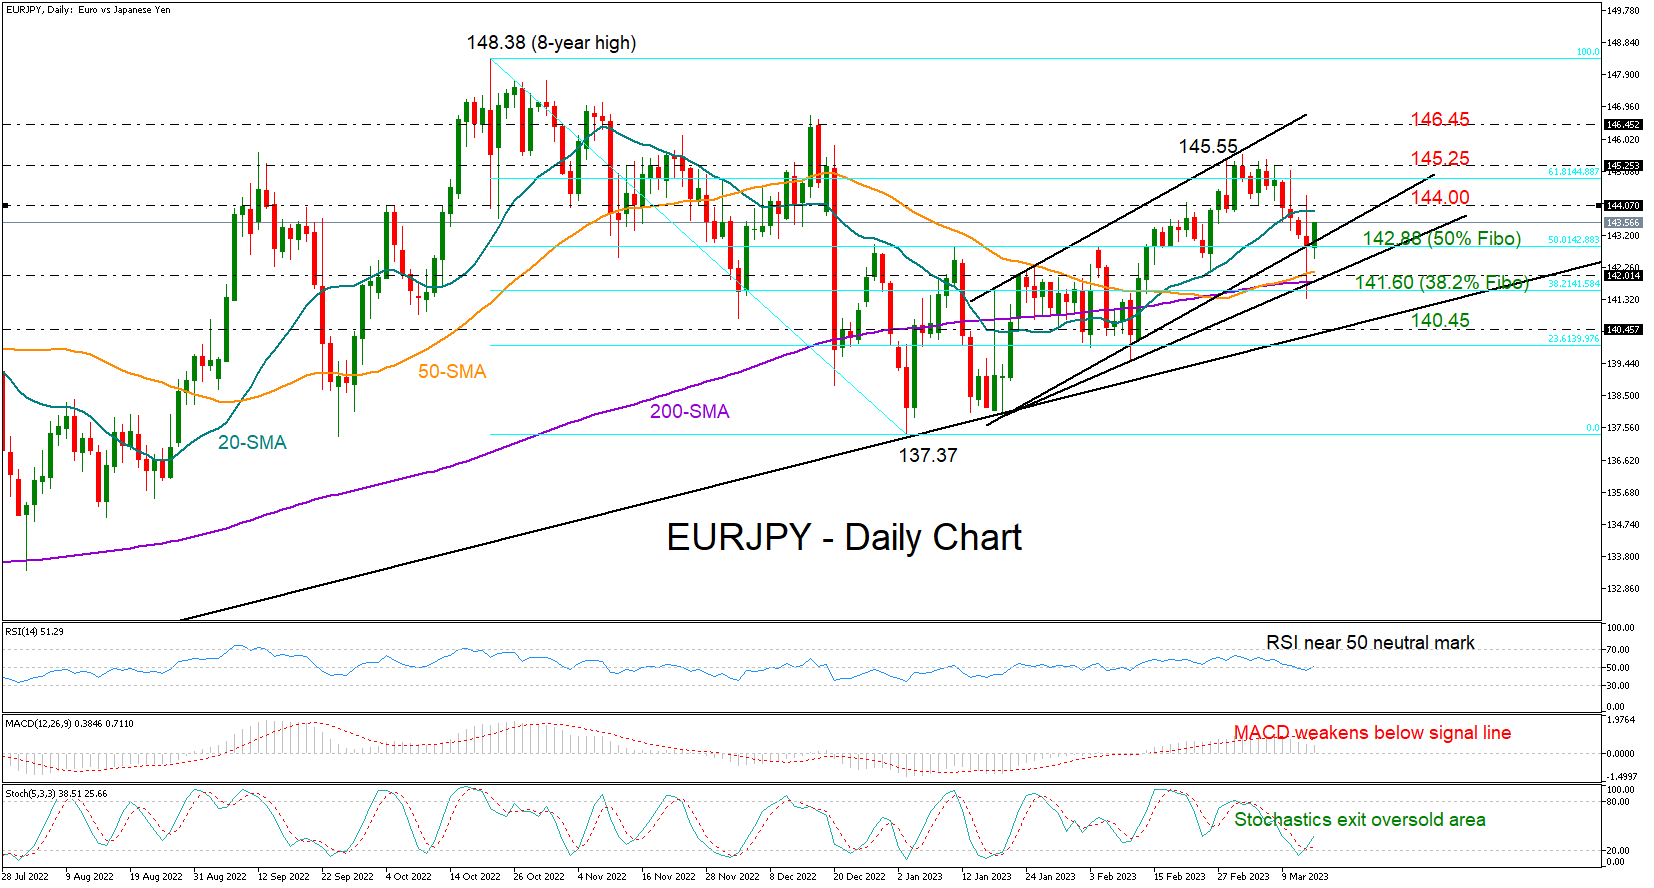
EURJPY minimized its gains and losses around the 142.90 level after an extremely volatile day within the 144.37-141.36 region on Monday.
Traders may pay special attention to the 142.90 area, which has been a key constraining zone since September and currently the lower boundary of a bullish channel. This is also where the 50% Fibonacci retracement of the 148.38-137.37 downleg is placed.
The technical signals are confusing at the moment as the RSI is fluctuating around its 50 neutral mark and the MACD keeps decelerating below its red signal line. That said, the stochastic oscillator is looking to exit the oversold area, and given that it was a better indicator of previous upside reversals, some recovery in the coming sessions cannot be excluded. It's also worthy to note that the 50-day SMA has avoided a bearish cross with the 200-day SMA, raising hopes that the uptrend from 137.37 may develop higher.
Hence, if the price stays within the channel, the spotlight will turn again to the 144.00 number. A successful penetration higher could trigger a rally towards the 145.20 resistance territory. Should the bulls persist, the recovery could pick up steam towards the channel's upper boundary at 146.45.
Alternatively, if the 142.90 base cracks, the focus will shift to the 200-day simple moving average (SMA) and the 142.00 number. Should the bears claim that zone, the decline could rump up towards the lower ascending trendline drawn from the 2022 low seen around 140.45. The 23.6% Fibonacci around 140.00 may come next under consideration.
Summing up, EURJPY is looking neutral in the short-term picture. A close below 142.90 could activate fresh selling orders, while a bounce above the 144.00 level is probably required to boost market sentiment.
USDCHF Reaction Lower From Equal Legs Area
Hello Traders, today we are going to have a look on how we were able to forecast the reaction lower in USDCHF from equal legs area. The pair was trading within cycle from 02.02.2023 similarly to the low of the USDX. It had ended first leg higher in A alongside a clear connector wave B. In this situation we could calculate where our equal legs area will be at.
Here at Elliott Wave Forecast we have developed a system in which allows us to project extreme areas of the market in which we can expect at minimum a 3 waves reaction off the area. This allows us to enter the market with a defined entry level and Stop Loss. Given the situation in USDCHF was within wave C of (B) higher in a 5 waves move.
Let’s have a look on how we saw it during 03.01.2023 4 hour update.
USDCHF 4 Hour update 03.01.2023
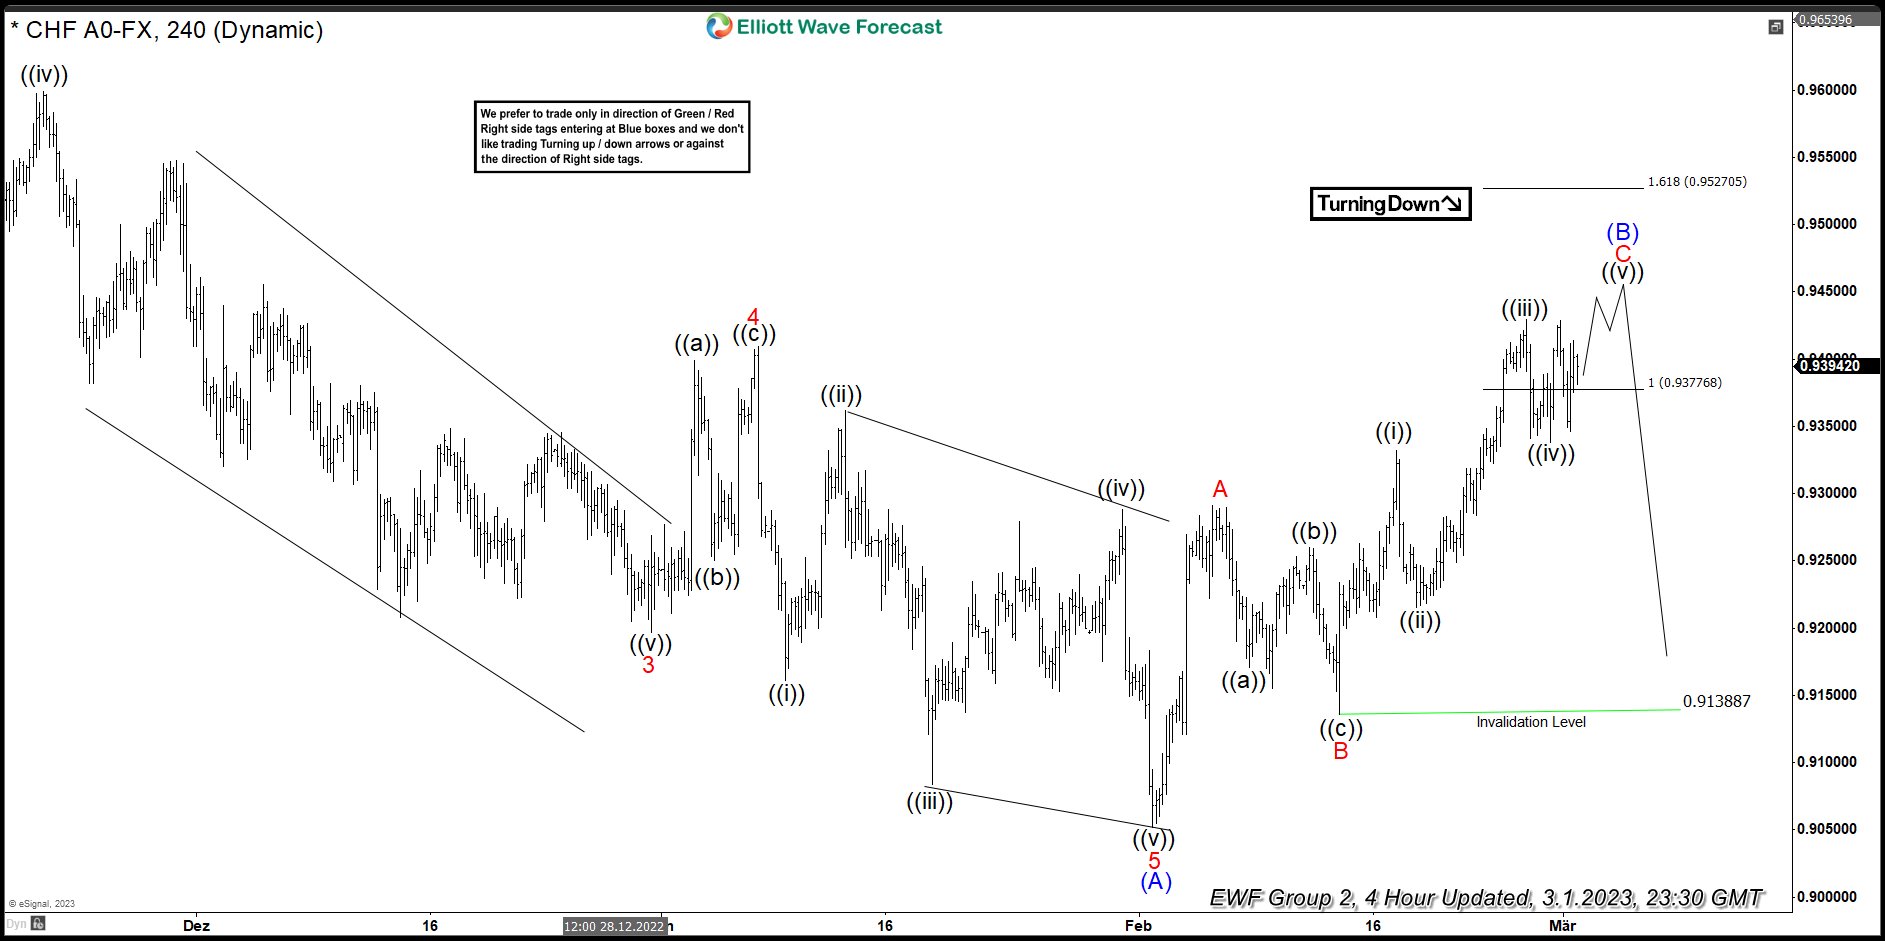
USDCHF Short-Term Elliott Wave Analysis 03.01.2023As we can see the pair was trading higher into wave ((v)) of C of (B) within the equal legs area of 0.93777 – 0.95270. This indicated that soon when wave ((v)) ends we should see the reaction lower from the area. Ideally wave (C) lower should get started.
Now let’s see what happened next looking at USDCHF 4 hour chart from today’s update of 03.13.2023
USDCHF 4 Hour update 03.13.2023
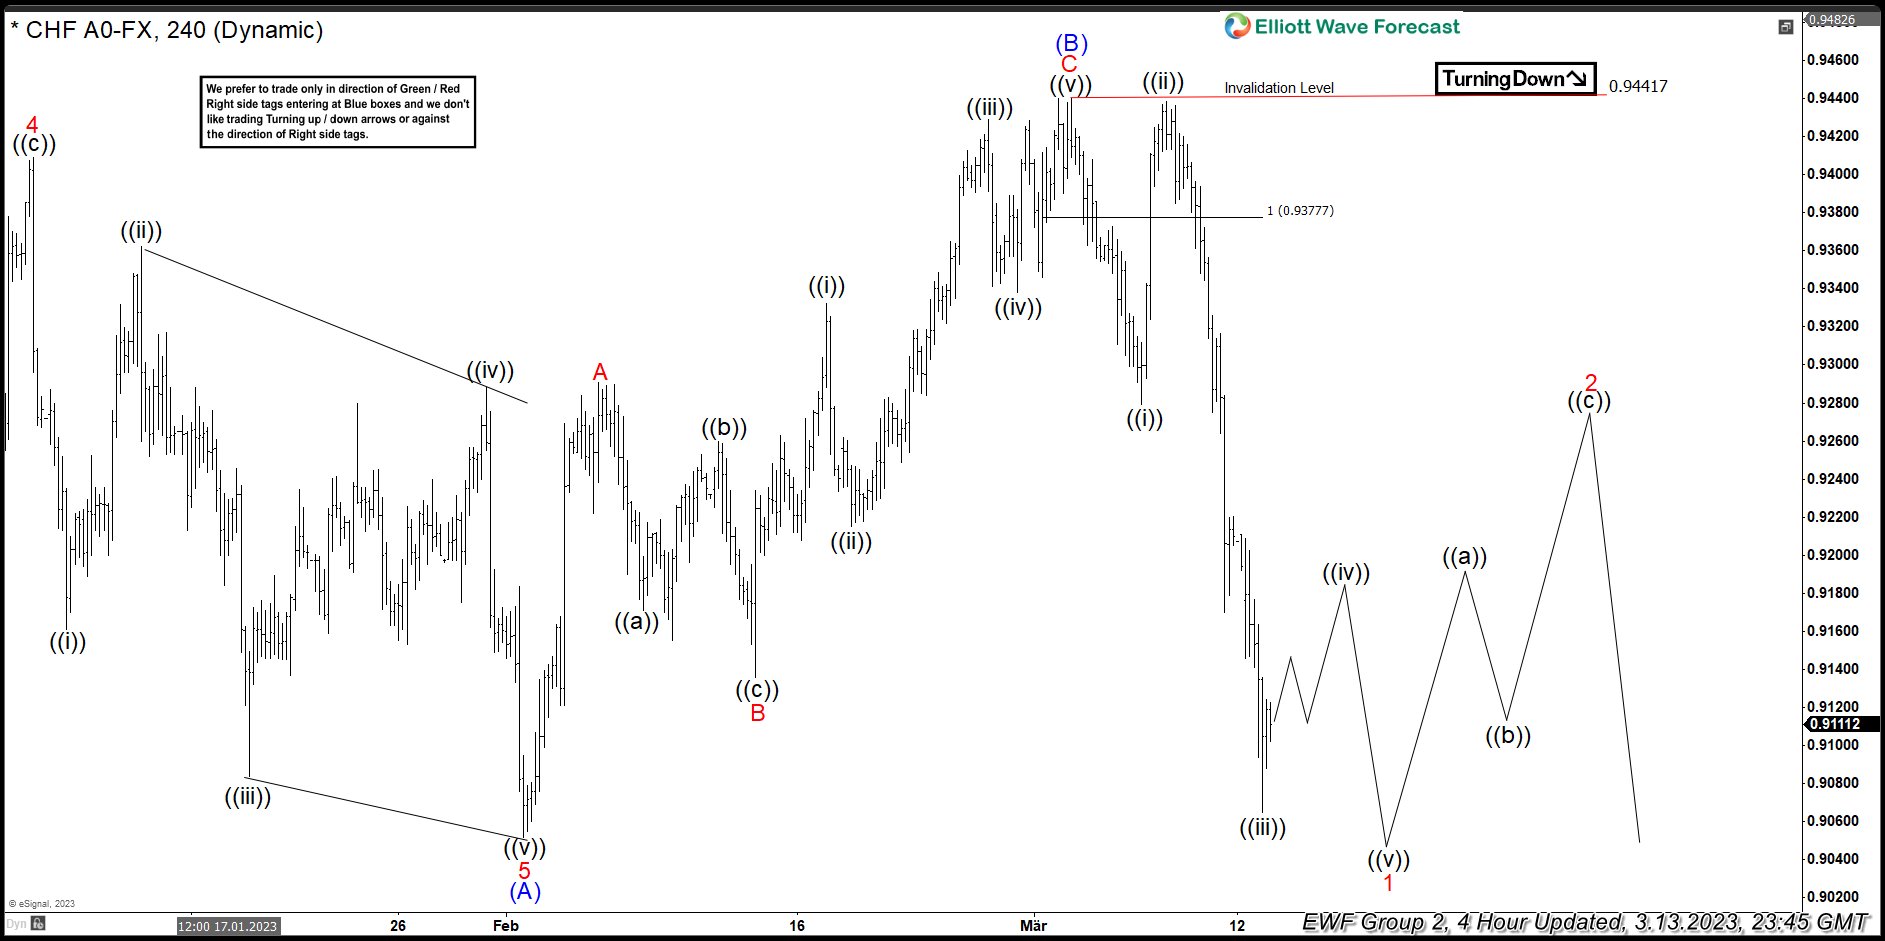
As we can see it has perfectly reacted lower and currently bouncing within wave ((iv)) favoring one more low in ((v)) to end wave 1 in red. From there we could expect wave 2 bounce and then fail for further downside in wave 3 of (C). USDCHF belongS to our Group 2 instruments amongst other instruments such as the CHFJPY, NZDJPY, Nasdaq Futures, ES Futures, NIKKEI, cryptos like Bitcoin, Ethereum and others alongside some commodities like Natural Gas and others.
Calm But for How Long
Some calm appears to have returned to financial markets in early trade in Europe this morning but how long will it last?
While everyone will be hoping that the turmoil that swept through markets since Friday is dealt with and behind us, I'm not sure anyone can say with any confidence that this is the case and investors will remain very sensitive to ongoing developments.
What's more, we've seen a dramatic repricing of interest rate expectations, to the extent that markets now price peak rates to be here or near and rate cuts this year to be highly likely. In much the same way that I wasn't convinced by pricing in the aftermath of Powell's appearances, barring much greater fallout in the financial system, I struggle to see expectations remaining so dovish.
The timing of today's inflation data is therefore all the more intriguing as, what was meant to be the dominant driver this week has fallen down the pecking order. But to what extent isn't clear. And depending on the outcome, it could either compound expectations or create an even greater headache for the Fed which will already be questioning whether a pause this month may be the best course of action.
Some good news for the BoE
The UK jobs data was largely in line with what markets were expecting and didn't really shift the dial in any significant way. The unemployment rate didn't tick higher as expected, remaining at 3.7%, but hourly earnings did soften to 5.7% including bonuses - from an upwardly revised 6% - while excluding bonuses they fell a little further to 6.5%.
All told, I don't think either aspect of the report will fuel or ease concerns at the Bank of England about inflation and the path for interest rates. Meanwhile, markets are still pricing in a 25 basis point hike over the next couple of meetings and the pound is only marginally softer than it was pre-release. Focus now shifts to the budget tomorrow and whether the Chancellor will use the new-found fiscal headroom or save it for later.
Wild fluctuations in oil
Oil prices are continuing to whipsaw while remaining within the broad ranges they've traded within since early December. Yesterday we saw Brent and WTI testing the lower end of these in response to the turmoil that erupted in the financial system that triggered widespread risk aversion.
Today we're seeing them trade lower again, albeit still higher than yesterday's lows. If we see markets settle down, that could prevent a break of the lows but oil traders, like those elsewhere, will remain nervous about the prospect of further turbulence. Suddenly, a break below the lows looks a much greater risk which may keep pressure on in the short term.
A strong rally
An extraordinary rally in gold over the last couple of sessions has seen it rebound almost 5% and move back above $1,900 which could have been a major barrier of resistance under normal circumstances. But that isn't what we're seeing at the moment and the dramatic decline in yields, combined with a softer dollar and clamor for safe havens sent the yellow metal soaring.
That may not last if markets correct themselves, assuming the dust settles, which could see interest rate expectations shift higher. Then there's today's CPI data which may refocus attention on the Fed's primary goal of price stability and the success it's having, or not, in driving inflation back to target. It promises to be another interesting day for gold.
AUD/USD: Two Parts are Needed to Complete the Bearish Impulse
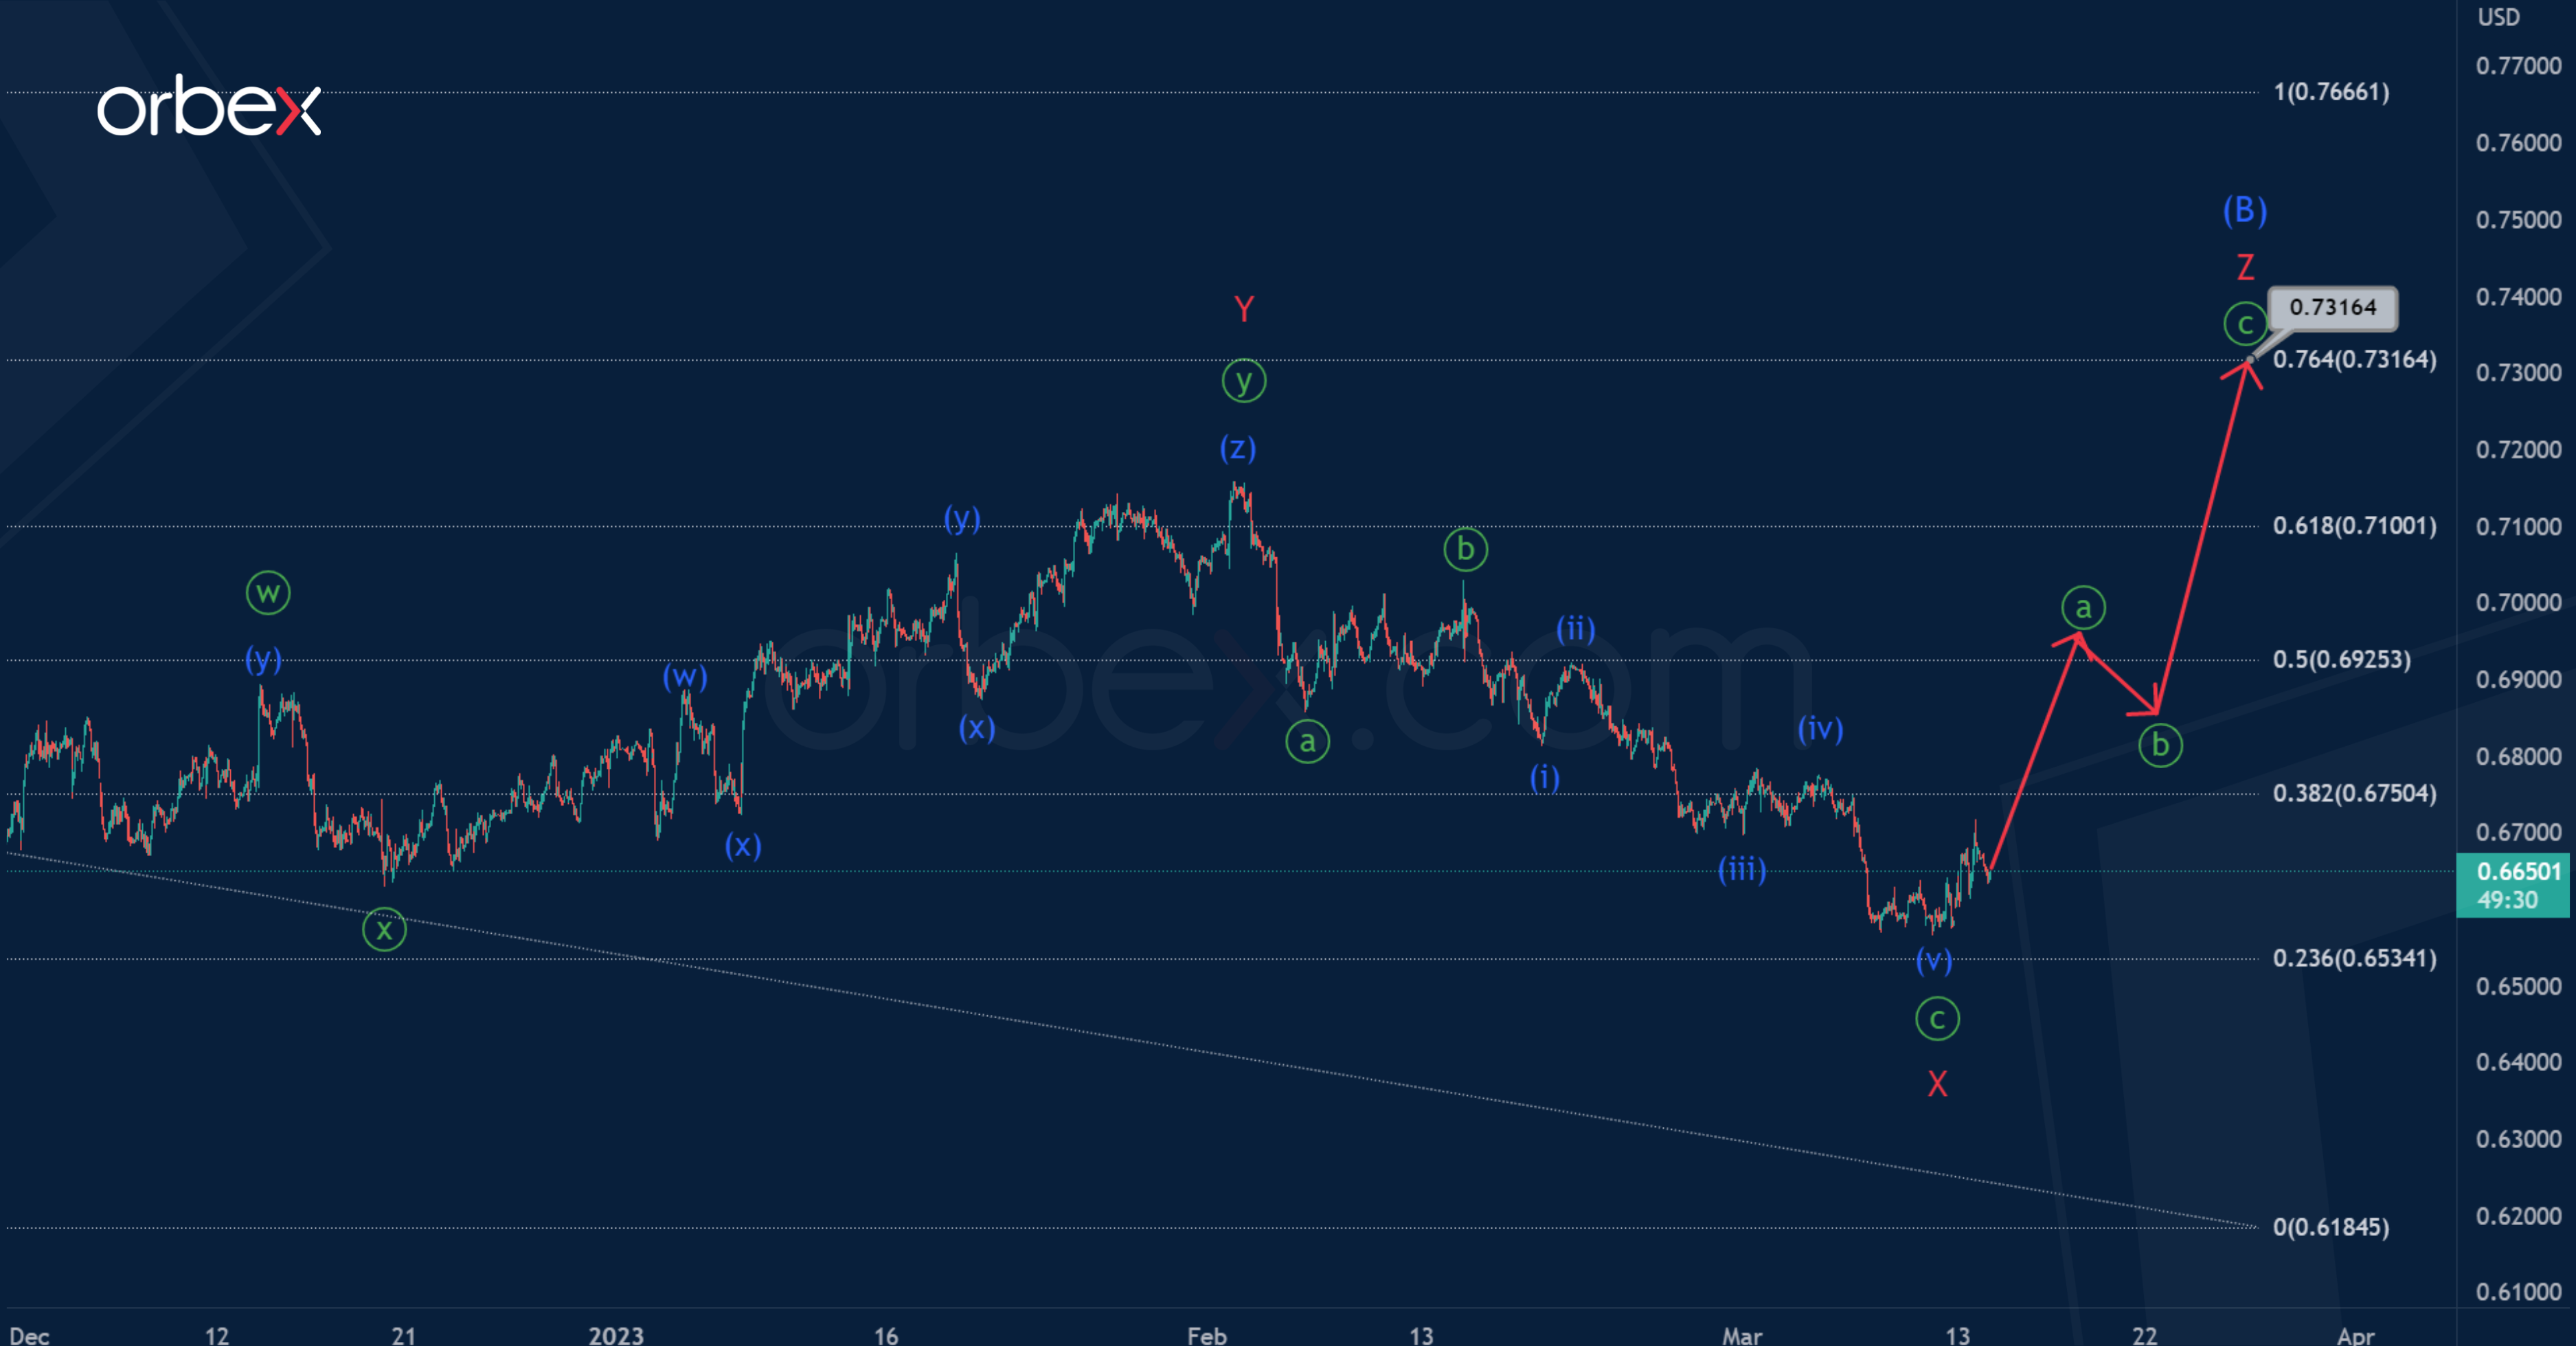
There is a high probability that the AUDUSD currency pair forms a global correction b of the cycle degree, which may soon end in the form of a primary double zigzag Ⓦ-Ⓧ-Ⓨ.
As part of the actionary wave Ⓨ, two parts can be completed – an impulse (A) and an intermediate correction (B) in the form of a triple zigzag W-X-Y-X-Z.
On the last section of the chart, the second half of the final impulse (C) can be built, consisting of minor sub-waves 1-2-3-4-5.
It is assumed that impulse (C), like the previous impulse (A), will end at a minimum of 0.617.
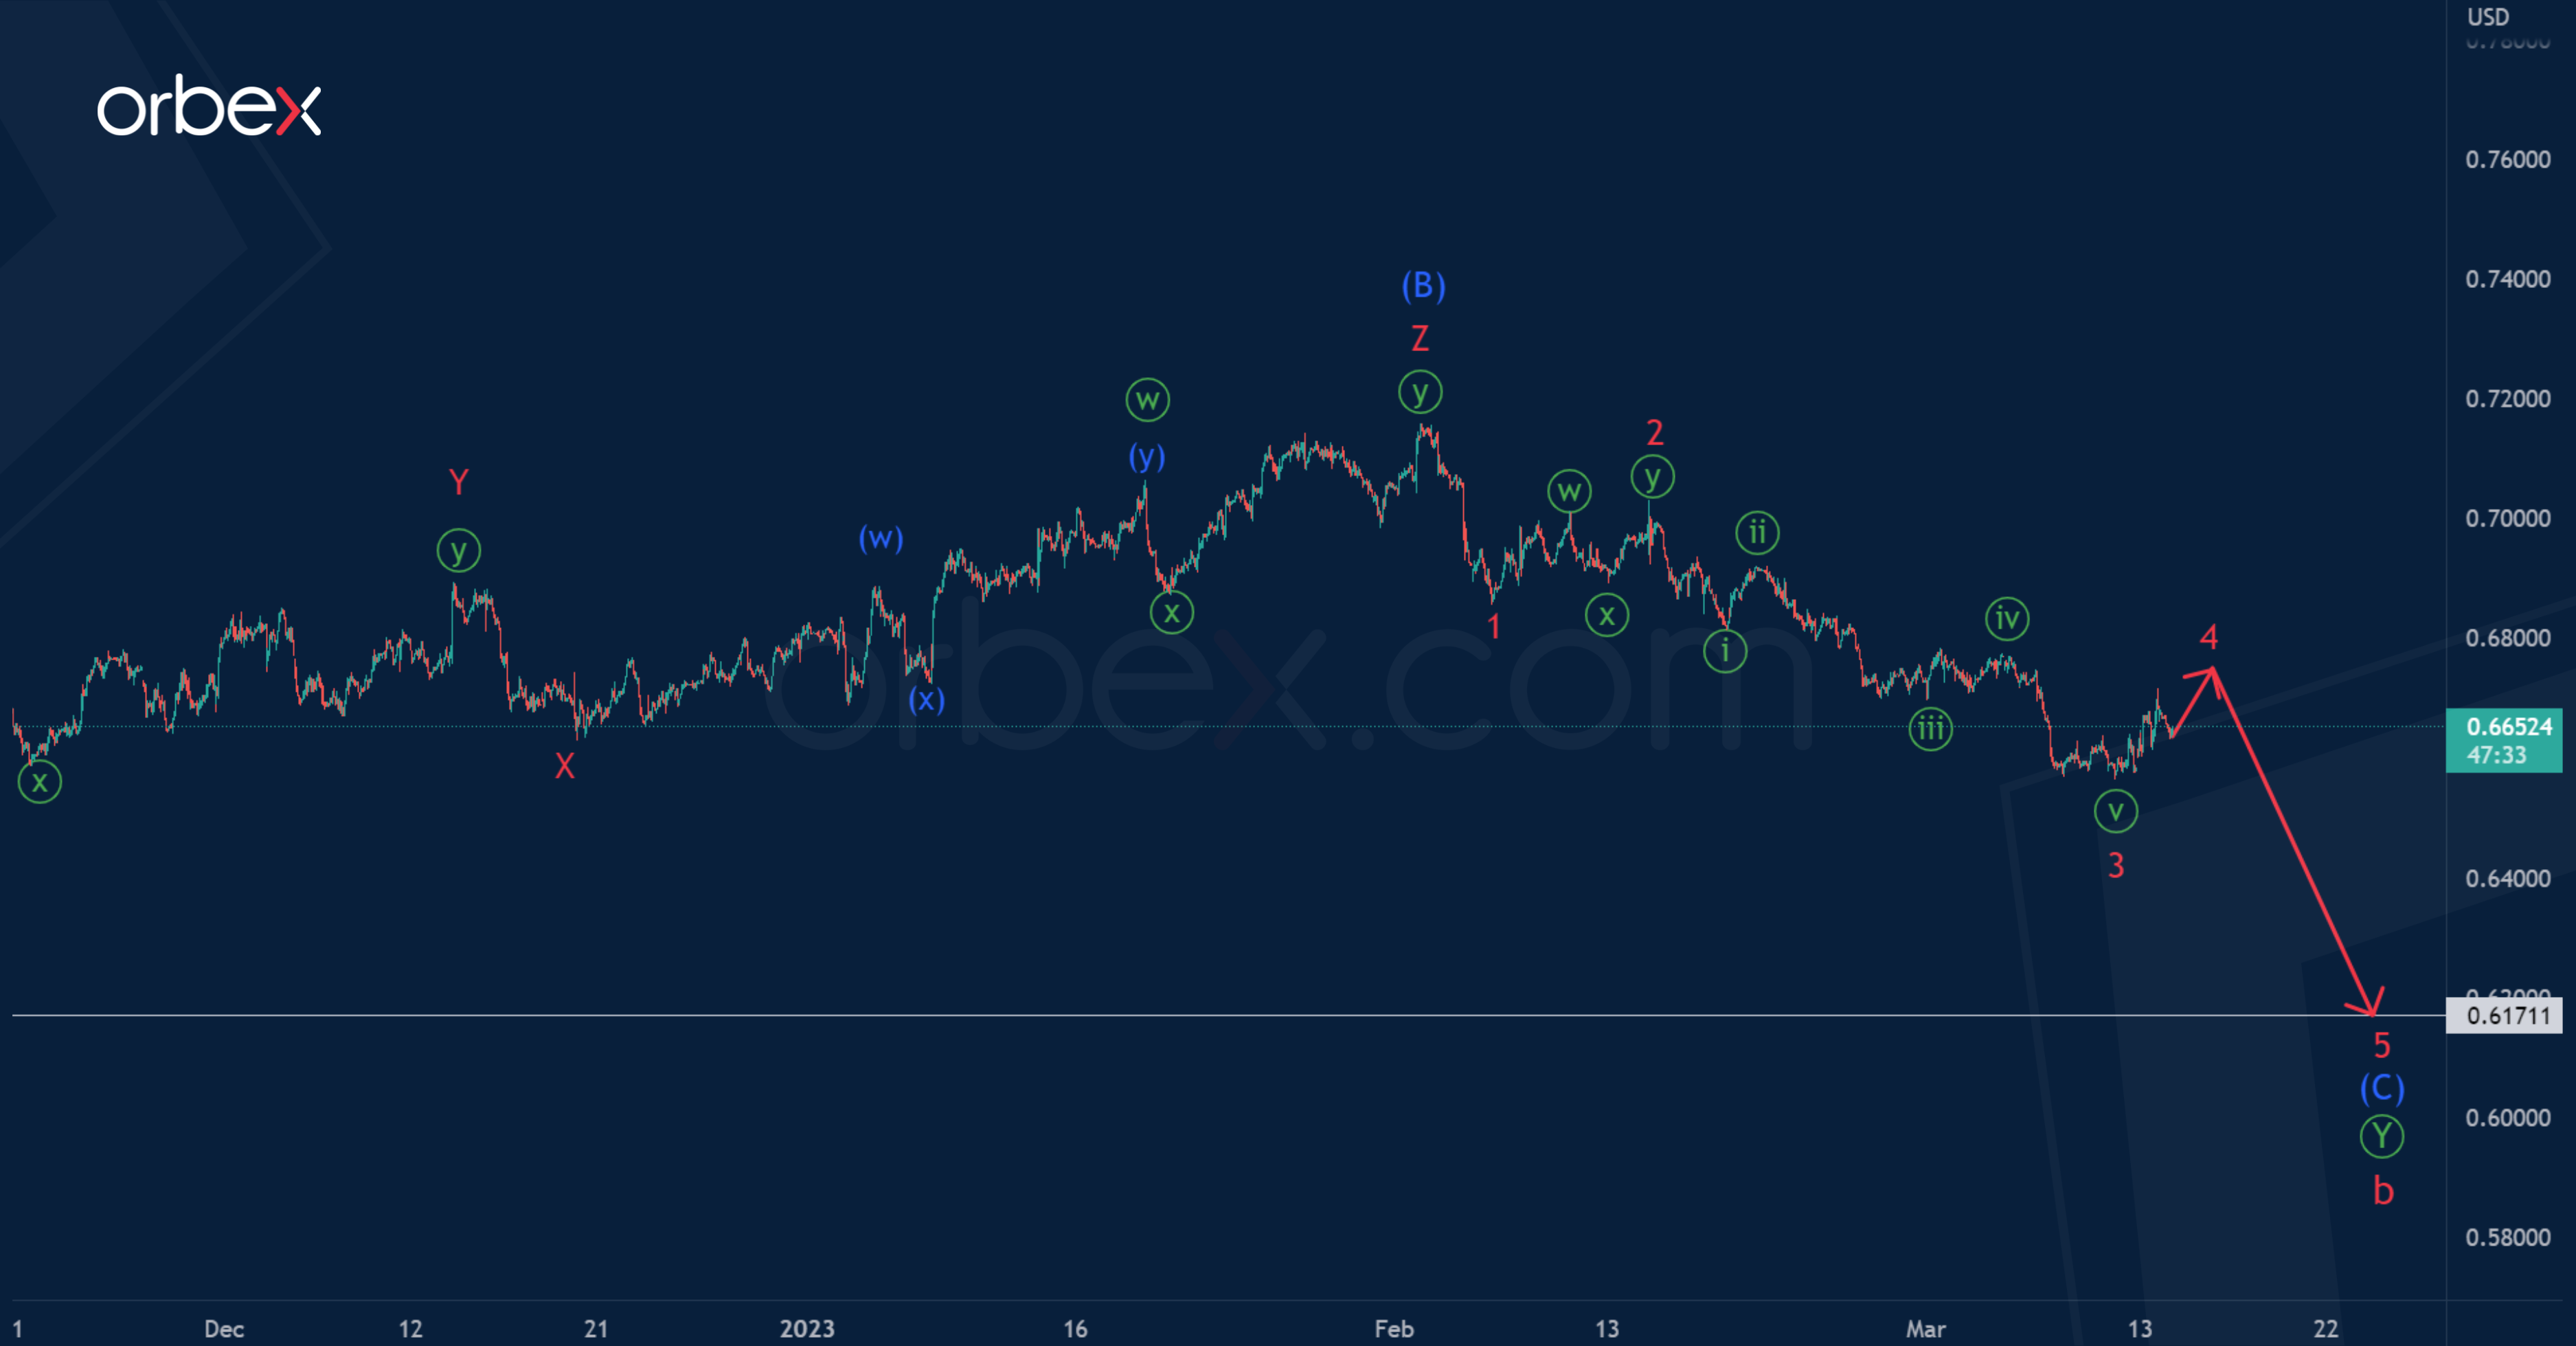
However, an alternative scenario may indicate an incomplete intermediate correction (B), which means that the price growth will continue.
Perhaps the correction (B) will take the form of a triple zigzag W-X-Y-X-Z, as in the first scenario, but its finale will be slightly higher.
Most likely, in the last section of the chart, the price began to rise in the final minor wave Z. This wave may end in the form of a minute zigzag near 0.731.
At that level, correction (B) will be at 76.4% of impulse (A).
S&P 500 Tests Critical Support
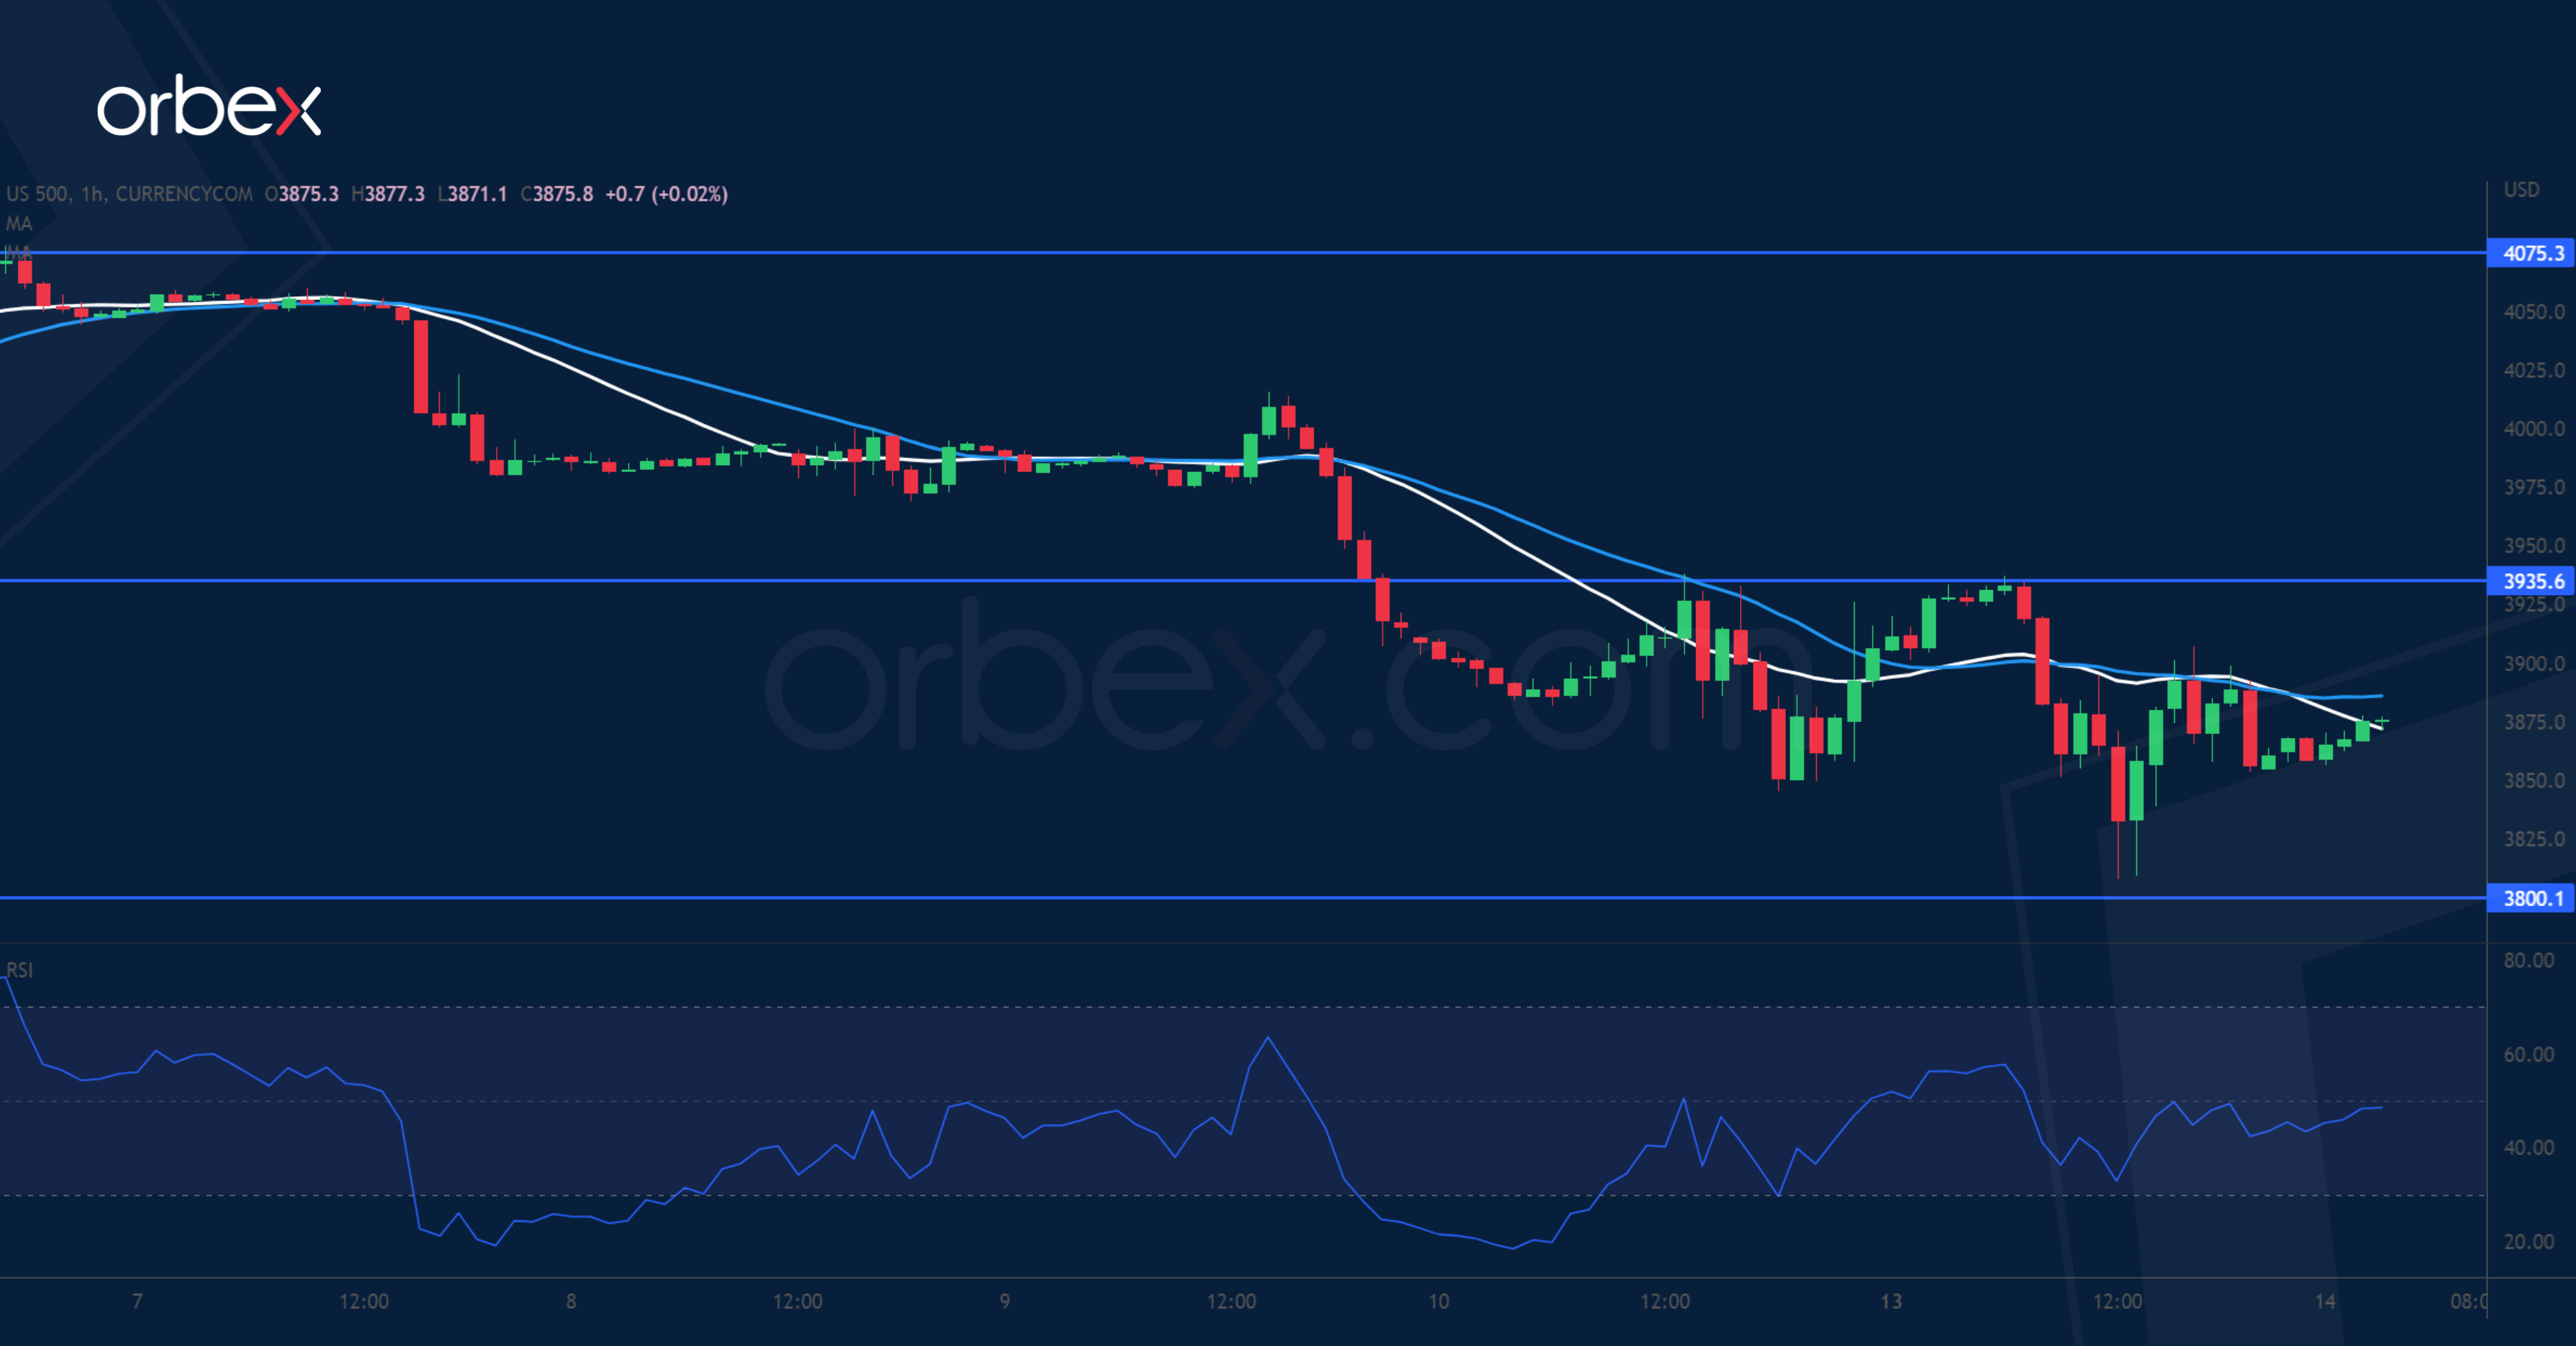
The S&P 500 whipsaws as investors struggle to find reassurance in US authorities’ emergency measures. A bearish MA cross on the daily chart suggests that the mood has remained cautious. Then a break below the daily support of 3935 came in as a confirmation, invalidating the latest rebound and turning it into a fresh resistance. The lower band of the December consolidation range around 3800 is the next support where the bulls might try to hold it together. Its breach could lead to a bearish continuation in the medium-term.