

Sample Category Title
GBP/JPY Mid-Day Outlook
Daily Pivots: (S1) 161.60; (P) 162.91; (R1) 163.87; More...
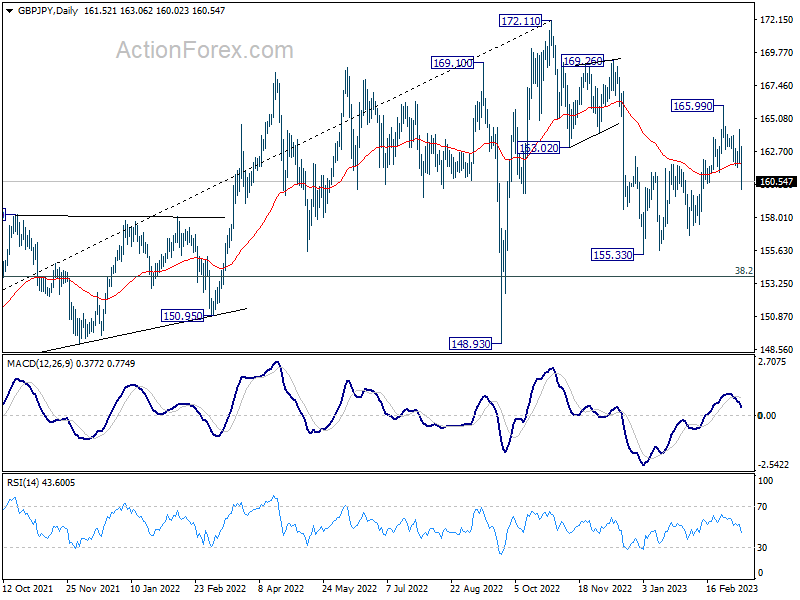
GBP/JPY's break of 161.18 support now argues that rebound from 155.33 has completed at 165.99 already. Fall form 165.99 is probably developing into another falling leg of the corrective pattern from 172.11. Intraday bias is back on the downside for 156.70 support first, and then 155.33 low. On the upside, above 163.03 minor resistance will turn intraday bias neutral first.
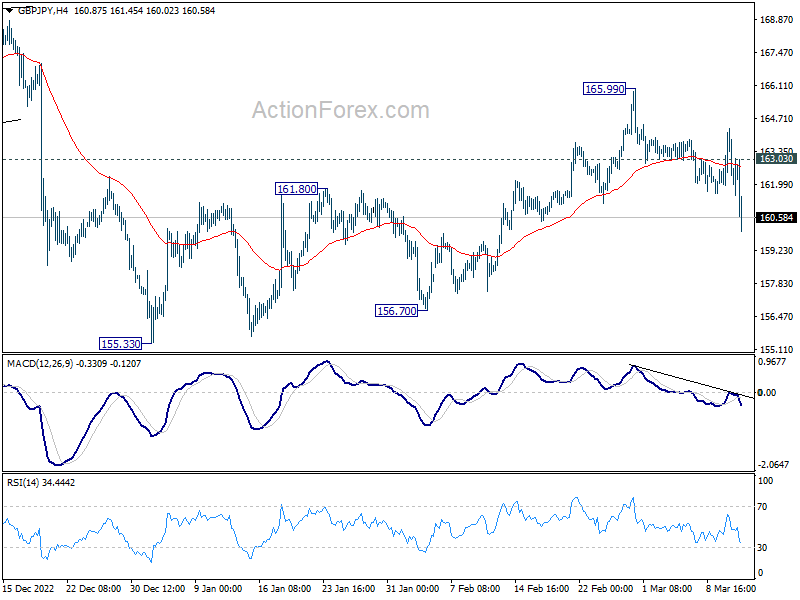
In the bigger picture, as long as 38.2% retracement of 123.94 (2020 low) to 172.11 (2022 high) at 153.70 holds, medium term bullishness is retained. That is, larger up trend from 123.94 (2020 low) is still in progress. Break of 172.11 high to resume such up trend is expected at a later stage.
EUR/JPY Mid-Day Outlook
Daily Pivots: (S1) 142.99; (P) 144.05; (R1) 144.74; More....
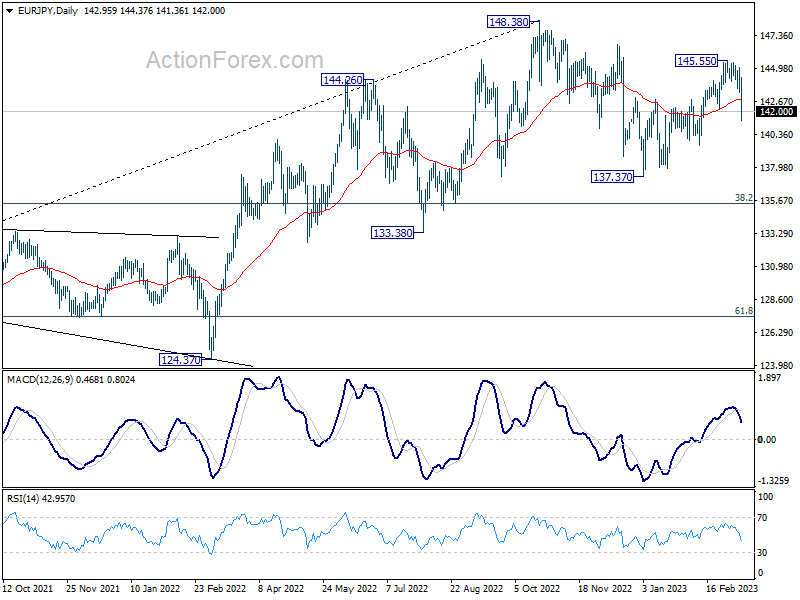
EUR/JPY's break of 142.13 support argues that rebound from 137.37 has completed at 145.55 already. Fall from 145.55 could be developing into the third leg of the corrective pattern from 148.38. Intraday bias is back on the downside for 139.54 support first. Firm break there will target a retest on 137.37 next. On the upside, above 142.94 minor resistance will turn intraday bias neutral first.
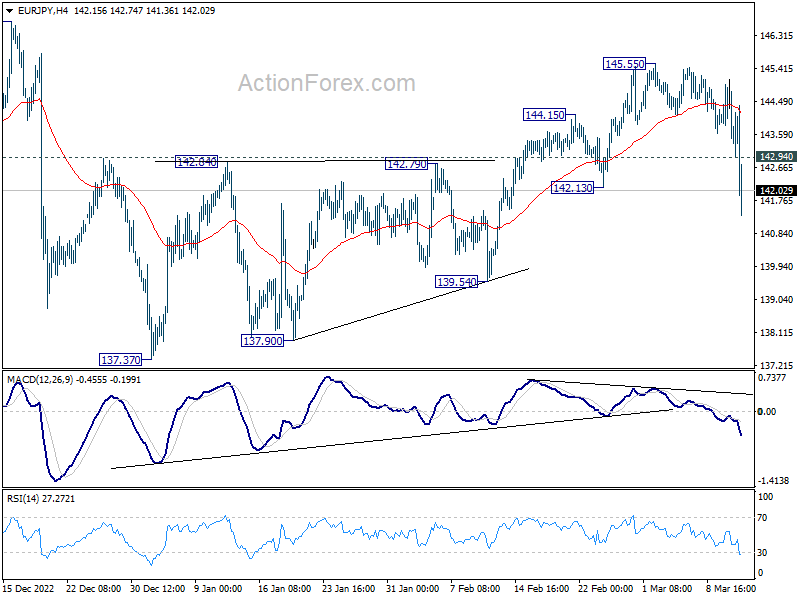
In the bigger picture, as long as 55 week EMA (now at 139.54) holds, larger up trend from 114.42 (2020 low) is still in progress for 149.76 long term resistance. However, firm break of 55 week EMA will bring deeper fall to 38.2% retracement of 114.42 to 148.38 at 135.40. Sustained break there will raise the chance of trend reversal, and target 61.8% retracement at 127.39.
EUR/USD Mid-Day Outlook
Daily Pivots: (S1) 1.0575; (P) 1.0638; (R1) 1.0702; More...
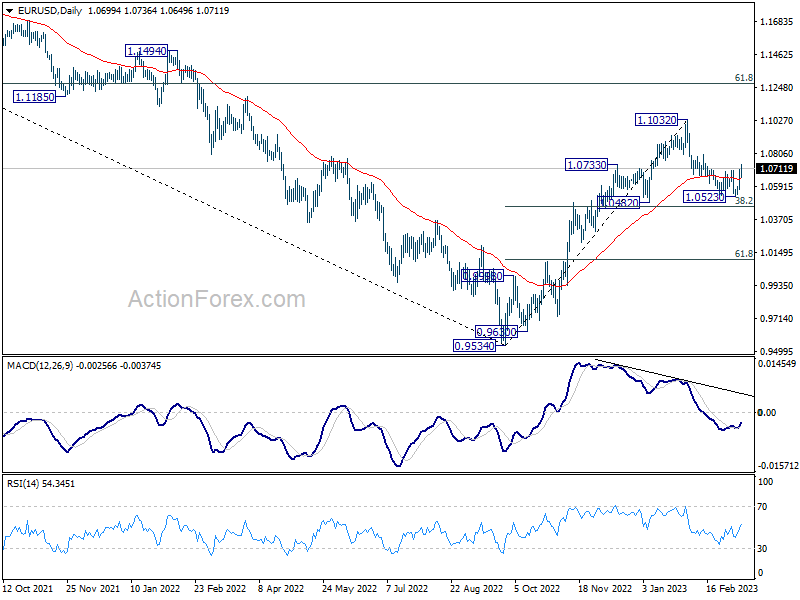
Intraday bias in EUR/USD stays on the upside at this point. Corrective decline from 1.1032 should have completed too, ahead of 1.0482 key support. Further rally would be seen to 1.0803 resistance first. Firm break there will target a retest on 1.1032 high. For now, risk will stay on the upside as long as 1.0523 support holds, in case of retreat.
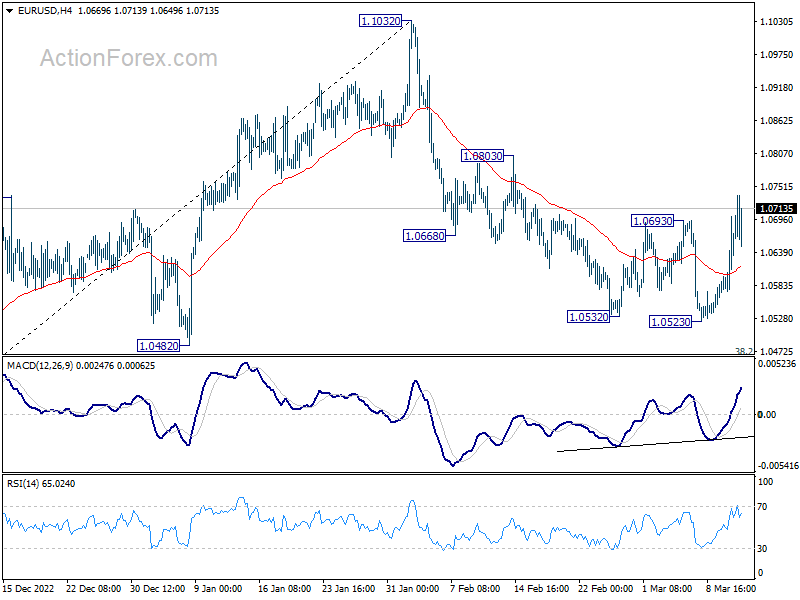
In the bigger picture, as long as 1.0482 support holds, rise from 0.9534 (2022 low) should continue to 61.8% retracement of 1.2348 (2021 high) to 0.9534 at 1.1273. However, sustained break of 1.0482 will bring deeper fall to 61.8% retracement of 0.9534 to 1.1032 at 1.0106, even as a corrective pull back.
GBP/USD Mid-Day Outlook
Daily Pivots: (S1) 1.1924; (P) 1.2019; (R1) 1.2129; More...
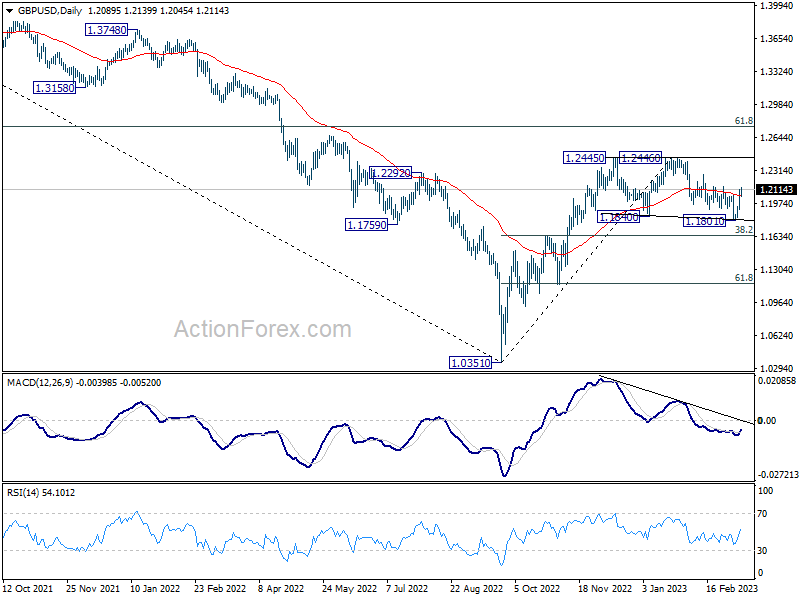
GBP/USD's rally from 1.1801 is still in progress and intraday bias stays on the upside. The corrective pattern from 1.2445 should have completed with three waves to 1.1801. Break of 1.2142 will bring retest of 1.2445/6 resistance zone. On the downside, below 1.2008 minor support will delay the bullish case and turn intraday bias neutral first.
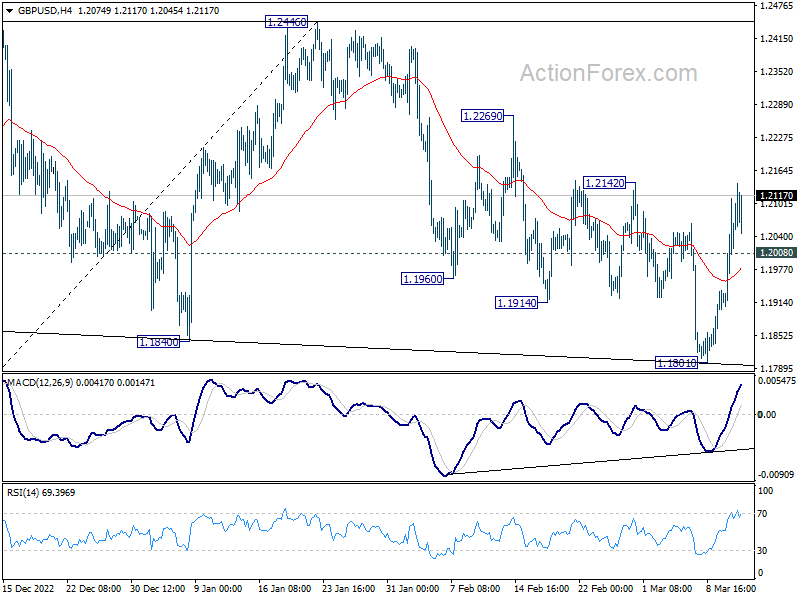
In the bigger picture, price action from 1.2445 are seen as a corrective pattern to rise from 1.0351 medium term bottom (2022 low). Resumption is expected as a later stage and firm break of 1.2446 will target 61.8% retracement of 1.4248 (2021 high) to 1.0351 at 1.2759. This will remain the favored case as long as 38.2% retracement of 1.0351 to 1.2445 at 1.1645 holds.
USD/JPY Mid-Day Outlook
Daily Pivots: (S1) 133.80; (P) 135.39; (R1) 136.67; More...
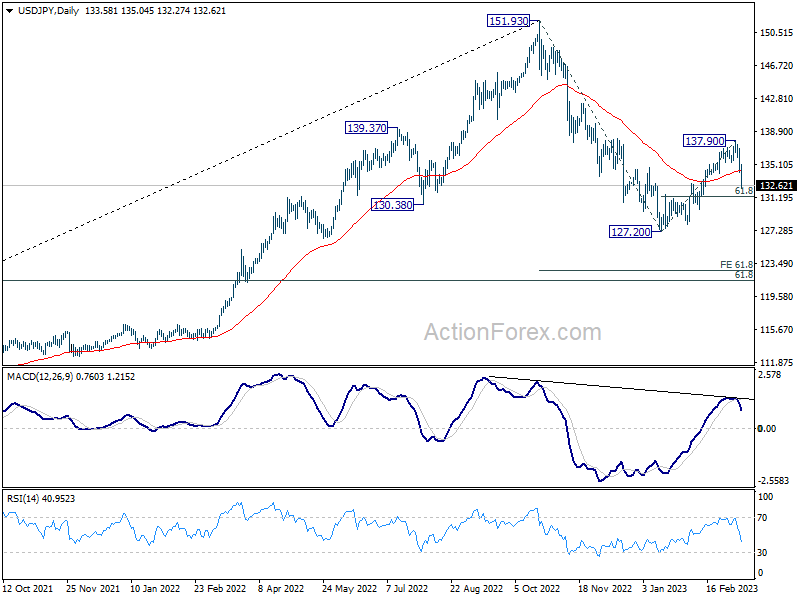
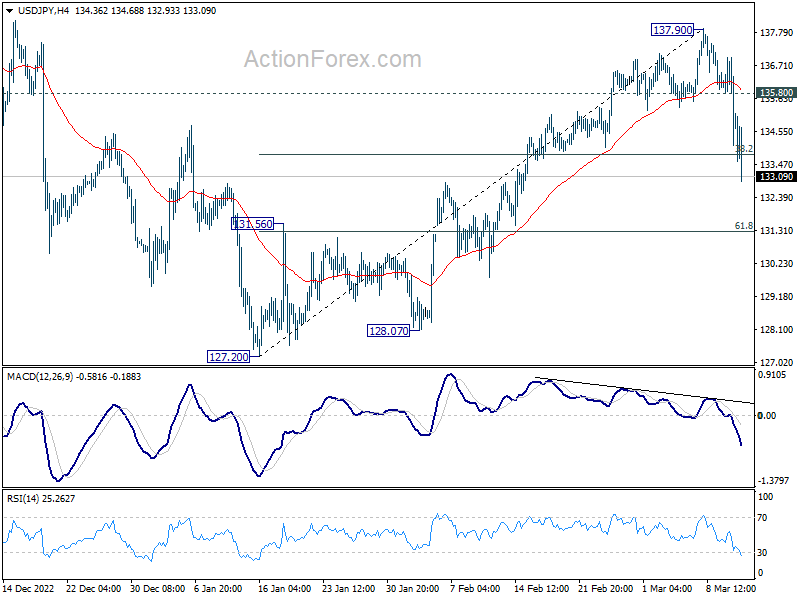
USD/JPY's decline from 137.90 accelerates to as low as 132.74 so far today. Intraday bias bias remains on the downside for 61.8% retracement of 127.20 to 137.90 at 131.28. Sustained break there will pave the way to retest 127.20 low. On the upside, above 134.68 minor resistance will turn intraday bias neutral first.
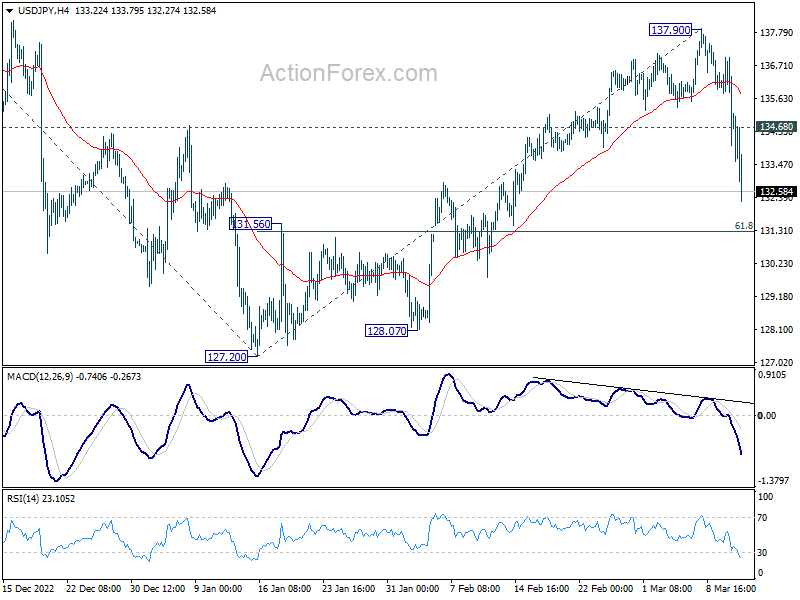
In the bigger picture, rebound from 127.20 should have completed at 137.90 as a corrective move, with strong break of 55 day EMA. The down trend from 151.93 (2022 high) is not over yet. Break of 127.20 will resume this down trend and target 61.8% projection of 151.93 to 127.20 from 137.90 at 122.61. This will now be the favored case as long as 137.90 resistance holds.
US 500 Index Meets Broken Trendline
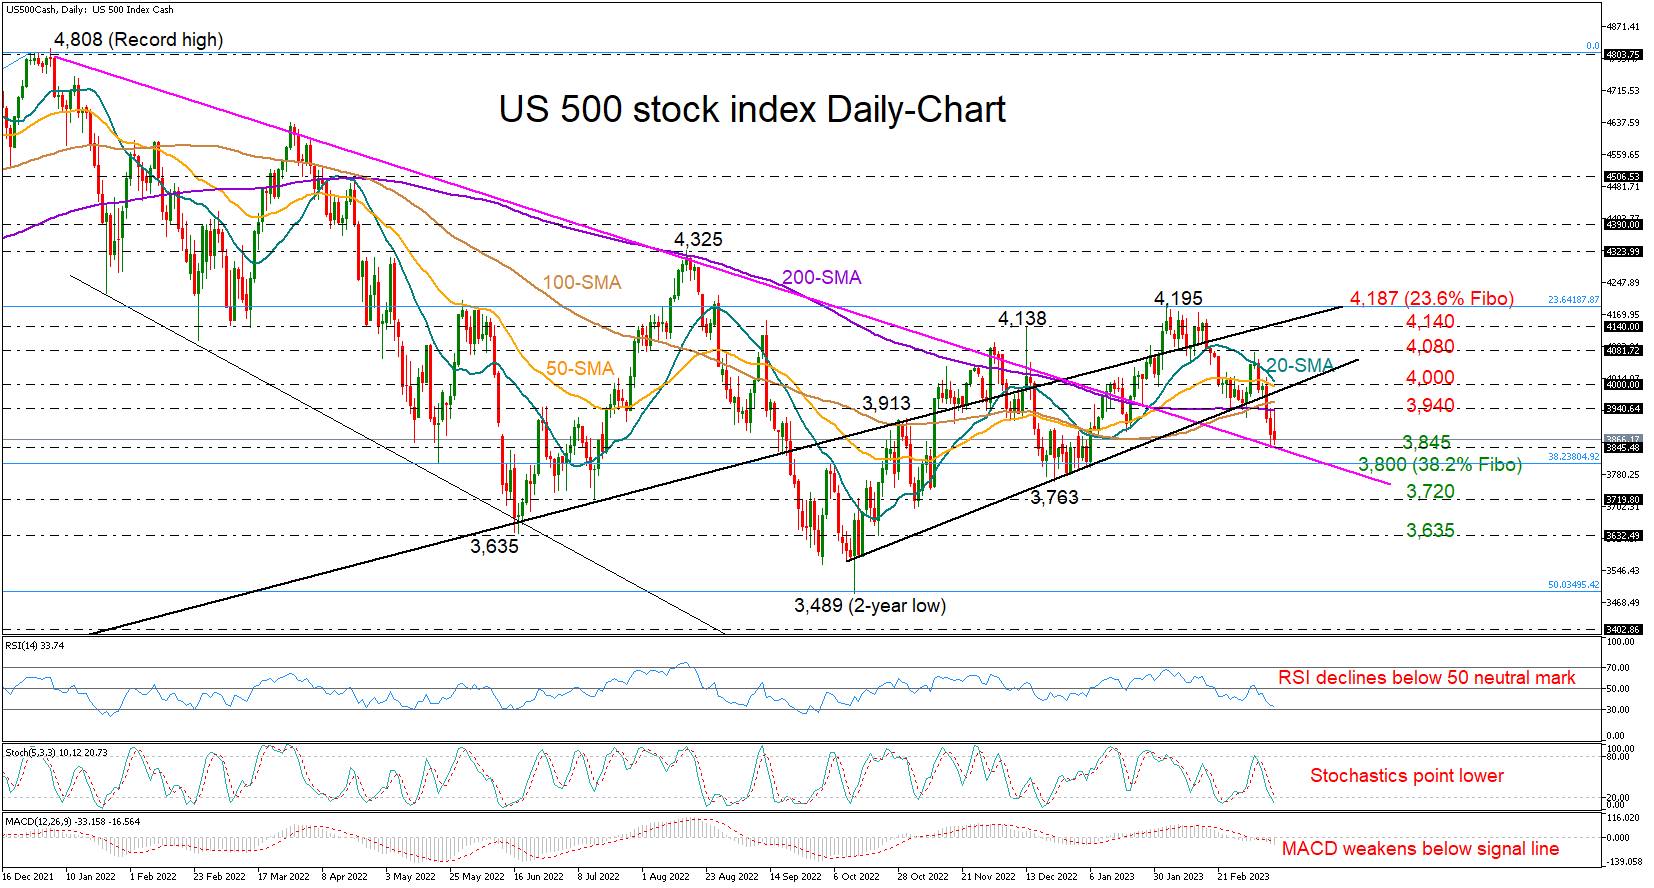
The US 500 futures (cash) came under renewed downside pressure last Friday as cracks in the US banking sector resurfaced, with the index drifting lower to mark a new one-month low at 3,845.
The sharp decline squeezed the price below the 200-day simple moving average (SMA), which had been acting as support since the end of January, increasing fears that the sell-off may continue.
While the negative trajectory in momentum indicators keeps the bias on the bearish side, the broken resistance trendline from the 2022 record high, which is currently providing a strong footing near Friday’s low, could initiate some buying.
In the bullish scenario, where the price reclaims the 3,940-4,000 region, which encapsulates the SMAs and the former support trendline from October’s low, the price could advance towards last week’s high of 4,080. A steeper increase could stabilize somewhere between the 4,140 level and the 23.6% Fibonacci retracement level of the 2020-2021 rally at 4,187.
Should the index dive below 3,845, the 38.2% Fibonacci zone of 3,800 could immediately block the way towards the 3,720 floor. Even lower, some congestion could develop near the 3,635 handle.
In short, the bearish wave in the US 500 stock index has paused near a constraining zone, making an upside correction likely. Yet, whether the market will be able to find enough buying interest to return above 4,000 remains to be seen.
USD/CHF Mid-Day Outlook
Daily Pivots: (S1) 0.9144; (P) 0.9244; (R1) 0.9313; More...
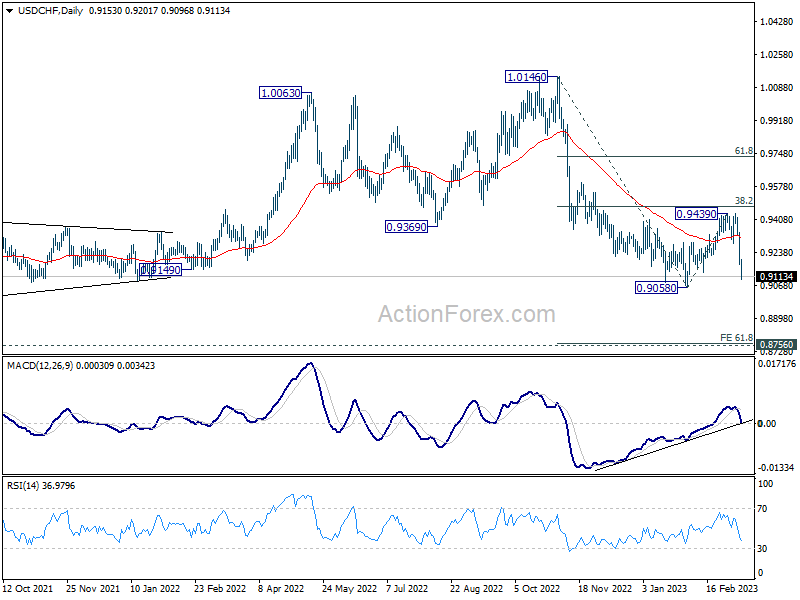
USD/CHF's decline accelerates to as low as 0.9096 so far today and intraday bias stays on the downside for 0.9058 low. Decisive break there will resume larger down trend from 1.0146. Next target is 61.8% projection of 1.0146 to 0.9058 from 0.9439 at 0.8767. On the upside, above 0.9218 minor resistance will turn intraday bias neutral and bring consolidations first, before staging another fall.
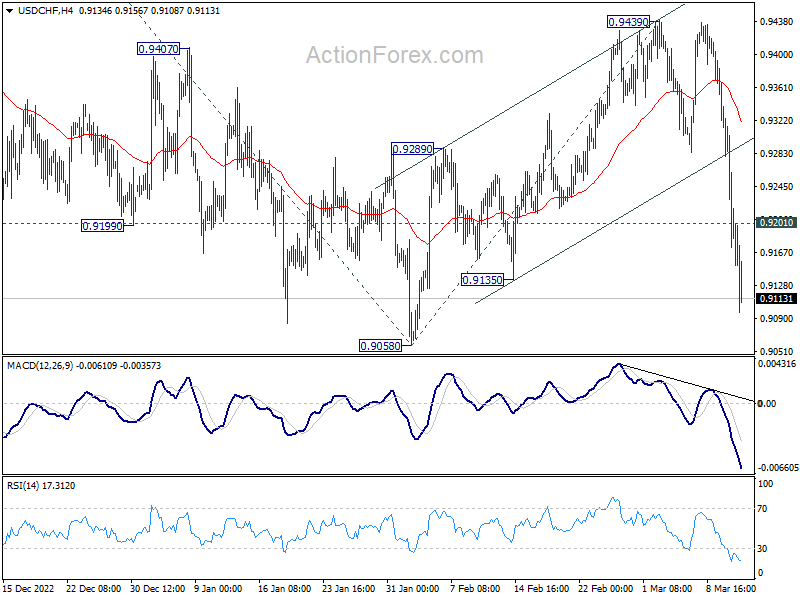
In the bigger picture, fall from 1.1046 (2022 high) is should still be in progress with 38.2% retracement of 1.0146 to 0.9058 at 0.9474 intact. Rejection by 55 week EMA is also a medium term bearish sign. Break of 0.9058 will resume such decline towards 0.8756 support (2021 low). But overall, such fall is still as a leg in the long term range pattern from 1.0342 (2016 high). So, downside should be contained by 0.8756 to bring reversal. For now, this will remain the favored case as long as 0.9439 resistance holds.
Sentiment Fragile as Banking Worries Remain, Yen and Swiss Franc Soar
The fallout from the collapse of Silicon Valley Bank continues to unsettle investors. Despite measures announced on Sunday by US Treasury, FDIC and Fed to calm the markets, concerns remain. European indexes saw sharp declines led by bank stocks, while benchmark treasury yields fell.
Additionally, the market is also showing signs of pricing out a rate hike by the Fed on March 22, with Goldman Sachs predicting no change. Fed fund futures indicate only an 80% chance of a 25bps hike, though the situation remains fluid.
In the currency markets, Swiss Franc and Yen have emerged as the clear winners today, supported by risk aversion as well as falling major benchmark yields. The Dollar is the weakest performer as traders shift their expectations regarding the Fed. While there is no change in expectation for a 50bps hike by the ECB this Thursday, the Euro is the second weakest currency.
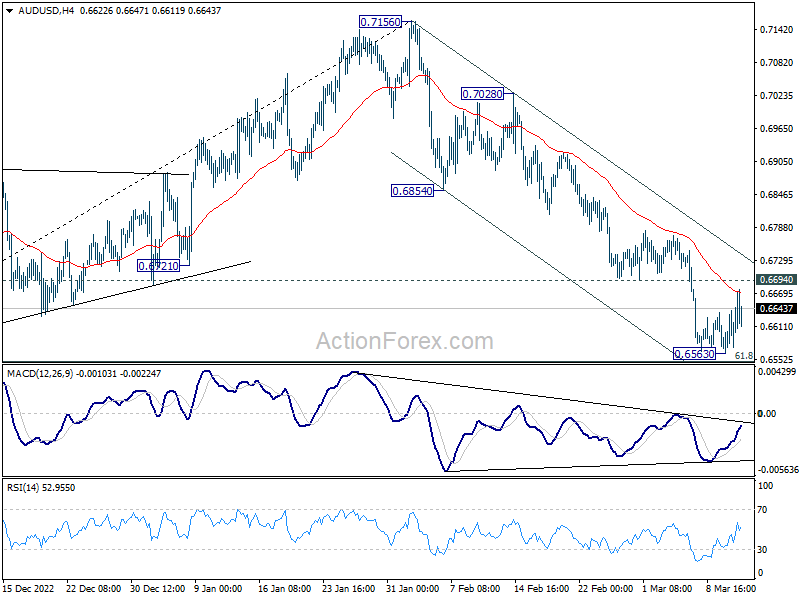
Technically, it should be noted that while Dollar weakens, the selloff against commodity currencies is not severe. AUD/USD is holding below 0.6694 minor resistance, NZD/USD below 0.6275, and USD/CAD above 1.3664 minor support. Risk of resumed selloff in commodity currencies currently outweigh the chance of extended decline in Dollar slightly.
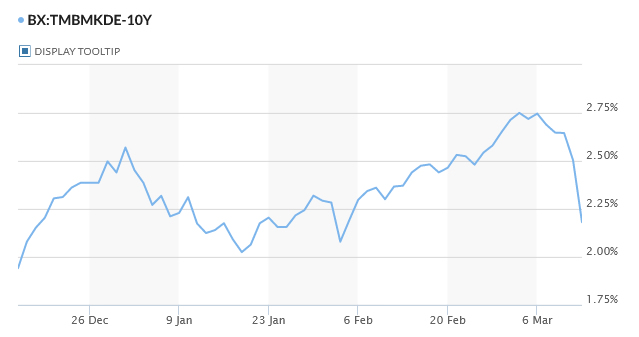
In Europe, at the time of writing, FTSE is down -2.32%. DAX is down -2.63%. CAC is down -2.47%. Germany 10-year yield is down -0.3141 at 2.190. Earlier in Asia, Nikkei dropped -1.11%. Hong Kong HSI rose 1.95%. China Shanghai SSE rose 1.20%. Singapore Strait Times dropped -1.42%. Japan 10-year JGB yield dropped -0.875 to 0.306.
GBP/CHF and USD/JPY break important support
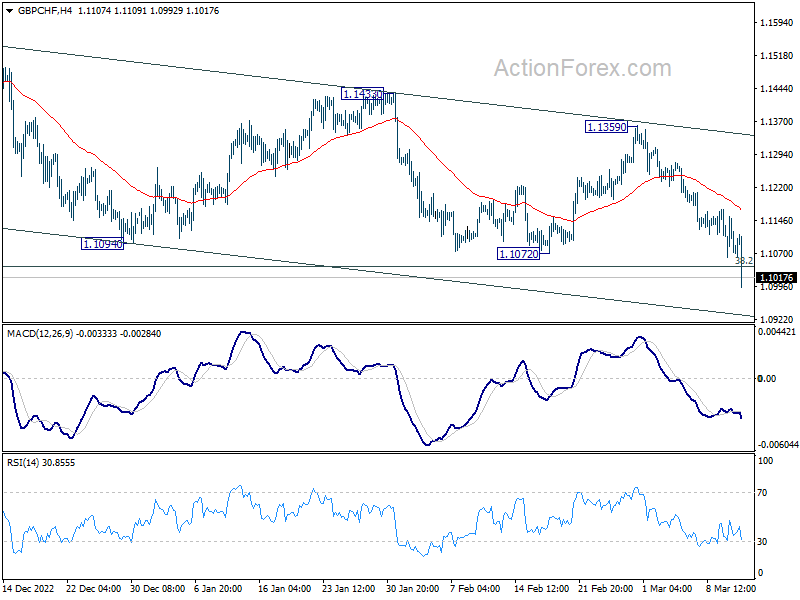
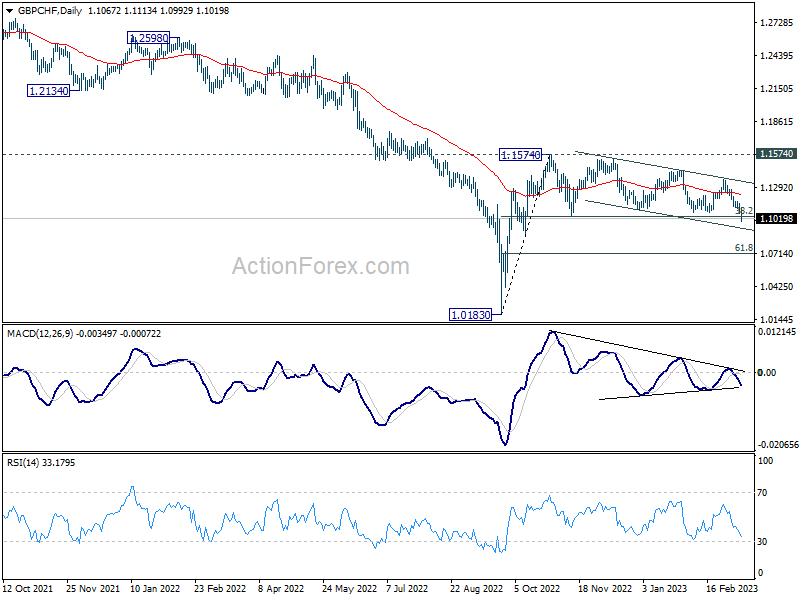
GBP/CHF breaks through an important support level at 38.2% retracement of 1.0183 to 1.1574 at 1.1043. Deeper fall is expected to lower channel support (now at 1.0922). Decisive break there could prompt downside acceleration to 61.8% retracement at 1.0714.
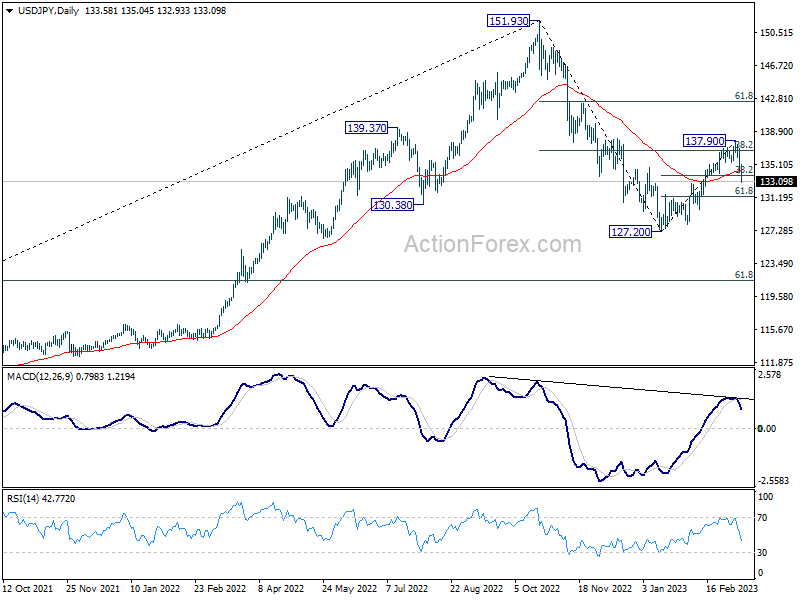
USD/JPY’s strong break of 38.2% retracement of 127.20 to 137.90 at 133.81 and 55 day EMA argues that whole rebound from 127.20 has completed at 137.90. Deeper fall should be seen to 61.8% retracement at 131.28. Sustained break there will raise the chance of resumption of whole fall from 151.93 through 127.20 low.
NZ BNZ services rose to 55.8, activity growing relatively well
New Zealand BusinessNZ Performance of Services Index rose from 54.7 to 55.8 in February. The move further above the trend in the index indicates a more favorable comparison to its long-term average of 53.6.
Looking at some details, activity/sales rose from 52.1 to 53.6, while employment dipped from 51.6 to 51.2. New orders/business increased from 54.8 to 57.1, and stocks/inventories went up from 54.7 to 58.3. Additionally, supplier deliveries improved from 52.3 to 55.9.
BNZ Senior Economist Craig Ebert said that "the strongly expanding PSI, along with the recovered tone of the PMI, suggests economic activity is growing relatively well in the early stages of this year".
USD/CHF Mid-Day Outlook
Daily Pivots: (S1) 0.9144; (P) 0.9244; (R1) 0.9313; More...
USD/CHF's decline accelerates to as low as 0.9096 so far today and intraday bias stays on the downside for 0.9058 low. Decisive break there will resume larger down trend from 1.0146. Next target is 61.8% projection of 1.0146 to 0.9058 from 0.9439 at 0.8767. On the upside, above 0.9218 minor resistance will turn intraday bias neutral and bring consolidations first, before staging another fall.
In the bigger picture, fall from 1.1046 (2022 high) is should still be in progress with 38.2% retracement of 1.0146 to 0.9058 at 0.9474 intact. Rejection by 55 week EMA is also a medium term bearish sign. Break of 0.9058 will resume such decline towards 0.8756 support (2021 low). But overall, such fall is still as a leg in the long term range pattern from 1.0342 (2016 high). So, downside should be contained by 0.8756 to bring reversal. For now, this will remain the favored case as long as 0.9439 resistance holds.
Economic Indicators Update
| GMT | Ccy | Events | Actual | Forecast | Previous | Revised |
|---|---|---|---|---|---|---|
| 21:30 | NZD | Business NZ PSI Feb | 55.8 | 54.5 | ||
| 23:50 | JPY | BSI Large Manufacturing Index Q1 | -10.5 | -4.2 | -3.6 | |
| 15:30 | USD | 3-Month Bill Auction | ||||
| 15:30 | USD | 6-Month Bill Auction |
Will US CPI Report Cause Another Market Storm?
The last CPI report before the Fed’s March policy meeting is due on Tuesday at 12:30 GMT and after the recent nasty surprises in the data, anxiety is running high about another hot print. Fed chief Jerome Powell has already upped the stakes by opening the door to a return to double rate hikes, while the US dollar is enjoying a mini revival. Are there more surprises in store for the markets this week?
Stalling progress to reduce inflation
As the fight against inflation rages on, there is good and bad news. The good news is that inflation in the US is falling. The bad news is that it’s not declining fast enough according to the latest metrics. The consumer price index was up 6.4% y/y in January, down just 0.1 percentage points from December. The decline in core CPI also slowed, but more worrying was the uptick in core PCE inflation, which the Fed attaches the most weight to in its decision making.
The forecasts for February suggest the sticky inflation picture hasn’t altered much since January as month-on-month, both headline and core CPI are expected to have increased by 0.4% - more than double the pace needed to achieve yearly inflation of 2%.
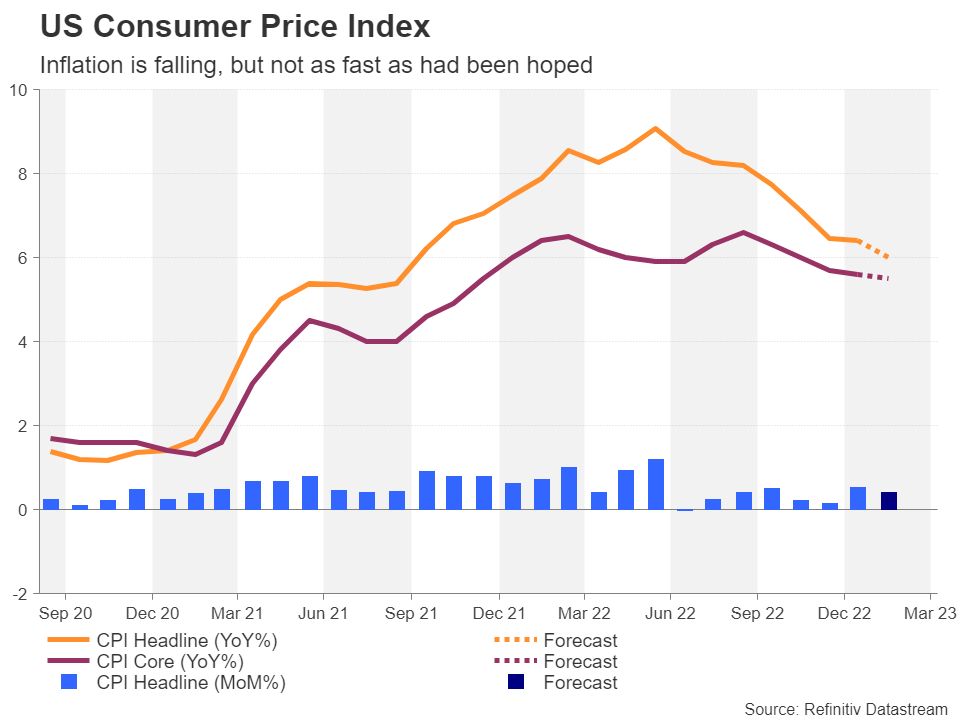
On an annual basis, the headline rate of inflation is expected to moderate to 6.0% y/y, while core CPI is projected at 5.5%.
Retail sales likely moderated in February
Another warning sign lately that the impact of last year’s rate hikes has yet to be felt and the economy continues to run near full capacity is the rebound in consumption. Retail sales jumped by 3.0% m/m in January and this was later backed up by a similarly strong surge in the personal consumption reading. For February, retail sales are forecast to have fallen back by 0.3% m/m.
Softer retail sales numbers could help calm some nerves should they come on the back of another set of stronger-than-expected CPI figures, but probably not by much.
Fed to stay the course
In his semi-annual testimony to Congress, Chair Powell warned that rates may have to be raised higher than previously anticipated. This hints that unless there’s a big miss on Tuesday, policymakers are unlikely to let their guards down anytime soon given just how strongly both the jobs and inflation data have overshot all expectations.
So for the March meeting, the decision about the size of the hike may not be as important as the destination of where rates will peak.
Can there be more CPI-fuelled gains for the dollar?
For the dollar, however, even in-line CPI numbers could nudge it higher against a basket of currencies. The dollar index is currently trading just above its 50-day moving average, which is climbing towards 103.50.
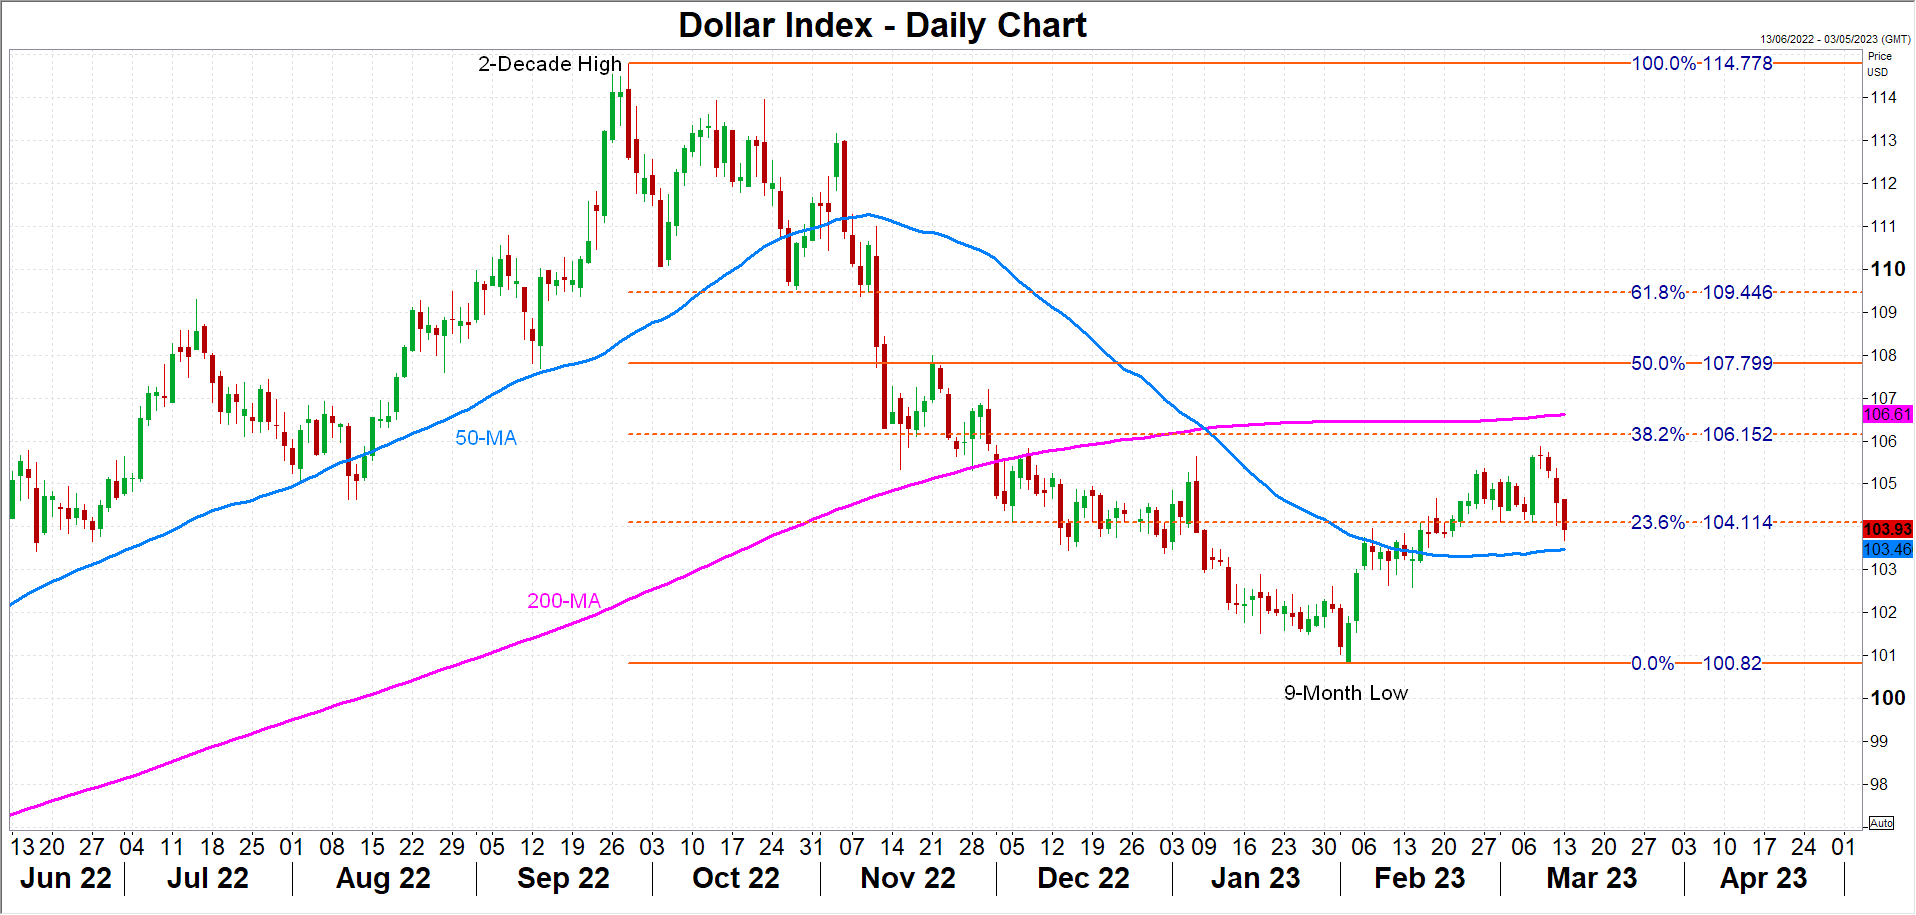
A lift from the data could provide the impetus it needs to reach the 38.2% Fibonacci retracement of the September-February downtrend at 106.15. Slightly above this level is the 200-day moving average at 106.61. This could be an ideal spot for the dollar bulls to pause their advance as they await the outcome of the FOMC meeting on March 21-22.
In the event, however, that inflation cools more than anticipated in February, at least in some of the CPI components, if not the headline figure, the dollar could slip below its 50-day MA and head for the February low of 100.82.
Services inflation holds key to shift in policy outlook
Powell recently indicated that the Fed is not just focusing its attention on the tightness of the labour market, but also on services inflation. In particular, the Fed is carefully tracking core services CPI that excludes housing, which has been stuck above 7% since August last year despite retreating from a peak of 8.2%.
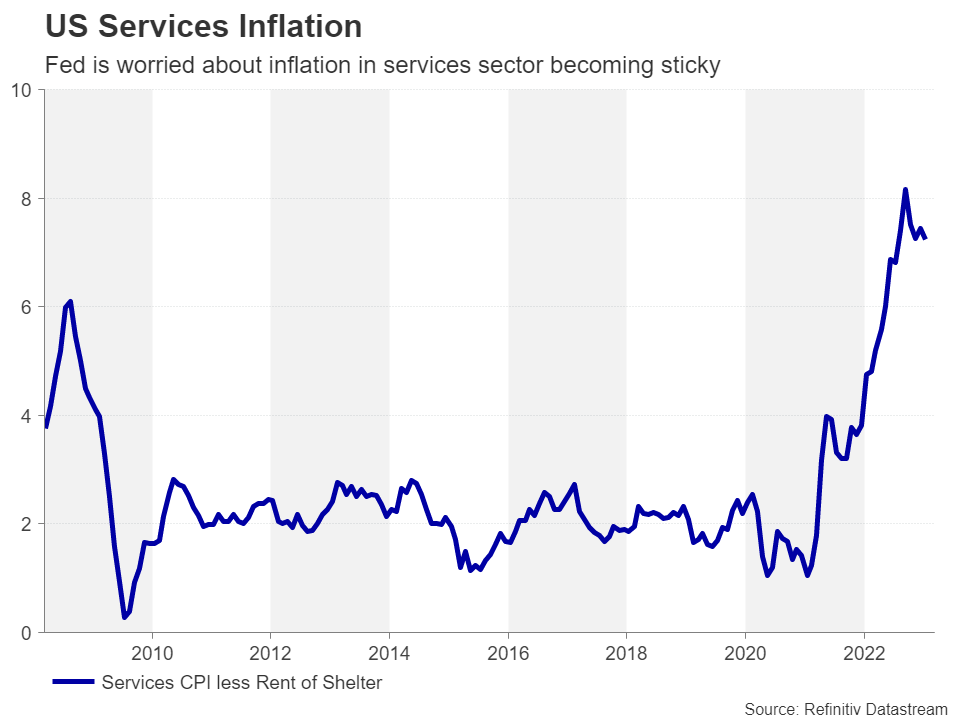
Without some signs in the upcoming report that services inflation is starting to come down more rapidly, investors should not expect any change in the current policy stance. Yet, the sudden collapse of tech lender Silicon Valley Bank (SVB) has already sent panic across Wall Street amid fears of financial contagion to other banks.
Markets saw the Fed funds rate peaking at around 5.6% prior to the SVB crisis but those odds have now fallen sharply to about 5.0%. There could be disappointment if policymakers stick to their guns in 10 days’ time.
The Nice Bitcoin Technique
Market picture
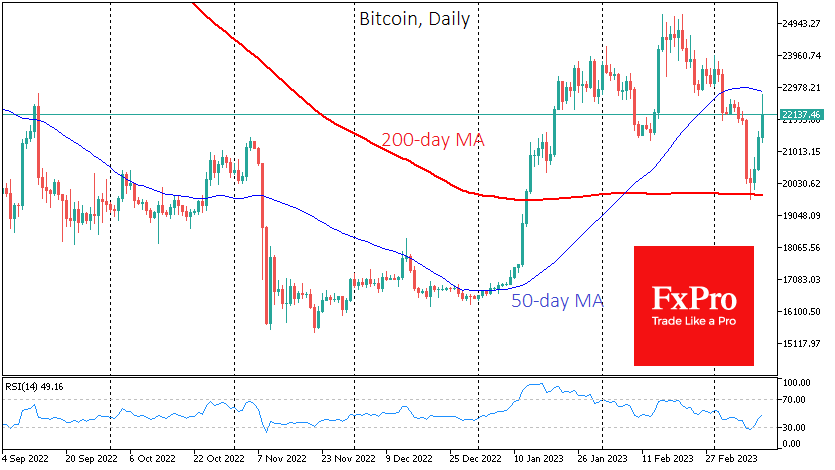
The crypto market is now showing increased volatility. On Monday morning, the price climbed from Friday’s low of $19.5K up to $22.7K. There are more fundamental factors behind bitcoin’s decline, while we see tech behind the rebound in recent days.
The problems at Silicon Valley Bank triggered a sell-off in risky assets, including bitcoin. At one point, it fell below its 200-day average, although it was higher at Friday’s close, attracting buyers. Later, the RSI on the daily timeframe moved out of the oversold territory – another early bullish signal.
However, the upside amplitude was provided by reduced liquidity. On Monday, Bitcoin faces an important test of market sentiment. During the day, we must watch closely to see if we have a clean sell-off by the hawks. If so, it’s an important signal that the recent rally was false and that the big players are still selling at better prices.
Potential buyers would still be better off waiting for a fix above $23K to confirm a bullish reversal.
According to CoinMarketCap, the total capitalisation of the crypto market passed $1 trillion on Monday morning.
Stablecoin USD Coin (USDC) lost its peg to the US dollar on Saturday, falling below $0.88 amid the collapse of Silicon Valley Bank (SVB), which held $3.3 billion of its reserves. DAI is also in trouble, falling below $0.90 as USDC partially backs the token. At the same time, many other stablecoins have crossed the $1.01 mark.
News background
Tron founder Justin Sun proposed the creation of a bank for the needs of the crypto industry amid the collapse of Silicon Valley Bank.
Michael Barr, deputy head of the US Federal Reserve, has proposed creating a group to develop the regulation of crypto assets. According to him, if the Fed fails to regulate stablecoins, their widespread adoption could threaten the US economy.
The US Treasury unveiled plans for the 2024 budget replenishment and said it intends to impose a 30% excise tax on mining companies’ electricity use.
Renowned economist and cryptocurrency sceptic Peter Schiff called for cryptocurrencies to be sold as the industry is “about to see more bankruptcies”. He pointed to the collapse of Silvergate Bank and US economic data that would force the Fed to raise interest rates.
Twitter CEO Elon Musk said he was “open to the idea” of buying the troubled Silicon Valley Bank to turn the social network into a financial hub and digital bank.