

Sample Category Title
AUD/USD Rises on Strong Capital Spending
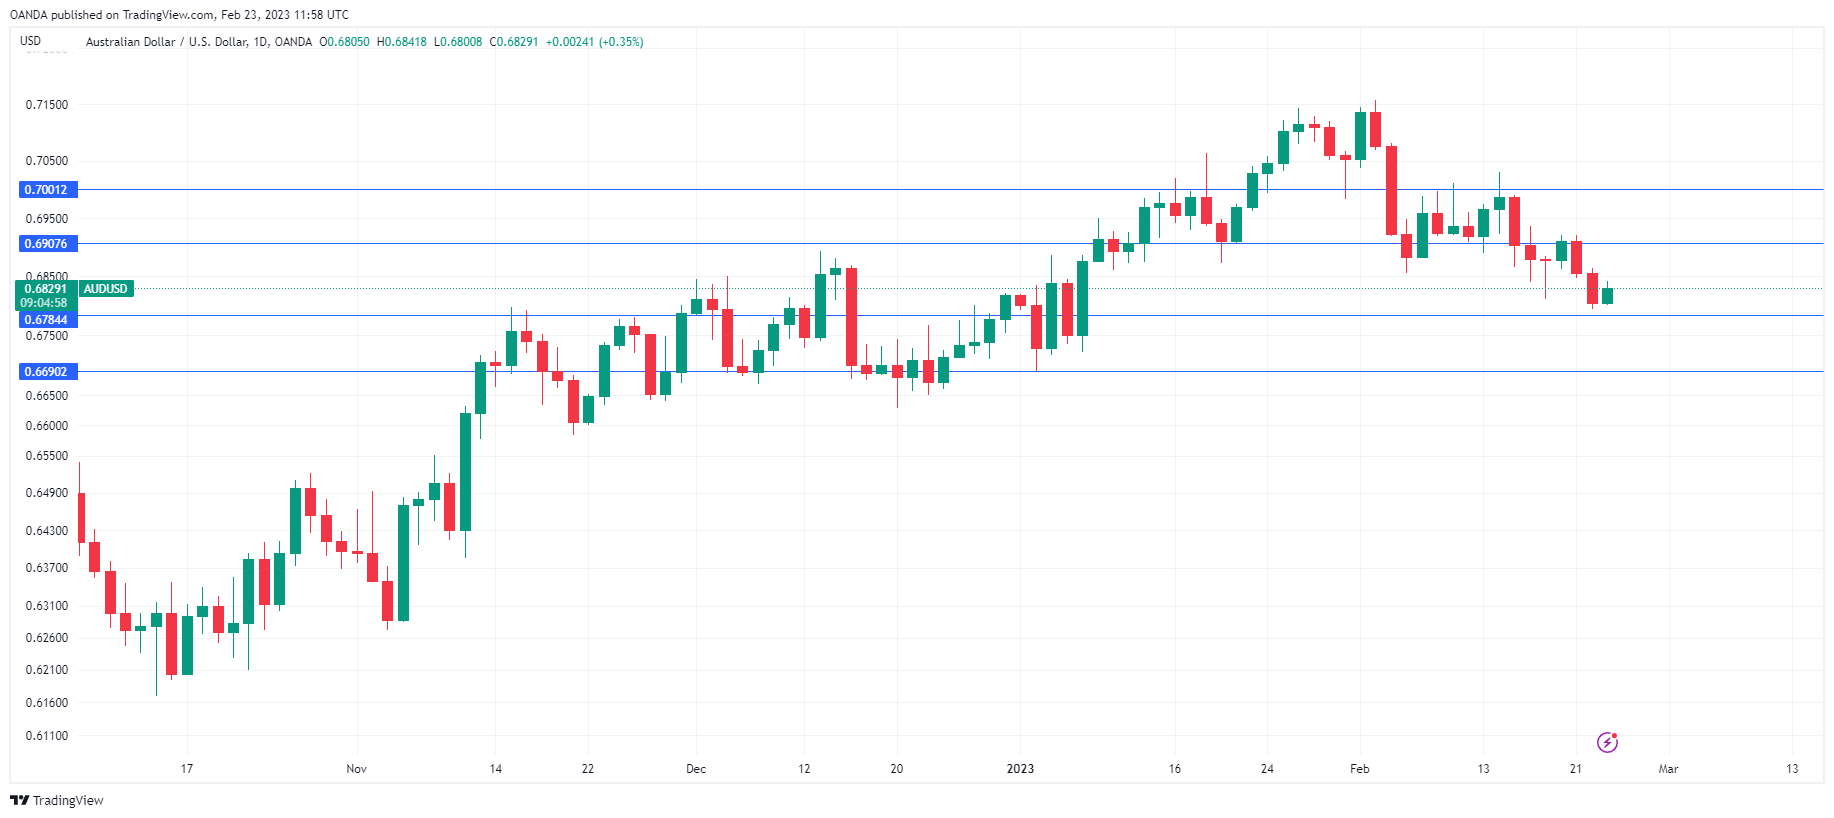
The Australian dollar has rebounded on Thursday, after a 2-day slide in which AUD/USD lost 100 points. In European trade, AUD/USD is trading at 0.6830, up 0.37%. On Wednesday, the Australian dollar fell to 0.6794, its lowest level since Jan. 6.
Australian Capex rebounds in Q4
Australia’s private capital expenditure jumped 2.2% q/q in Q4 2022, rebounding from 0.6% in Q3 and above the estimate of 1.3%. Building capex sparkled with a 3.6% gain, after declining by 1.6% in the third quarter. The strong numbers have pushed the Aussie higher on Thursday.
The capex release comes on the heels of wage growth, which slowed to 0.8% q/q in Q4 2022. This was lower than the 1.1% gain and the estimate of 1.0%. On an annualized basis, wage growth edged up to 3.3%, up from 3.2% but lower than the estimate of 3.5%. The RBA is keeping a close eye on wage growth, concerned that stubbornly high inflation could trigger a price-wage spiral that would entrench inflation expectations and complicate efforts to curb inflation.
FOMC minutes signal more rate hikes
The FOMC minutes reiterated what we’ve been hearing from Powell & Co. for months. FOMC members said there were signs that inflation was heading lower but more rate hikes were needed to bring inflation back to the 2% target. The minutes noted that the labour market remains robust, which is contributing to continuing upward pressures on wages and prices.” It should be noted that the minutes are somewhat stale, given the blowout employment report and the jump in retail sales which were released after the February meeting. These releases point to a surprisingly resilient US economy and could mean that members will become even more hawkish.
An important takeaway is that although the vote to hike by 0.25% was unanimous, two members (Bullard and Mester) saw a case for a 0.50% increase. The markets widely expect another 0.25% hike in March, but the host of unexpectedly strong releases in recent weeks has raised the likelihood of a 0.50% move. We can expect market pricing to continue to shift as the US releases key data in the coming weeks ahead of the Mar. 22 meeting.
AUD/USD Technical
- AUD/USD has support at 0.6784 and 0.6690
- There is resistance at 0.6907 and 0.7001
Dollar Creeps Up
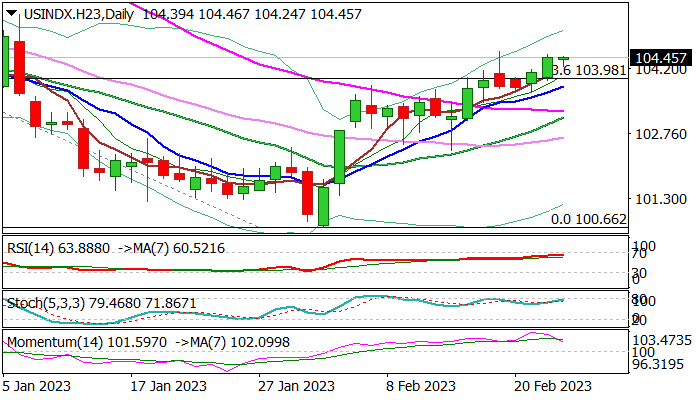
The Dollar Index has risen 3.8% to 104.5 from its lows in early February. Prior to that, the dollar index had been falling since late September, giving back half of the gains from the global rally triggered by the Fed’s sharp monetary tightening.
Although the dollar’s decline in recent months has been deeper than a typical Fibonacci retracement, this move looks like a profound correction within an uptrend. Early this month, the Dollar got support on the decline to the 100 area, a significant round level that acted as almost impregnable resistance in the pandemic. This time it proved to be no less solid support.
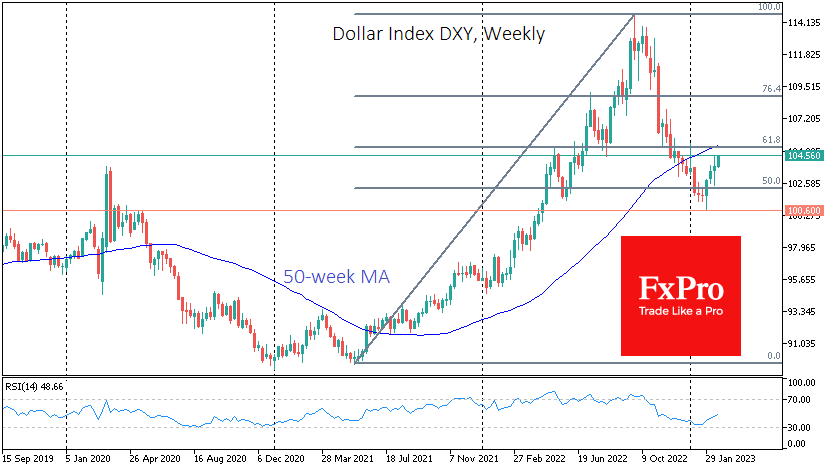
In addition, the dollar looked oversold, which provided initial support in early February. However, the US currency’s momentum against its rivals no longer looks like a technical fluctuation but rather a deliberate buying of dollar-denominated securities.
The fundamental reason for buying the US currency is the strong macroeconomic data, with inflation still alarmingly high, which should strengthen the central bank’s will to tighten. Judging by the tone of officials’ comments, the Fed is ready to do so.
The minutes of the last meeting showed that FOMC members felt that a 25-basis point hike was appropriate but that they were prepared to consider a sharper hike if needed. Even with the standard step, the Fed intends to stop tightening policy later than the markets have been expecting in recent months, which has helped to boost equities.
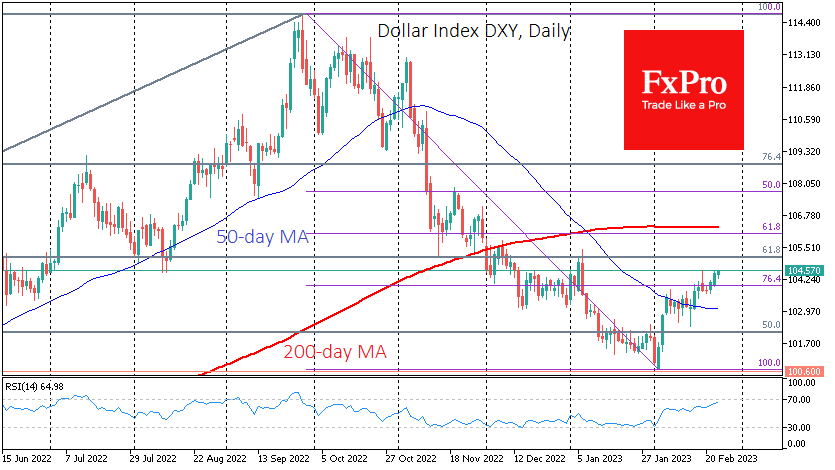
The long-term bullish trend in the dollar suggests that the DXY will return to multi-year highs near 115 by the end of this year.
Even without taking such a global view, the near-term outlook for the dollar remains bullish. Since the beginning of the week, the rally has taken the corrective pullback to a new level. A consolidation of the DXY above 104 opens the way to 106, a retreat to 61.8% of the last four months’ failure after failing to reverse downside resistance at 76.4% of that move. There is a 200-day moving average of 106. We will unlikely see a real bull-and-bear battle for the USD until these levels.
Bitcoin Maintains a Positive Short-term Outlook
Market Picture
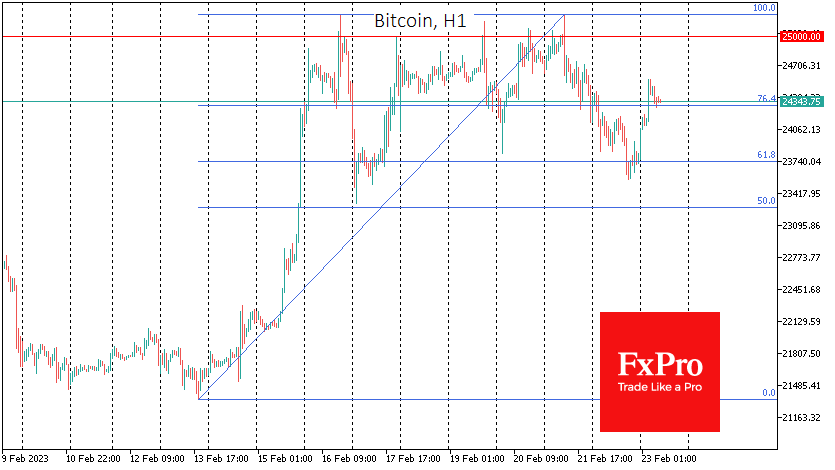
Bitcoin closed below $24K for the first time in 8 days on Wednesday. On Thursday morning, however, buyers regained the upper hand, pushing the coin up to $24.4K. BTC came under pressure on Tuesday and Wednesday amid falling stock indices. Last night, the decline paused, which helped the crypto market recover some of its losses, bringing its total capitalisation back to $1.11 trillion.
Interestingly, according to Bloomberg, the monthly correlation between bitcoin and the S&P 500 has fallen to its lowest level since 2021. And it was easy to see how long cryptocurrencies ignored the decline in equities.
In our view, these markets remain interconnected and only “hear” each other’s murmurs when they are persistent and pronounced. Less pronounced trends are perceived as noise that is filtered out.
The technical view of bitcoin’s short-term momentum leaves room for further upside, as the most recent downside momentum was stopped at 61.8% of the upside momentum from last week’s lows. Without the strong negative momentum of the equity indices, bitcoin retains a chance to test the 25,000 level before the end of the week. Such sustained attempts to climb higher could well take it there.
News Background
New York’s financial regulator is stepping up its crypto market oversight as its Department of Financial Services (NYDFS) has announced an update to its tools for monitoring illegal cryptocurrency activity among its regulated entities.
The Ethereum team has scheduled the rollout of the Shanghai-Capella (Shapella) update to the Sepolia test network for 28 February. This update will follow The Merge and allow validators to withdraw funds from stacks. After Sepolia, the hardfork will be tested on the Goerli network and then (probably in March) implemented on Mainnet.
Shops in France will start accepting bitcoin payments thanks to a partnership between the Binance exchange and credit card company Ingenico. The programme will later be extended to European countries where Binance is licensed to operate, including Italy, Lithuania, Spain, Cyprus, Poland, and Sweden.
Crude Oil Can be Ready to Break Out of Bearish Triangle
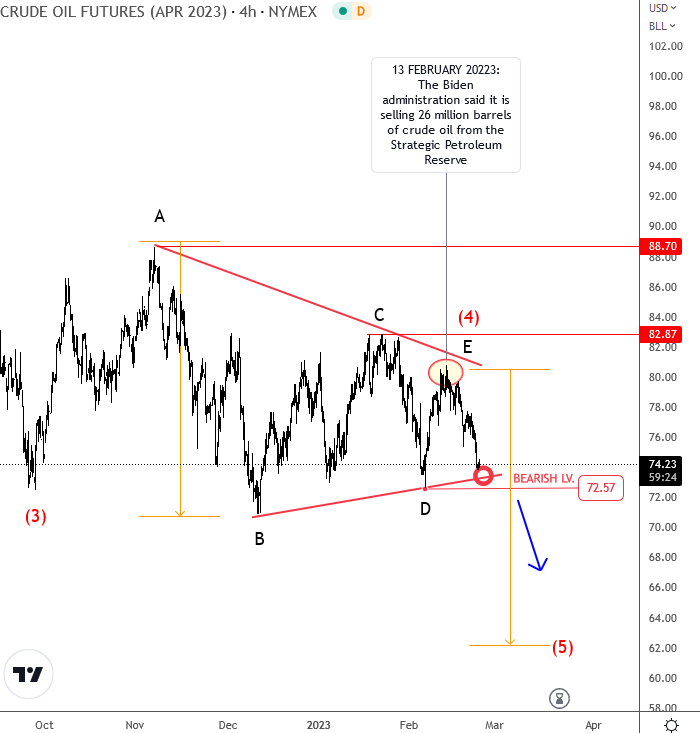
Crude down 8% since last Monday, when Biden's administration said it is selling 26 m barr. of oil from SPR. Price testing key trendline support of a bearish triangle, which signals for more weakness in Elliott Wave terms. Daily/weekly closes below $72.50 makes room for 60-65.
BoE Mann: More tightening is needed, a pivot is not imminent
BoE MPC member Catherine Mann said in a speech that while monetary policy taken has been historically aggressive, it's perhaps "insufficiently so relative to the multiple shocks, the behaviours pushing up inflation, and the initial accommodative starting point".
"The stage was set for a transmission of monetary policy to financial markets that has been quick, but also has been partially absorbed," she said. "And... are already incorporating the expected future inflection in monetary stance.
"All this adds up to financial conditions that are now looser than what likely will be needed to moderate the embedding of on-going inflation into the wage- and price-setting paths."
"This constellation could yield extended persistence of inflation into this year and the next. The resulting long period of time above the 2% target could increase the degree of backward-lookingness, or catch-up behaviour, in the system."
"Given that the risk of increasingly persistent inflation rises disproportionately with the share of backward-lookingness, I believe that more tightening is needed, and caution that a pivot is not imminent. In my view, a preponderance of turning points (Mann, 2023) is not yet in the data."
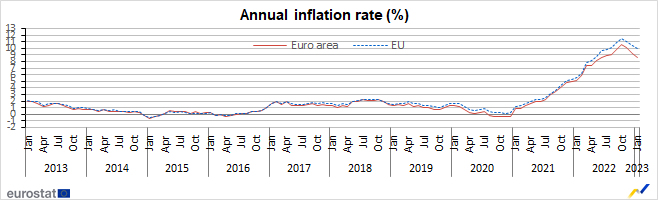
Eurozone CPI finalized at 8.6% yoy in Jan, core CPI at 5.3% yoy
Eurozone PMI was finalized at 8.6% yoy in January, down from 9.2% yoy in December. CPI core (all items ex-food, alcohol and tobacco) was finalized at 5.3% yoy, up from prior month's 5.2% yoy.
In January, the highest contribution to the annual Eurozone inflation rate came from food, alcohol & tobacco (+2.94%), followed by energy (+2.17%), services (+1.80%) and non-energy industrial goods (+1.73%).
USDCAD: The Price May Rise To 1.385
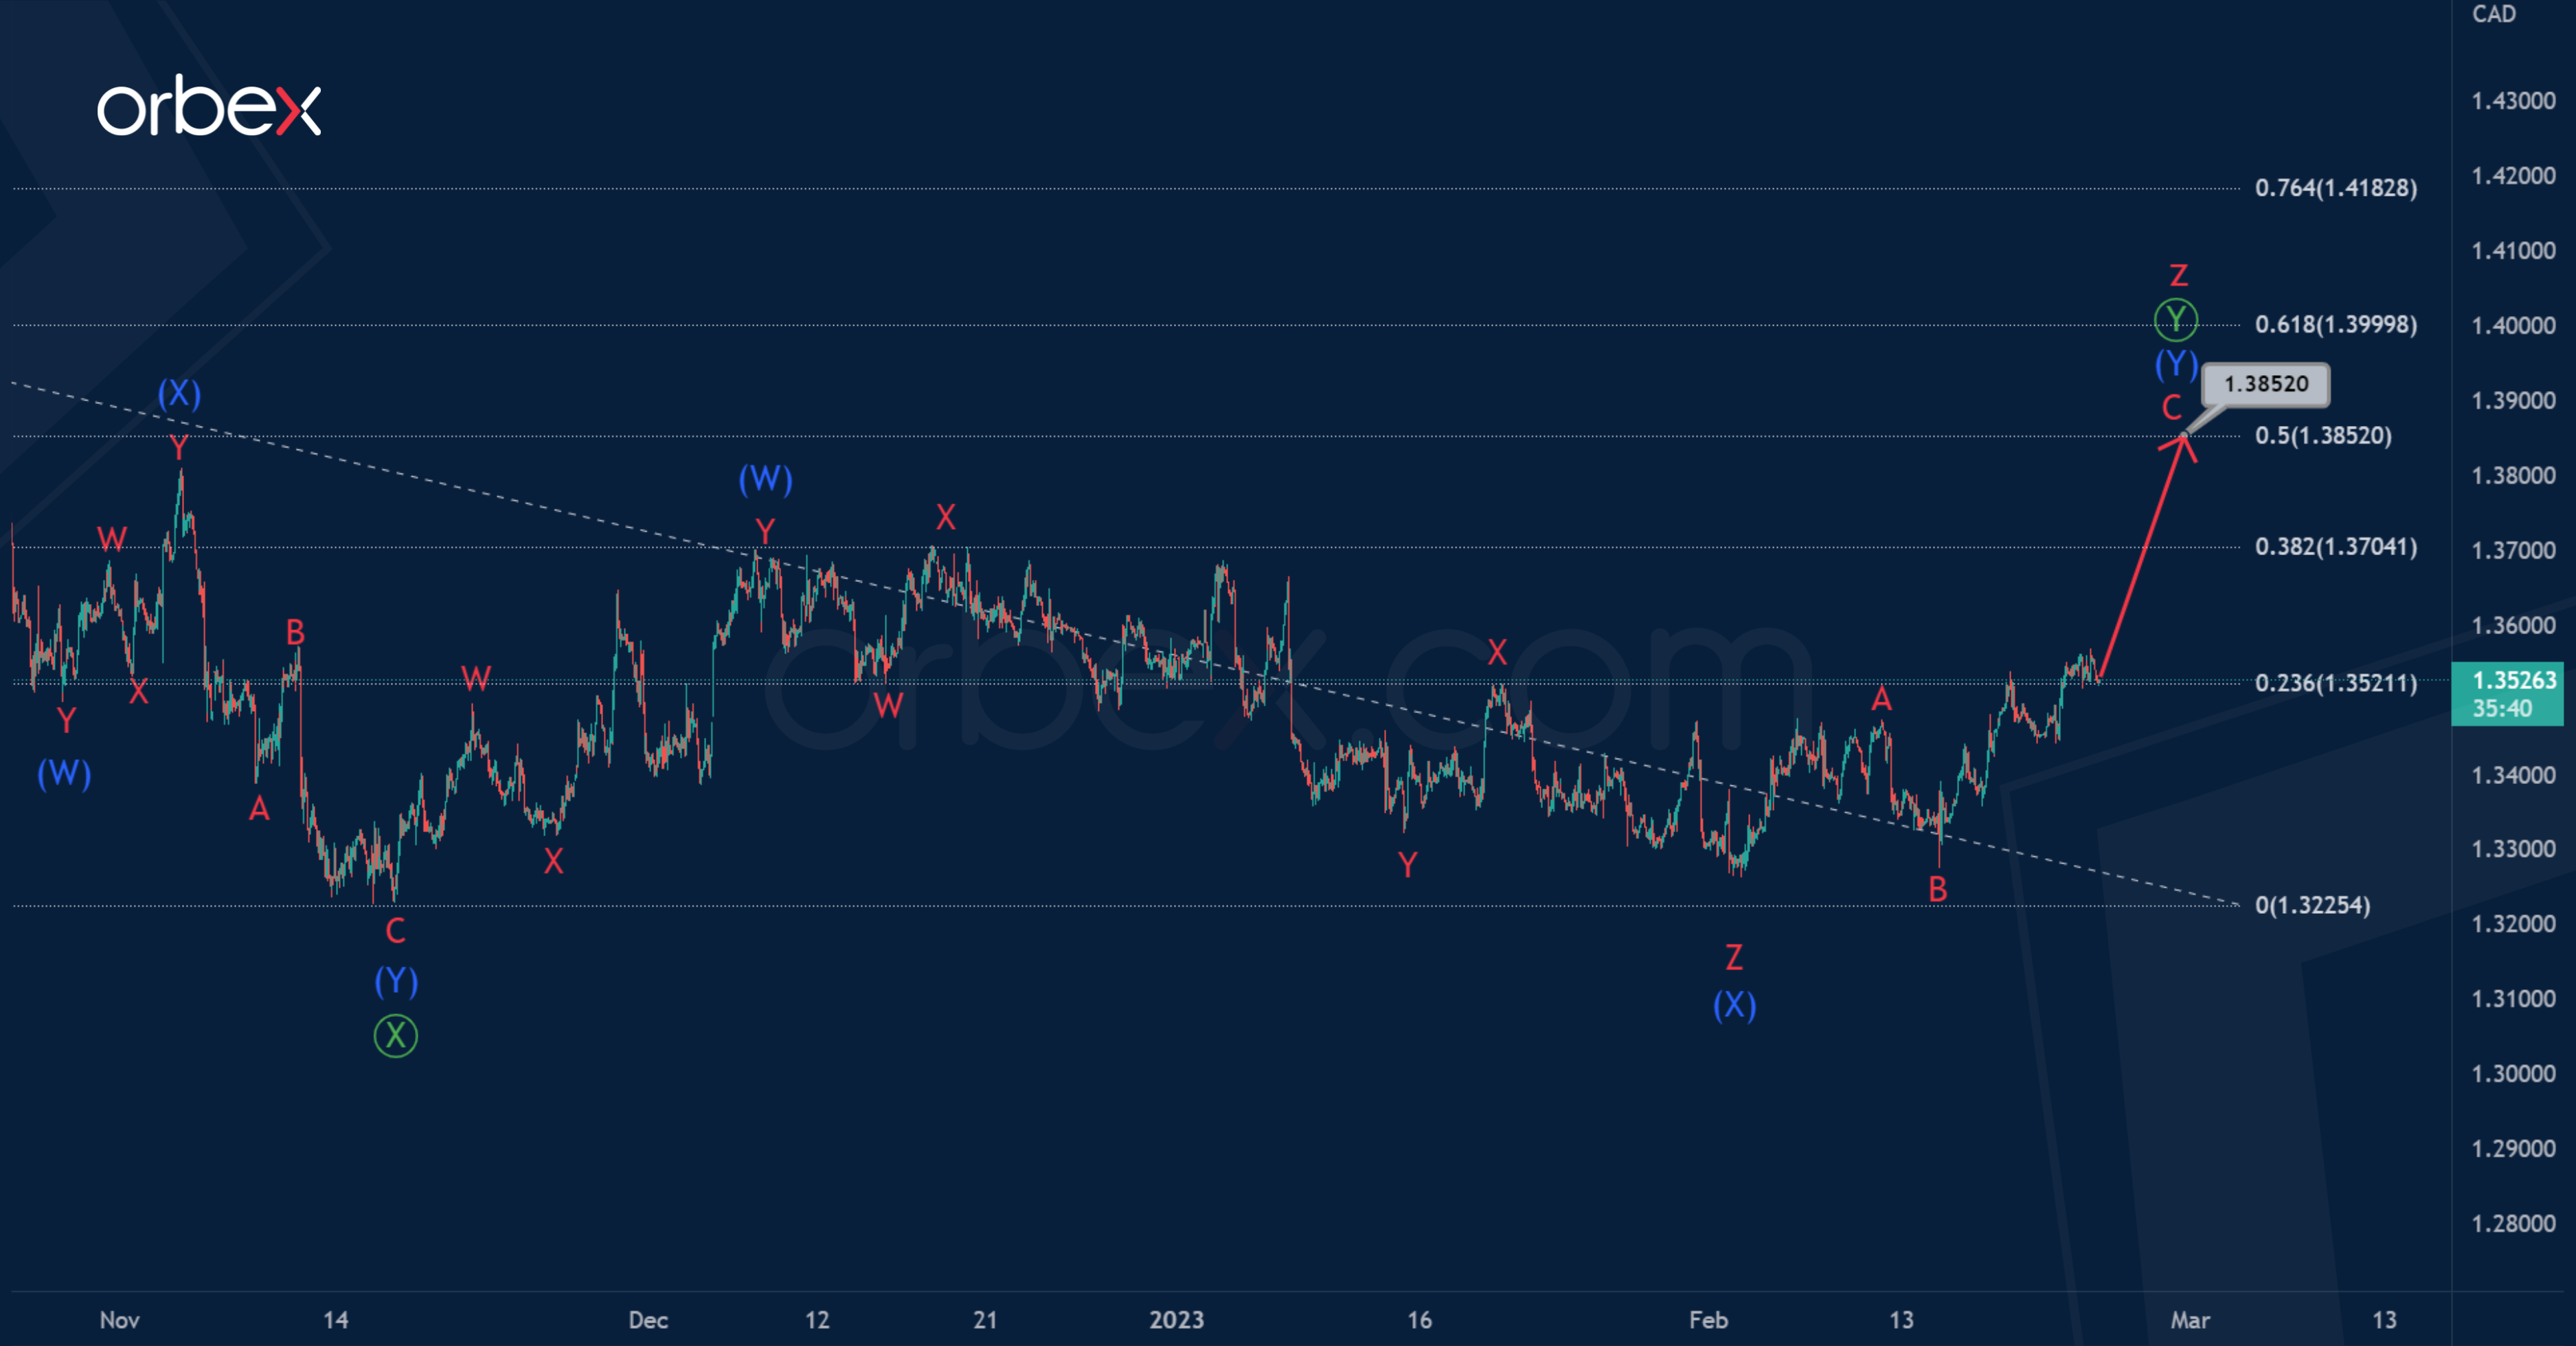
USDCAD suggests the construction of a correction pattern – a triple zigzag consisting of cycle waves w-x-y-x-z.
The cycle waves w-x-y-x are fully completed, and now the final actionary leg is being built – the sub-wave z. Apparently, the wave z takes the form of a primary double zigzag Ⓦ-Ⓧ-Ⓨ, where the sub-waves Ⓦ-Ⓧ are formed.
At the moment, the market may be in the process of building the last wave.
It can end in the form of a double zigzag (W)-(X)-(Y) near 1.385 level. At that level, it will be at 50% of zigzag wave Ⓦ.
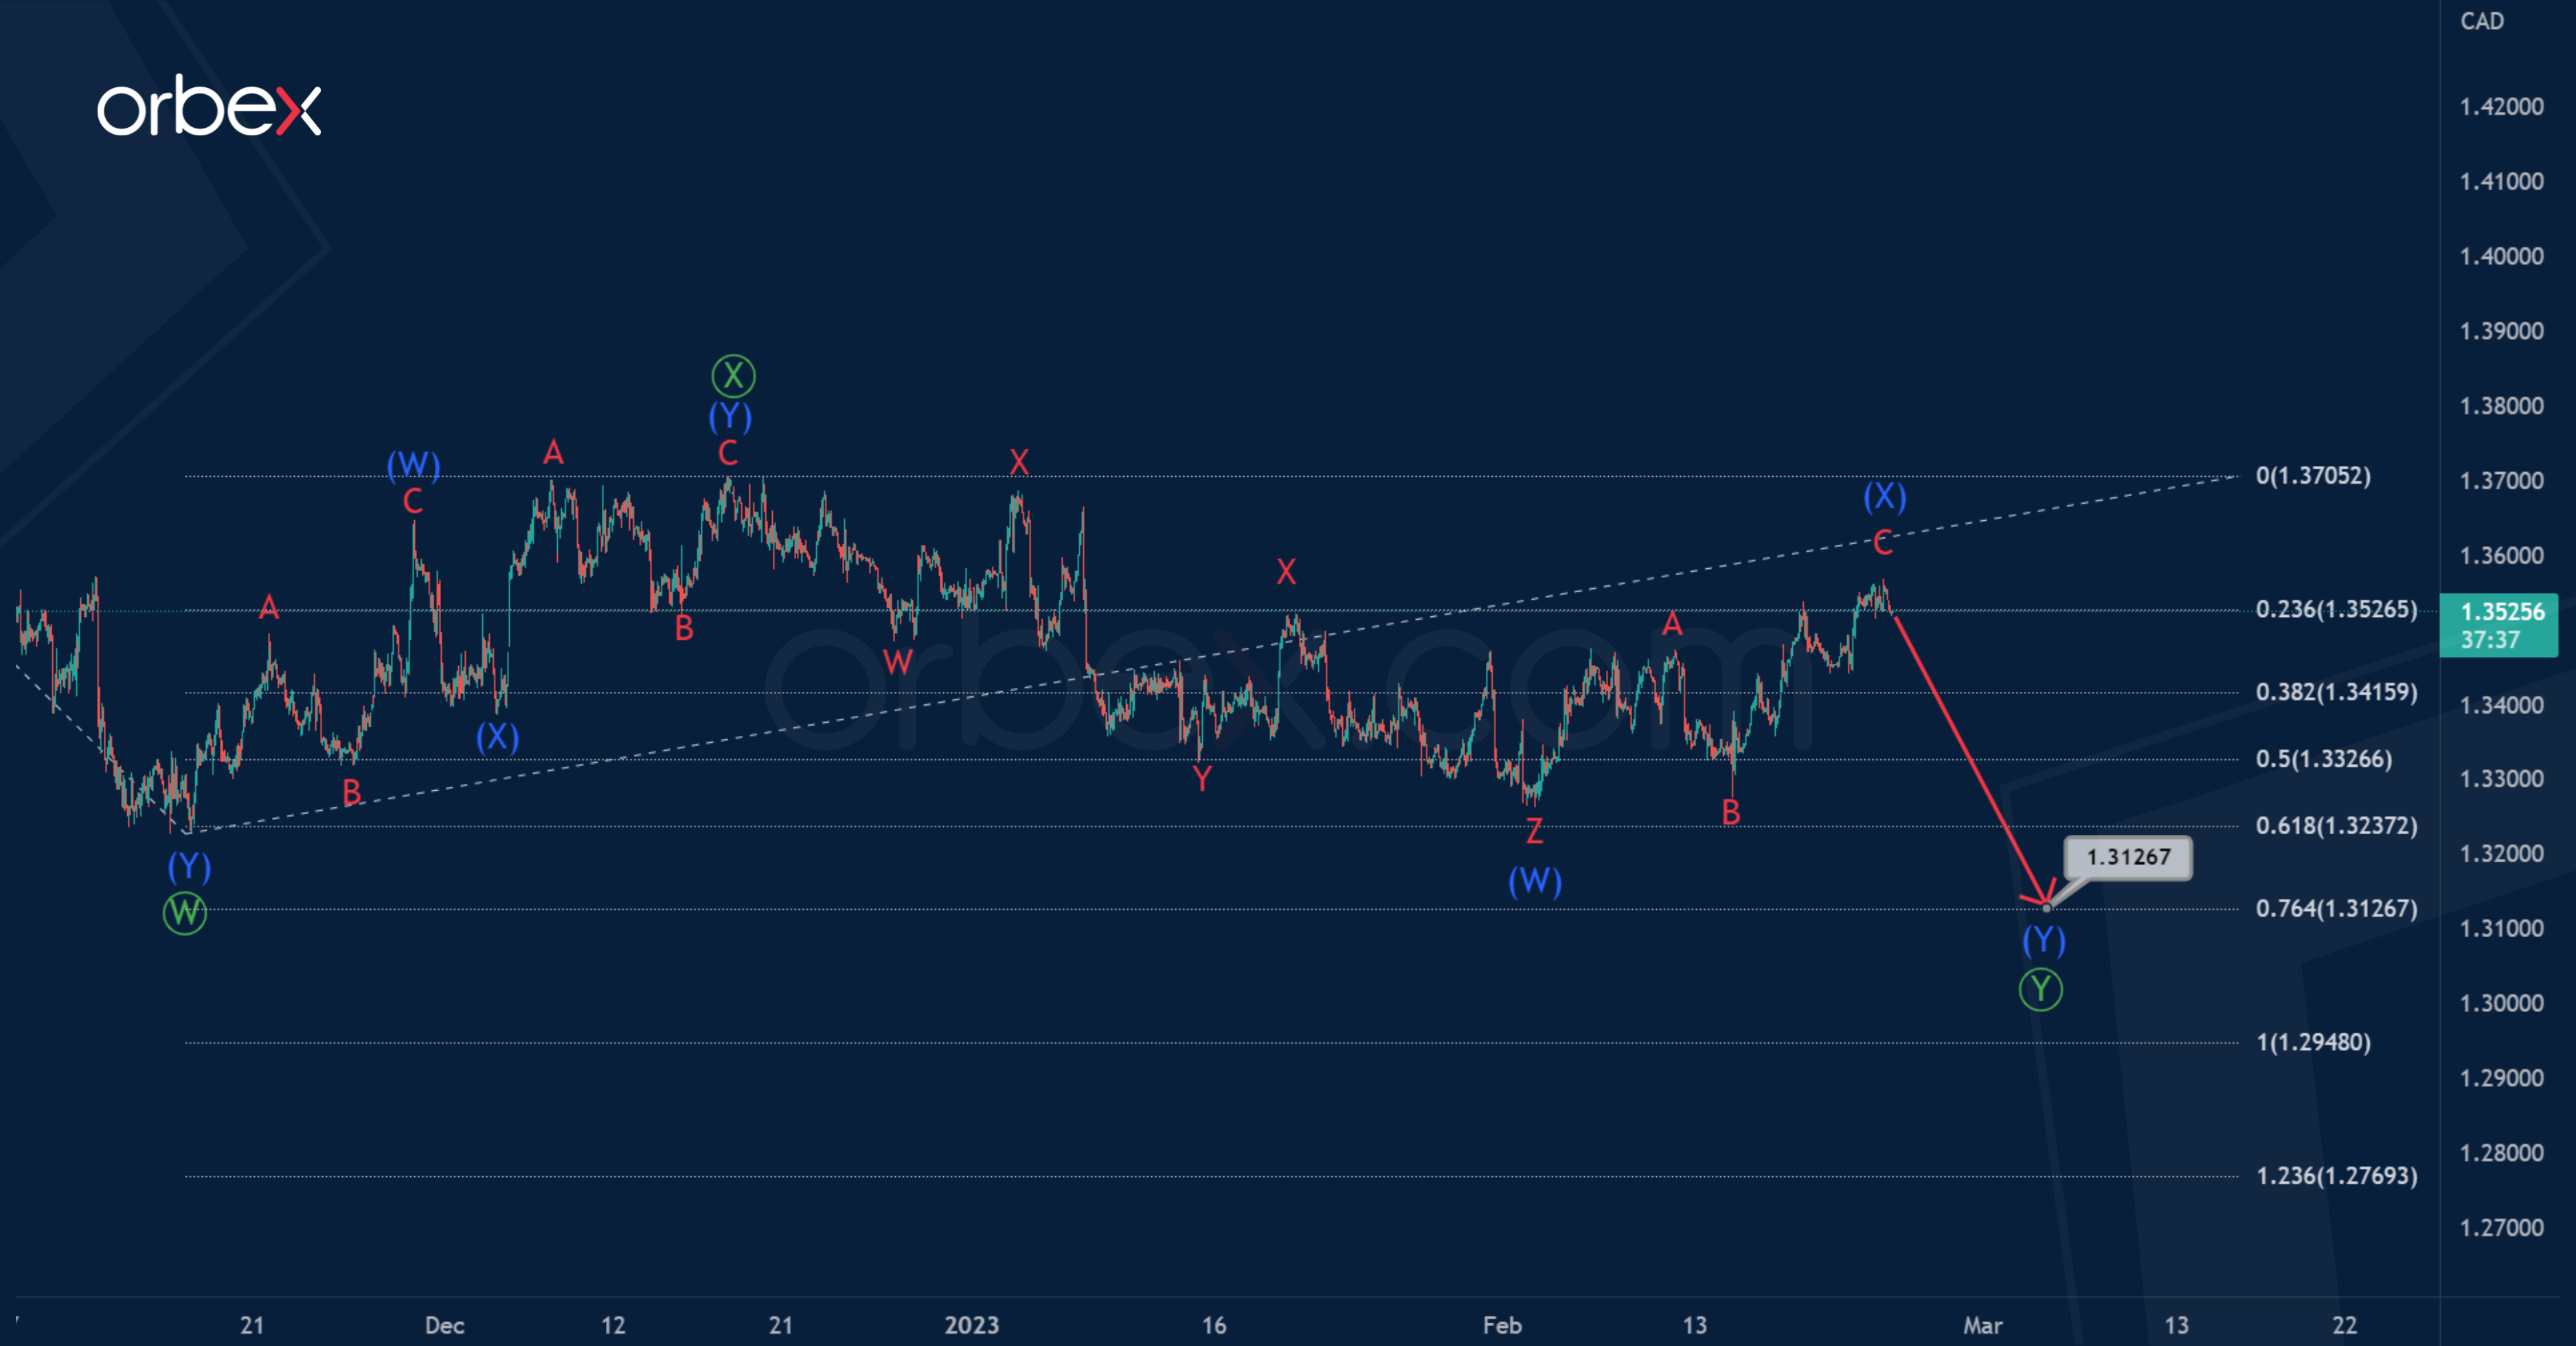
It is worth considering an alternative scenario. According to this view, the initial part of a new bearish trend can now be built.
Perhaps there is a construction of the primary double zigzag Ⓦ-Ⓧ-Ⓨ, which is the beginning in a larger correction pattern.
Perhaps the primary waves Ⓦ-Ⓧ have already been completed.
In the near future, a continuation of the bearish primary wave Ⓨ is possible. It has a double zigzag structure (W)-(X)-(Y). The end of the decline in the intermediate wave (Y) is expected near 1.312. At that level, Ⓨ will be at 76.4% of Ⓦ.
Dollar Index: Hawkish Fed Adds to Dollar’s Bullish Stance
The dollar is consolidating within a tight range in early Thursday, following advance previous day and keeps overall bullish tone.
The minutes of Fed’s last policy meeting, released on Wednesday, reiterated central bank’s hawkish stance, although policymakers favored easing of the pace of interest rate hikes, they pointed to high inflation as key factor in the size and pace of further rate hikes, keeping the door open for possible acceleration in policy tightening.
The dollar index was in a steady ascend in past four weeks, inflated by hawkish signals from Fed and growing expectations that the central bank would remain in extended tightening path and, if needed, return to more aggressive mode, as series of strong rate hikes in 2022 started to show results on easing inflation, but obviously not at desired rate, keeping the levels which are unacceptably high for the central bank.
Daily studies remain bullish and underpin the action, with consolidation / shallow correction on fading bullish momentum and stochastic at the border of overbought zone, expected to offer better buying opportunities.
Dips should be ideally contained by daily Tenkan-sen (103.48) which marks initial and solid support, with potential deeper pullback expected to find ground above the base of daily Ichimoku cloud (102.86) to keep larger bulls in play.
Only sustained break of daily Kijun-sen (102.62) would sideline bulls and risk deeper drop.
Last Friday’s spike high and top of rising daily cloud (104.59) mark immediate resistance, break of which would expose strong barriers at 106.00/30 zone (Fibo 38.2% of 114.72/100.66 downtrend/weekly cloud top/200DMA).
Res: 104.59; 105.40; 106.03; 106.30.
Sup: 104.24; 103.98; 103.48; 102.86.
AUDUSD Plummets But 200-day SMA Curbs Secline
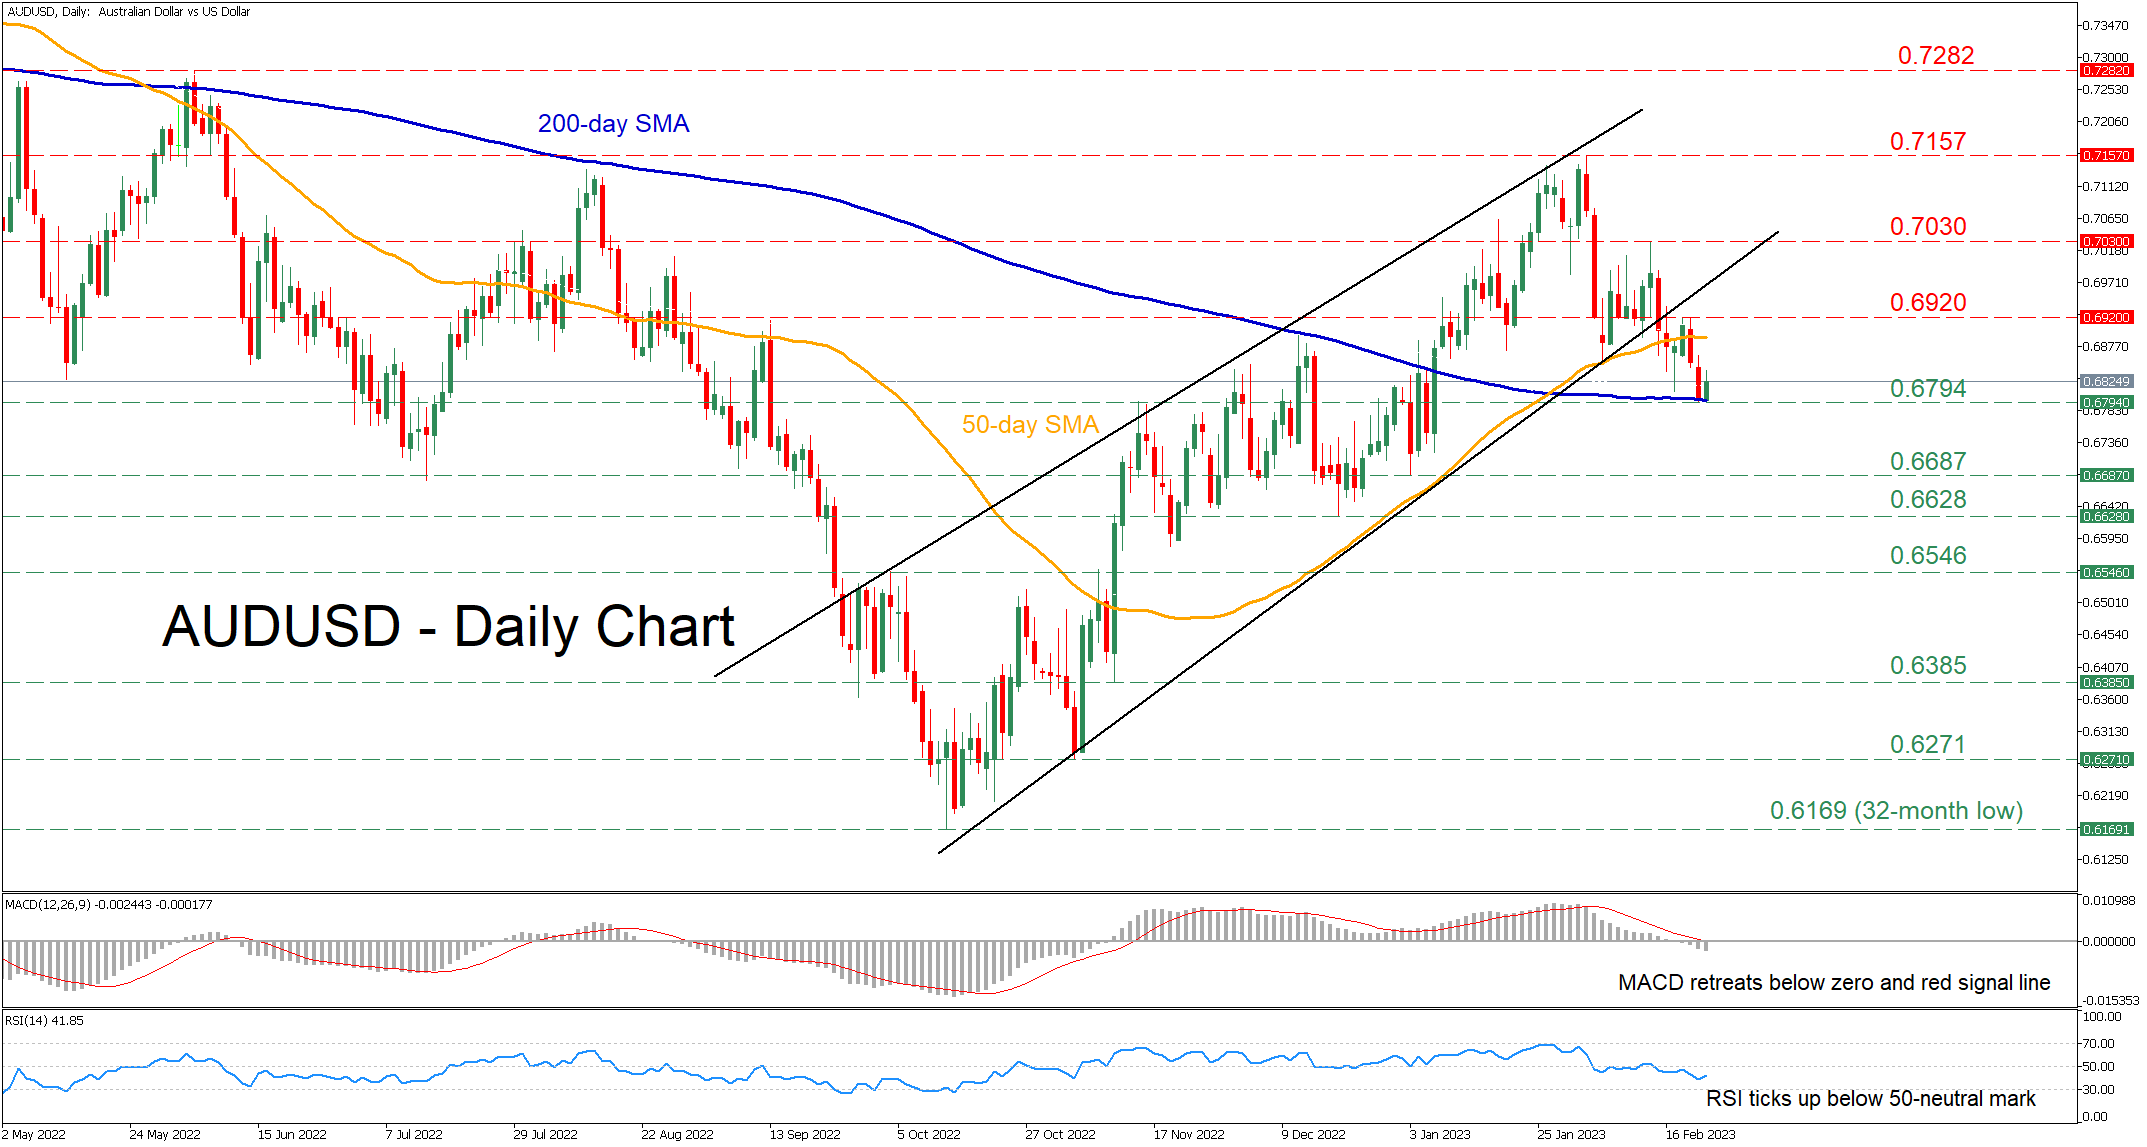
AUDUSD had been staging an impressive rebound, trading within an upward sloping channel since mid-October. Nevertheless, the pair experienced a moderate pullback in the short term, with the price escaping its pattern to the downside to find strong support at the 200-day simple moving average (SMA).
The momentum indicators currently suggest that bearish forces have gained total control. Specifically, the MACD histogram is softening below both zero and its red signal line, while the RSI is pointing upwards but remains well beneath its 50-neutral mark.
Should selling pressures intensify further, the pair could decline to retest the 200-day SMA, currently at 0.6794. Sliding beneath that zone, the bears might aim for the January low of 0.6687 before the December bottom of 0.6628 comes under examination. Even lower, further retreats could come to a halt at the 0.6546 barrier.
On the flipside, bullish actions might encounter initial resistance at the 0.6920 hurdle. Conquering this barricade, the pair could ascend towards 0.7030 or higher to challenge the recent trend rejection point of 0.7157. Should that obstacle fail, the June high of 0.7282 may appear on the radar.
Overall, AUDUSD seems to be experiencing some weakness after its medium-term bullish pattern broke to the downside. However, there is room for recovery in the case that the pair bounces off the 200-day SMA.
WTI Oil Futures at Risk of a Bearish Breakout
WTI oil futures came under renewed selling pressure on Wednesday, speeding their decline to the bottom of its range area seen around 73.35.
The region has been a significant support zone since the start of the year, making another rebound likely as the Stochastic oscillator is approaching its previous lows below its 20 oversold level. Still, the indicator has not attempted to change direction to the upside, while the falling RSI has yet to reach its 30 oversold level, although it’s close to its February low, both backing a bearish bias.
In other discouraging signs, the 20-day exponential moving average (EMA) could not cross above the 50-day EMA, playing down any hopes for a bullish trend reversal. Besides, the rectangle established at the bottom of the previous downtrend is usually considered a bearish trend continuation pattern.
Hence, the focus will remain on the 73.35 base in the coming sessions, a break of which could initially stall somewhere between the 70.00 psychological mark and the 50% Fibonacci retracement level of the 2020-2021 upleg at 68.55. Additional losses from here could take a breather within the 65.00-63.70 region, where the lower band of the bearish channel from last February is located.
Should the price drift higher, the 78.00 resistance zone, which triggered the latest decline in the market, will come again under examination. If the bulls find enough buying power to pass through that wall this time, closing above last week’s peak of 80.76 too, they may gain direct access to the important 83.00-84.20 area. The 200-day EMA, the channel’s upper band and the 38.2% Fibonacci mark are all located here. Therefore, a sustainable extension higher may prompt a more exciting rally towards the 88.60 barrier.
In brief, WTI oil futures keep facing a bearish bias, remaining exposed to a breakout below the existing rectangle.