

Sample Category Title
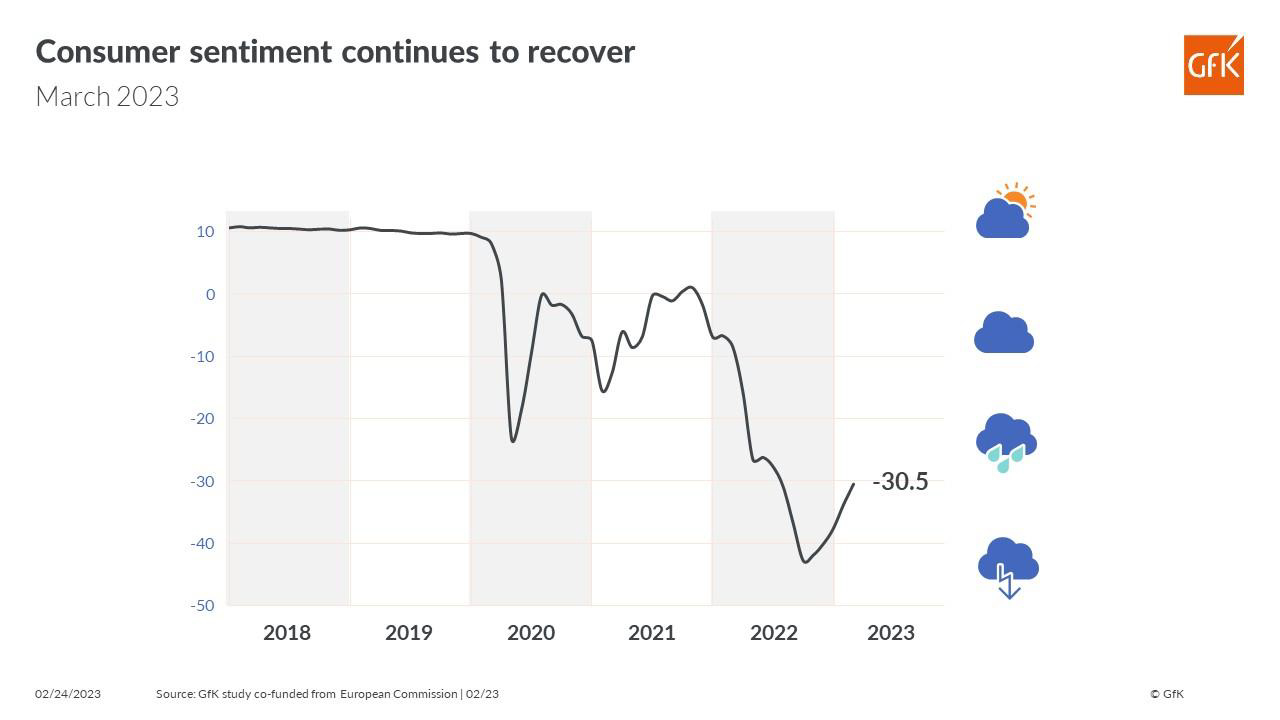
Germany Gfk consumer confidence rose to -30.5, firmly on the path to recovery
Germany Gfk Consumer Confidence for March rose from -33.8 to -30.5, slightly below expectation of -30.0. In February, economic expectations rose from -0.6 to 6.0. Income expectations rose from -32.2 to -27.3. Propensity to buy rose from -18.7 to -17.3.
"Despite ongoing crises, such as the war in Ukraine, a weakening global economy, and high inflation rates, consumer sentiment has once again increased noticeably. It thus remains firmly on the path to recovery, even if the level remains low. Consumer pessimism, which peaked last fall, is fading", explains Rolf Bürkl, GfK consumer expert.
"Recent drops in energy prices and reports that experts believe a recession in Germany this year can now be avoided mean that optimism is slowly returning."
Japanese Inflation Keeps Rising
Market movers today
Today, we get the final Q4 GDP data from Germany but otherwise it should be a quiet day in Europe.
During US hours it gets a bit busier as the January data on personal spending and new home sales is released.
In the central bank calendar, we have ECB's Nagel and a flurry of Fed speakers on the wires.
The 60 second overview
It has been a mixed picture on the Asian markets this morning on the back of the Japanese inflation and the hearing at the lower house from BoJ governor nominee, Ueda.
Japan's inflation accelerated to a four-decade high. Core inflation, which excludes volatile food prices, climbed to 4.2% y/y in January on the back of rising import costs. However, it was broadly in line with consensus estimate and hence market reaction for USD/JPY was rather subdued. USD/JPY still trading in the 134-135 range.
Ueda's comments were pretty much a non-event for markets. He took a cautious stance and remained neutral. If anything his comments were a bit to the dovish side, as he finds it "appropriate to continue monetary easing measures". Hence, Ueda supported current BoJ governor Kuroda's dovish stance. Kuroda thinks that current inflationary pressures will fade and they are not sustainable enough to reach a stable 2% inflation target. In other words, inflation is transitory (heard that one before?).
Euro area inflation for January was revised up as expected, following the inclusion of the delayed German data. The revision was 0.1 percentage points for both headline and core inflation, to 8.6% and 5.3% y/y, respectively. Attention now turns to the February data due next week.
The Central Bank of Turkey (CBRT) cut its policy rate by 50bp to 8.5% yesterday, which was less than consensus expected (100bp). Quite surprisingly, the CBRT also re-introduced the word 'adequate' when describing the current monetary policy stance in the statement, signalling that further rate cuts for now are less likely. The CBRT already had a dovish bias before the earthquakes hit Turkey as they had just removed the word 'adequate' from their previous monetary policy statement, and after the quakes, some market participants were even expecting a 150bp cut. TRY was stable after the decision, perhaps reflecting that the cut was less than expected, but there are also several government support measures for lira in place. Also worth noting, while the official policy rate is at 8.5%, banks have to offer a substantially higher (>30%) interest rate for their client deposits because they face a penalty if the share of their lira deposits falls too low. As long as Turkey continues to foster unorthodox economic policies, maintaining an artificially strong currency and cutting rates in a high inflation environment, imbalances will continue to grow and the risk of a currency crisis, even if not acute, remains.
FI: Global bond yields declined yesterday and the curve continued to invert from the long end despite higher than expected prices in the revised GDP data for Q4 and a better than expected national activity index. The decline in yields was driven by a combination of an index extension next week in the US treasury market and that fact that the next bond auction in the US Treasury market is not until March 7, so there will be no supply when the duration on the index is increased at the end of the month.
FX: Spot moves have been rather limited over the last 24 hours with most notably several events out of Japan failing to do much to the JPY even if the Japanese currency has benefited from the slight setback to global yields. PLN and NOK have been the recent outperformers with especially NOK enjoying higher oil prices. EUR/SEK keeps hovering above the 11.00-mark while EUR/USD trades close to 1.06.
Credit: It was a relatively quiet day in credit markets yesterday and CDS indices held mostly steady; iTraxx Main was unchanged at 80bp while Xover tightened slightly by 4bp to 415bp. The primary market saw deals from US apparel company VF Corporation as well as a senior preferred bond from the Italian lender Banca Monte dei Paschi di Siena.
Nordic macro
The Swedish NIER releases its monthly survey at 09:00. Consumers remain extremely downbeat about their own economy but also the economy as a whole, although the latest surveys suggest levels have stabilised and even picked up somewhat. Construction remain in the doldrums as well and here the arrow points south. Retail is extremely weak too, whereas manufacturing has held up relatively well, though on the verge of dropping below 100, the cut off between growth and slowdown. Price plans are perhaps even more interesting. As Per Jansson mentioned in the Minutes he is worried about the fact companies' price plans except for the construction sector remain at elevated levels and indicate that unusually many of them still plan to increase prices going forward which "highlights the risk of companies changing their pricing behaviour."
In Denial
US stocks had a wobbling trading session yesterday. The S&P500 tipped a toe below its 50-DMA yesterday, near 3980, then rebounded to close the session around 0.50% higher, above the 4000 psychological mark.
Nasdaq 100 saw support into the 12000 psychological mark and gained almost 1% into the close.
The 14% jump in Nvidia certainly helped improve the overall market mood, whereas the US economic data was mixed and was not supposed to pour water on the equity bears or improve sentiment regarding the Federal Reserve (Fed) hawks.
The latest GDP update from the US revealed that the US economy expanded 2.7% in the Q4, instead of 2.9% penciled in by analyst. A softer economic growth could have been encouraging for easing inflation and softening the Fed’s hand. BUT NO, because the GDP price index – another gauge of inflation which was released along with the GDP update, showed that inflation in the Q4 eased but eased much less than expected – as a perfect reflection of the CPI and PPI data released last week.
The cocktail of slower-than-expected growth and higher-than-expected inflation is the worst possible outcome, and we could see the latter reflected in the corporate earnings.
The S&P500 companies now all reported their results and earnings fell 1% in the latest quarter. At first glance, this is not a good number, but these earnings are compared to the blockbuster post-pandemic numbers, and despite a fall, they remain high.
The question is, how far they will fall. It will depend on several factors, including how aggressive the Fed will continue tightening policy. How aggressive the Fed will continue tightening policy will depend on how sticky inflation is.
We have one more important data point to watch before the week ends… and that’s the US PCE index, the Fed’s favourite gauge of inflation. Given the previous inflation data, we know that inflation has certainly eased, but not as much as expected.
If there is not a big surprise, there should be no bloody market reaction to a slightly higher than expected PCE index. The S&P500 could close the week above the 50-DMA, and Nasdaq above its major 38.2% Fibonacci retracement.
There is one more thing that probably helps equities hold their ground, and that’s the easing US yields. I believe that the US yields have been easing since a couple of days due to the rising geopolitical tensions between the US and China – after China screamed loud and clear their support to Russia this week. These rising tensions certainly increase the safe haven flows to the US treasuries and interferes with the hawkish Fed pricing. As such, the US 2 and 10-year yields are softer compared to a peak earlier this week.
European stocks up, euro down on record inflation!?
The European stocks gained and the euro fell on Thursday, even though the latest inflation data from the eurozone revealed that the core inflation advanced to a record high.
The rising inflation is normally a boost for the European Central Bank (ECB) hawks, who increase the bets that the ECB will raise the rates more forcefully. The latter should weigh on equity valuations and support the euro.
But no. The contrary is happening because the major driving force of the market is the Fed and the dollar. So, the EURUSD fell as low as 1.0577 yesterday, while the European stocks were upbeat. The DAX index for example is now at pre-war levels, whereas the latest data is less than encouraging for the German economy.
The European exports are recovering to the pre-pandemic levels, but the German exports are clearly lagging behind the zone’s average. Spain and Italy are doing much better than their German peers. Why? Because the energy crisis has taken a toll on German manufacturing, whereas the post-pandemic reopening benefit Spanish and Italian tourism. As a result, the headline data is strong, but the underlying factors warn that the Eurozone growth is perhaps vulnerable. Sticky inflation and hawkish ECB are major risks to the actual European equity rally.
41-year high, Mr. Ueda
Speaking of inflation, the data released this morning showed that inflation in Japan rose to 4.3%, a 41-year high, and gave a rapid boost to the yen, sending the USDJPY down to the 134 mark. But we know that the Bank of Japan (BoJ), under the leadership of its new head Ueda, is not necessarily concerned about the rising inflation. The BoJ prefers keeping rates below zero, for now, and that should continue playing in favour of USDJPY bulls, at a time when the Fed members continue showing the world how serious they are in taming inflation.
USD/CAD Daily Outlook
Daily Pivots: (S1) 1.3516; (P) 1.3548; (R1) 1.3581; More....
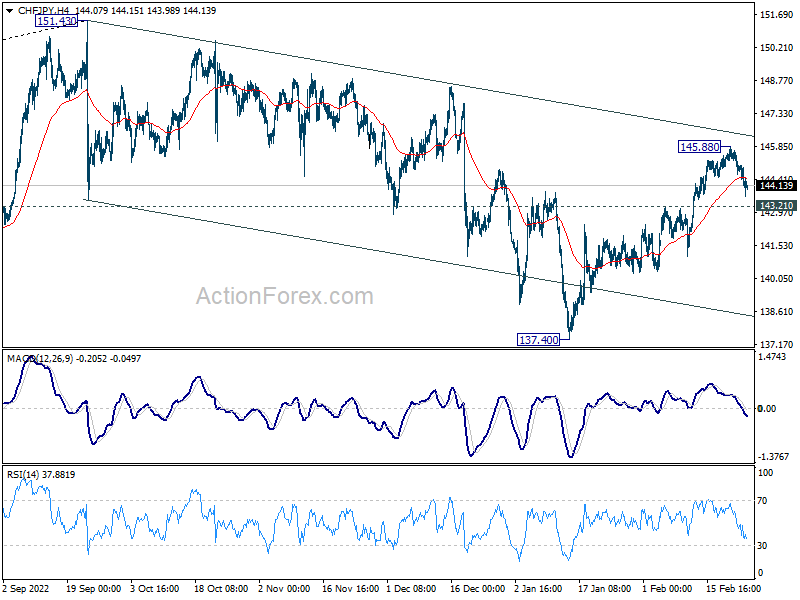
USD/CAD is losing some upside momentum, but further rally is expected as long as 1.3440 support holds. Next target is 1.3684 resistance. Sustained break there will pave the way back to retest 1.3976 high. On the downside, however, break of 1.3440 support will turn bias back to the downside for 1.3261 support again.
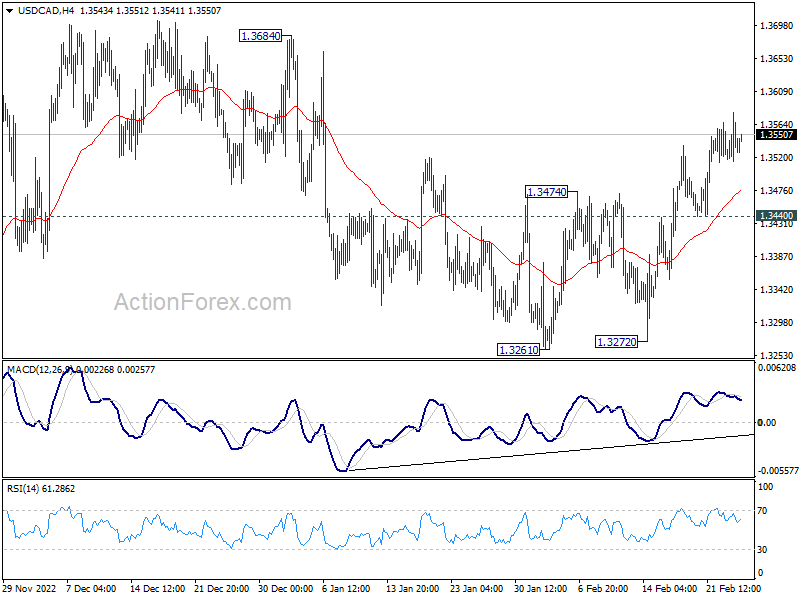
In the bigger picture, as long as 1.3222 cluster support (38.2% retracement of 1.2005 to 1.3976 at 1.3223) holds, larger up trend from 1.2005 (2021 low) is still expected to resume through 1.3976 high at a later stage. However, firm break of 1.3222/3 will indicate that the trend might have reversed. Deeper fall would be seen to next cluster support at 1.2726 (61.8% retracement at 1.2758).
Dollar Maintaining Gains, Focus Turns to PCE Inflation
The forex markets are generally quiet today, with most major pairs and crosses staying inside yesterday's range for now. Dollar is staying in a pole position for the week, maintaining most of the gains. The greenback will look into today's PCE inflation data for next move. Euro and Swiss Franc are both on the weaker side, together with Aussie. Sterling is also firm but lacks momentum to extend the post-PMI rally. Yen is mixed for now after incoming BoJ Governor Kazuo Ueda confirms his dovish stance.
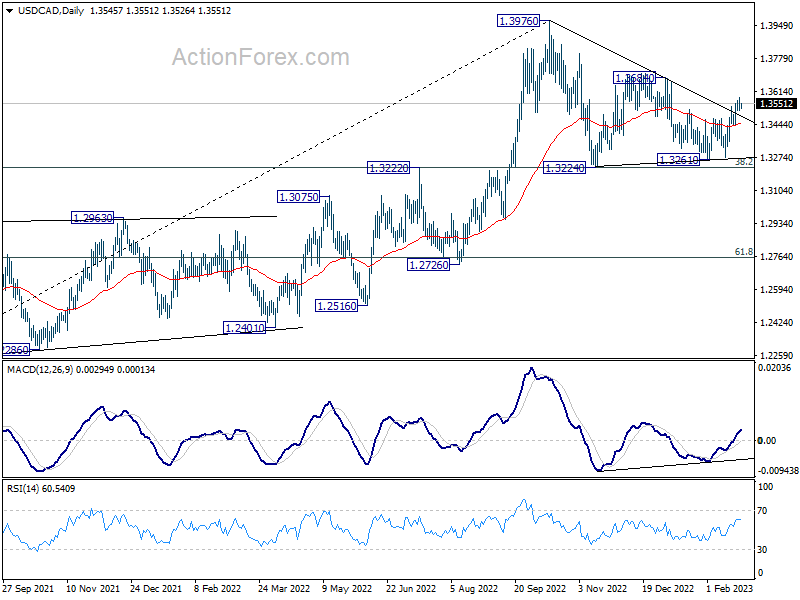
Technically, CHF/JPY's rebound from 137.40 lost momentum after failing to break through near term falling channel. Immediate focus is now back on 143.21 support. Firm break there will argue that such rebound has completed, and the whole corrective fall from 151.43 is extending with another leg. Deeper decline would be seen back towards 137.40. In such case, Swiss Franc's weakness could also be seen in extended rebound in EUR/CHF and GBP/CHF.
In Asia, Nikkei rose 1.29%. Hong Kong HSI is down -1.22%. China Shanghai SSE is down -0.54%. Singapore Strait Times is up 0.63%. Japan 10-year JGB yield is down -0.0069 at 0.496. Overnight, DOW rose 0.33%. S&P 500 rose 0.53%. NASDAQ rose 0.72%. 10-year yield dropped -0.044 to 3.879.
BoJ Ueda: Current policy a necessary, appropriate means to achieve 2% inflation
At a parliamentary confirmation hearing, incoming BoJ Governor Kazuo Ueda said, "current policy is a necessary, appropriate means to achieve 2% inflation," despite various side effects emerging from the stimulus.
"Japan's trend inflation is likely to rise gradually. But it will take some time for inflation to sustainably and stably achieve the BOJ's 2% target," he said.
"Consumer inflation is likely to fall below 2% in the latter half of the next fiscal year. It takes time for the effect of monetary policy to appear on the economy. "
"It's standard practice to act preemptively to demand-driven inflation, but not respond immediately to supply-driven inflation. Otherwise, the BOJ will be cooling demand, worsening economy and pushing down prices by tightening monetary policy."
"If trend inflation heightens significantly and sustained achievement of the BOJ's 2% target comes into sight, the central bank must consider normalizing policy. But if trend inflation lacks strength, the bank must continue how to maintain its ultra-easy policy, while paying attention to deterioration in market function."
Japan CPI core hit 41-yr high at 4.2% in Jan
Japan all item CPI rose from 4.0% yoy to 4.3% yoy in January, below expectation of 4.5% yoy. CPI core (all-item ex-food) rose from 4.0% yoy to 4.2% yoy, matched expectations. CPI core-core (all-item ex-food and energy) rose from 3.0% yoy to 3.2% yoy, matched expectations.
Core CPI rate of 4.2% was the highest in 41-year since September 1981. The core inflation rate stayed above BoJ's 2% target for nine consecutive months.
RBNZ Silk: A tightening pause is being contemplated now
RBNZ Assistant Governor Karen Silk said in a Bloomberg interview "there's still more work to do here" on interest rate and fighting inflation. While "all levels are on the table" for April meeting, the central bank is not contemplating a pause.
"This is still an economy that has excess demand, a tight labor market, and as a consequence both headline inflation and core inflation at levels that are well outside the (target) band," she said.
Regarding April meeting, "all levels are on the table for discussion at every meeting," she said. "I'm not going to turn round and comment on whether we would be looking at 25, 50 or 75, they will all be on the table for discussion and they will depend on the information at hand."
Nevertheless, a pause in tightening is "certainty not something that we're contemplating at this point in time," she said.
Silk also noted that some upside risk was built into the forecast interest peak of 5.5%. However, "without building that in, any variation to that peak would have been still at the margin," she said. "There's potentially still some upside risk on the fiscal side of it. Let's just see how it plays out over the next six weeks."
Looking ahead
Germany Gfk consumer confidence and Q4 GDP final are the only feature in European session. US will release personal income and spending with PCE inflation, and new home sales.
USD/CAD Daily Outlook
Daily Pivots: (S1) 1.3516; (P) 1.3548; (R1) 1.3581; More....
USD/CAD is losing some upside momentum, but further rally is expected as long as 1.3440 support holds. Next target is 1.3684 resistance. Sustained break there will pave the way back to retest 1.3976 high. On the downside, however, break of 1.3440 support will turn bias back to the downside for 1.3261 support again.
In the bigger picture, as long as 1.3222 cluster support (38.2% retracement of 1.2005 to 1.3976 at 1.3223) holds, larger up trend from 1.2005 (2021 low) is still expected to resume through 1.3976 high at a later stage. However, firm break of 1.3222/3 will indicate that the trend might have reversed. Deeper fall would be seen to next cluster support at 1.2726 (61.8% retracement at 1.2758).
Economic Indicators Update
| GMT | Ccy | Events | Actual | Forecast | Previous | Revised |
|---|---|---|---|---|---|---|
| 23:30 | JPY | National CPI Core Y/Y Jan | 4.20% | 4.20% | 4.00% | |
| 00:01 | GBP | GfK Consumer Confidence Feb | -38 | -40 | -45 | |
| 07:00 | EUR | Germany Gfk Consumer Confidence Mar | -30 | -33.9 | ||
| 07:00 | EUR | Germany GDP Q/Q Q4 F | -0.20% | -0.20% | ||
| 13:30 | USD | Personal Income M/M Jan | 1.00% | 0.20% | ||
| 13:30 | USD | Personal Spending Jan | 1.00% | -0.20% | ||
| 13:30 | USD | PCE Price Index M/M Jan | 0.50% | 0.10% | ||
| 13:30 | USD | PCE Price Index Y/Y Jan | 4.90% | 5.00% | ||
| 13:30 | USD | Core PCE Price Index M/M Jan | 0.40% | 0.30% | ||
| 13:30 | USD | Core PCE Price Index Y/Y Jan | 4.10% | 4.40% | ||
| 15:00 | USD | Michigan Consumer Sentiment Index Feb F | 66.4 | 66.4 | ||
| 15:00 | USD | New Home Sales Jan | 620K | 616K |
Technical Outlook and Review
USD/JPY:
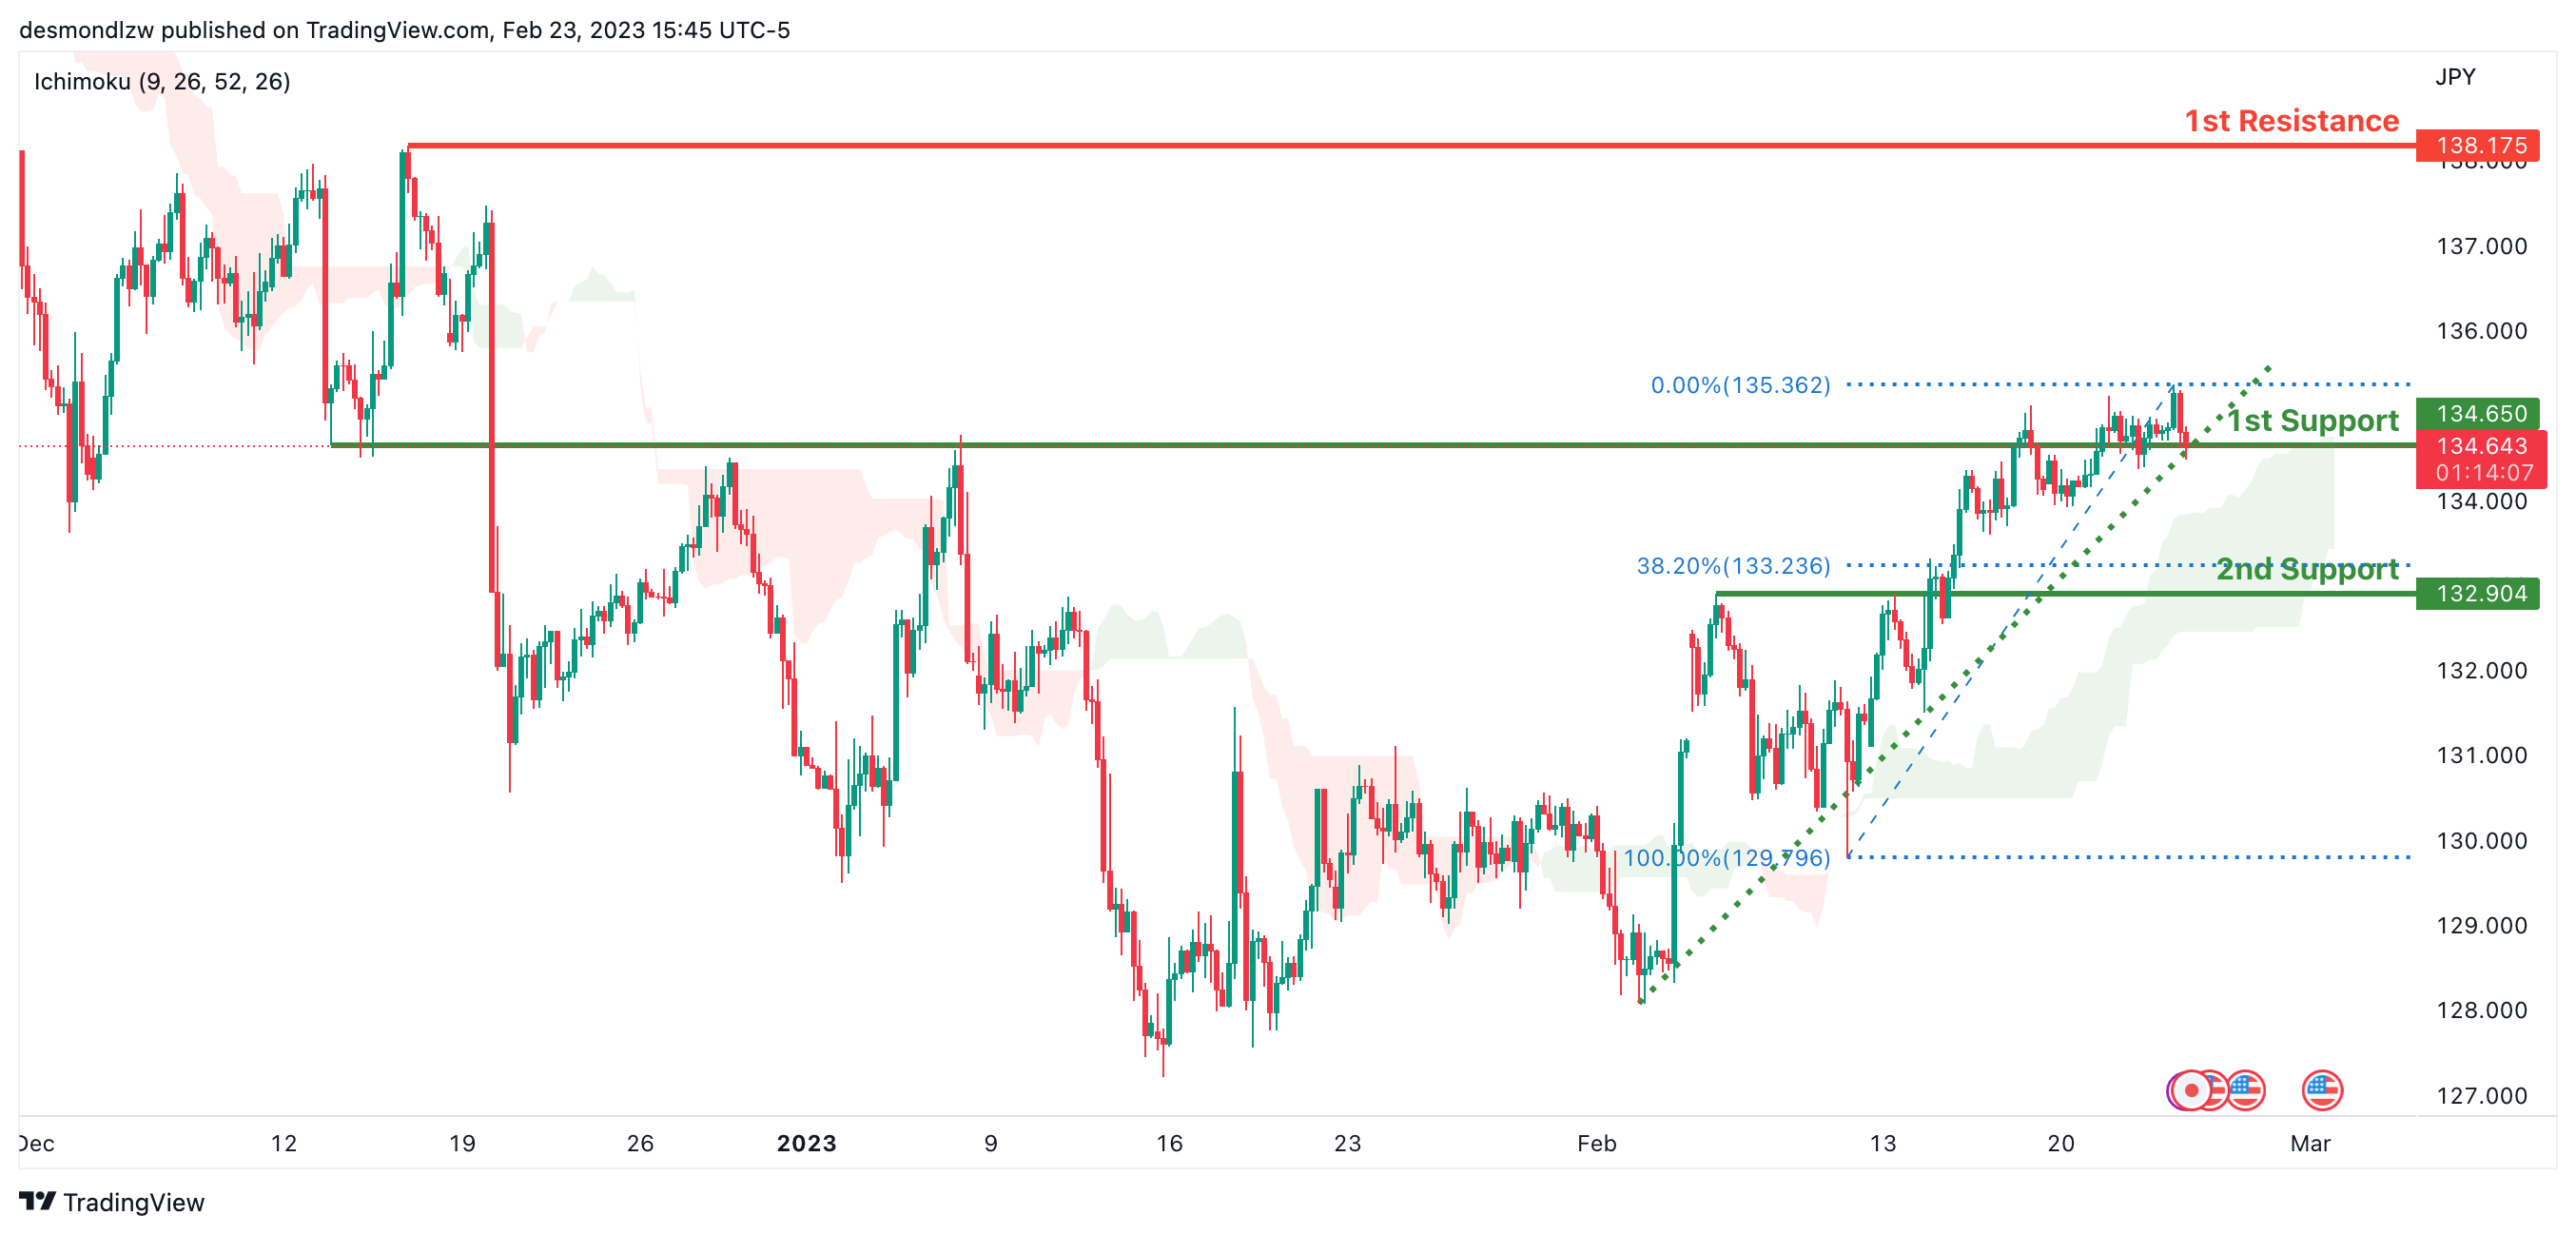
Looking at the H4 chart, my overall bias for USDJPY is bullish due to the current price being above the Ichimoku cloud, indicating a bullish market. To add confluence to this bias, price is also along an ascending trendline.If this bullish momentum continues, expect the price to continue heading towards the 1st resistance at 138.175, where the previous swing high is.
In an alternate scenario, price could possibly head back down to break the 1st support at 134.650, where the overlap support is before heading towards the 2nd support at 132.904, where the overlap support and 38.2% Fibonacci line is.
Areas of consideration:
- H4 time frame, 1st resistance at 138.175
- H4 time frame, 1st support at 134.650
- H4 time frame, 2nd support at 132.904
DXY:
Looking at the H4 chart, my overall bias for DXY is bullish due to the current price crossing above the Ichimoku cloud, indicating a bullish market. To add confluence to this bias, price is also along an ascending trendline.If this bullish momentum continues, expect the price to possibly break the 1st resistance at 104.667, where the recent high and 78.6% Fibonacci line is before heading towards the 2nd resistance at 105.631, where the previous swing high is.
In an alternative scenario, price could head back down to retest the 1st support at 103.740, where the overlap support and 38.2% Fibonacci line is.
Areas of consideration:
- H4 time frame, 1st resistance at 104.667
- H4 time frame, 2nd resistance at 105.631
- H4 time frame, 1st support at 103.740

EUR/USD:
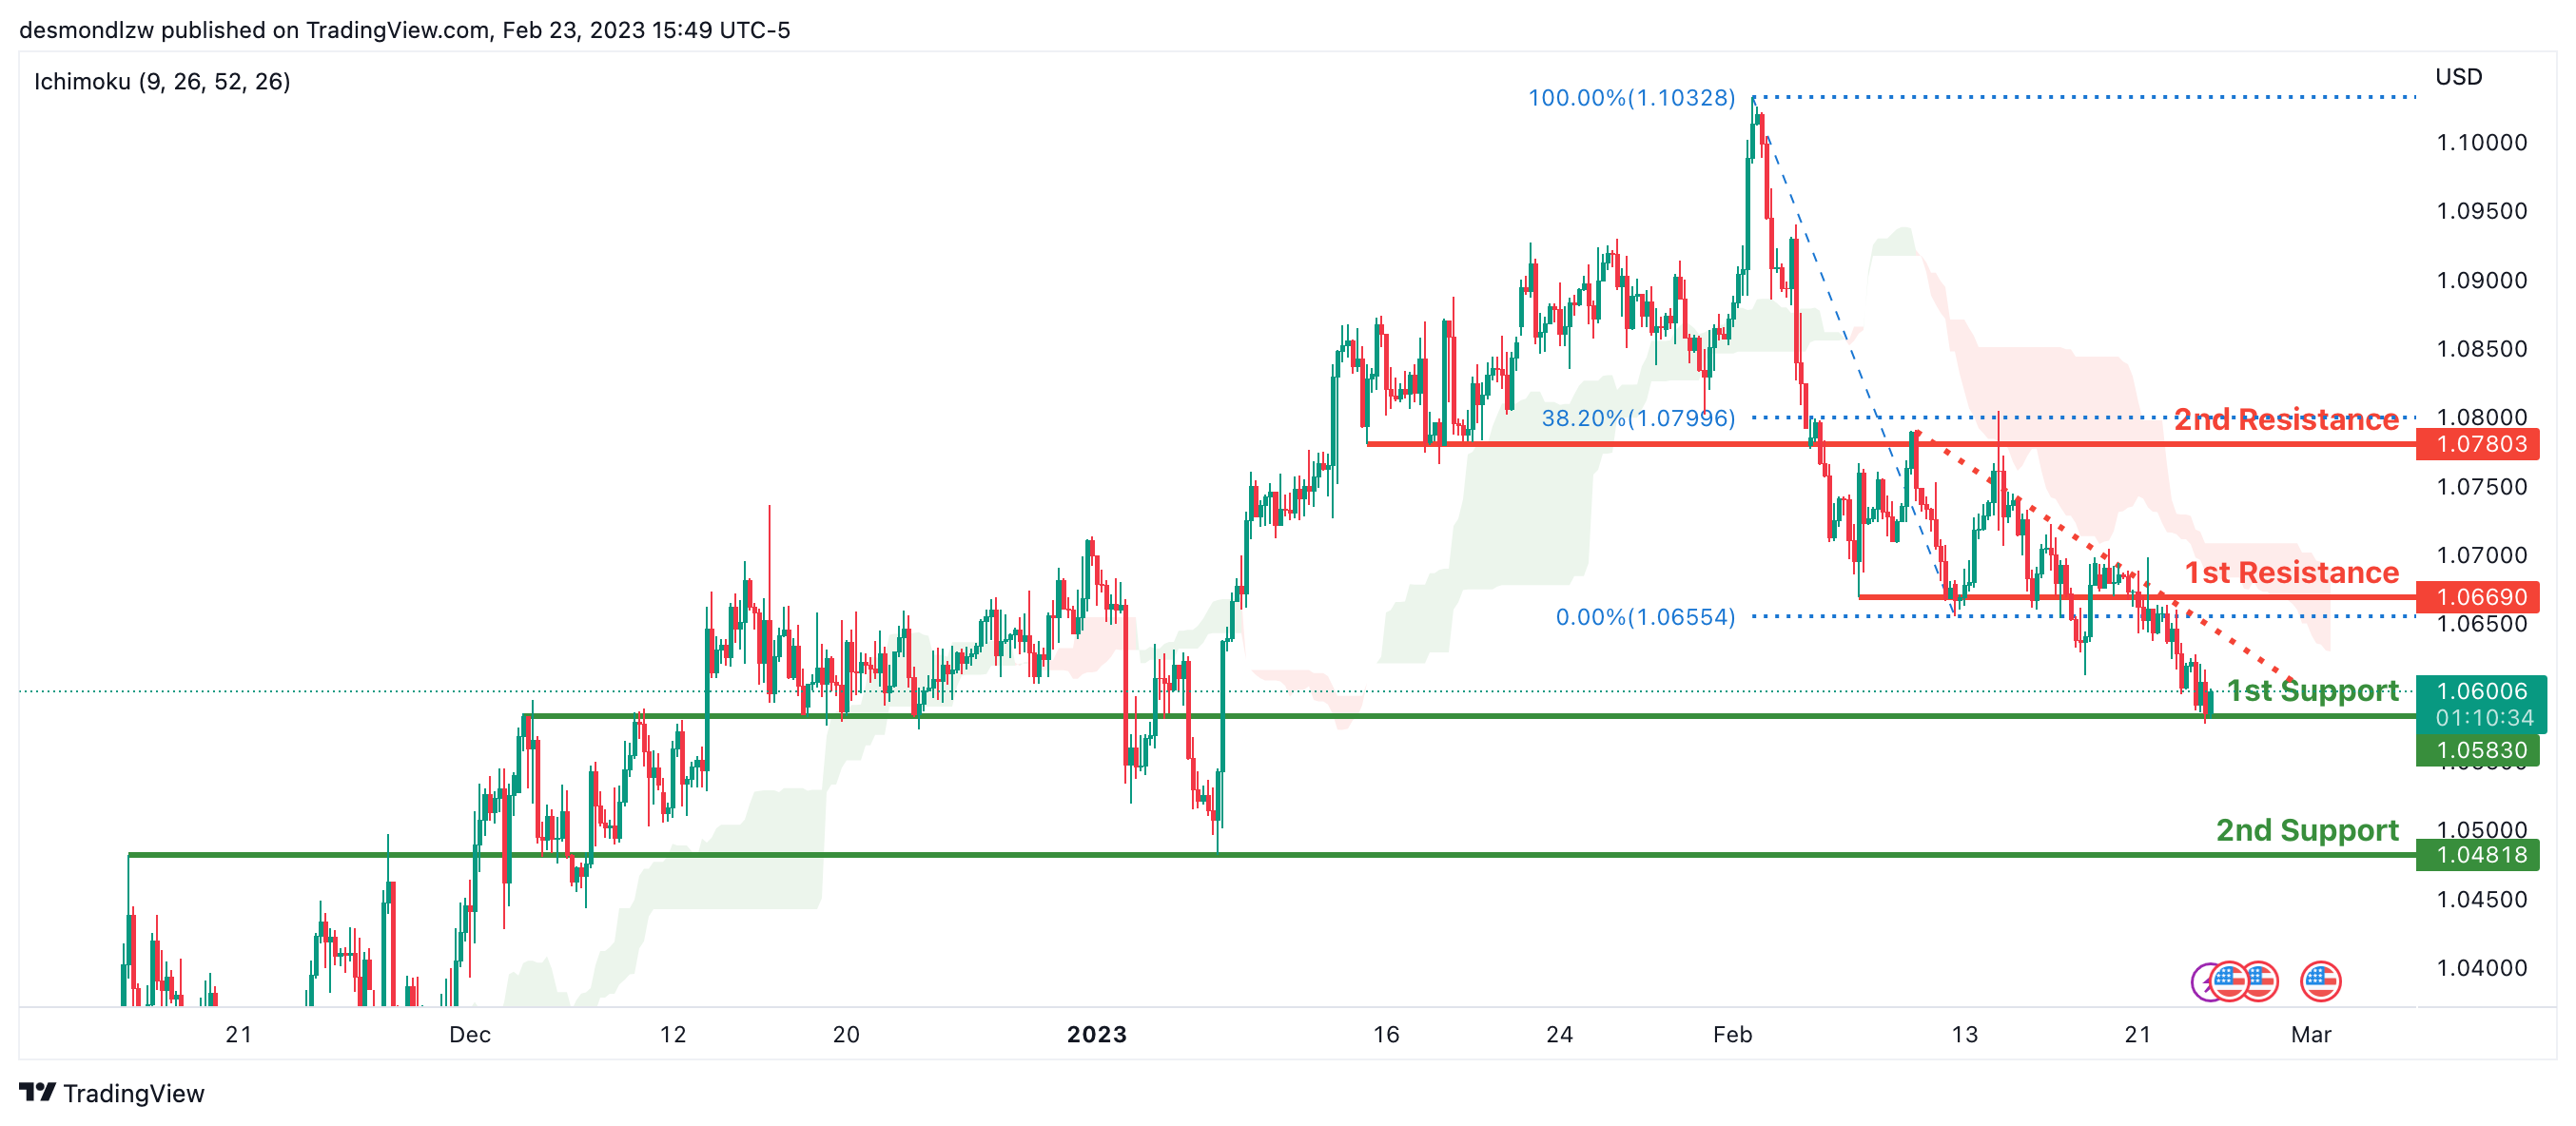
Looking at the H4 chart, my overall bias for EURUSD is bearish due to the current price crossing below the Ichimoku cloud, indicating a bearish market structure. To add confluence to this bias, price is also along a descending trendline.If this bearish momentum continues, expect the price to head towards the 1st support at 1.05830 which is the overlap support.
In an alternate scenario, price could possibly head back up to retest the 1st resistance at 1.06690, where the overlap support is.
Areas of consideration :
- H4 1st resistance at 1.06690
- H4 1st support at 1.05830
GBP/USD:
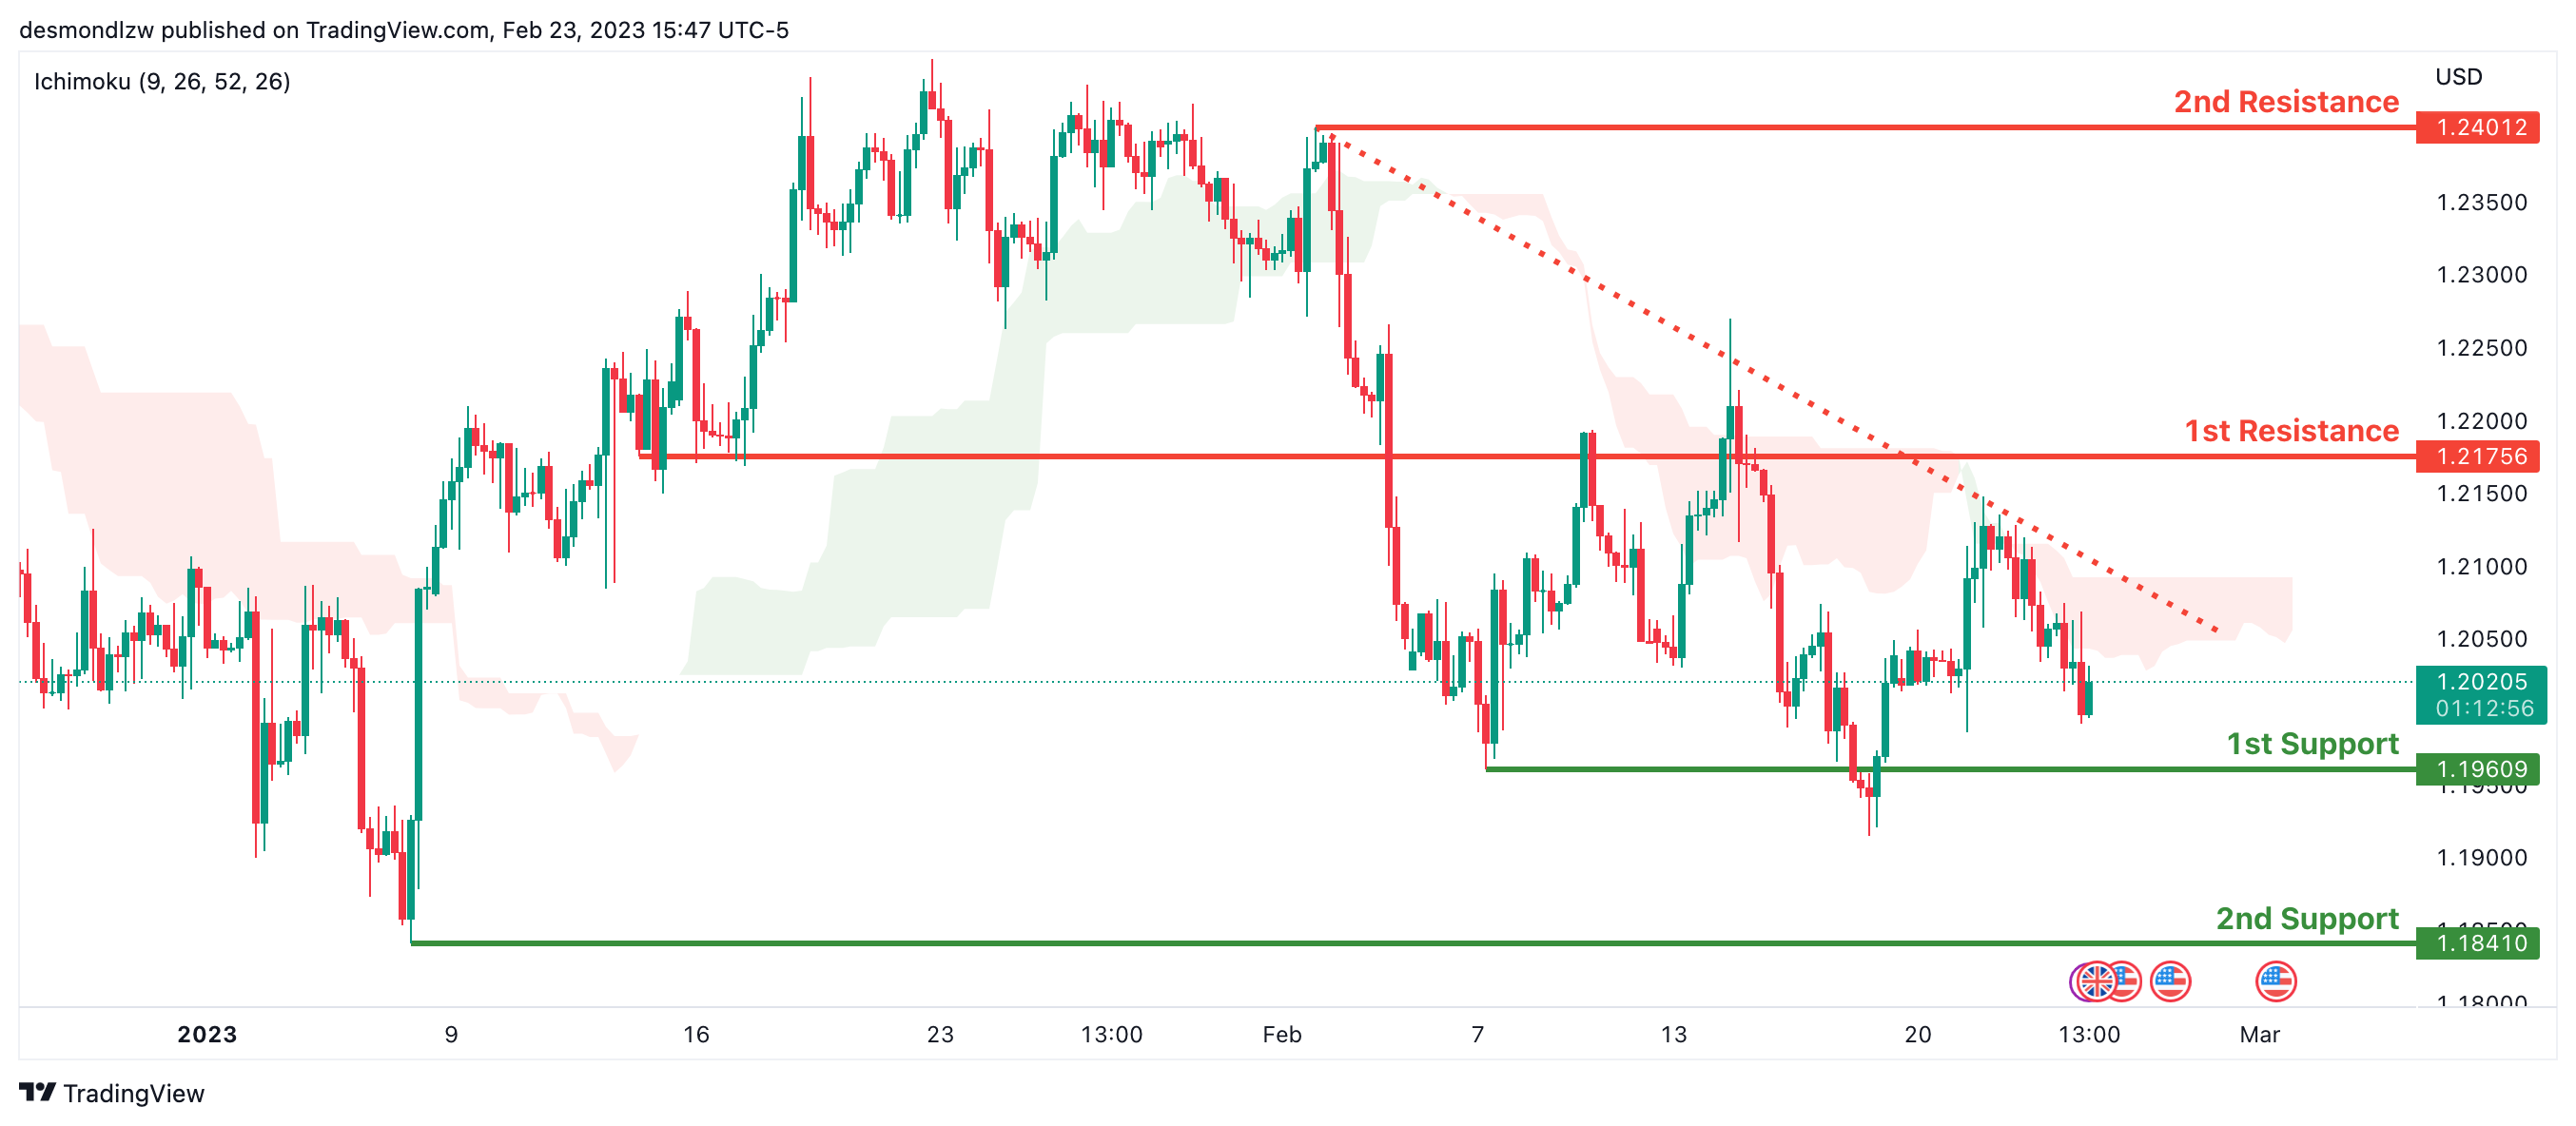
Looking at the H4 chart, my overall bias for GBPUSD is bearish due to the current price crossing below the Ichimoku cloud, indicating a bearish market. To add confluence to this bias, price is also along a descending trendline.If this bearish momentum continues, expect the price to possibly break the 1st support at 1.19609, where the recent swing low is, before heading towards the 2nd support at 1.18410, where the previous swing low is.
In an alternate scenario, price could head back up to retest the 1st resistance line at 1.21756 where the overlap resistance is.
Areas of consideration:
- H4 1st resistance at 1.21756
- H4 1st support at 1.19609
- H4 2nd support at 1.18410
USD/CHF:
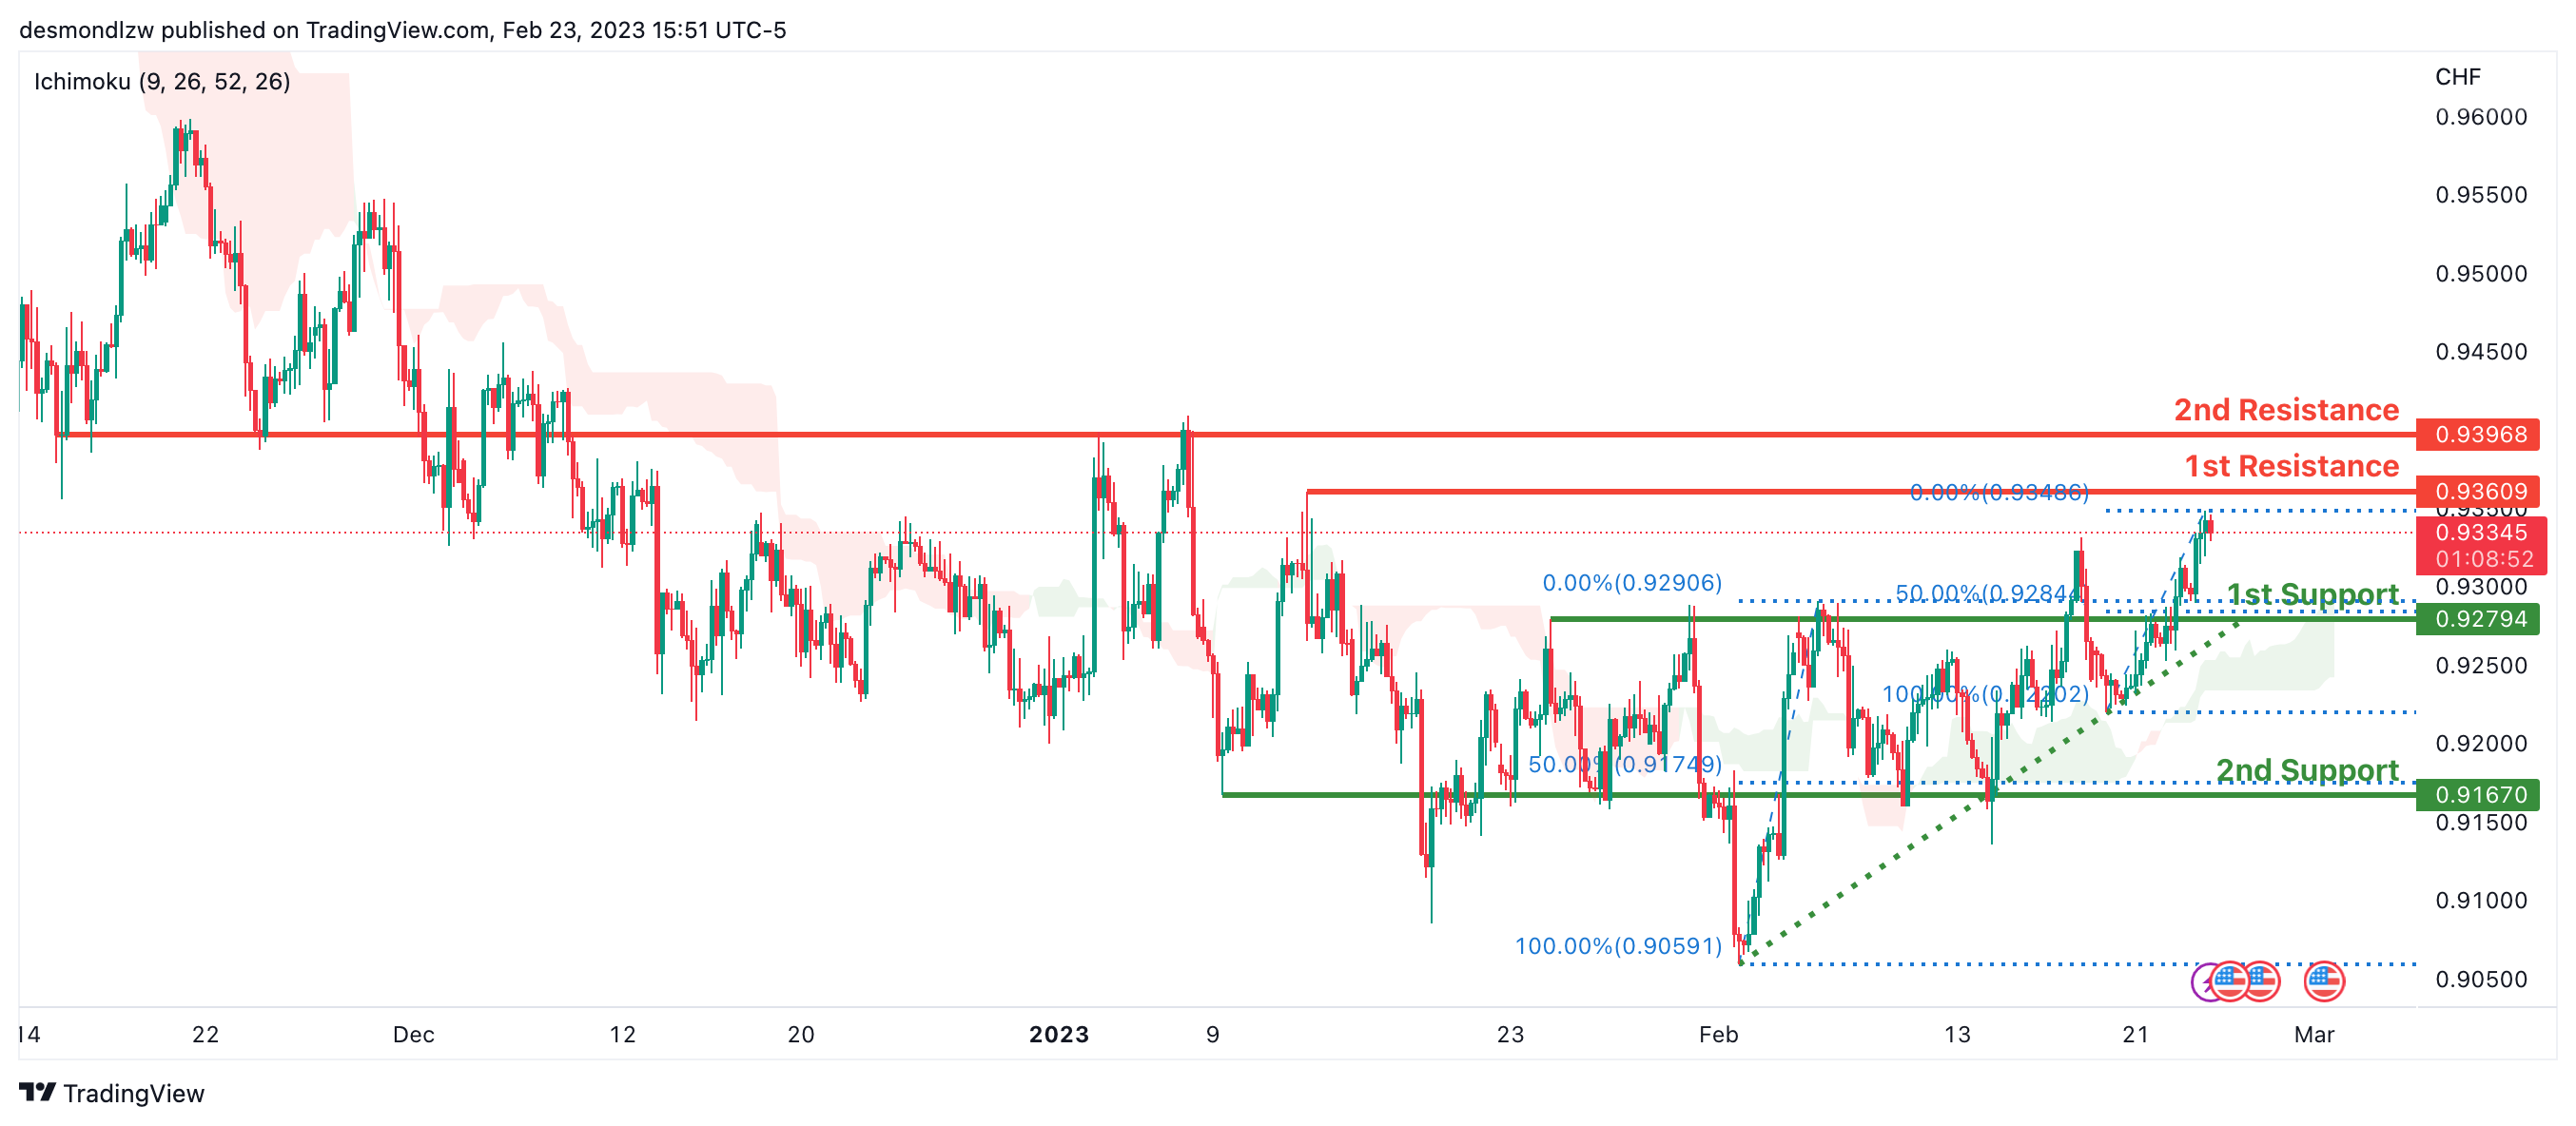
Looking at the H4 chart, my overall bias for USDCHF is bullish due to the current price being above the Ichimoku cloud, indicating a bullish market. To add confluence to this bias, price is also along an ascending trendline.If the current bullish trend continues, expect the price to possibly continue heading towards the 1st resistance at 0.93609 where the intermediate high is.In an alternative scenario, price could possibly head back down to retest the 1st support at 0.92794, where the previous swing high is
Areas of consideration
- H4 1st support at 0.92794
- H4 1st resistance at 0.93609
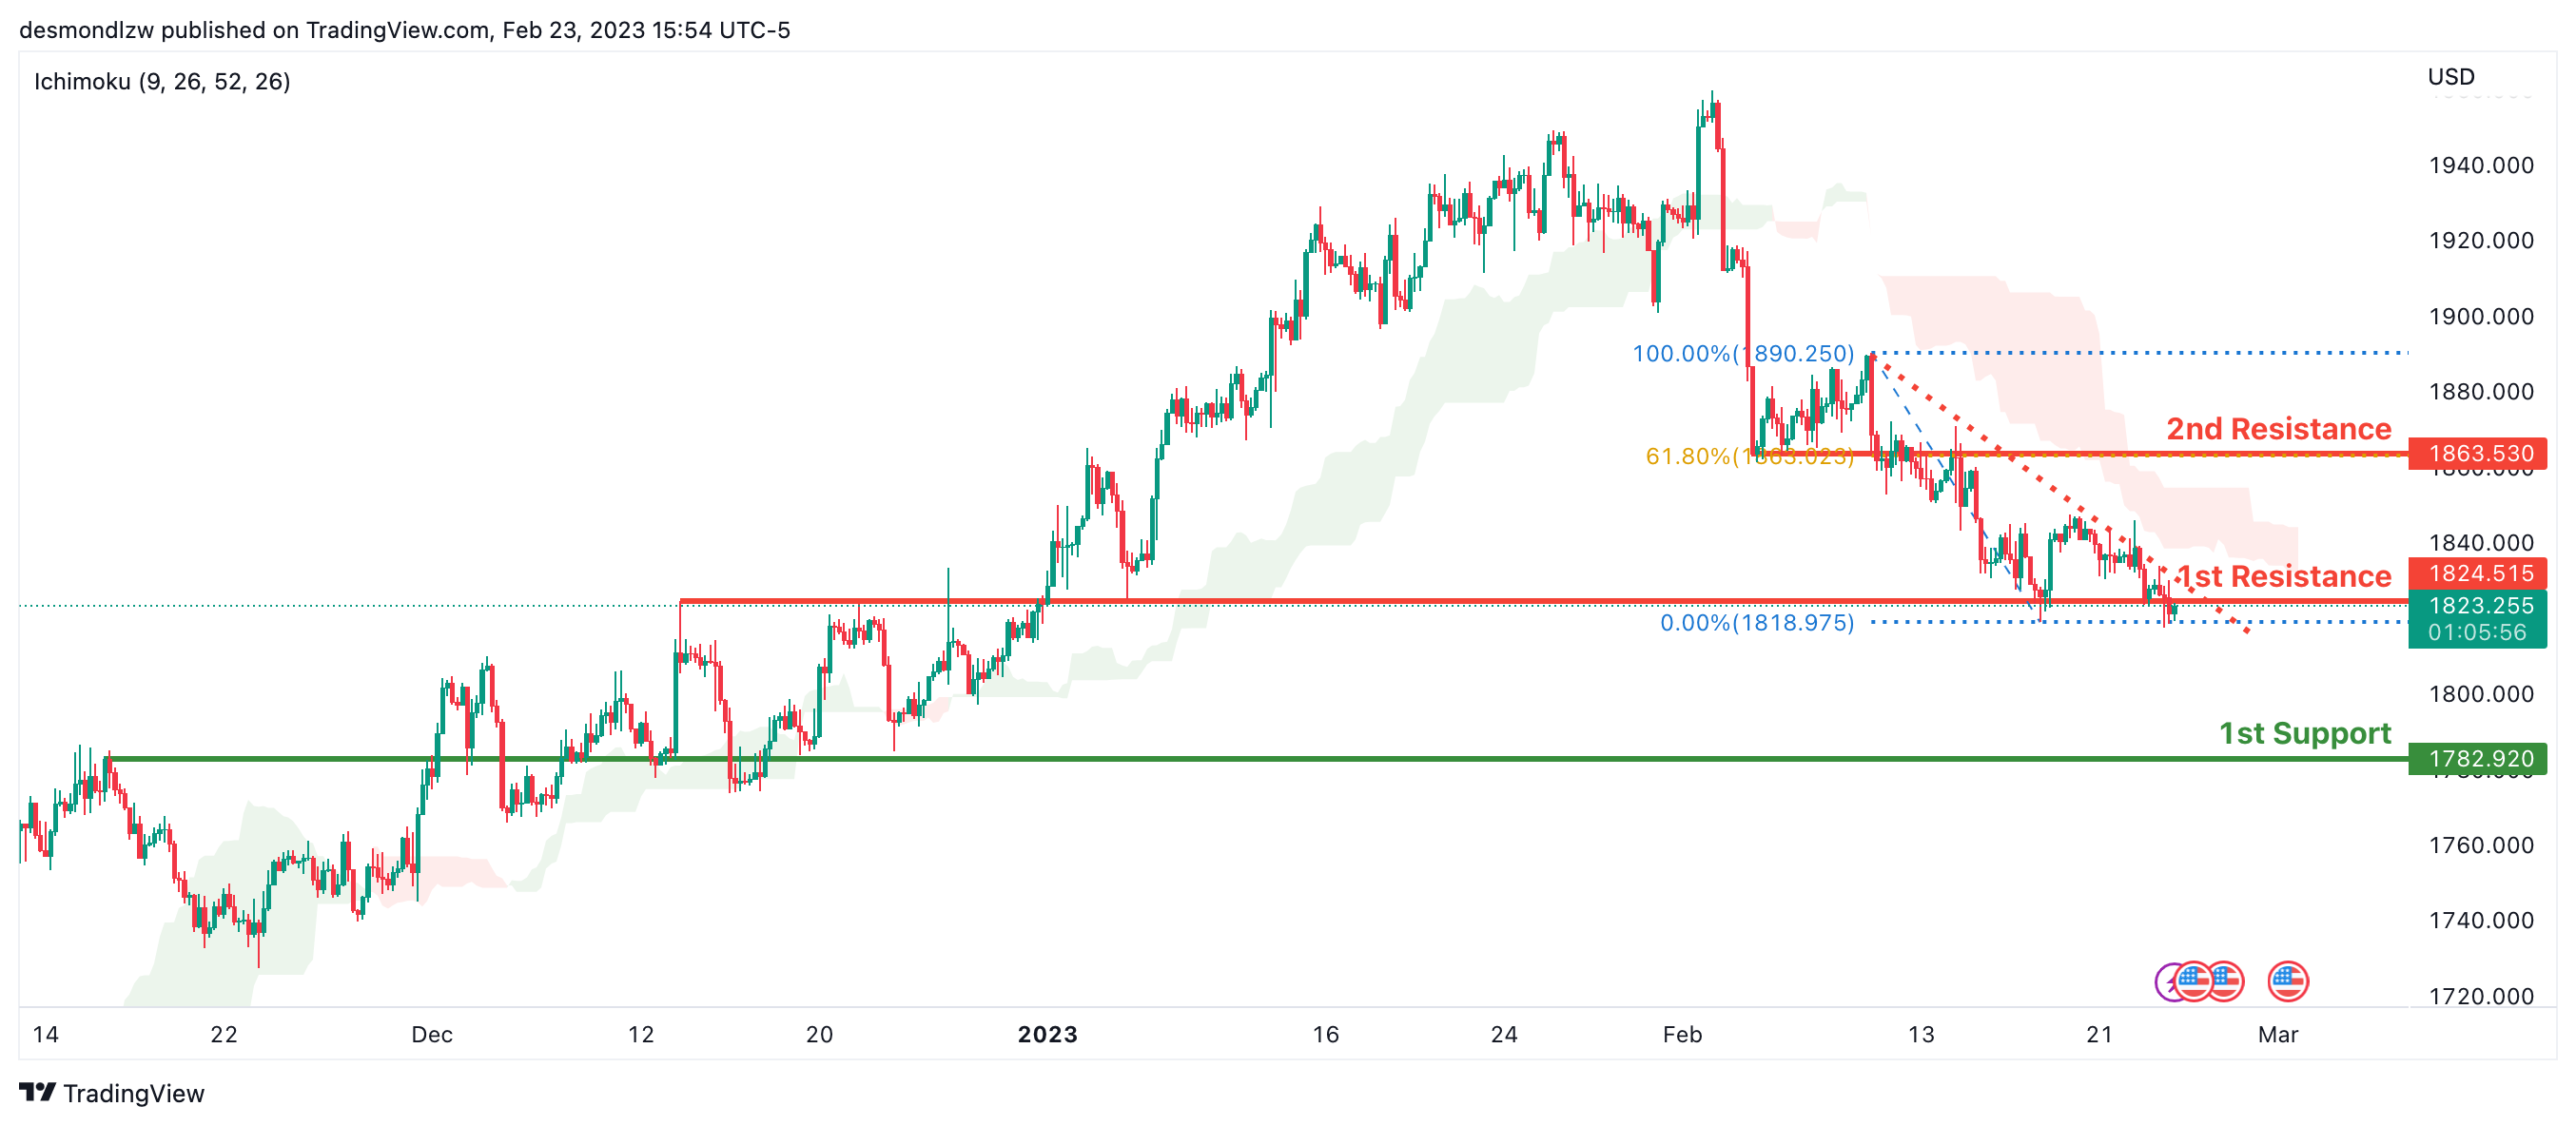
XAU/USD (GOLD):
Looking at the H4 chart, my overall bias for XAUUSD is bearish due to the current price being below the Ichimoku cloud, indicating a bearish market. To add confluence to this bias, price is also along a descending trendline.If this bearish momentum continues, expect the price to possibly continue heading towards the 1st support at 1782.920 where the overlap support is.
In an alternative scenario, price could possibly head back up to retest the 1st resistance at 1824.515 where the overlap support is
Areas of consideration:
- H4 time frame, 1st resistance at 1824.515
- H4 time frame, 1st support at 1782.920
AUD/USD:
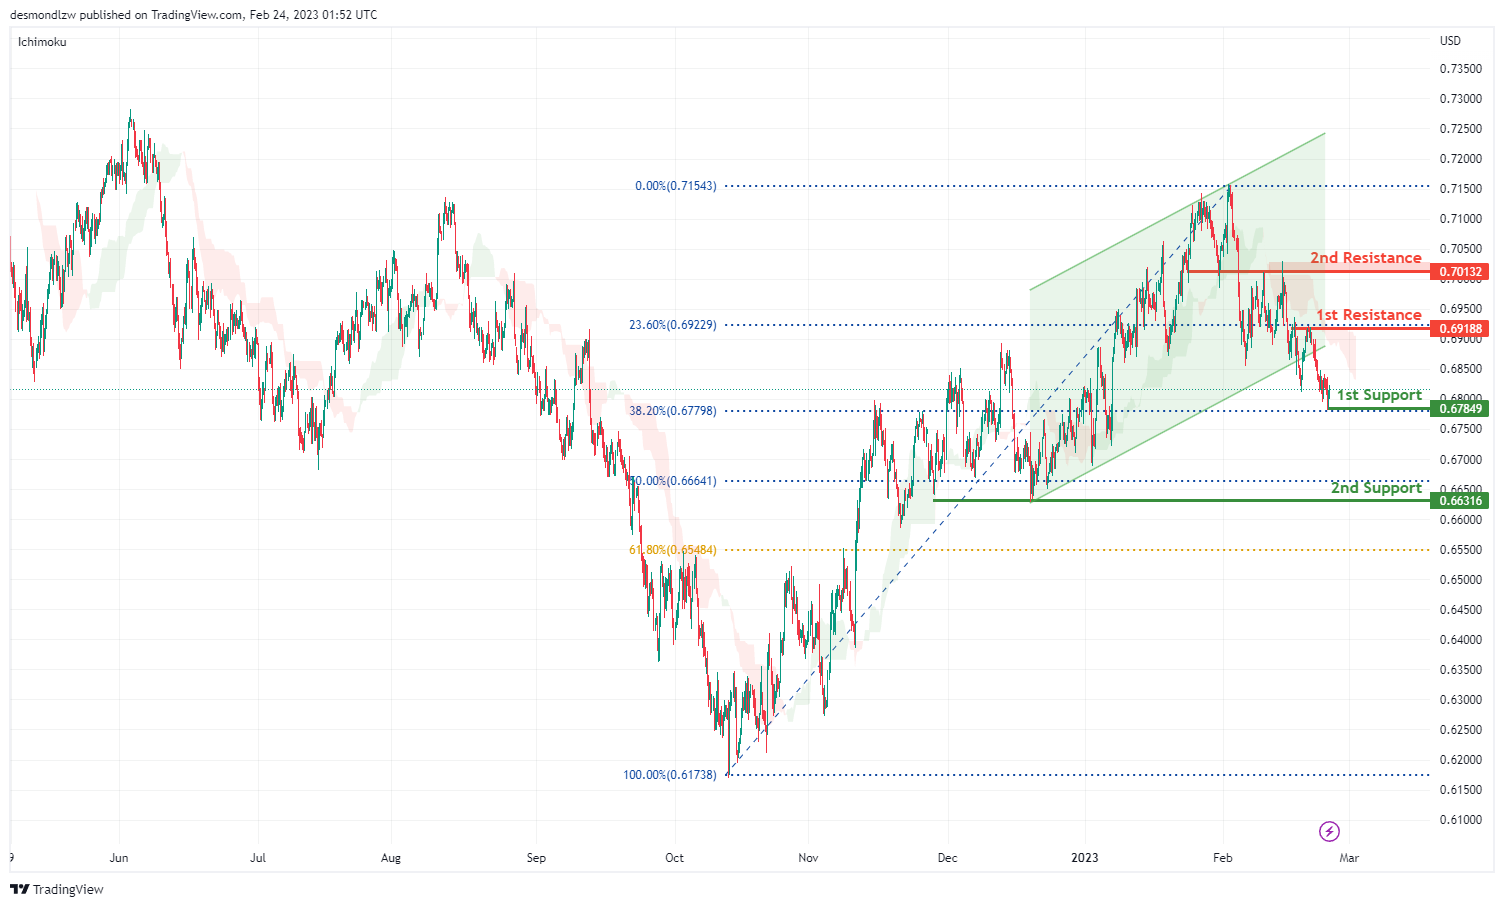
Looking at the H4 chart, my overall bias for AUDUSD is slightly bearish due to the current price being below the Ichimoku cloud, and the price has broken the ascending channel, indicating a bearish market.
The price could possibly godown towards the 1st support level at 0.67849 which is the recent swing low and in line with the 38.2% Fibonacci retracement. There is 2nd support at 0.66316 where the previous overlap support and 50% Fibonacci line are.
In an alternate scenario, The price could possibly go up towards the 1st resistance level at 0.69188 which is the recent overlap swing high, There is 2nd resistance at 0.70132 which is in line with the 23.6% Fibonacci retracement.
Areas of consideration
- H4. 2nd resistance at 0.70132
- H4. 1st resistance at 0.69188
- H4, 1st support at 0.67849
- H4, 2nd support at 0.66316
NZD/USD:
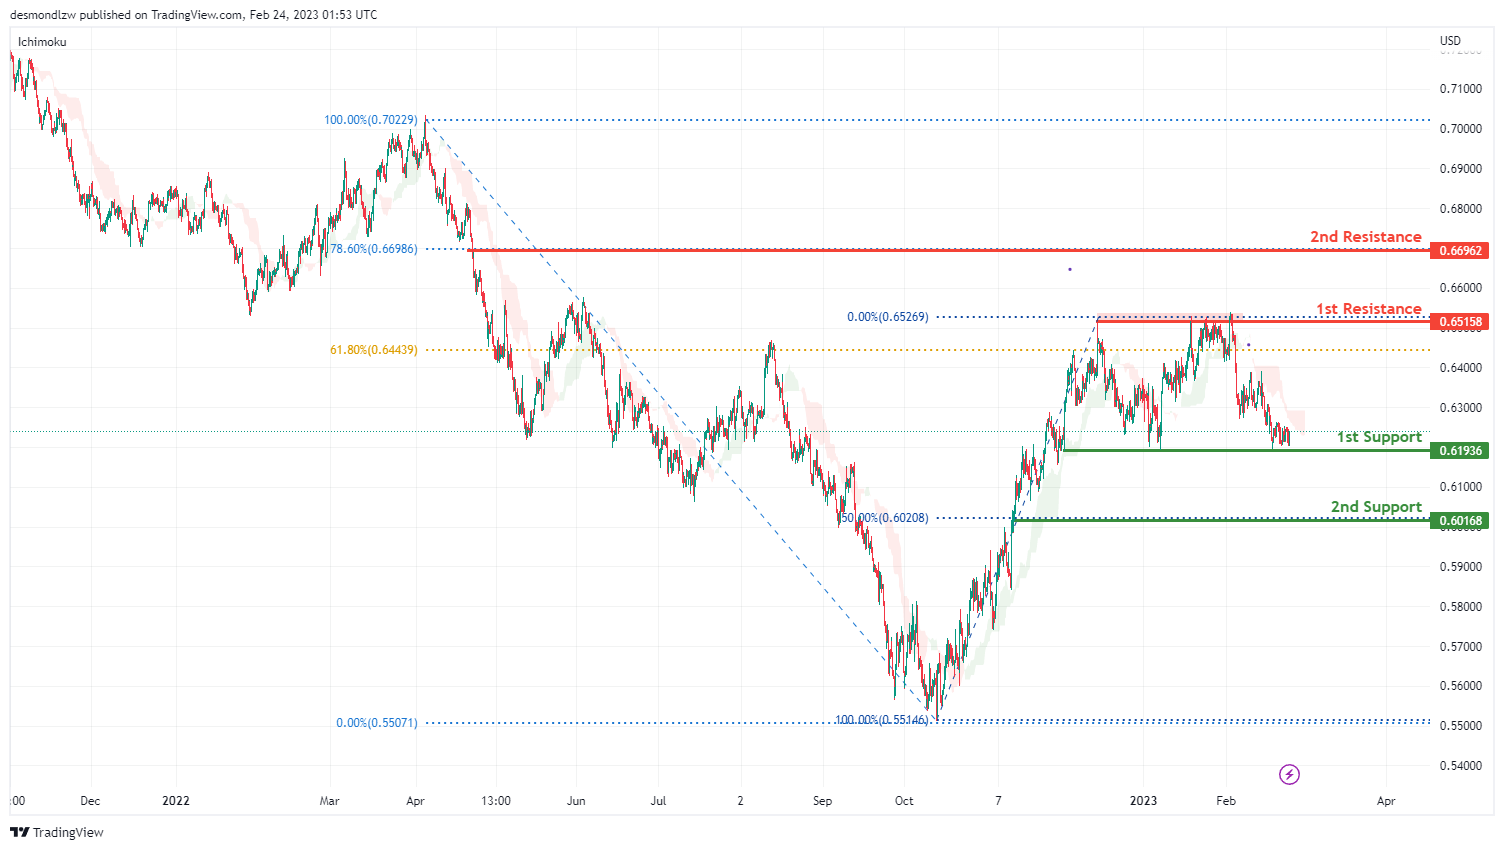
Looking at the H4 chart, my overall bias for NZDUSD is bearish, as the current price is below the Ichimoku Cloud. Expecting the price go down towards the 1st support at 0.61936 which is the overlap swing low. The 2nd support is at 0.60168 where the 50% Fibonacci line is.
In an alternate scenario, price could possibly go up towards the 1st resistance level at 0.65158 which is the recent overlap swing high. There is a 2nd resistance at 0.66962 where the 78.6% Fibonacci line is.
Areas of consideration:
- H4 time frame, 2nd resistance at 0.66962
- H4 time frame, 1st resistance at 0.65158
- H4 time frame, 1st support at 0.61936
- H4 time frame, 2nd support at 0.60168
USD/CAD:
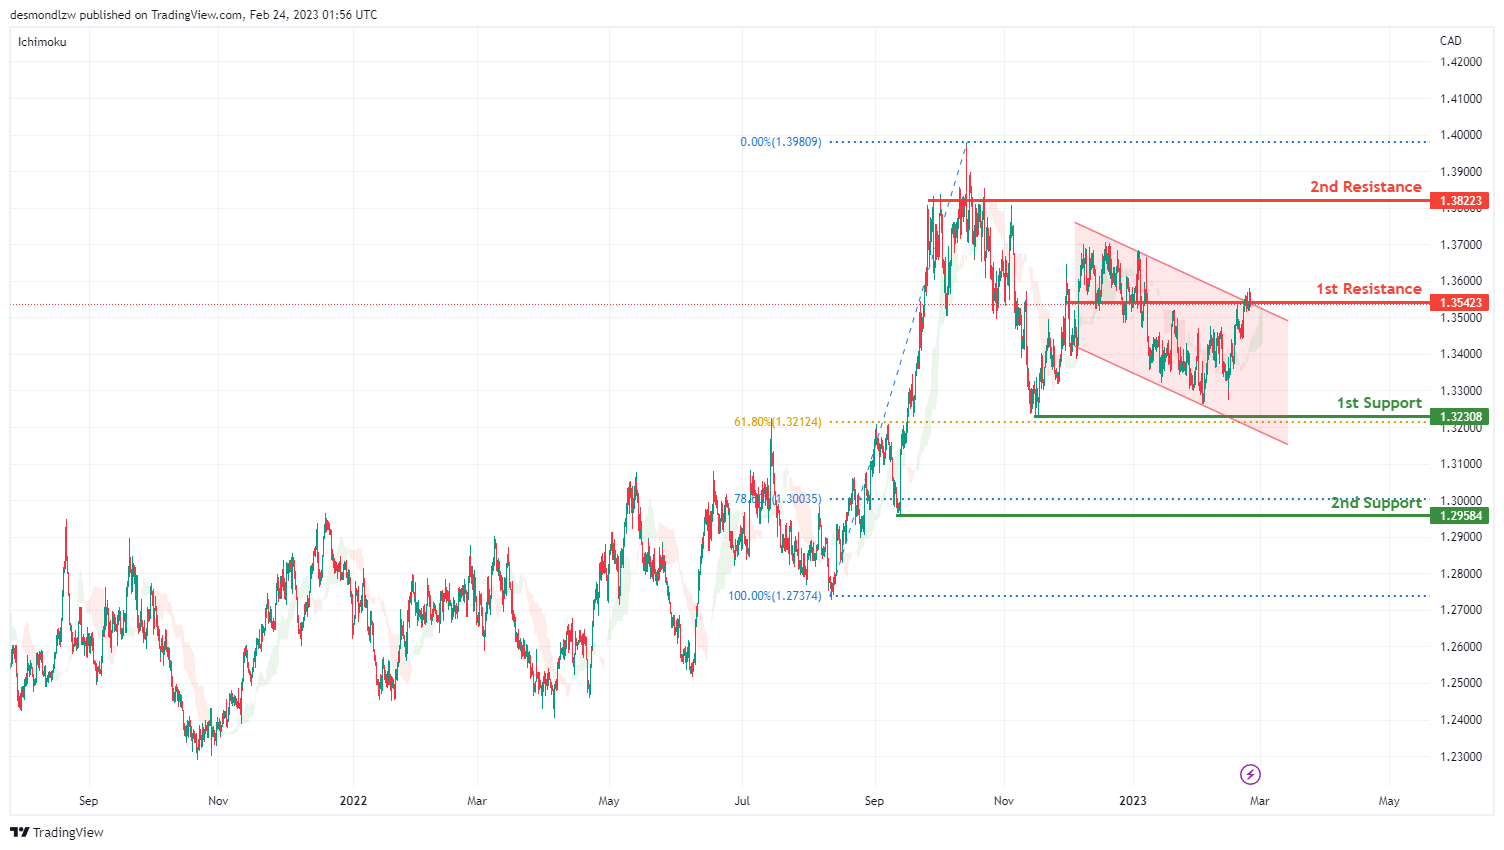
Looking at the H4 chart, my overall bias for USDCAD is bullish , as the current price is above the Ichimoku cloud and break the upper level of the descending channel. Expecting the current price to possibly break the 1st resistance at 1.36956 which is the overlap of recent swing high, before it head to the 2nd resistance at 1.38223 which is the previous swing high.
In an alternative scenario, the price could possibly drop to the 1st support at 1.32308 which is the previous swing low and also in line with the 61.8% Fibonacci retracement. The 2nd support is at 1.29584 where the 78.6% Fibonacci line is .
Areas of consideration:
- H4 time frame, 2nd resistance at 1.38223
- H4 time frame, 1st resistance at 1.36956
- H4 time frame, 1st support at 1.32308
- H4 time frame, 2nd support at 1.29584
OIL:
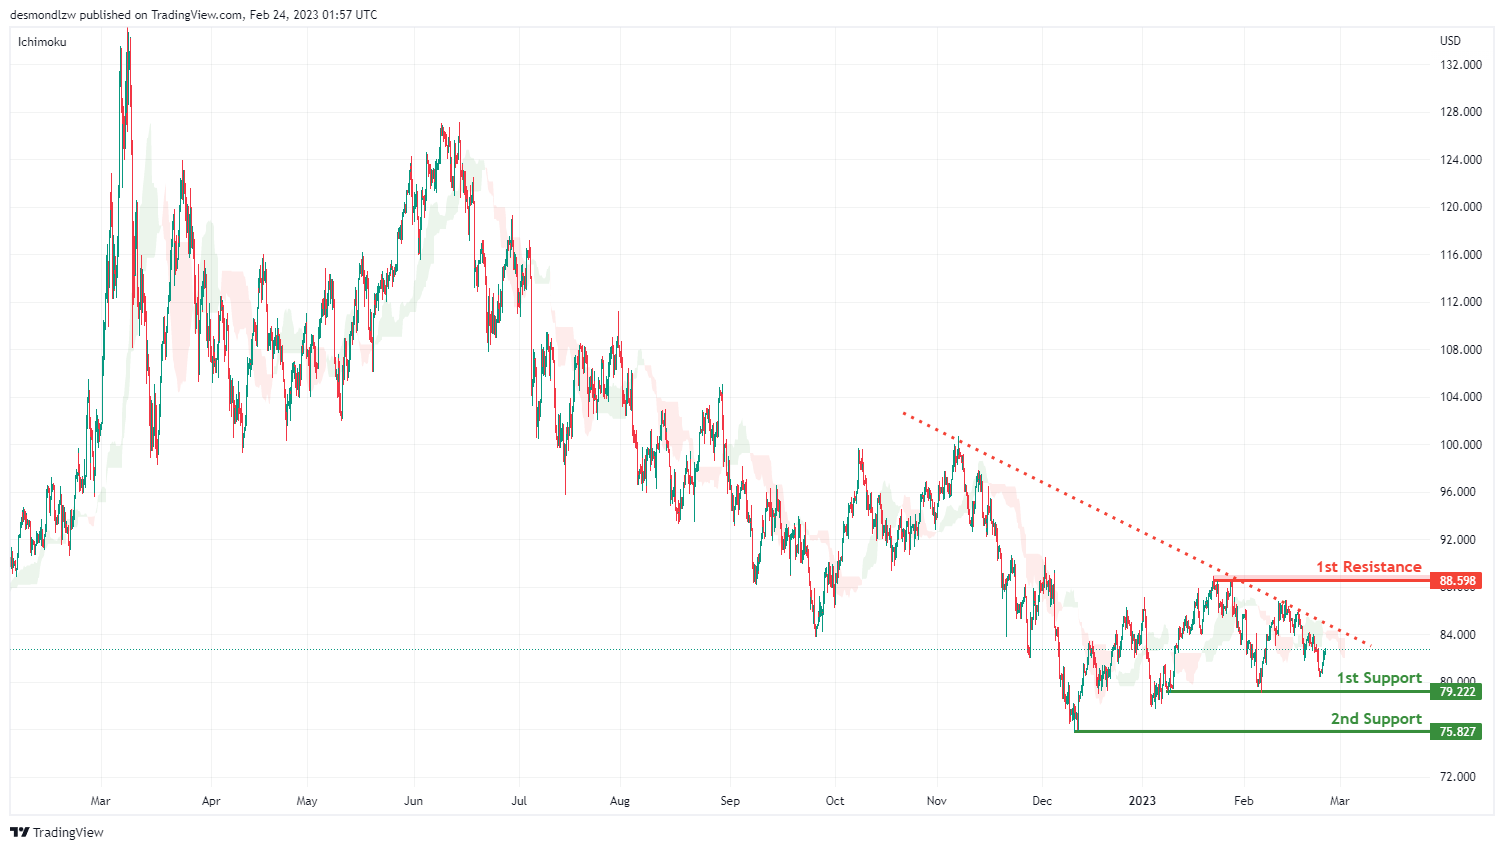
Looking at the H4 chart, my overall bias for BOC is bearish as the current price acrossing the Ichimoku cloud, and there is an descending trend line. Expecting the price to head down towards the 1st support level at 79.222 which is the recent overlap swing low, before the price drops to the 2nd support at 75.827.
In an alternate scenario, the price could possibly head up towards the 1st resistance level at 88.598 which is the recent swing high.
Areas of consideration:
- H4 time frame, 1st resistance at 88.598
- H4 time frame,1st support at 79.587
- H4 time frame, 2nd support at 75.827
Dow Jones Industrial Average:
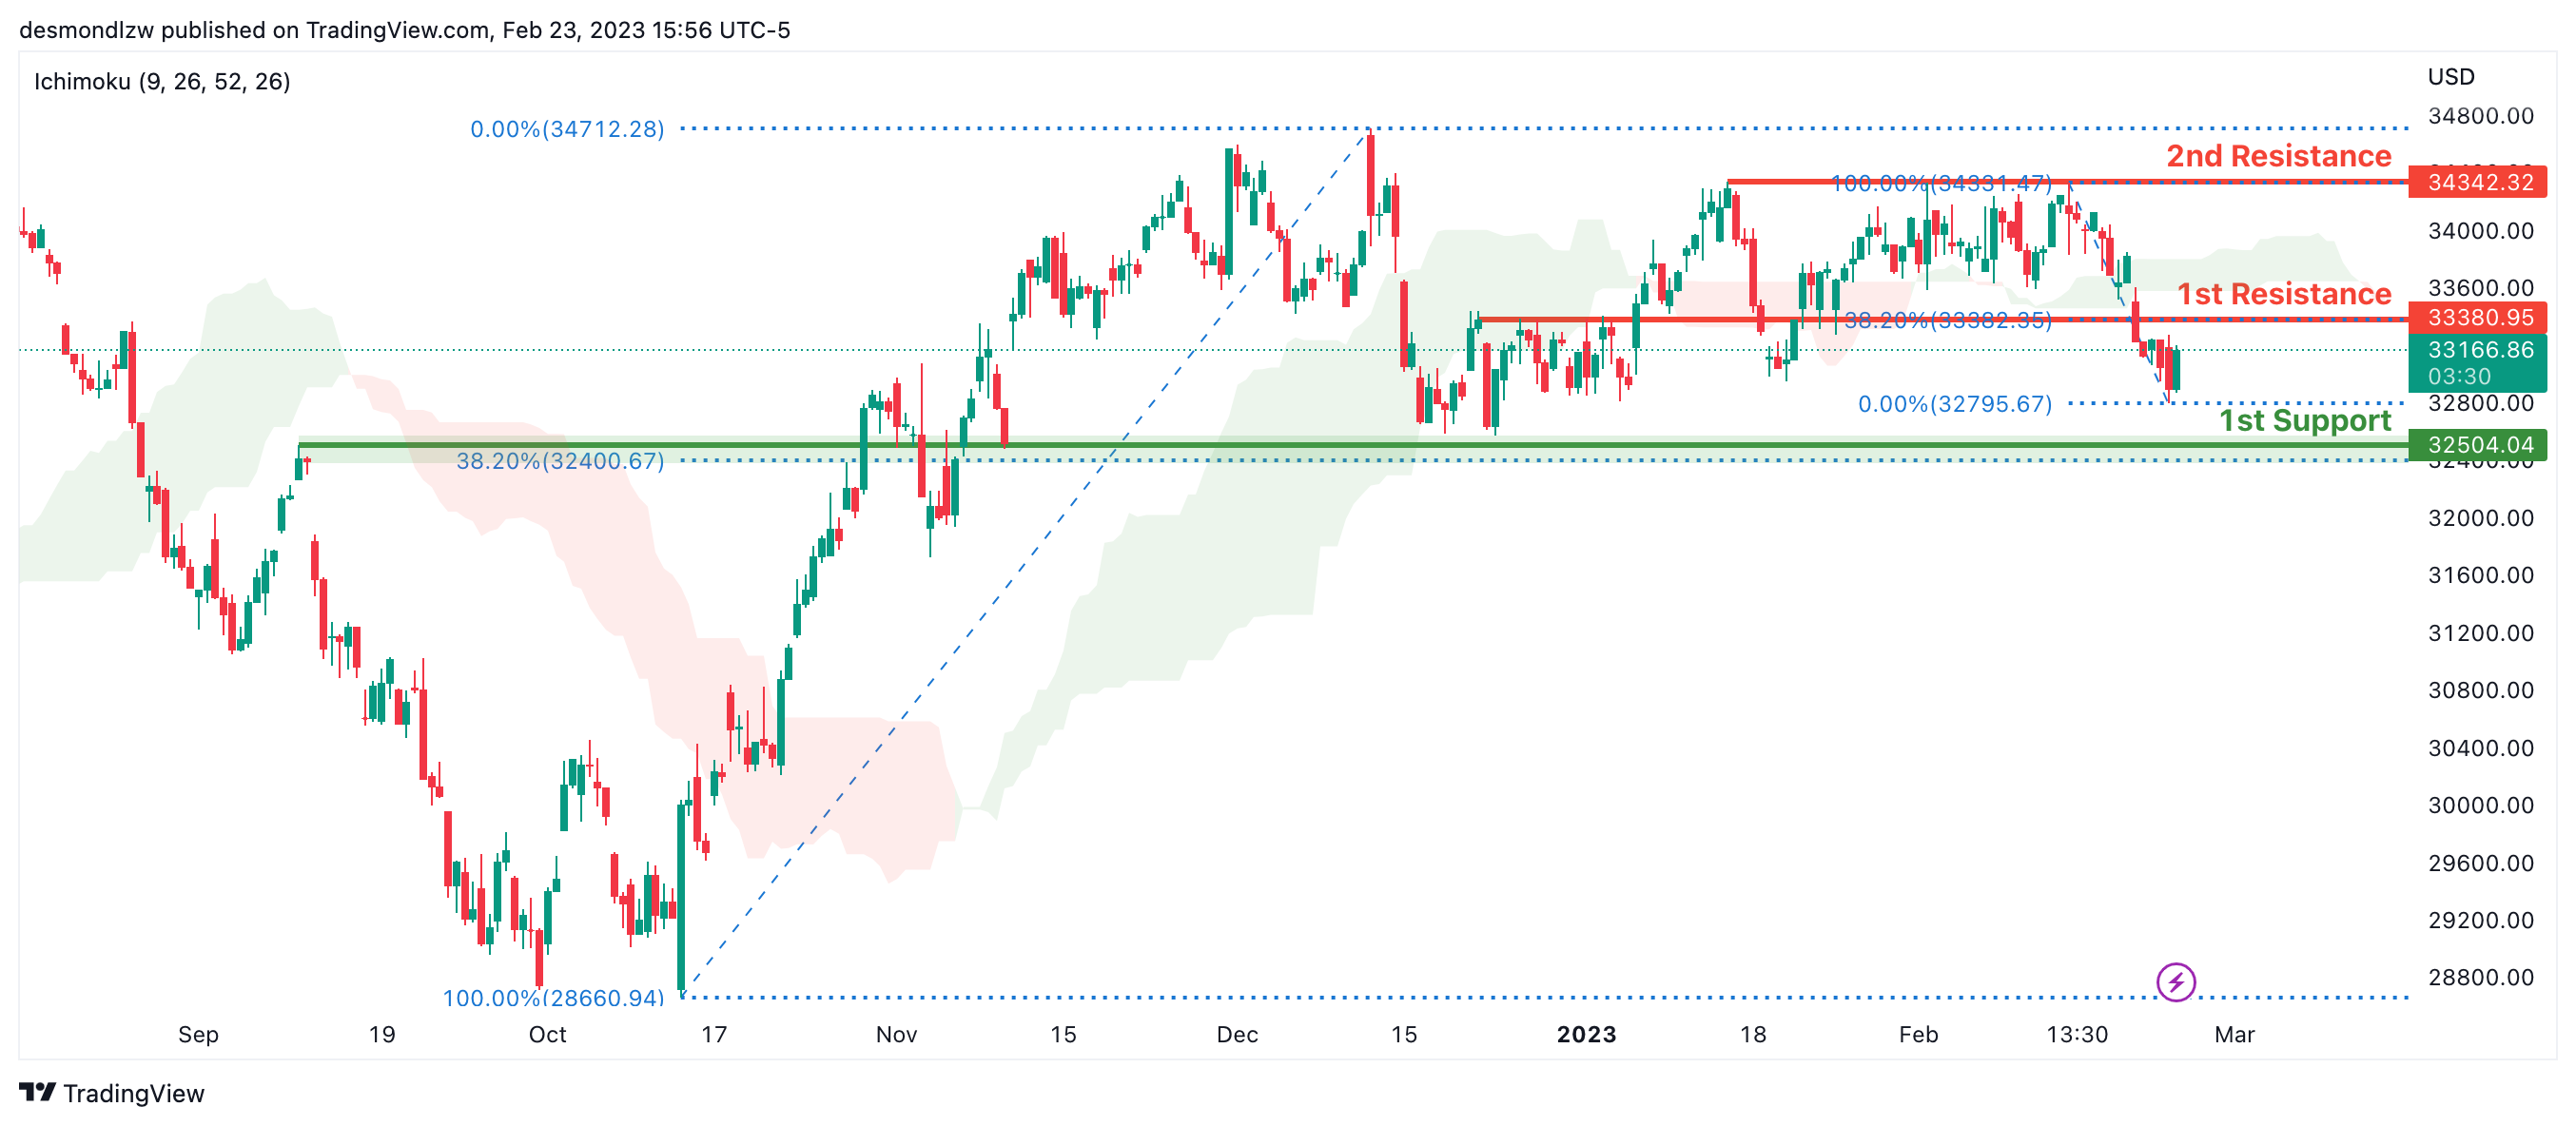
On the H4 chart, the overall bias for DJI is bearish. To add confluence to this, the price is crossing below the Ichimoku cloud which indicates a bearish market.If this bearish momentum continues, expect the price to possibly continue heading towards the 1st support at 32504.04, where the 38.2% Fibonacci line and overlap support is.In an alternative scenario, price could possibly head back up towards the 1st resistance at 33380.95, where the 23.6% Fibonacci line is.
Areas of consideration:
- H4 time frame, 1st support at 32504.04
- H4 time frame, 1st Resistance at 33380.95
DAX:
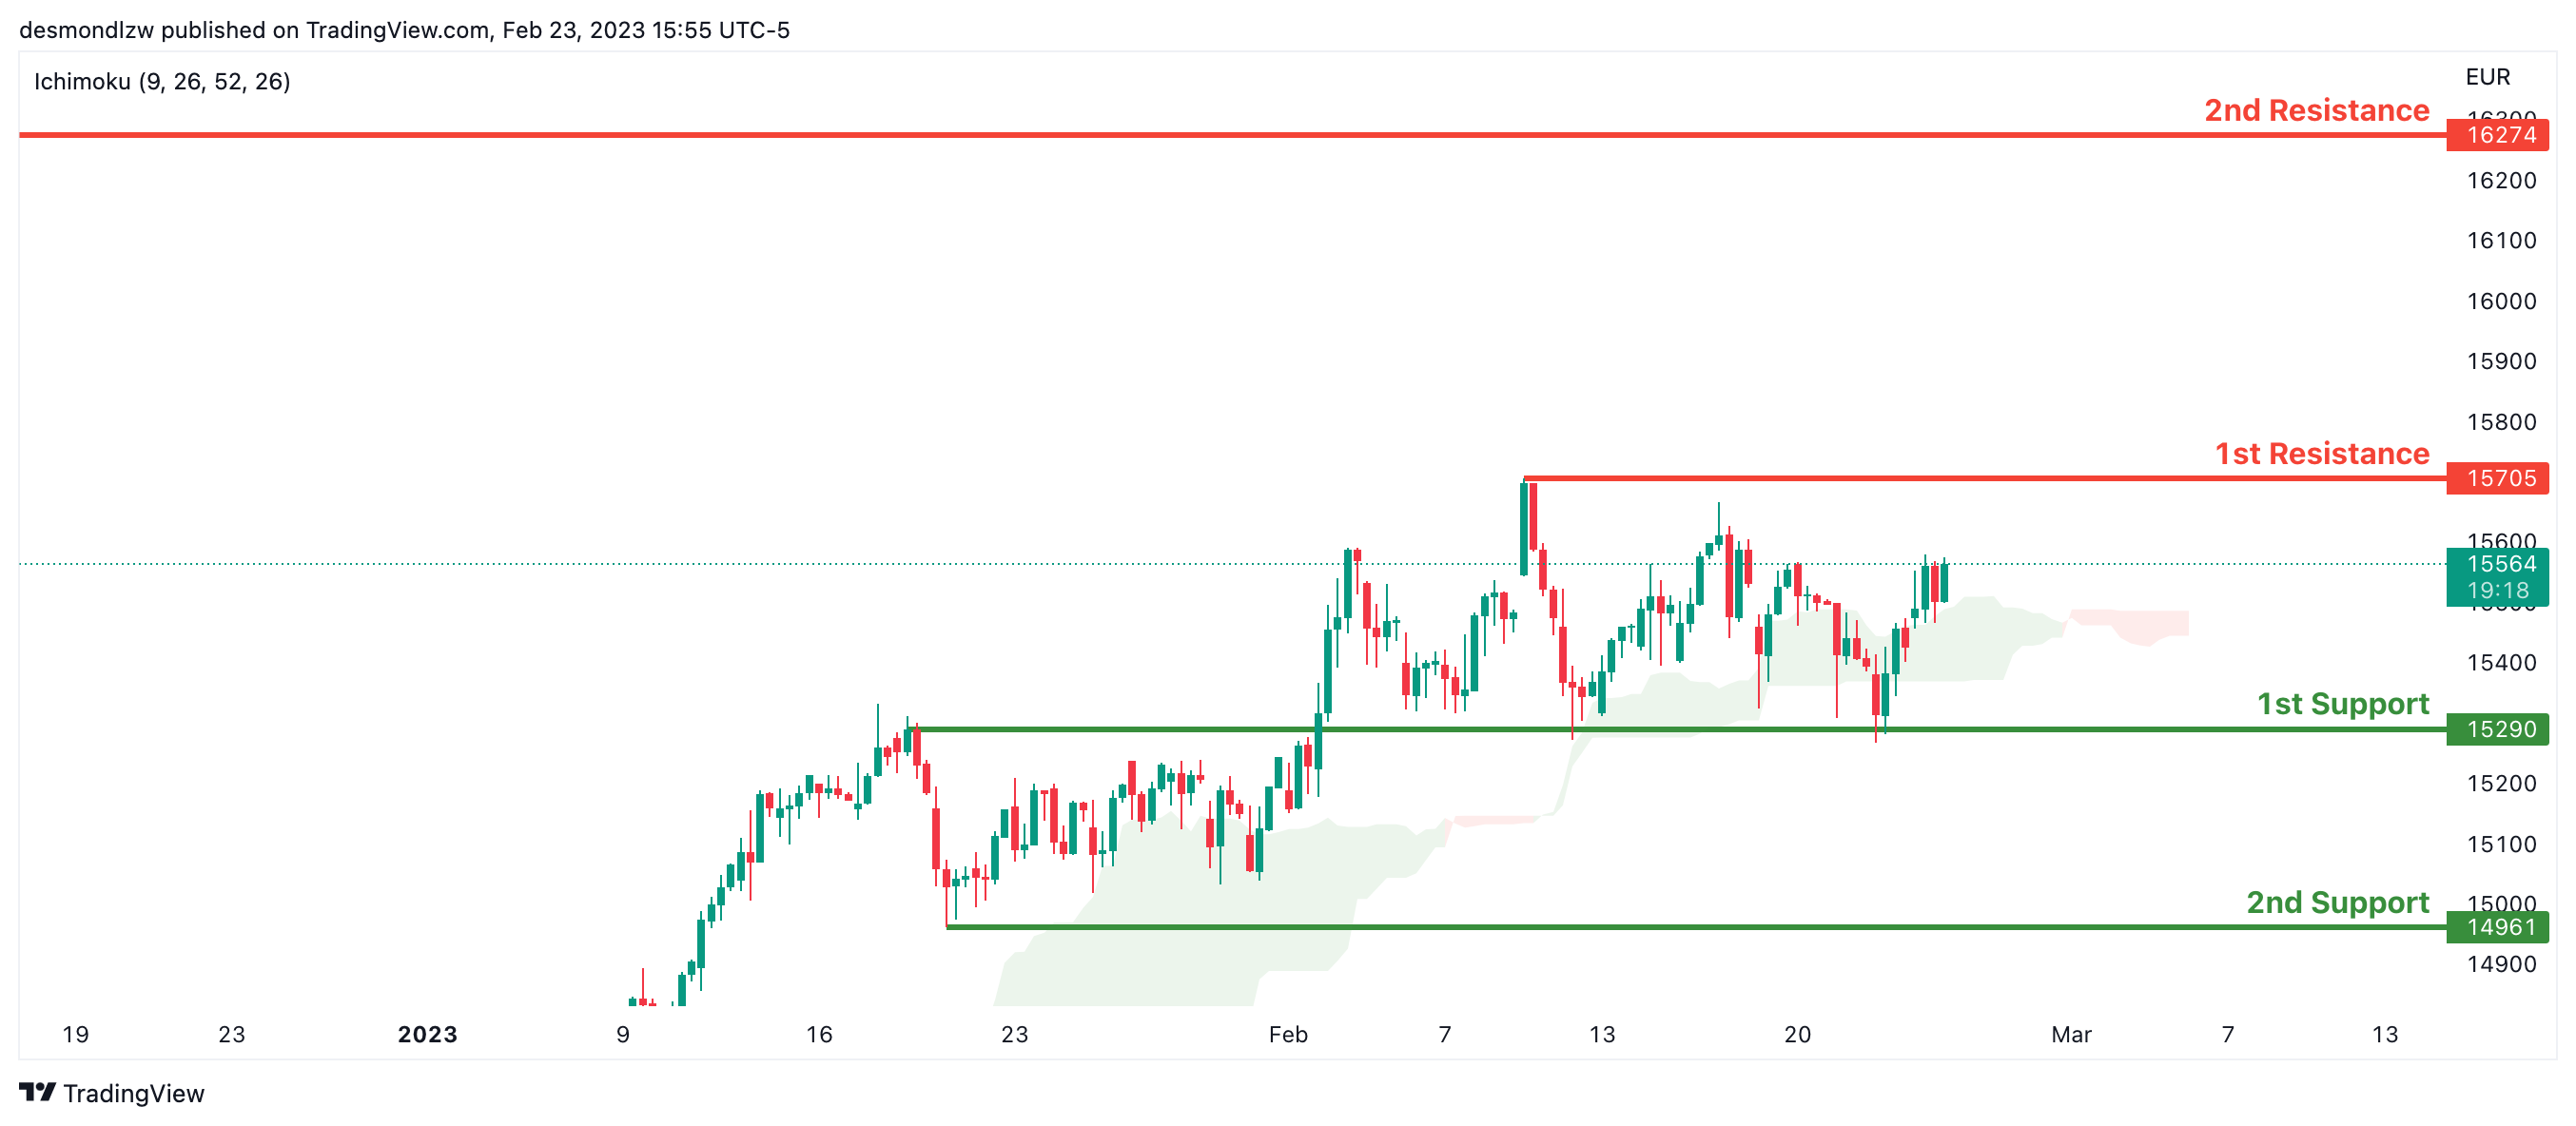
Looking at the H4 chart, my overall bias for DAX is bullish due to the current price crossing above the Ichimoku cloud, indicating a bullish market.If this bullish momentum continues, expect the price to possibly head towards the 1st resistance line at 15705, where the recent high is.In an alternative scenario, price could possibly head down to retest the 1st support at 15290, where the overlap support is.
Areas of consideration:
- H4 time frame, 1st resistance is at 15705
- H4 time frame, 1st support is at 15290
ETHUSD:
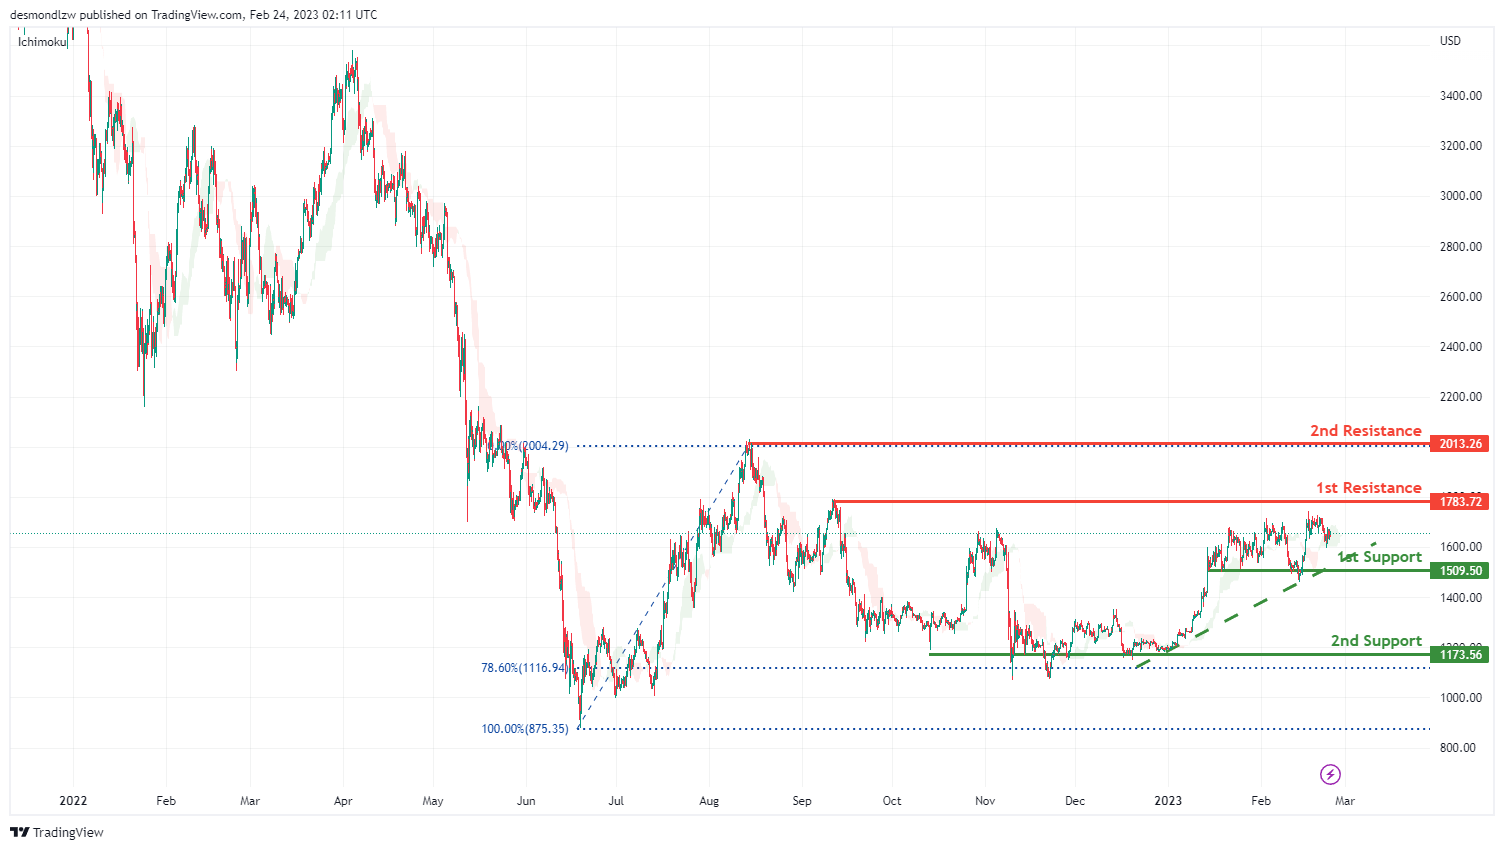
Looking at the H4 chart, my overall bias for ETHUSD is bullish, as there is a strong ascending trend line. The price may head back to retest the 1st support that intersect with the ascending trend line, before it go up and break the 1st resistance line at 1783.72 before breaking the 2nd resistance line at 2013.26 which is the previous swing high.
In an alternate scenario, the price may retrace back to the 1st support line at 1509.50 which is the recent overlap support before it heads towards the 2nd support at 1173.56 which is in line with 78.6% Fibonacci retracement.
Areas of consideration:
- H4 time frame, 2nd resistance of 2013.26
- H4 time frame, 1st resistance of 1783.72
- H4 time frame, 1st support at 1509.50
- H4 time frame, 2nd support at 1173.56
BTCUSD:
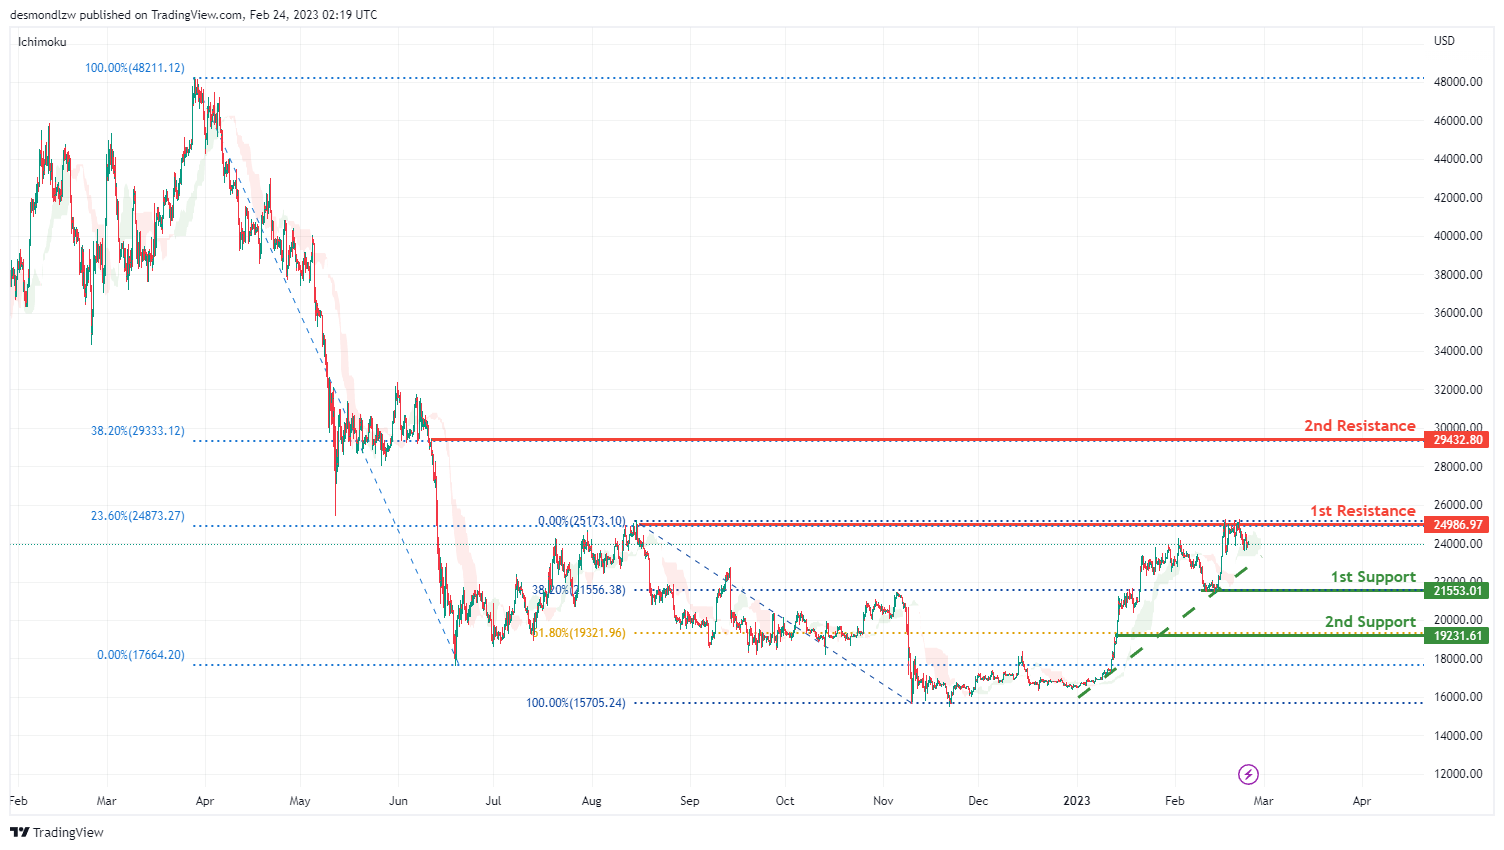
Looking at the H4 chart, my overall bias for BTCUSD is bullish. As there is an ascending trend line, expect the price may head back to retest the 1st support that intersect with the ascending trend line, before it go up and break the 1st resistance at 24986.97 which is the overlap recent swing high, before it head up to the 2nd resistance 29432.80 where the 38.2% Fibonacci retracemnt is.
In an alternate scenario, The price may go down towards the 1st support line at 21553.01 which is in line with 38.2% Fibonacci retracement, before heading down towards the 2nd support at 19231.61 which is in line with 61.8% Fibonacci retracement.
Areas of consideration:
- H4 time frame, 2nd resistance 29432.80
- H4 time frame, 1st resistance 24986.97
- H4 time frame, 1st support at 21553.01
- H4 time frame, 2nd support at 19231.61
S&P 500:
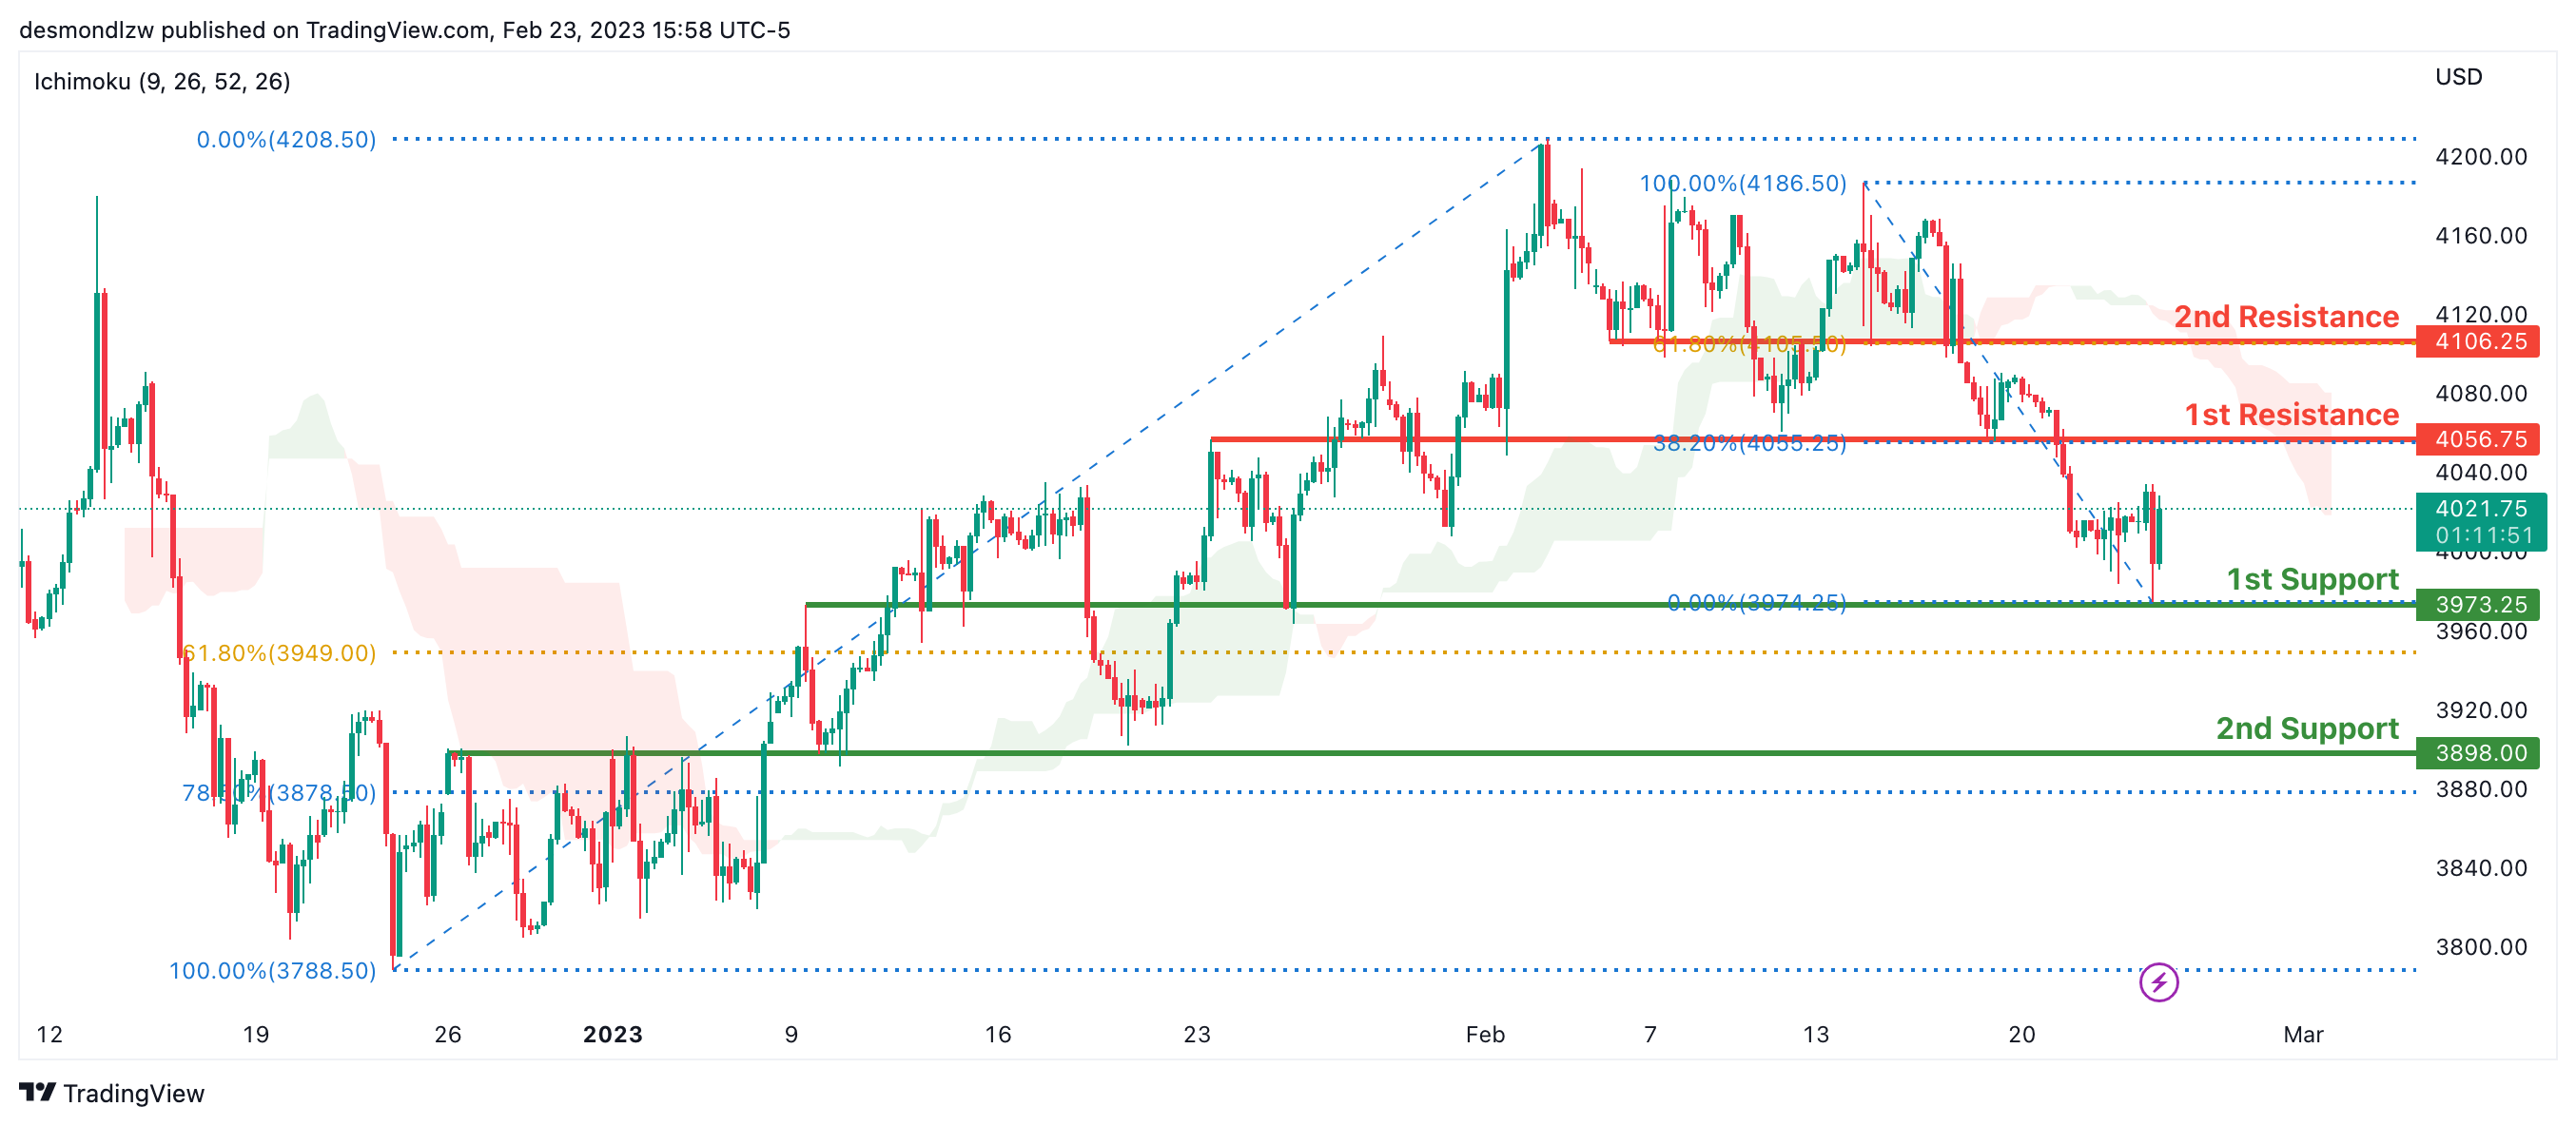
Looking at the H4 chart, my overall bias for S&P500 is bearish due to the current price being below the Ichimoku cloud, indicating a bearish market.If this bearish momentum continues, expect the price to continue heading towards the 1st support at 3973.25 which is the overlap support and slightly above where the 61.8% Fibonacci line is.
In an alternative scenario, price could possibly head back up to retest the 1st resistance at 4056.75, where the overlap resistance and 38.2% Fibonacci line is.
Areas of consideration:
- H4 time frame, 1st support at 3973.25
- H4 time frame, 1st resistance at 4056.75
BoJ Ueda: Current policy a necessary, appropriate means to achieve 2% inflation
At a parliamentary confirmation hearing, incoming BoJ Governor Kazuo Ueda said, "current policy is a necessary, appropriate means to achieve 2% inflation," despite various side effects emerging from the stimulus.
"Japan's trend inflation is likely to rise gradually. But it will take some time for inflation to sustainably and stably achieve the BOJ's 2% target," he said.
"Consumer inflation is likely to fall below 2% in the latter half of the next fiscal year. It takes time for the effect of monetary policy to appear on the economy. "
"It's standard practice to act preemptively to demand-driven inflation, but not respond immediately to supply-driven inflation. Otherwise, the BOJ will be cooling demand, worsening economy and pushing down prices by tightening monetary policy."
"If trend inflation heightens significantly and sustained achievement of the BOJ's 2% target comes into sight, the central bank must consider normalizing policy. But if trend inflation lacks strength, the bank must continue how to maintain its ultra-easy policy, while paying attention to deterioration in market function."
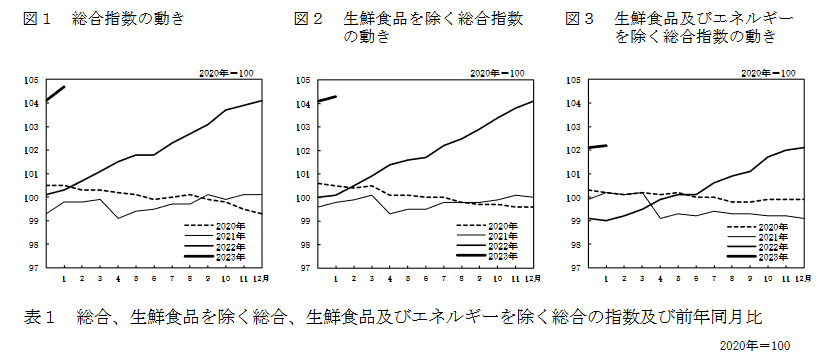
Japan CPI core hit 41-yr high at 4.2% in Jan
Japan all item CPI rose from 4.0% yoy to 4.3% yoy in January, below expectation of 4.5% yoy. CPI core (all-item ex-food) rose from 4.0% yoy to 4.2% yoy, matched expectations. CPI core-core (all-item ex-food and energy) rose from 3.0% yoy to 3.2% yoy, matched expectations.
Core CPI rate of 4.2% was the highest in 41-year since September 1981. The core inflation rate stayed above BoJ's 2% target for nine consecutive months.
RBNZ Silk: A tightening pause is being contemplated now
RBNZ Assistant Governor Karen Silk said in a Bloomberg interview "there's still more work to do here" on interest rate and fighting inflation. While "all levels are on the table" for April meeting, the central bank is not contemplating a pause.
"This is still an economy that has excess demand, a tight labor market, and as a consequence both headline inflation and core inflation at levels that are well outside the (target) band," she said.
Regarding April meeting, "all levels are on the table for discussion at every meeting," she said. "I'm not going to turn round and comment on whether we would be looking at 25, 50 or 75, they will all be on the table for discussion and they will depend on the information at hand."
Nevertheless, a pause in tightening is "certainty not something that we're contemplating at this point in time," she said.
Silk also noted that some upside risk was built into the forecast interest peak of 5.5%. However, "without building that in, any variation to that peak would have been still at the margin," she said. "There's potentially still some upside risk on the fiscal side of it. Let's just see how it plays out over the next six weeks."
Cliff Notes: Mixed Signals to Keep Central Banks on Tightening Path
Key insights from the week that was.
Critical data for Australia’s economy was mixed this week; elsewhere, the mindset of policy makers dominated the headlines.
The minutes of the RBA’s February meeting provided more colour around the Board’s decidedly more hawkish view. Most notably, the option of keeping rates ‘on hold’ was not considered in February having previously been an option in December. Further, debate between a 25bp and 50bp rate hike highlighted questions over the necessary scale of tightening to come and some lingering uncertainty around the timing of inflation’s peak “only [to] be confirmed in a few months’ time”.
Given time and pressure from policy are both expected to be required to bring inflation back to target towards the end of the RBA’s forecast horizon, and as the RBA has confidence in the state of the labour market and prospects for growth, as detailed by Chief Economist Bill Evans it now seems most likely that the Board will hike in March, April and May to a peak of 4.10% (previously 3.85%). At that deeply contractionary level, the RBA will be able to go on hold; however, it remains our view that the combined outlook for growth and inflation will not justify rate cuts until early-2024. Over the course of 2024 and 2025, we see 175bps of cuts to a low of 2.35% where the cash rate is expected to settle, with growth at trend and inflation at the top of the 2-3%yr range.
Given how tight Australia’s labour market is, it was surprising to see the WPI print materially to the downside in Q4 at 0.8% (consensus 1.0%). While the average wage increase among those who received a pay rise remained elevated at 4.0%, only 21% of private sector jobs received an increase in Q4, down from 46% in September and more in line with the seasonal norm. Individual arrangements are continuing to drive wages growth – reflecting robust demand for skilled labour – but the roll-over of minimum wage/award increases from September to December was not as strong as anticipated.
In the lead-up to next week’s Q4 GDP report, the ABS also released two partial indicators for investment.
Construction work done disappointed in the three months to December, falling 0.4% owing to a dip in private business construction and another decline in private home renovation. In contrast to Q3’s 3.7% rebound (revised up from 2.2%), the Q4 result clearly indicates a loss of momentum heading into year-end despite a sizeable pipeline of work and as supply constraints eased.
The Q4 CAPEX survey subsequently signalled a mixed outlook for investment. Of note from the detail on current activity, equipment spending posted a mild 0.6% gain as weakness in mining offset support from non-mining sectors. On spending intentions, in our view, the fifth estimate for the 2022/23 financial year implies a 14% gain in CAPEX (in line with the prior estimate). The first estimate for 2023/24 was also robust, up 11% on the first estimate from a year ago; however, the realisation ratio adjustment implies this equates to a much more modest gain of 5.5%. It bears remembering that all of these figures are nominal and price growth has been rapid of late, CAPEX costs up 10.5%yr at December 2022.
Despite the downside surprise in construction work and soft read on equipment spending, we have revised up our forecast for Q4 GDP from 0.6% to 0.7% as net exports look to have been stronger than initially anticipated. Our full GDP preview will be on Westpac IQ later today.
For those interested in medium and long-run trends, this week also saw the release of a deep dive into Australia’s historic surge in net migration which is set to continue through 2023 and 2024. Also worthy of consideration are the implications of the safeguard mechanism for Australia’s heavy emitters and carbon markets, topics taken up in the latest instalment of Commodities in Transition.
Over in New Zealand this week, the RBNZ delivered a 50bp increase as expected while retaining a hawkish outlook – guiding that they expect the cash rate to peak at 5.5% mid-2023 and remain at that level until late next year. Our NZ economics team expect this peak to be achieved through a 50bp increase in April and 25bps in May. We are more cautious on the outlook than the RBNZ however, believing that rate cuts will need to commence in early-2024 rather than near its end. As discussed by Acting NZ Chief Economist Michael Gordon, “it will take some time just to stabilise the average rate that homeowners are paying, let alone provide some relief as the economy cools off”. Note as well that the destruction caused by the recent cyclone is being looked through by the RNBZ, with disruptions to prices and activity expected to prove temporary.
In the US, the minutes of the February FOMC meeting were largely as anticipated. Broadly, they conveyed a sanguine view on economic momentum and the labour market, with the soft but positive pulse in domestic demand at Q4 welcome. The focus for policy makers therefore remained on risks to inflation and the appropriateness of financial conditions. While they believe progress is being made, the FOMC are not yet “confident” inflation is “on a sustained downward path” back to target. This will require a broadening of the disinflationary pulse to date concentrated in goods pricing. While partial data signals this next step is near, its scale and speed is yet to be proven.
While they wait for further data, the FOMC is intent on making sure that “overall financial conditions [are] consistent with the degree of policy restraint that the Committee is putting into place”. In our view, the Committee is aiming to hold up the long end of the Treasury curve, the 10-year yield between 3.50% and 4.00% as an example. In doing so, they will restrict the housing market and durables consumption (such as car purchases) while also holding back equity markets and household wealth. Unlike other major economies, the downside of the FOMC taking this course is limited, with the market able to reprice term interest rates household and businesses borrow at should the policy stance have a larger than anticipated impact on the economy. This ‘release valve’ for policy is a key reason why we believe that the fed funds rate won’t be cut until 2024, having been raised to 5.375% at June through 25bp increases at the March, May and June meetings.