Sample Category Title
EUR/USD: Euro Looks Set for Further Losses
The Euro remains at the back foot in early Friday and on track for a weekly loss of around 1%, which adds to negative near-term outlook.
Risk aversion keeps the single currency under pressure, as US dollar received fresh boost from hawkish stance of the Fed.
The data released today, showed stronger than expected contraction of the German economy and along with recent weaker than expected economic data, adding to signals that Eurozone’s largest economy likely slid into recession in the first three months of 2023, which contributes to pressure on Euro.
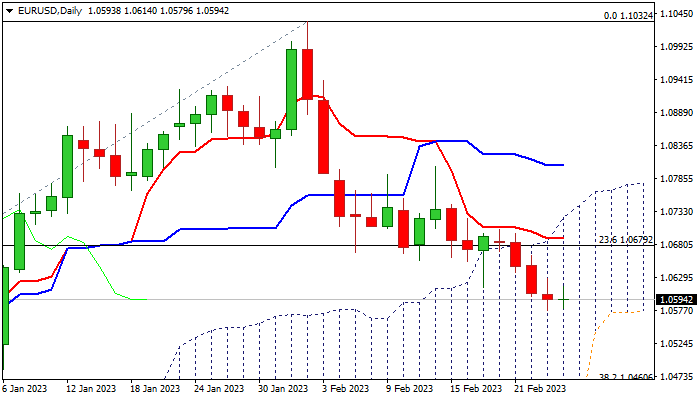
The daily chart shows the EURUSD pair heading south, deep in thick daily Ichimoku cloud, with bearishly aligned studies adding to prospect of further weakness.
Bears eye initial support at 1.0544 (daily cloud base), break of which would unmask next key levels at 1.0483/60 (2023 low, posted on Jan 6 / Fibo 38.2% of 0.9535/1.1032 ascend).
Meanwhile, bears may take a breather for consolidation, as stochastic is oversold and 14-d momentum bounced, but remaining in the negative territory.
In such configuration, limited upticks, which would offer better levels to re-join bearish market, would be likely scenario.
Falling 10DMA (1.0663) and broken Fibo 23.6%, reverted to resistance (1.0679), should ideally cap extended upticks and guard upper pivot at 1.0742 (daily cloud top).
Res: 1.0627; 1.0663; 1.0679; 1.0715.
Sup: 1.0577; 1.0483; 1.0460; 1.0443.
GBPJPY Finds Support But Lacks Bullish Confidence
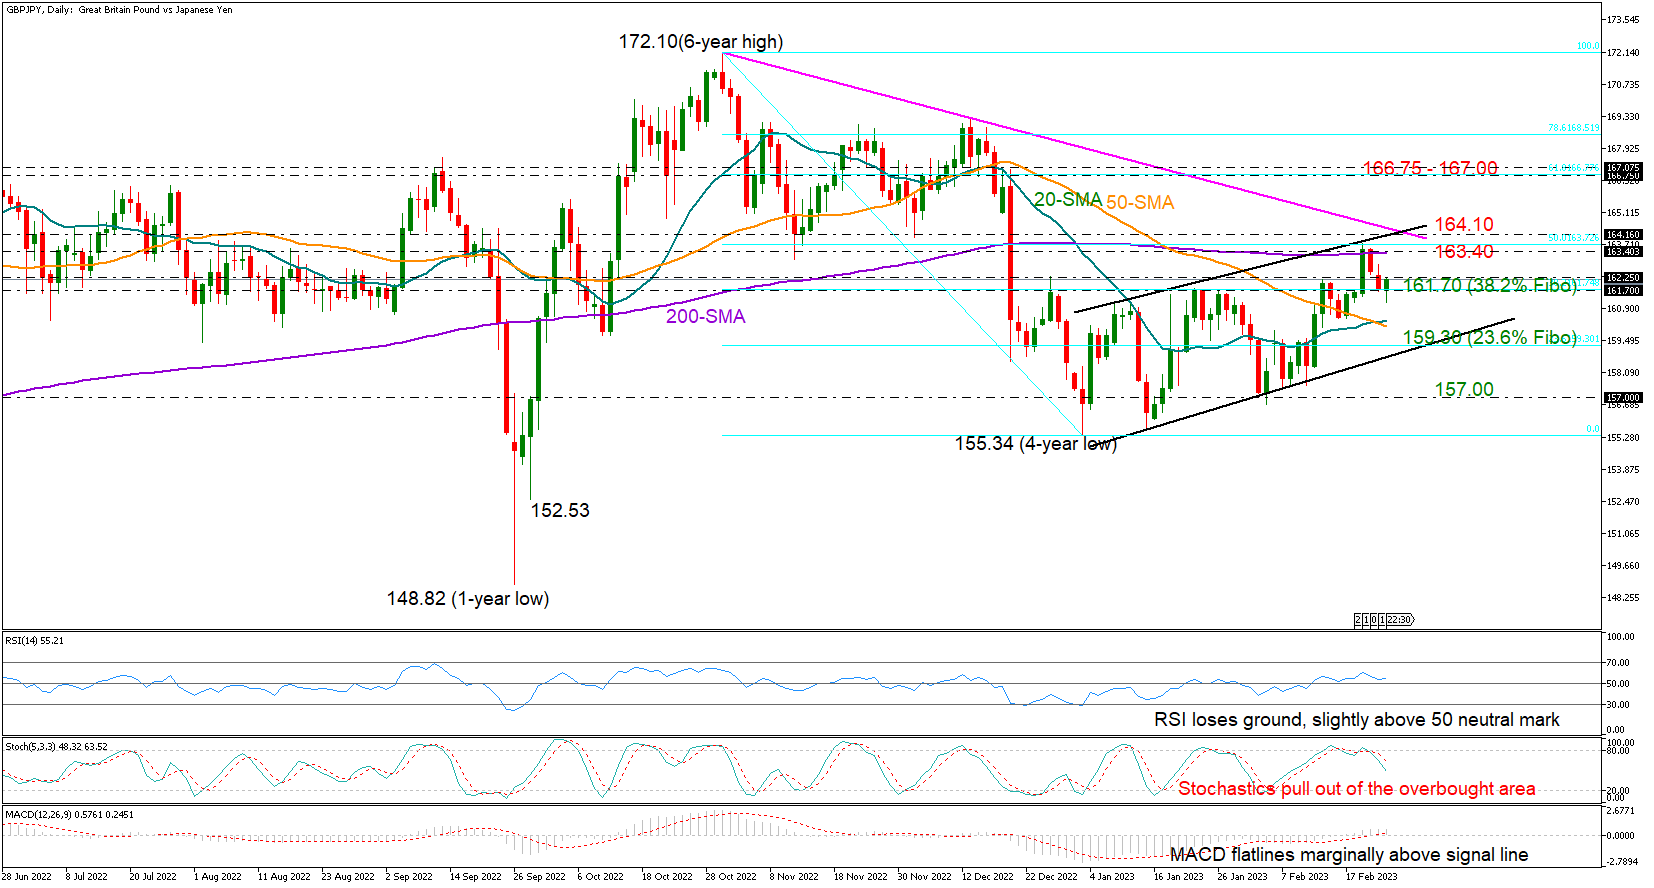
GBPJPY pinned a new two-month high of 163.74 near the 200-day simple moving average (SMA) earlier this week before easing slightly below the 162.00 level.
The pair is currently trying to set a foothold near the former resistance of 161.70, which overlaps with the 38.2% Fibonacci retracement of the 172.10-155.34 downleg and the 50-period SMA in the four-hour chart.
The technical picture, however, suggests that the market is not ready for a meaningful rally yet. Specifically, the RSI has given up significant ground within the bullish area and the MACD has shifted to the sidelines above its red signal line, while the Stochastic oscillator has pulled below its 80 overbought level, showing falling buying pressures.
Another bearish extension could initially stabilize near the 20- and 50-day SMAs at 160.40 before pushing towards the 23.6% Fibonacci of 159.30 and the bottom of the short-term bullish channel seen around 159.00. A breakdown at this point would dampen sentiment, likely activating a sharper decline towards the 157.20 barrier.
Alternatively, a bounce on the 161.70 base could stage another battle with the 200-day SMA at 163.40. The channel’s upper boundary, the 50% Fibonacci level, and the tentative resistance trendline drawn from October’s 6-year high are in the neighborhood as well, casting doubt on whether the pair will extend its recovery towards the 61.8% Fibonacci of 166.75 and the 167.00 region.
In a nutshell, GBPJPY is looking bullish-to-neutral in the short-term picture. A decisive rally above 164.00 is required to boost buying confidence in the market. Otherwise, a close below 161.70 is expected to extend the latest pullback towards the channel’s lower boundary.
Bundesbank Nagel: Stopping tightening too early is a cardinal error
Bundesbank President Joachim Nagel said, "What seems distinctive to me is that core inflation will remain at a very high level beyond March."
"That's why I don't rule out that further significant interest rate hikes beyond March will be necessary,: he added.
Nagel also said ECB's interest rate is not restrictive yet. He warned that stopping tightening too early would be a "cardinal error."
EUR/USD Pair Started a Fresh Decline Below 1.0650
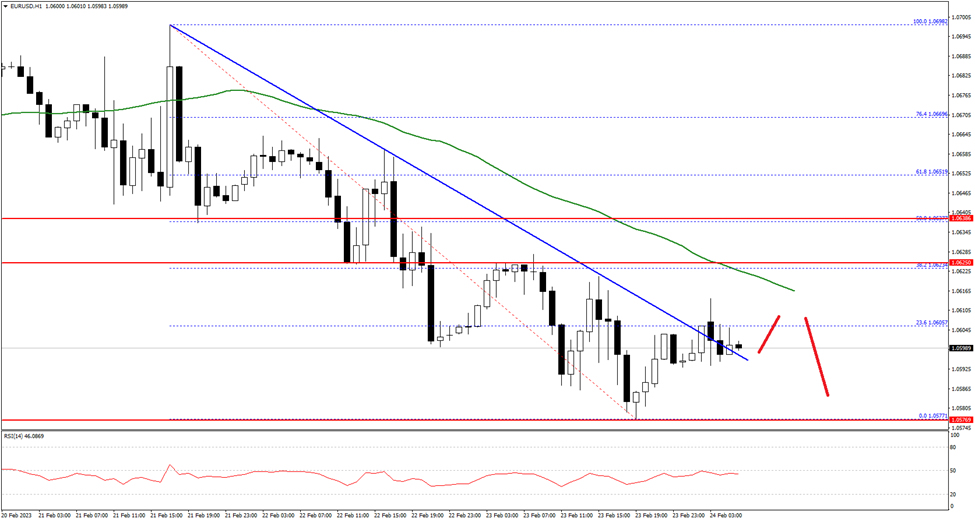
The Euro started a fresh decline from the 1.0700 zone against the US Dollar. The EUR/USD pair traded below the 1.0650 level to move into a bearish zone.
The pair even traded below the 1.0620 level and the 50 hourly simple moving average. The bears pushed the pair below 1.0600 and low is formed near 1.0577. It is now consolidating, with an immediate resistance near the 1.0605 level.
The first major resistance is near the 1.0620 level and the 50 hourly SMA. A break above the 1.0620 resistance level could start another increase. In the stated case, it could rise towards the 1.0665 resistance.
Conversely, the pair might continue to move down below 1.0580. The next key support is near 1.0550, below the pair could drop towards 1.0520 on FXOpen. Any more losses might send the pair towards the 1.0500 level in the near term.
SPX 500 Seeks Support
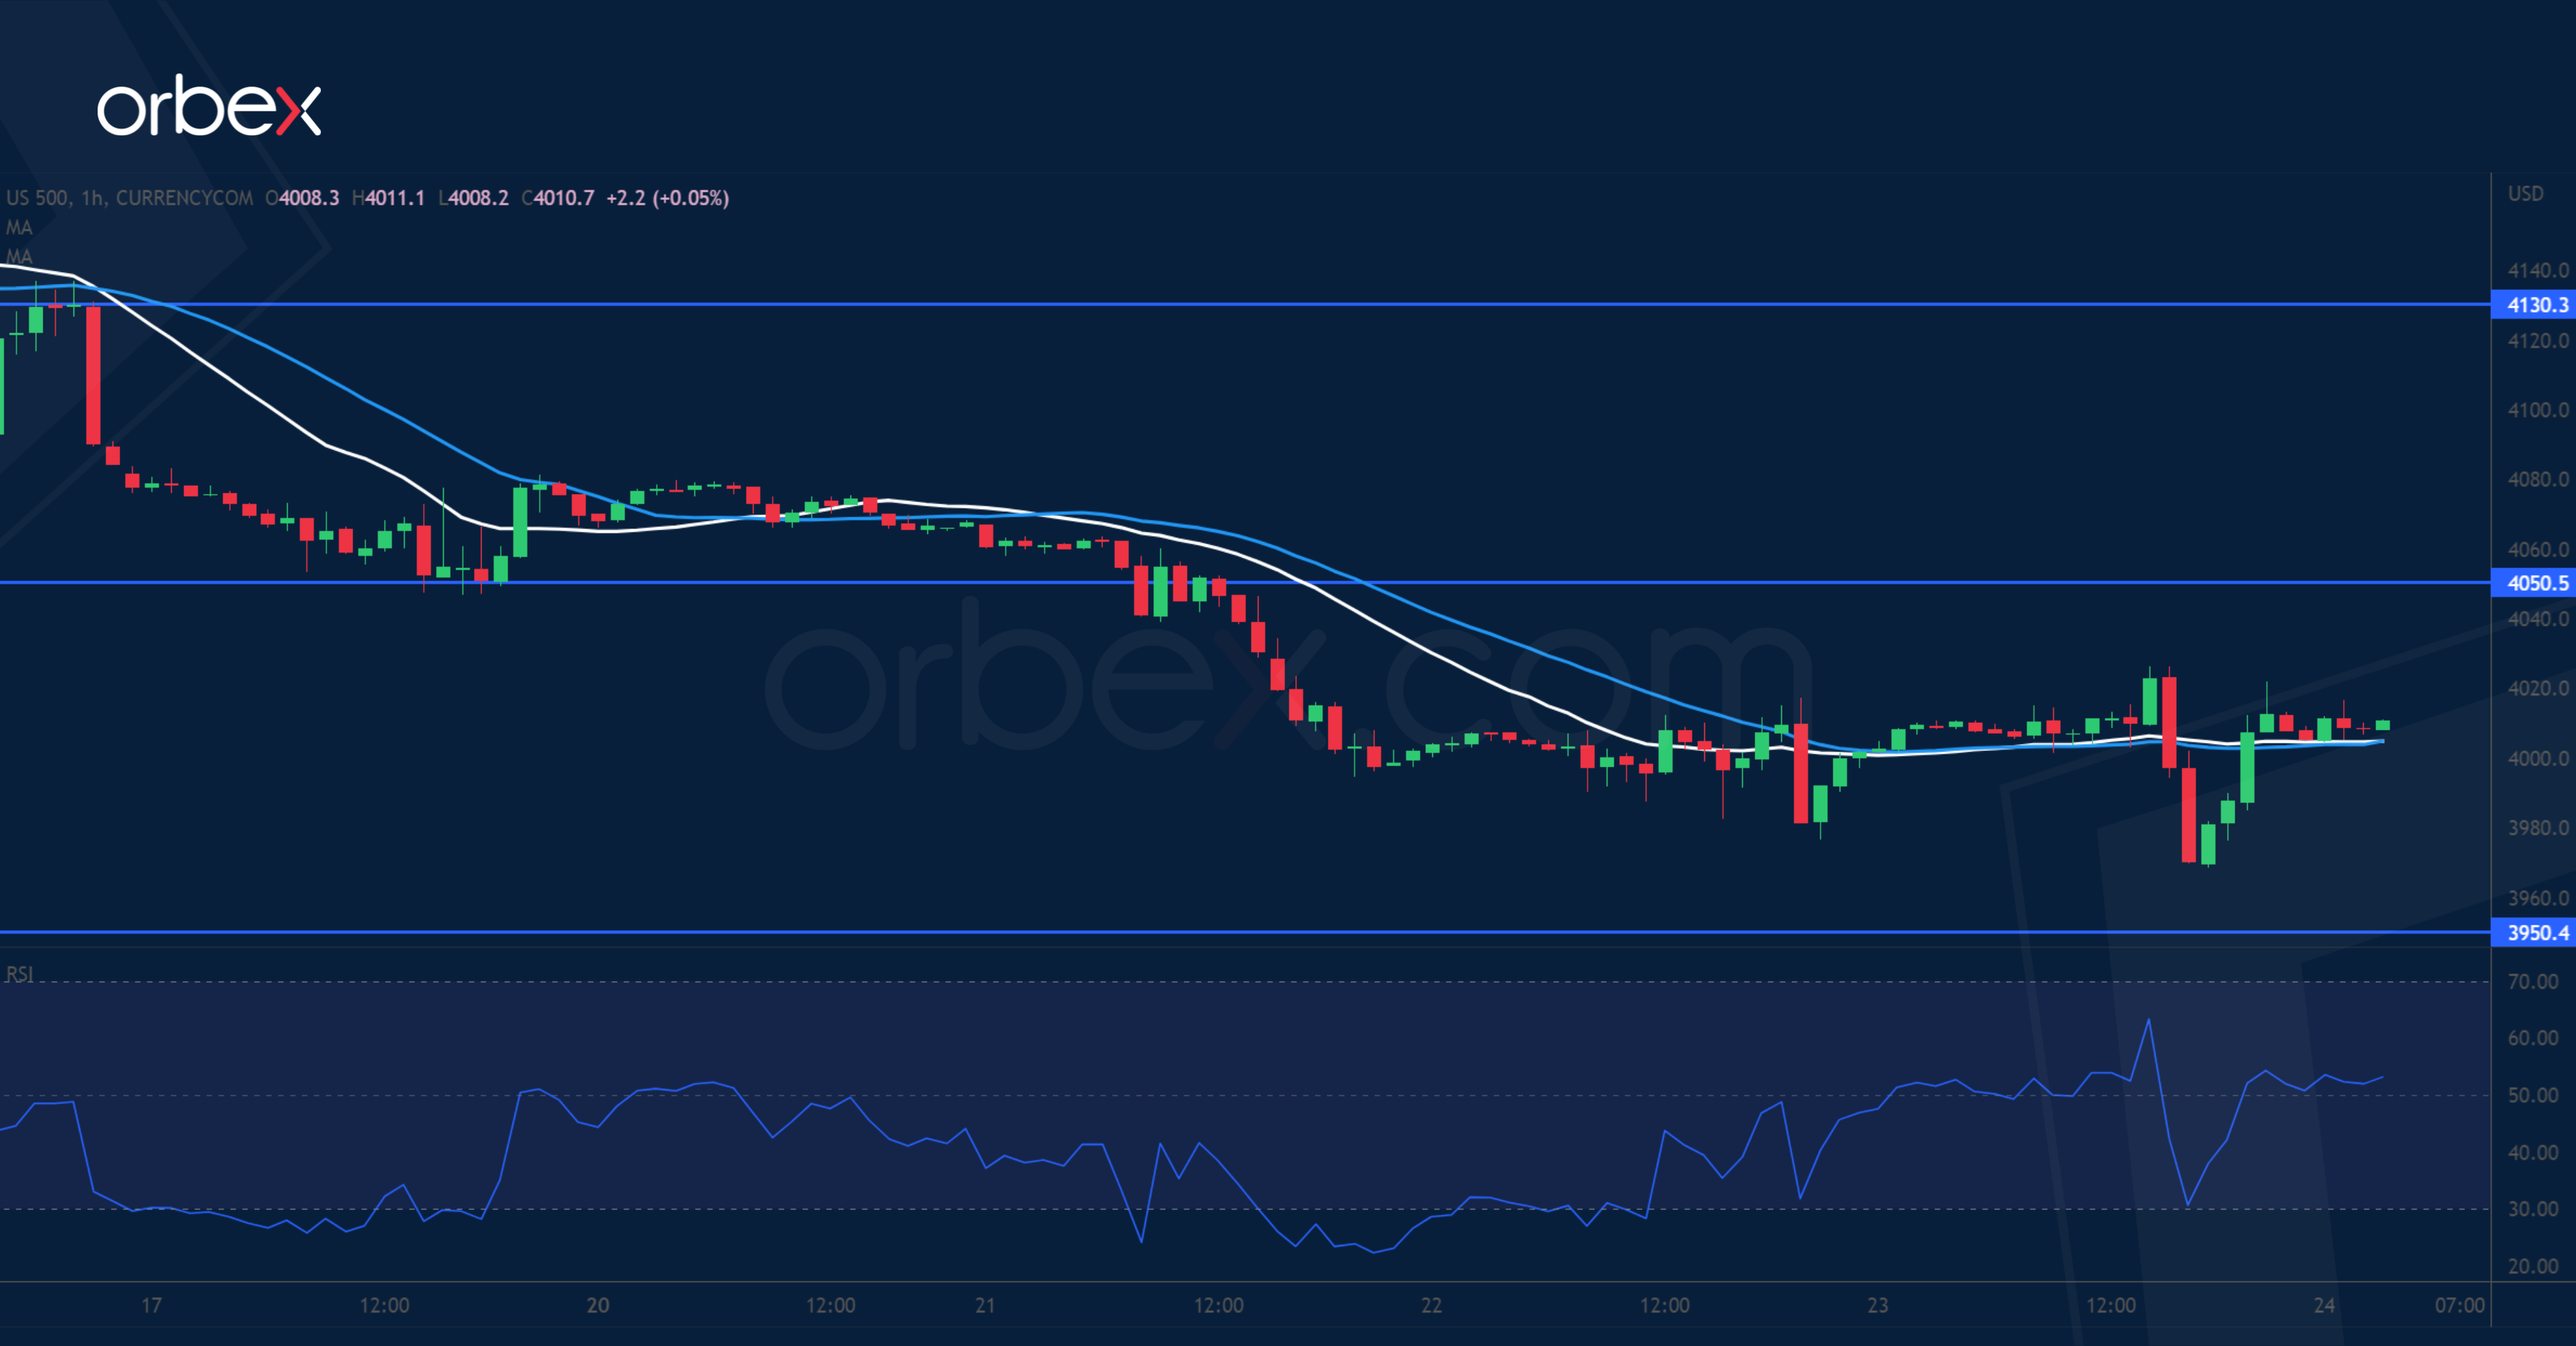
The S&P 500 struggles as investors temper their Fed pivot hope amid solid economic data. A break below the previous swing low of 4050 has forced leveraged buyers to exit, turning it into a resistance. Even the psychological level of 4000 has failed to contain the sell-off, which suggests a strong bearish pressure in the short-term. Still, from the daily chart’s perspective, the index has been probing support after closing above last December’s high of 4130. 3950 is the next level to see if buying interests would make their way back.
EUR/GBP Attempts to Bounce
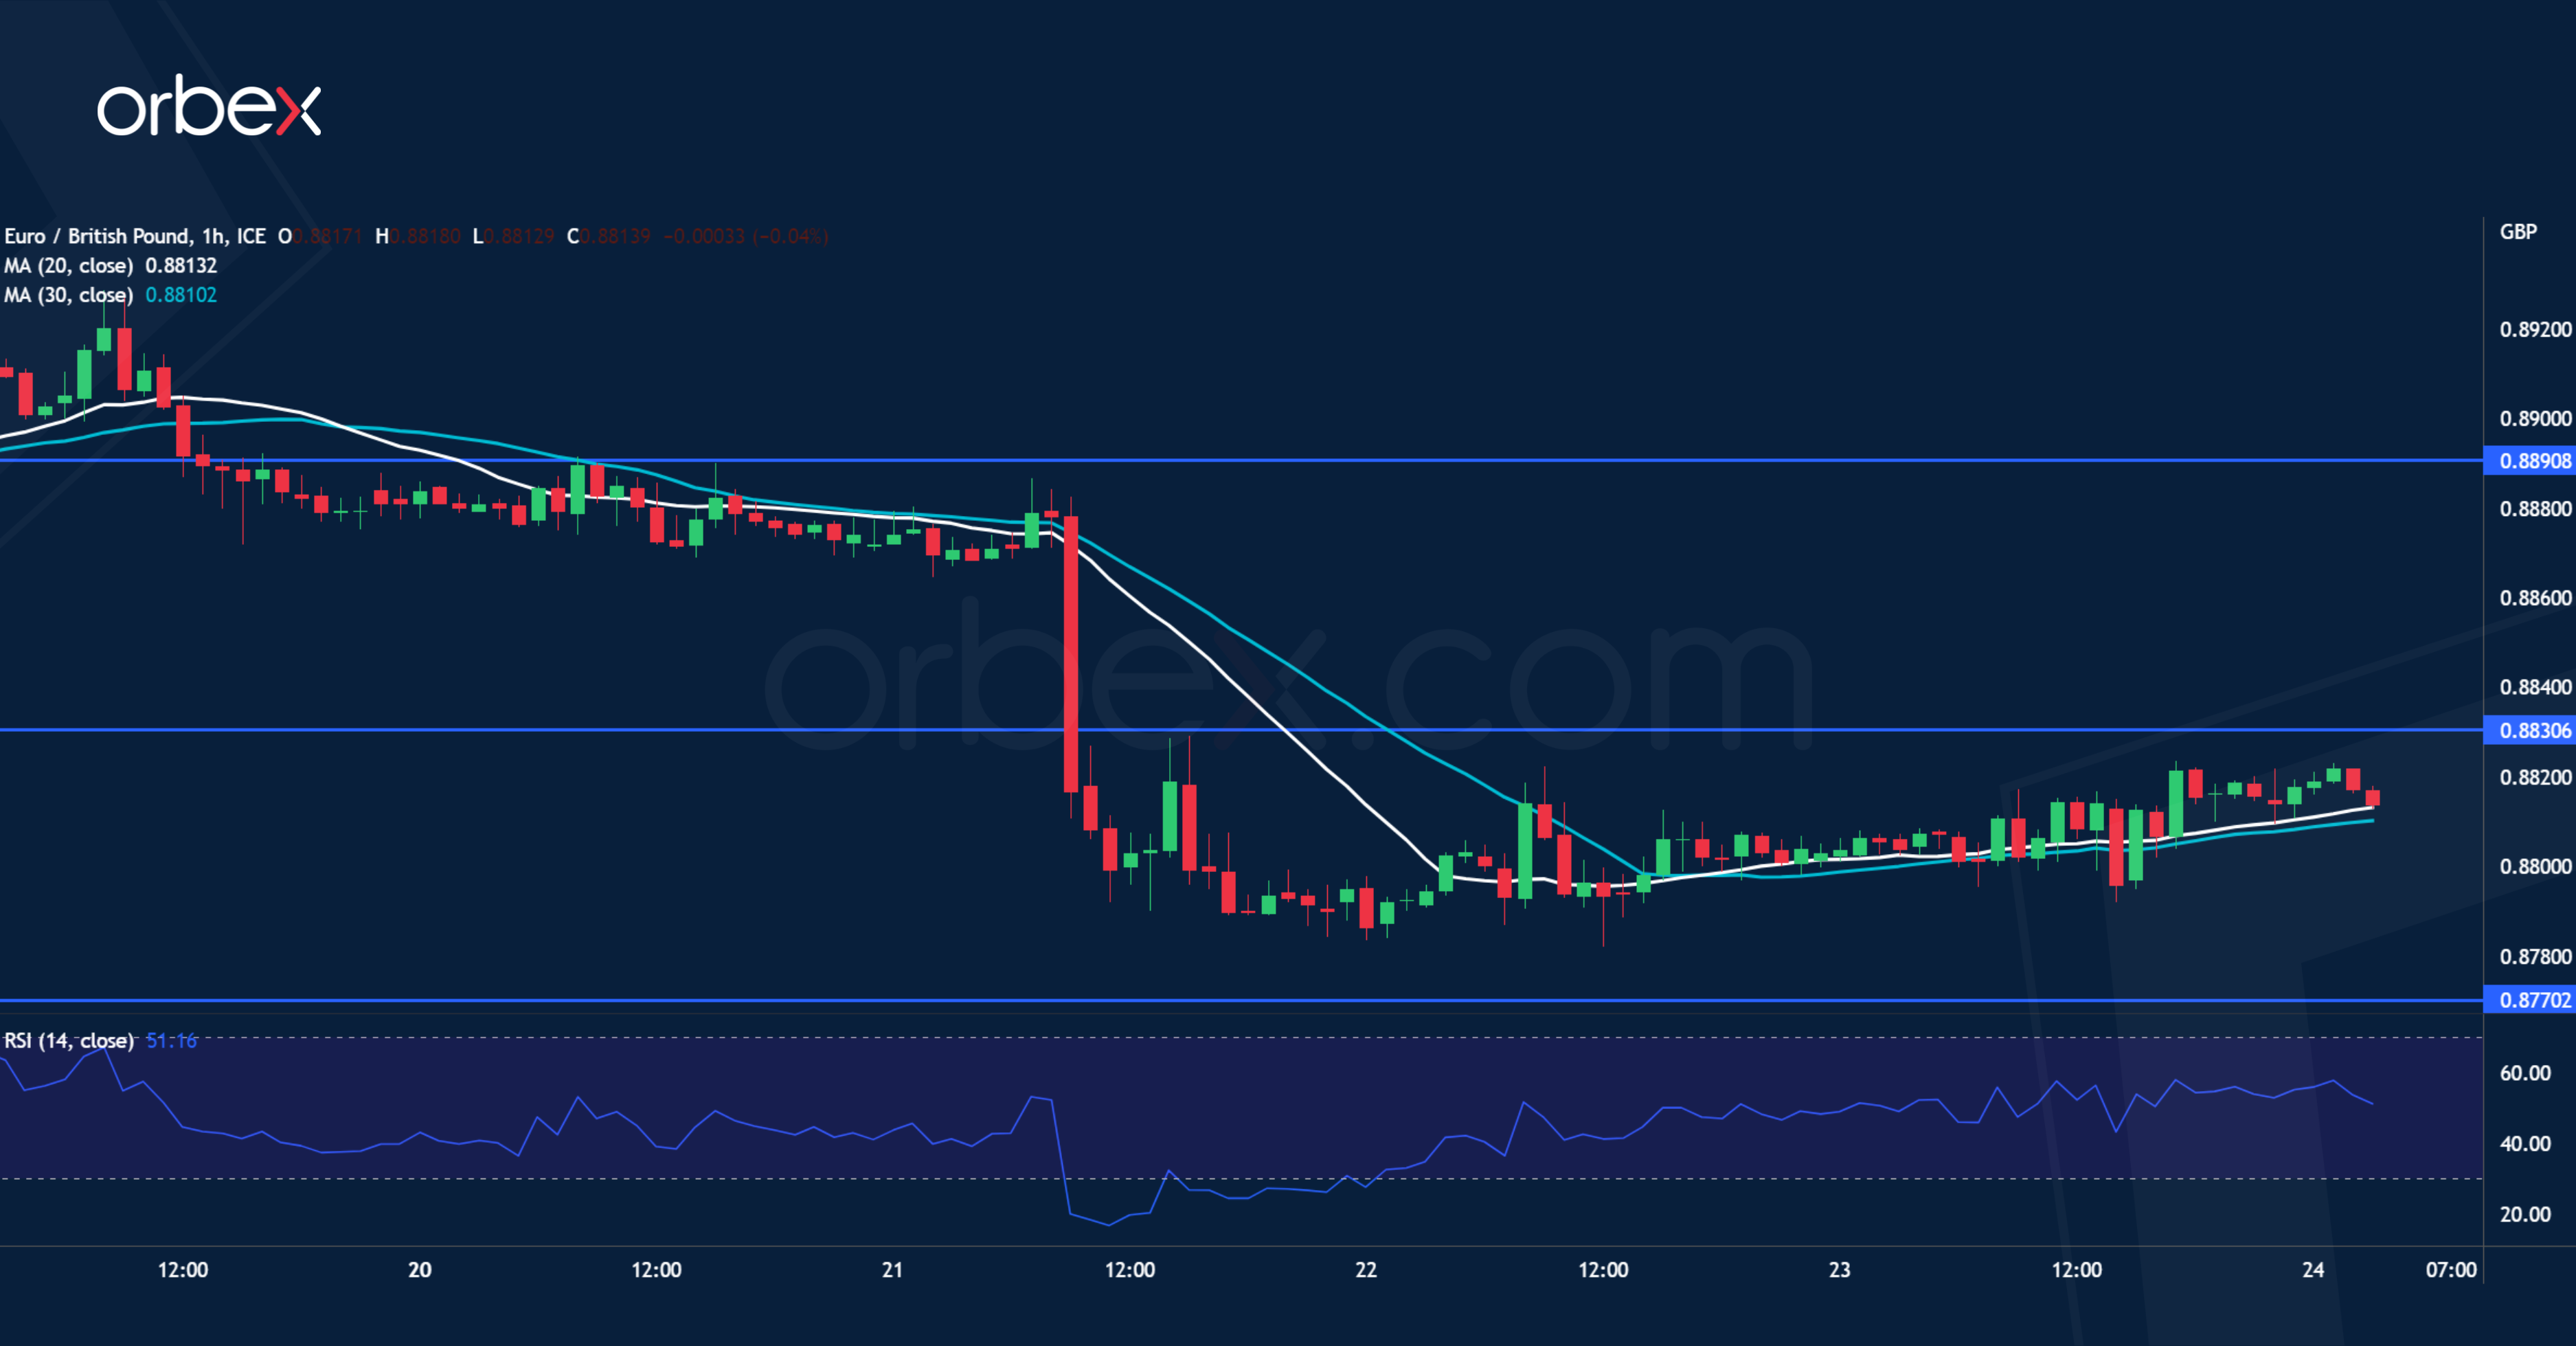
The pound holds on to its latest gains in the wake of hawkish BoE comments. A sharp drop below 0.8810 has invalidated the previous bounce, putting the bulls on the defensive. The daily support of 0.8770 coincides with the base of the breakout rally at the end of January, making it the bulls’ last stronghold. A bearish breakout could pave the way for a reversal below 0.8730. The RSI’s oversold condition attracted some bids and 0.8830 is the first hurdle. 0.8890 is the obstacle to clear before a recovery could materialise.
USD/JPY Test Support
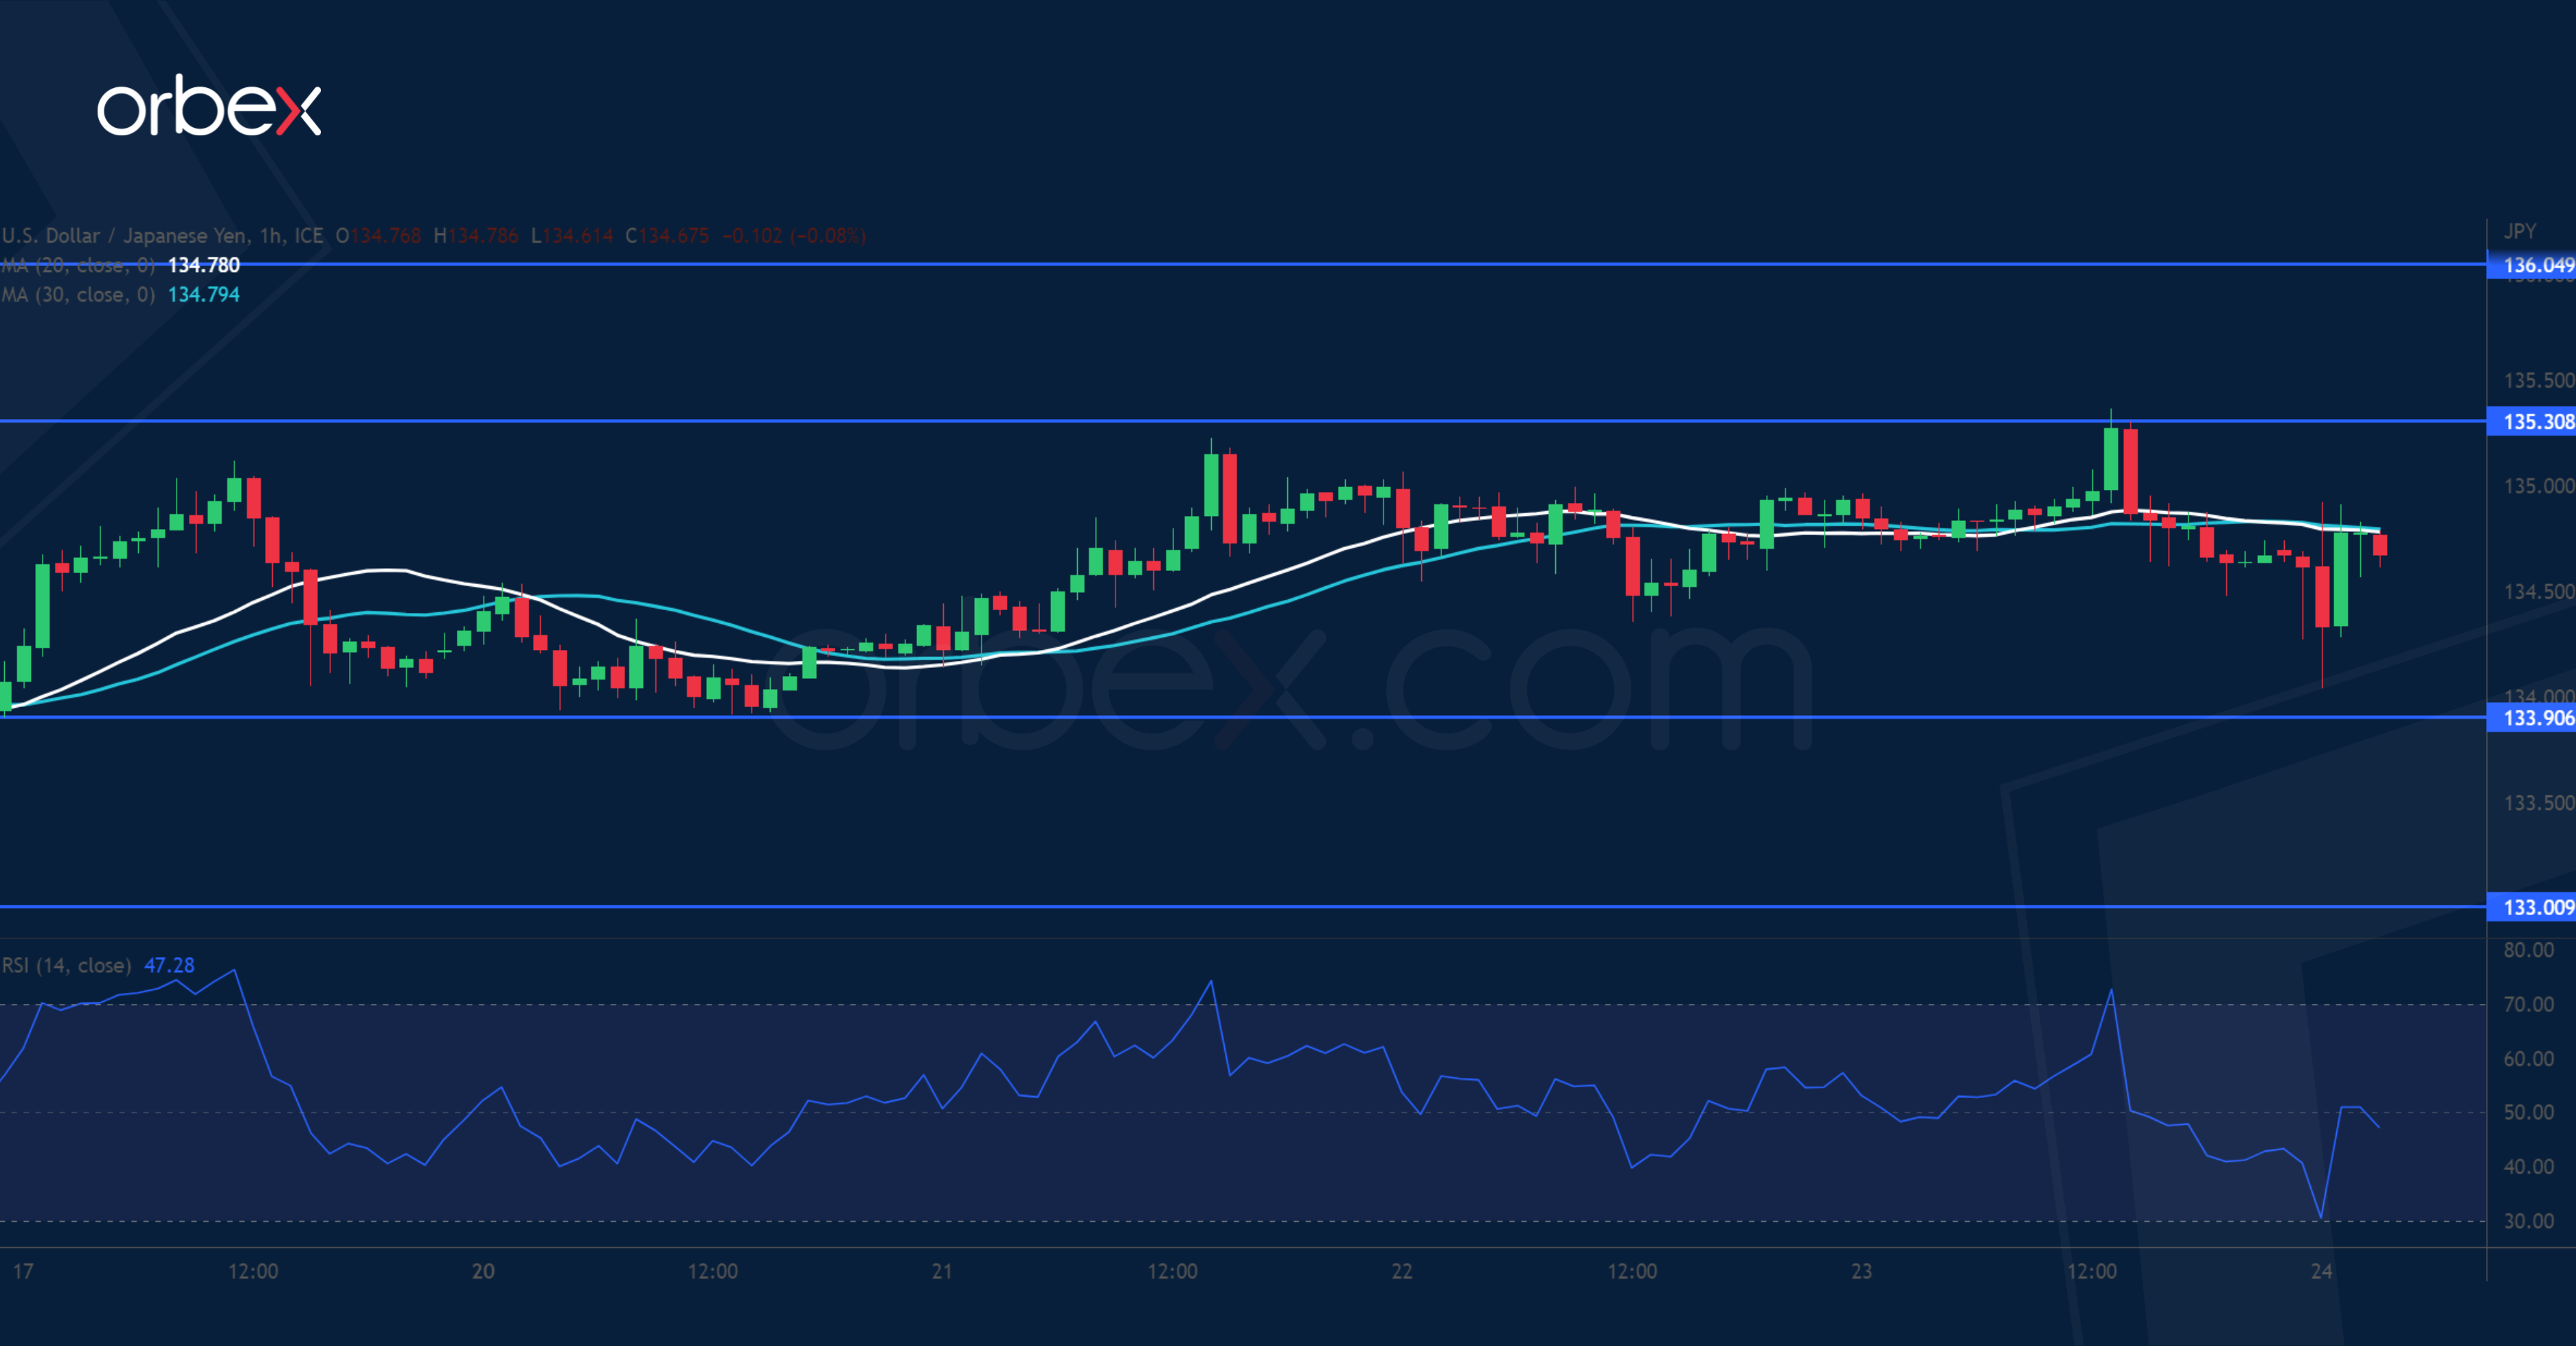
The Japanese yen inched lower as January’s inflation missed expectations. On the daily chart, a bullish MA cross and a close above this year’s high of 134.40 indicate that sentiment could be turning around in the medium-term. Zooming in, the pair may continue to enjoy the bullish ride as long as traders buy pullbacks. 133.90 is a fresh support and 133.00 near the 20-day SMA would be the bulls’ second line of defence. A close above 135.30 would resume the rally with the former support of 136.00 as a potential target.
USDCAD Improves Above the Descending Triangle
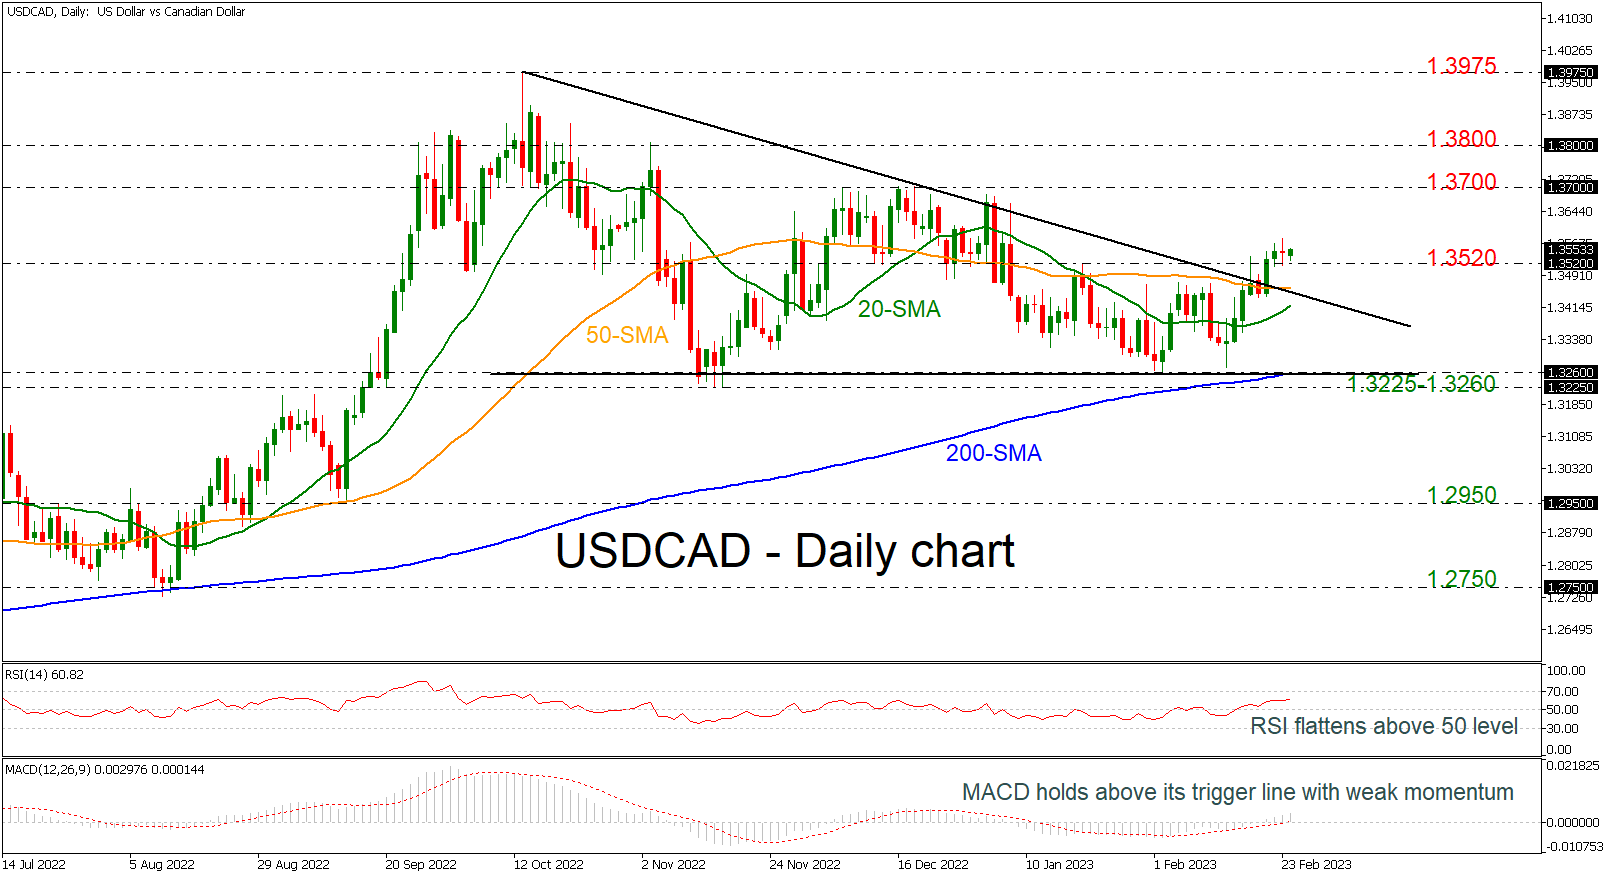
USDCAD advanced above the descending triangle, surpassing the 1.3520 resistance level; however, the RSI indicator is moving sideways above the neutral threshold of 50 and the MACD oscillator is moving slightly higher above its trigger and zero lines, but with weak momentum. The 20- and the 50-day simple moving averages (SMAs) suggest a potential bullish crossover in the next few sessions.
Should the pair manage to strengthen its positive momentum, the next resistance could come around the 1.3700 psychological mark. A break higher may challenge the 1.3800 handle ahead of the peak of 1.3975, achieved in October 2022.
On the flip side, if prices are unable to remain above the symmetrical triangle, the risk would shift back to the downside, with the 50-day SMA at 1.3465 and the 20-day SMA at 1.3420 coming again into focus. A drop below these lines would signal a resumption of the medium-term downtrend that’s been developing since October 2022. The next key support to watch lower down is the 200-day SMA at 1.3260.
Summarizing, USDCAD is showing some positive signs and only a drop back below the short-term SMAs may switch the outlook back to a strongly bearish one.
GBP/JPY Daily Outlook
Daily Pivots: (S1) 161.39; (P) 162.13; (R1) 162.57; More...
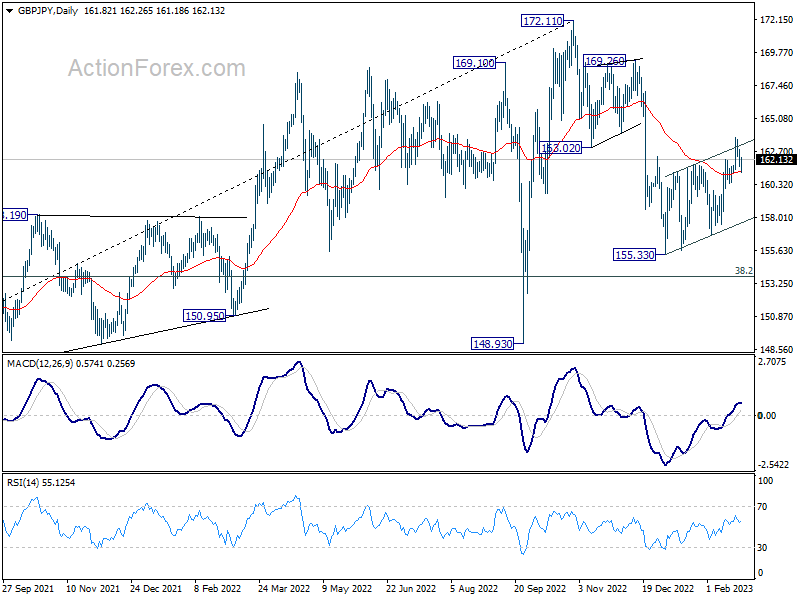
Intraday bias in GBP/JPY remains neutral for the momentum and another rise is in favor. On the upside, break of 163.73 would resume the rebound from 155.33 to 169.26/172.11 resistance zone. However, break of 160.44 minor support will dampen this case and bring retest of 155.33 low instead.
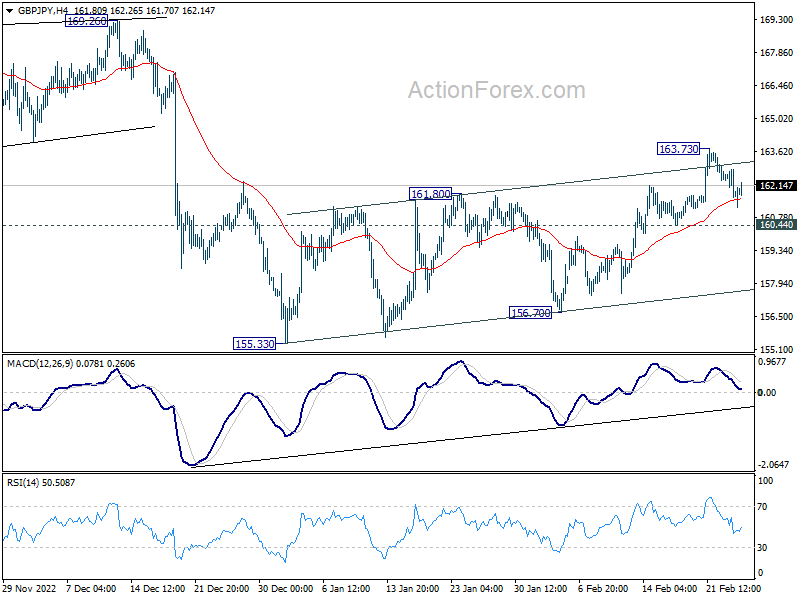
In the bigger picture, corrective decline from 172.11 medium term should have completed at 155.33. With 38.2% retracement of 123.94 to 172.11 at 153.70 intact, medium term bullishness is retained. That is, larger up trend from 123.94 (2020 low) is still in progress. Break of 172.11 high to resume such up trend is expected at a later stage.
EUR/JPY Daily Outlook
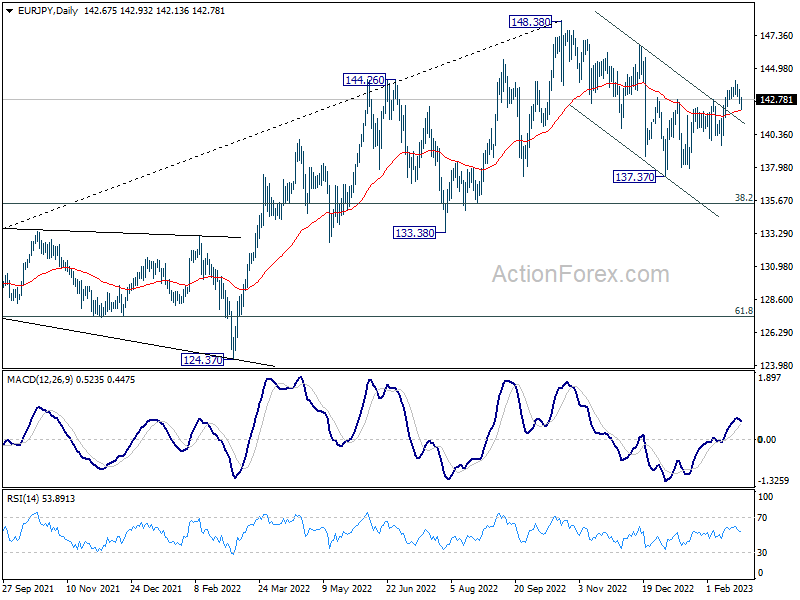
Daily Pivots: (S1) 142.32; (P) 142.92; (R1) 143.28; More....
Intraday bias in EUR/JPY remains neutral first. Another rise is in favor. Break of 144.15 will extend the rebound from 137.37 to 146.71 resistance next. However, sustained trading below 55 day EMA (now at 142.00) will argue that the correction from 148.38 is still in progress and target 137.37 low again.
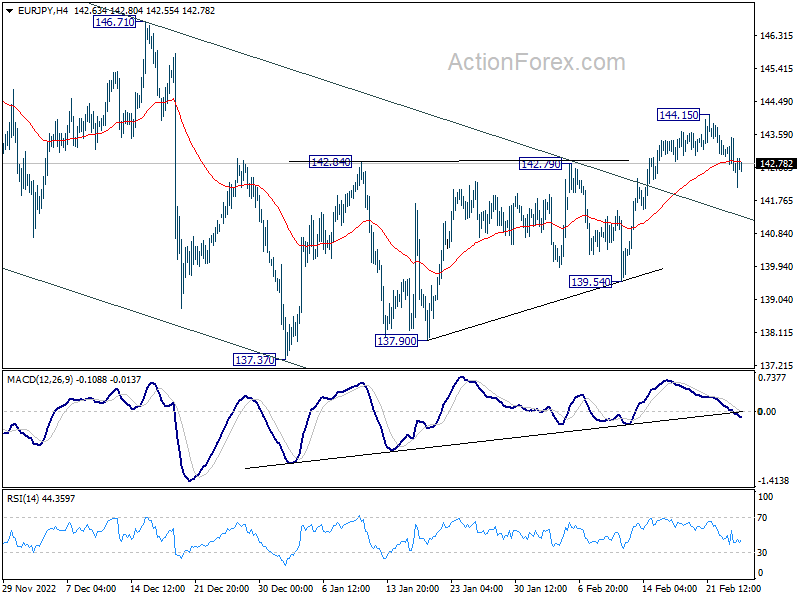
In the bigger picture, as long as 55 week EMA (now at 139.03) holds, larger up trend from 114.42 (2020 low) is still in progress for 149.76 long term resistance. However, firm break of 55 week EMA will bring deeper fall to 38.2% retracement of 114.42 to 148.38 at 135.40. Sustained break there will raise the chance of trend reversal, and target 61.8% retracement at 127.39.