Sample Category Title
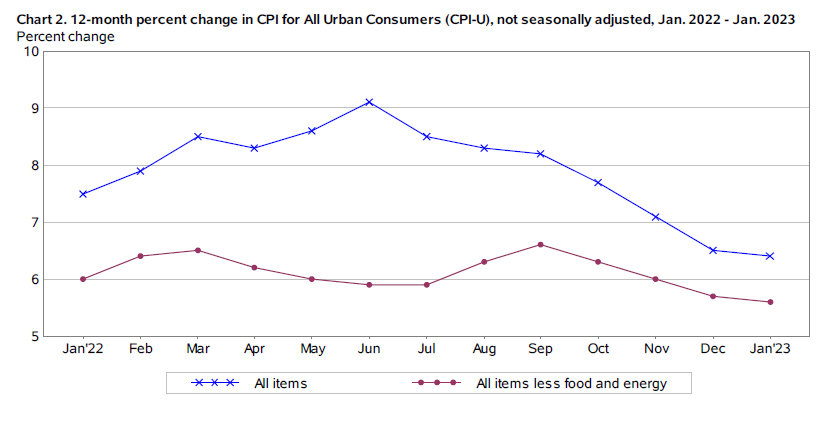
US CPI slowed to 6.4% yoy in Jan, Core CPI down to 5.6% yoy
US CPI rose 0.5% mom in January while CPI core rose 0.4% mom. Both matched expectations. Food index rose 0.5% mom while energy index rose 2.0% mom.
Over the last 12 months, CPI slowed from 6.5% yoy to 6.4% yoy, above expectation of 6.2% yoy. That's nonetheless the lowest reading since October 2021. CPI core slowed from 5.7% yoy to 5.6% yoy, above expectation of 5.5% yoy, but was the lowest since December 2021. Energy index rose 8.7% yoy while food index rose 10.1% yoy.
Huge Week for the USD
This week, there is a thrilling array of fundamental releases for the US Dollar. This array features several high-impact news releases like the Consumer Price Index (CPI), Retail Sales, and the Producer Price Index (PPI). The overall impact of this line-up remains to be seen, but we can formulate predictions based on the current price action on the DXY and the major pairs. Let's take a look at them right away!
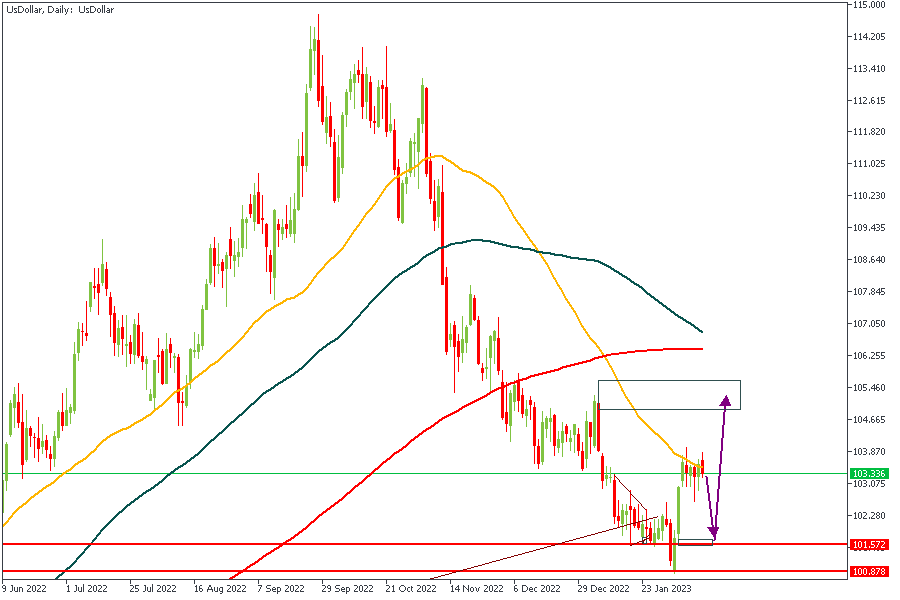
US Dollar - Daily Timeframe
The Daily timeframe chart of the US Dollar index shows the price currently reacting from the 50-Day moving average and the 61.8 Fibonacci retracement. Considering the most recent break of the structure being bullish, I am expecting to see an initial bearish reaction from the Dollar. After that bearish reaction, we can hope for a bullish continuation from the drop-base-rally demand zone I have marked towards the bottom of the chart attached above.
Analysts’ Expectations:
- Direction: Bullish
- Target: 104.739
- Invalidation: 100.774
GBPUSD
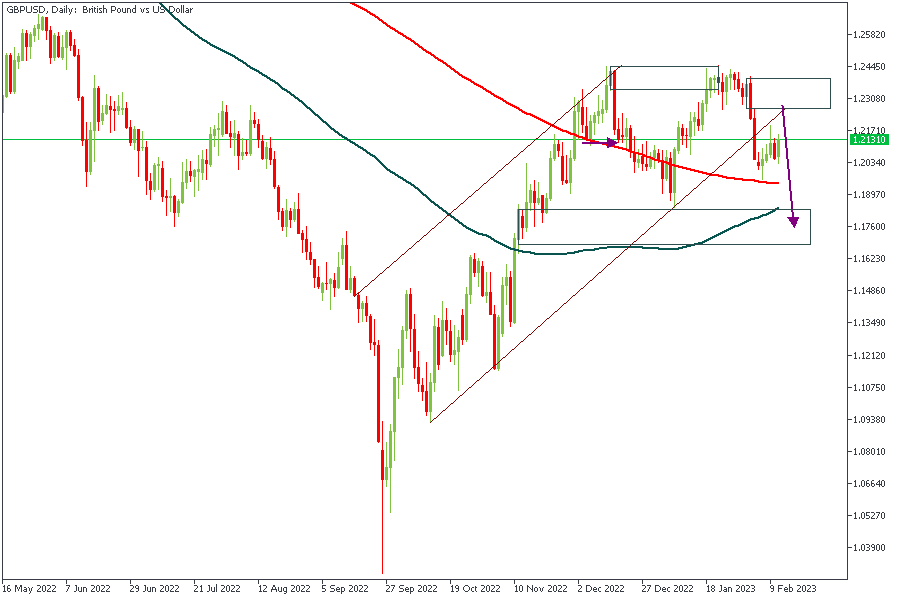
GBPUSD has recently broken below the trendline support of the rising channel. If the price rises to meet the trendline, I expect that to act as a bearish confirmation. The highlighted supply zone is also a crucial confluence to consider in favor of a bearish move.
Analysts’ Expectations:
- Direction: Bearish
- Target: 1.19412
- Invalidation: 1.24058
EURUSD
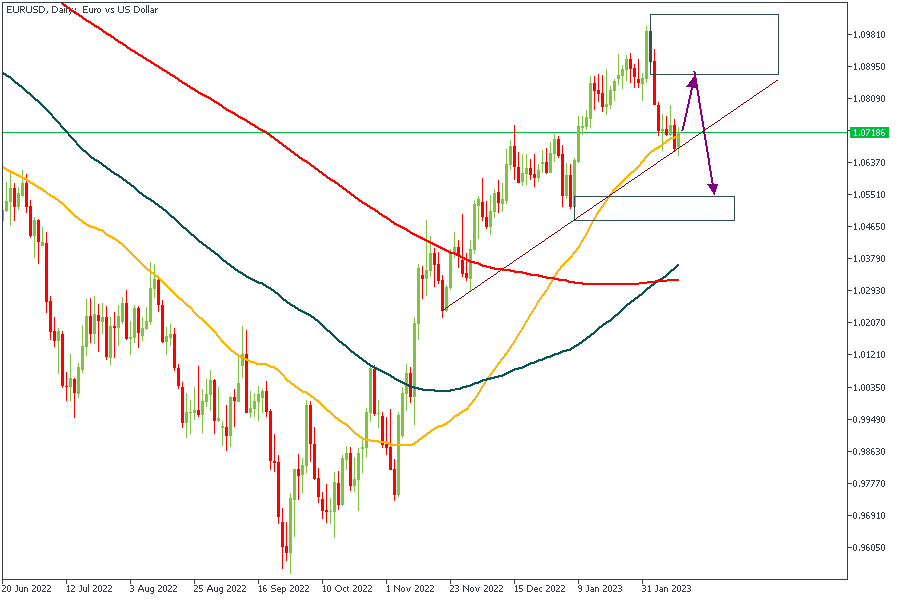
EURUSD is currently reacting from a confluence of the 50-Day moving average. However, the price action to the left suggests that the price needs to fill up the imbalance created by the break of the previous high.
Analysts’ Expectations:
- Direction: Bearish
- Target: 1.10386
- Invalidation: 1.06004
XAUUSD - 4 Hour Timeframe
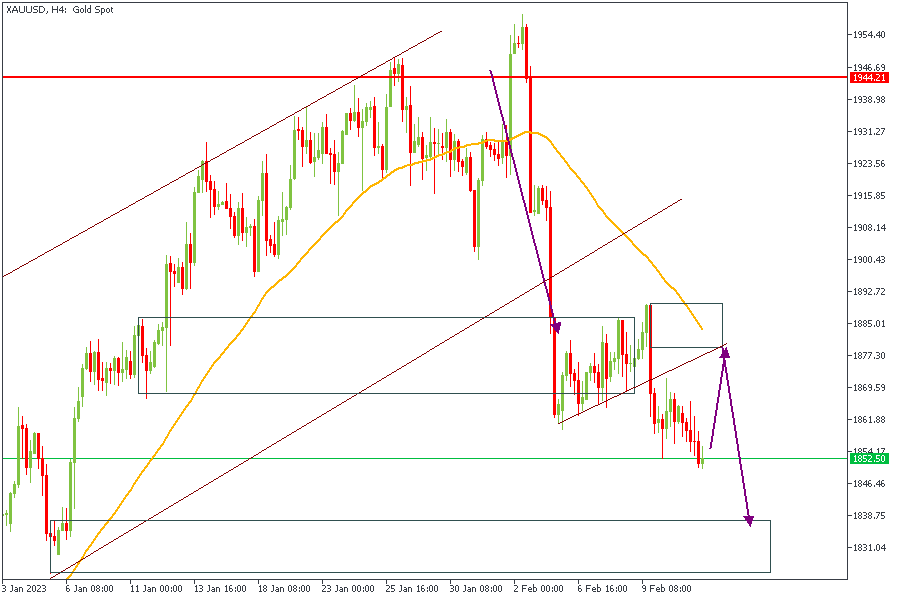
Gold has recently broken below the trendline support of the rising wedge, followed by a retracement and another structure break. Based on this, the order block responsible for the most recent structure break would act as an area of resistance. The 50-period moving average provides further confirmation in favor of a bearish reaction.
Analysts’ Expectations:
- Direction: Bearish
- Target: $1,839.04
- Invalidation: $1,890.70
CONCLUSION
The trading of CFDs comes at a risk. Thus, to succeed, you have to manage risks properly. To avoid costly mistakes while you look to trade these opportunities, be sure to do your due diligence and manage your risk appropriately.
Why Isn’t Gold Responding to Uncertainty?
There are a lot of reasons for investors to seek safe havens, particularly recently. But gold has struggled to reach the $1,900/oz level. Although it could make it that high eventually, it's still notable that it's taking so long. There are some fundamental things going on that could explain the phenomenon, as well as some other unusual things happening in the Forex space.
The clouds are gathering
Gold bulls could compile a pretty long list of reasons to support their position. From the longer term expectation of a recession, to the more immediate worries around the "balloon crisis" between the US and China. In fact, after the US confirmed shooting down as many as four "objects" in the last few days, risk appetite rallied. The stock market rose at the expense of safe havens, including gold.
Even with the dollar getting weaker recently, gold still hasn't managed to move up as much as anticipated. There are other, less publicized events in the gold space, such as Freeport cutting production in Indonesia due to floods. Meanwhile, China's bought up over $5B in gold over the last month, adding it to their reserves. That was the third month of reserve growth in China, and is in line with global central banks expanding their precious metal holdings.
Prices are slowing down
So, given the fundamentals, it's perfectly reasonable to expect gold prices to have upward momentum. But that doesn't mean there might be some delays along the way. One of those could be the pending release of US CPI figures later today. As discussed, inflation is expected to come down once again.
Generally, gold is seen as a store of value. It's not subject to inflation. So, in periods when inflation is expected to rise, gold generally gets more interest. But, if inflation peaks and starts to come down, that interest starts to wane. Especially in an environment with higher interest rates, which can compensate much of if not all of the losses from expected inflation.
Things are a bit skewed right now
More than gold specifically, other pricing mechanisms are in a situation that is economically irrational, for the moment. This can lead to these somewhat contradictory or somewhat erratic moves in assets, such as gold. But also things like crude, copper, and even currencies. The dollar in particular, which is the basis for pricing a lot of assets around the world.
The thing is, in normal circumstances, debt should generate a return on investment. That is, the interest rate should be higher than inflation. This is a "positive real rate of return". The longer the debt, the more above inflation it should pay. But now, inflation is above the interest rate, meaning that anyone preserving liquidity is losing money. Buying treasuries, for example, generates a net loss. Which means investors have to look for alternatives to investment that aren't debt.
The expectation for this year is that the Fed funds rate will remain above 5.0%, but inflation will come down to something around 3.0%. That means "rationality" in the debt markets is expected to be restored. But, before that, markets will have to adjust, which can mean situations where risk rises, but gold prices don't, might keep happening for a while longer.
ECB Makhlouf: I’m open to acting forcefully to bring inflation down
ECB Governing Council member Gabriel Makhlouf told WSJ, "I'm open to acting forcefully to get inflation down to our target." He noted that interest rate could rise to above 3.5% and stay there.
Regarding speculations that ECB would cut interest this year, Makhlouf said, "I think that really is going too far... We'll reach a point where we're going to, then plateau."
"I see the ECB as putting up interest rates after the March meeting...Even though inflation is coming down it's still way above our target," Makhlouf added.
Dollar Index: Dollar Keeps Weak Tone Ahead of Release of Key US Inflation Report
The US dollar remains at the back foot and extends weakness in European trading on Tuesday, ahead of key event – US inflation report for January.
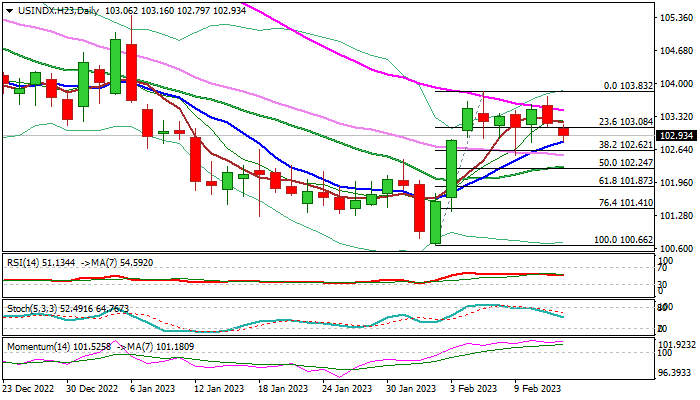
Fresh bears are in control for the second consecutive day following repeated failure at pivotal barriers at 103.43/58 (55DMA / Fibo 61.8% of 105.39/100.66 bear-leg) and test initial support at 102.79 (rising 10DMA) which also marks the floor of seven-day range.
Potential break lower would increase downside risk on formation of a double-top pattern on daily chart and add to signals that short correction from 100.66 (Feb 2 low) might be over.
Daily indicators are heading south and contribute to negative near-term outlook, as the action is heavily weighed by thick falling daily Ichimoku cloud (base of the cloud lays at 104.12).
The greenback is in defensive ahead of key US data, with annualized inflation expected to ease to 6.2% in Feb from 6.5% in Jan, but monthly figure is expected to jump by 0.5% following 0.1% increase previous month.
Although the core inflation (excluding volatile food and energy components) is also forecasted to ease to 5.5% in Feb from 5.7% in Jan, economists remain concerned as core inflation’s values of nearly three times above Fed’s 2% target, warn that price pressure is still strong and imply that the US central bank may opt for extended tightening period in efforts to bring inflation under control and push it towards 2% target.
Expectations for annualized CPI range from 6.1% to 6.7%, with release above consensus to offer fresh boost to the dollar, as rising inflationary pressure would add to the scenario of hiking interest rates above expected targets, while lower figures in Feb to boost optimism that inflation have peaked and increase pressure on dollar.
Res: 103.43; 103.83; 104.14; 104.28.
Sup: 102.79; 102.50; 101.87; 101.41.
FTSE ($UKX) Elliott Wave Bullish Sequences Forecasting The Rally
Hello fellow traders. In this article we’re going to take a quick look at the Elliott Wave charts of FTSE, published in members area of the website. As our members know FTSE is showing bullish sequences in the cycle from the October’s 6708.6 low. Consequently we expected further rally to continue.We recommended members to avoid selling the index, while keep favoring the long side. In the further text we are going to explain the Elliott Wave Forecast.
FTSE Elliott Wave 1 Hour Chart 02.06.2022
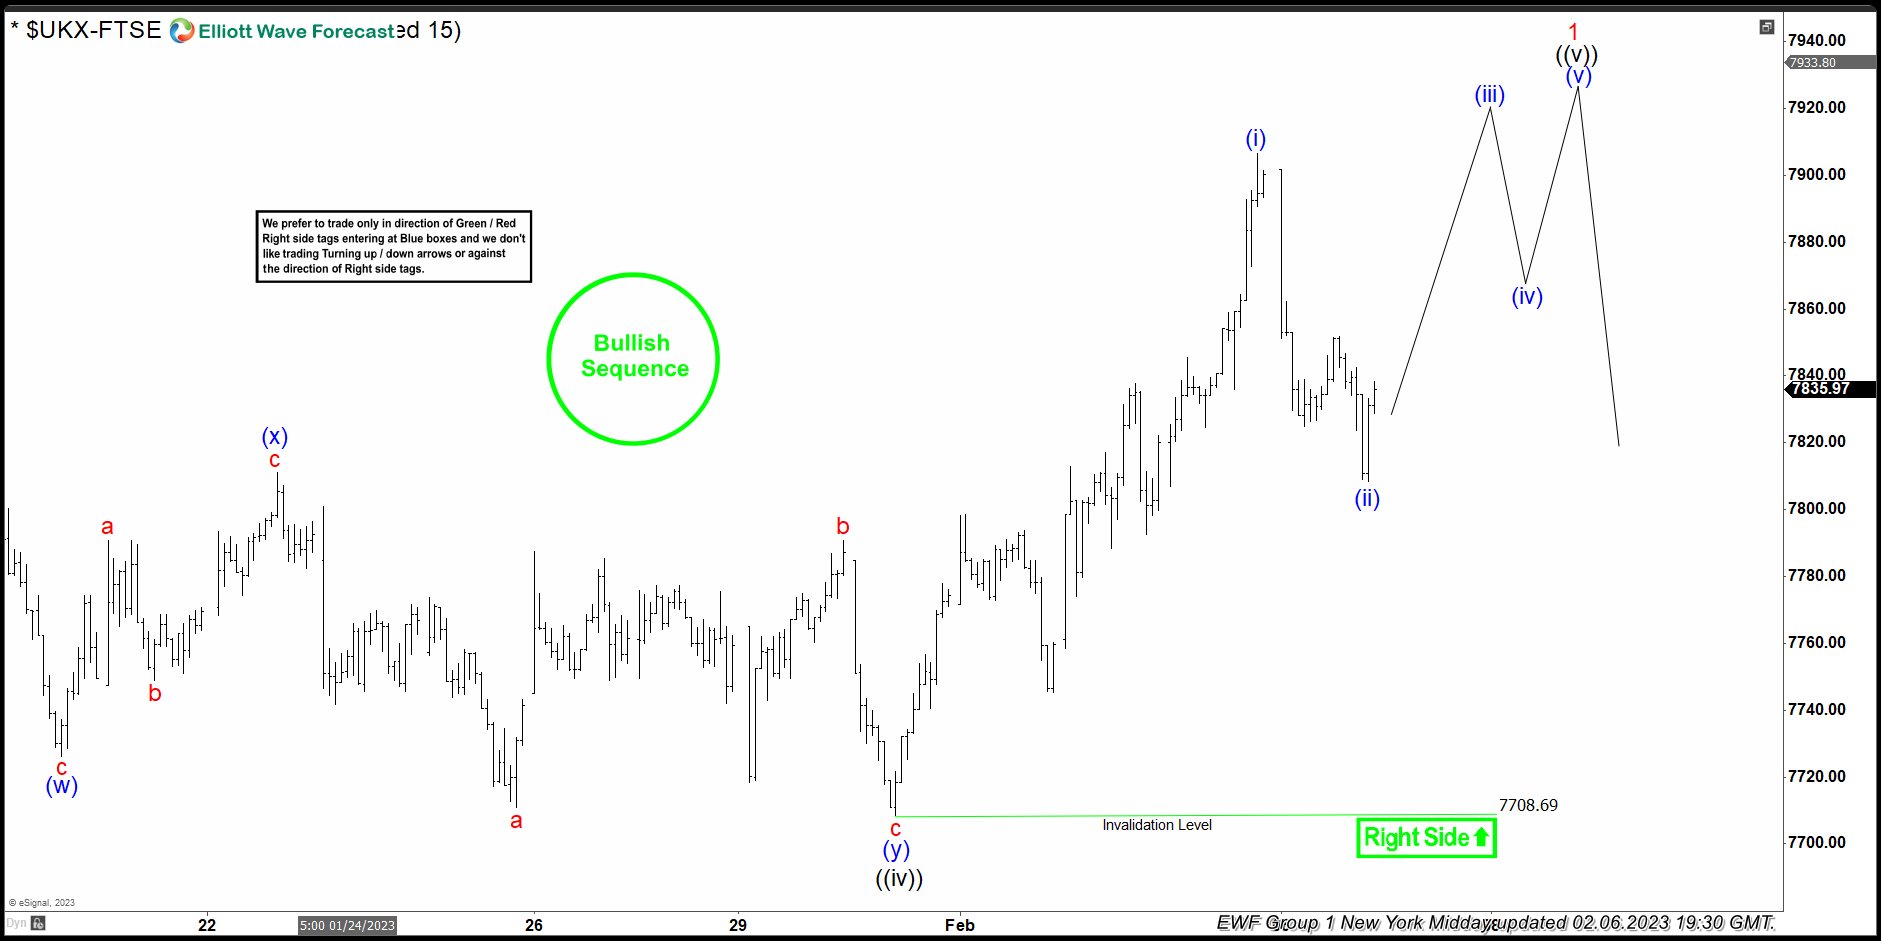
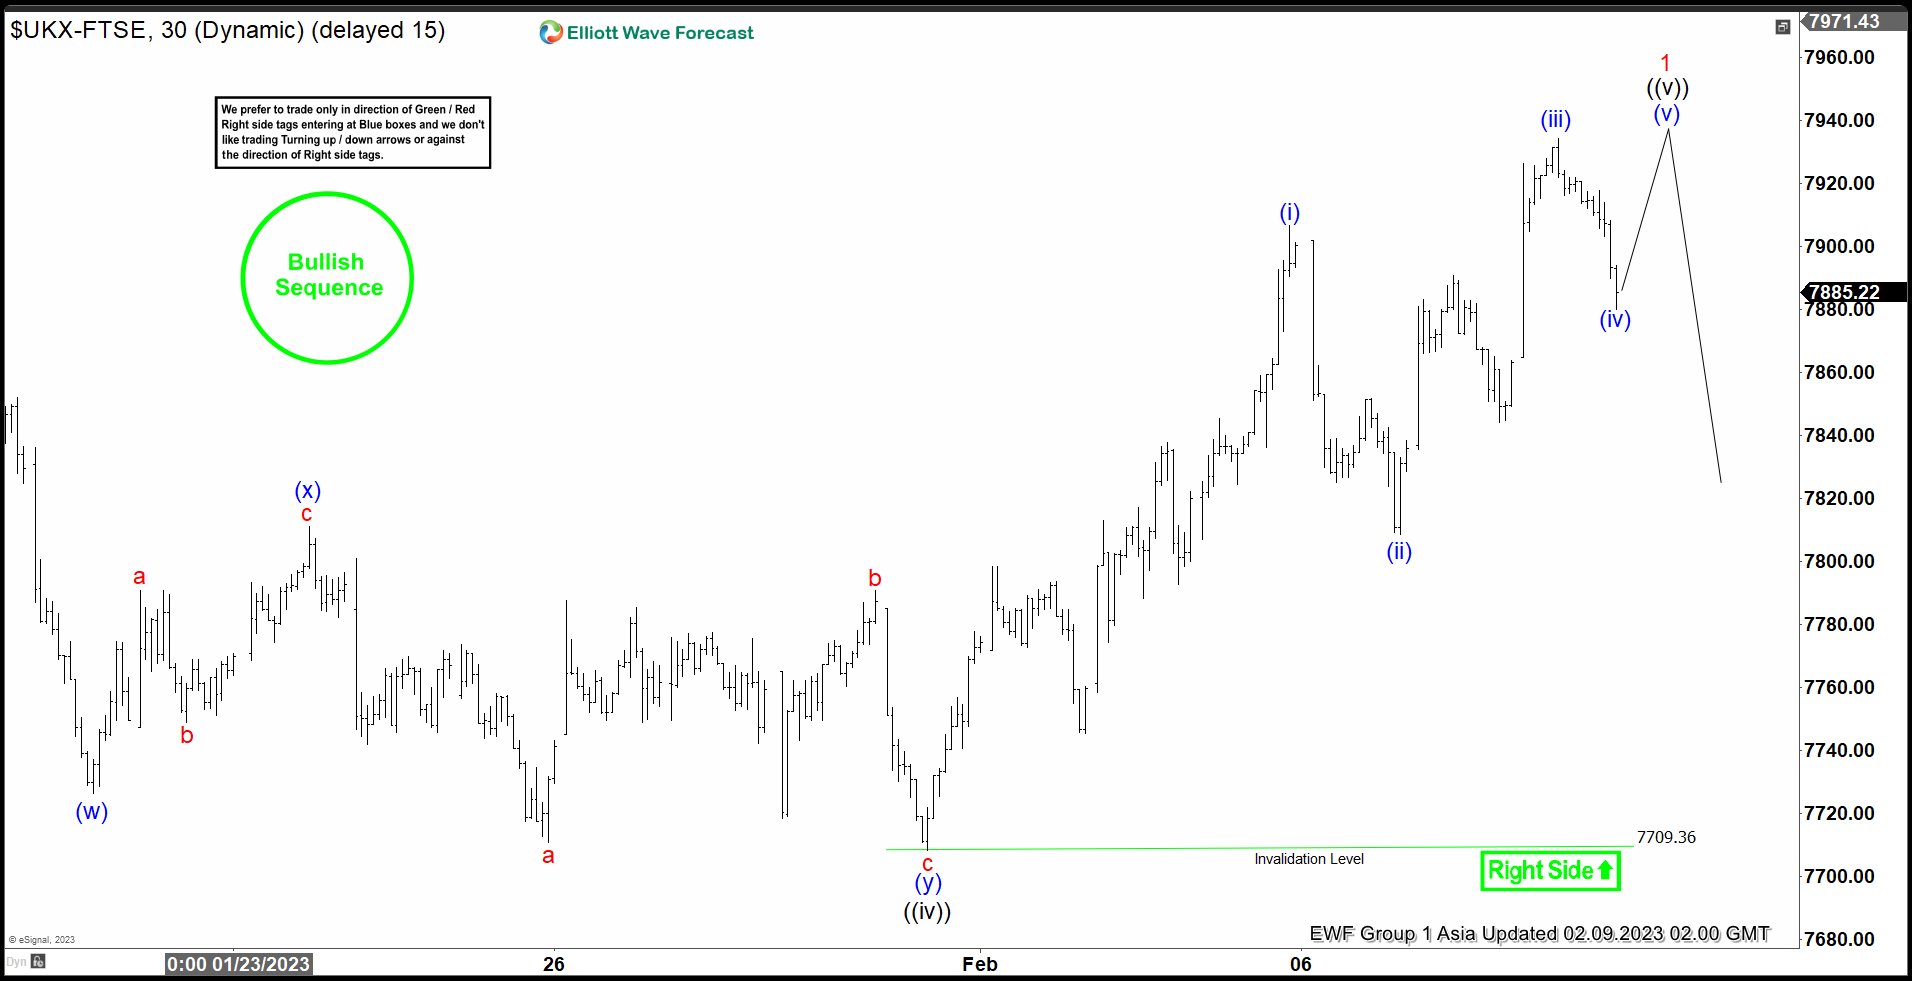
FTSE remains bullish against the 7708.69 pivot in first degree. We believe wave ((v)) is still in progress, when now we ended (ii) of ((v)). We expect to see Elliott Wave Ending Diagonal potentially, so structure should be 5 waves up from the 7708.69 low. Buyers should ideally appear for the further rally toward new highs.
FTSE Elliott Wave 1 Hour Chart 02.09.2022
FTSE found buyers and made rally toward new highs as expected. Structure still looks incomplete. So far we can count 3 waves, so another leg up would be ideal to have clear 5 waves in Ending Diagonal. We believe that FTSE is about to end wave (iv) of ((v))). If holds the current low and makes turn higher from current levels, it can see approximately 7950 area before 3 waves pull back takes place. After proposed pull back, we expect to see continuation higher again.
Keep in mind that market is dynamic and presented view could have changed in the mean time. You can check most recent charts with target levels in the membership area of the site Best instruments to trade are those having incomplete bullish or bearish swings sequences. We put them in Sequence Report and best among them are shown in the Live Trading Room.
CPI to Offer Major Clue on Fed’s Next Move
The incoming US CPI data is set to provide a major steer for markets still gripped by the Fed’s ongoing battle against inflation. Risk assets have been reluctant to make sizeable moves of late, as they brace for what could be a blowout January inflation report following blockbuster jobs figures from the same month.
Should the inflation data remain elevated and defy the Fed’s 450bps of interest rate hikes thus far, CPI weighting and methodology changes notwithstanding, that might prompt policymakers to raise rates even more. A major repricing for a higher US rates peak is likely to extend the dollar’s rebound while unwinding more of the year-to-date gains seen in risk assets.
On the other hand, further moderation in consumer prices should give more license for the likes of stocks, gold, and even cryptos, to keep fighting the Fed’s hawkish narrative. However, riskier assets may only receive the all-clear to march sustainably higher once the Fed can officially pause this rate hike cycle, which could open the door to the idea of an eventual dovish pivot.
Pound Steady after Jobs Report
UK wage growth eases
The British pound is slightly higher on Tuesday, as the markets digest today’s UK employment report. Wage growth rose by 5.9% in the October-December period, down from 6.5% and the lowest since the three months to July 2022. This was also lower than the forecast of 6.2%. The unemployment rate held at 3.7% and unemployment claims fell by 12,900, following a drop of 3,200 in the previous release.
The BoE will be pleased with the drop in wage growth, as it signals a cooling in the labour market which is critical in the battle to lower inflation. The central bank is anxiously waiting for the January inflation report which will be released on Wednesday. Headline CPI is expected to fall to 10.2%, down from 10.5%, but these levels are unacceptably high, leaving the BoE little choice but to continue raising rates. The BoE meets next on Mar. 22 and is expected to raise rates by 25 basis points.
Will US inflation continue to fall?
In the US, the markets are locked and ready ahead of today’s key inflation report. Inflation is projected to fall to 6.2%, down from 6.5%, but there is unease in the markets that headline inflation might be stronger than expected. The recent blockbuster jobs report indicated that the US labour market remains robust and January has seen higher energy and used car prices. The markets aren’t as confident that the Fed will cut rates late in the year and if the inflation report is higher than expected, the markets could fully price in two more rate hikes. This would be a major shift towards the Fed stance, as Jerome Powell has been saying for months that the pace of rate hikes will likely be higher and longer than previously expected.
Recent inflation releases have had a significant impact on the US dollar, which has fallen sharply when inflation has been weaker than expected. Today’s inflation report will likely follow that pattern, and if inflation is weaker than expected, the dollar should lose ground. Conversely, look for the greenback to post gains if inflation is higher than forecast.
GBP/USD Technical
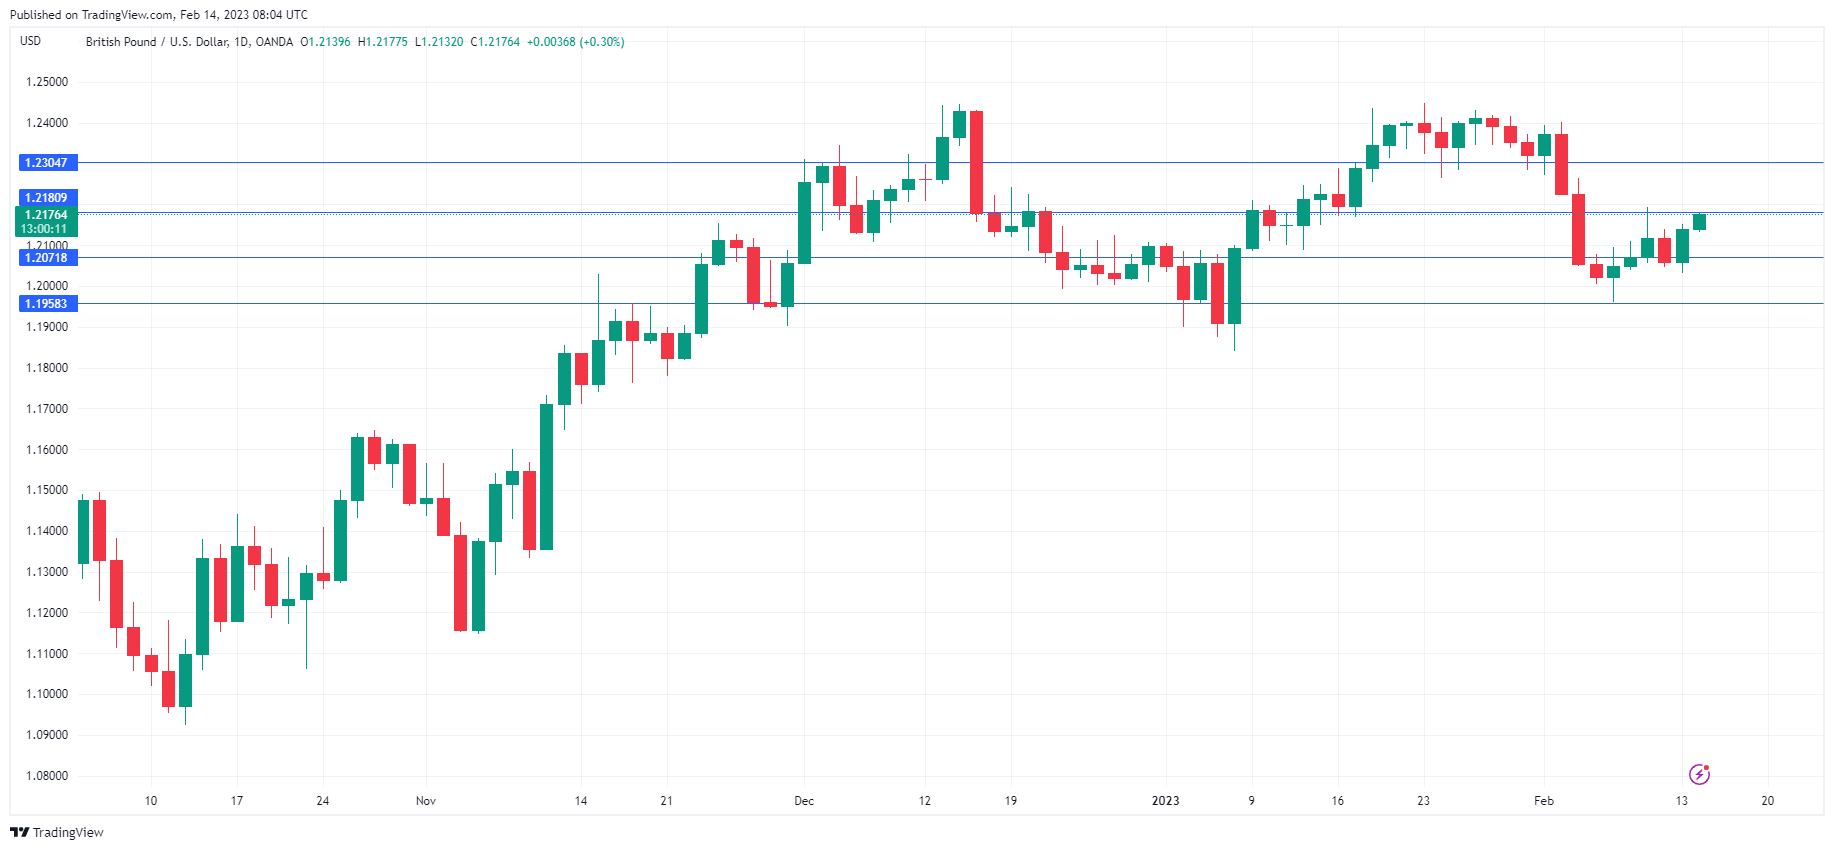
- GBP/USD is putting strong pressure on resistance at 1.2180. Above, there is resistance at 1.2304
- 1.2071 and 1.1958 are providing support
USDJPY Trapped Below 133.00 as US CPI Inflation Looms
USDJPY ran out of steam near February’s bar of 133.00 for the second time, despite Monday’s notable rebound.
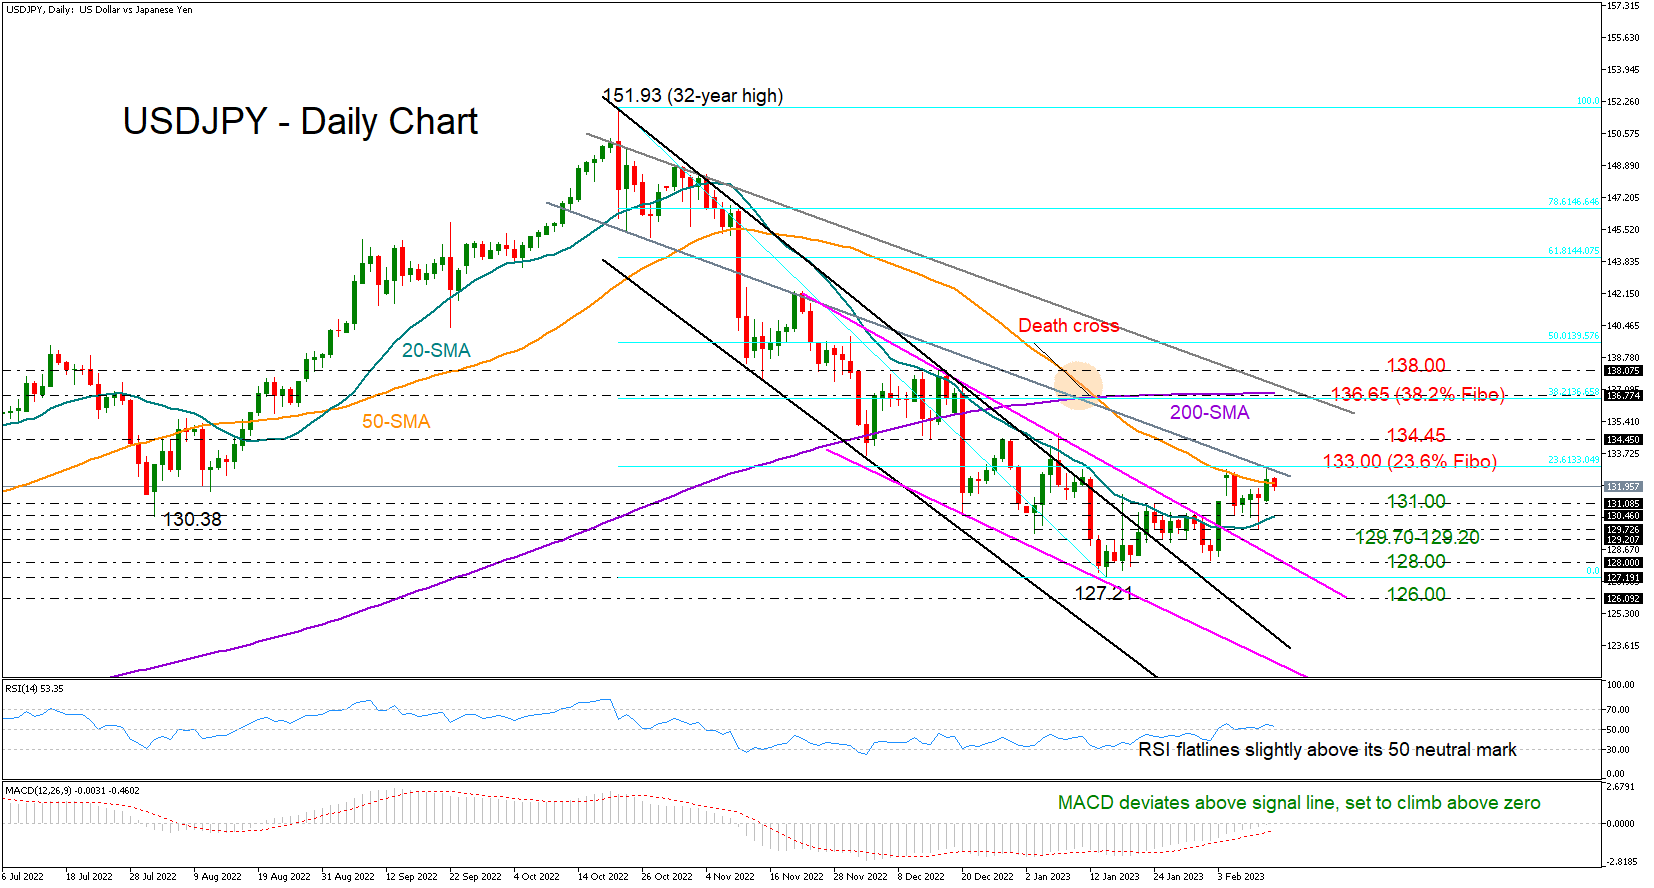
The 50-day simple moving average (SMA) is another struggle for the bulls slightly lower at 132.00, though there is a ray of hope that upside pressures may resume. Specifically, the upturn in the 20-day SMA is reflecting an improvement in short-term buying appetite, although a bullish cross with the 50-day SMA is still not in sight.
In momentum indicators, the MACD has been running northwards above its red signal line over the past three weeks, currently set to jump into the positive area. Meanwhile, the RSI keeps moving sideways marginally above its 50 neutral mark, though as long as it hovers above that threshold, upside movements are more likely than downside ones.
Nevertheless, buyers will remain patient until the pair clearly pierces through the 132.00-133.00 wall and the constraining falling line from mid-October. The 23.6% Fibonacci retracement of the 151.93-127.21 downleg is cementing that ceiling too. If that bullish scenario materializes, the pair may advance towards December’s restrictive zone of 134.45, a break of which could stage an exciting rally towards the flattening 200-day SMA and the 38.2% Fibonacci level of 136.65.
Alternatively, another close below the 50-day SMA may retest the 131.00 base and the 20-day SMA, which is currently located around August’s low of 130.38. Failure to rebound here and an extension below the 129.70-129.20 area could activate fresh selling towards the channel’s upper boundary at 128.00. Then, if January’s trough of 127.21 cracks too, the bears may chart a new lower low around 126.00.
In summary, USDJPY seems to have the support from buyers, but some caution is preserved as the pair remains capped below the 133.00 bar.
Note that US CPI inflation will be out today at 12:30 GMT.
GBPUSD Shows Some Positive Signs But Outlook Remains Neutral
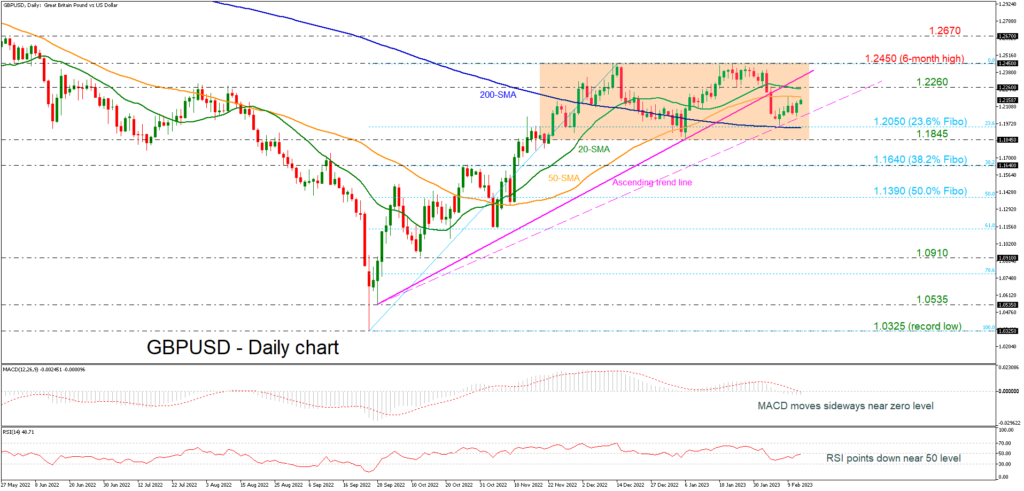
GBPUSD rebounded off the 200-day simple moving average (SMA), which overlaps with the 23.6% Fibonacci retracement level of the up leg from 1.0325 to 1.2450 at 1.2050 and also found support on a potential uptrend line. However, the market is still developing within a medium-term trading range with an upper boundary the 1.2450 resistance level and a lower boundary the 1.1845 support.
Technically, the MACD oscillator is moving sideways beneath its trigger and zero lines, while the RSI is flattening below the neutral threshold of 50. Both are mirroring the neutral bias in the price action. Also, the 20- and 50-day SMAs continue to flatten slightly above the current market price.
A move to the upside may meet resistance around the 50- and then the 20-day SMAs at 1.2190 and 1.2260 barriers respectively, ahead of the key level of 1.2450 that was tested several times in the past. The region above that area at 1.2670 could endorse the long-term bullish view.
On the other hand, immediate support to further declines may be found around the 200-day SMA at 1.2050 and even lower at 1.1845. If the bears take the upper hand and send the market lower, the 38.2% Fibonacci at 1.1640 may halt the negative moves ahead of the 50.0% Fibonacci of 1.1390.
Overall, both the short- and medium-term outlooks are currently looking neutral, though caution is warranted in the near-term as there are signs of an upside recovery. A climb above the six-month peak of 1.2450 is needed to confirm that.