

Sample Category Title
USD/JPY: Bearish Triple Zigzag Pattern Likely to Complete Near 121.66
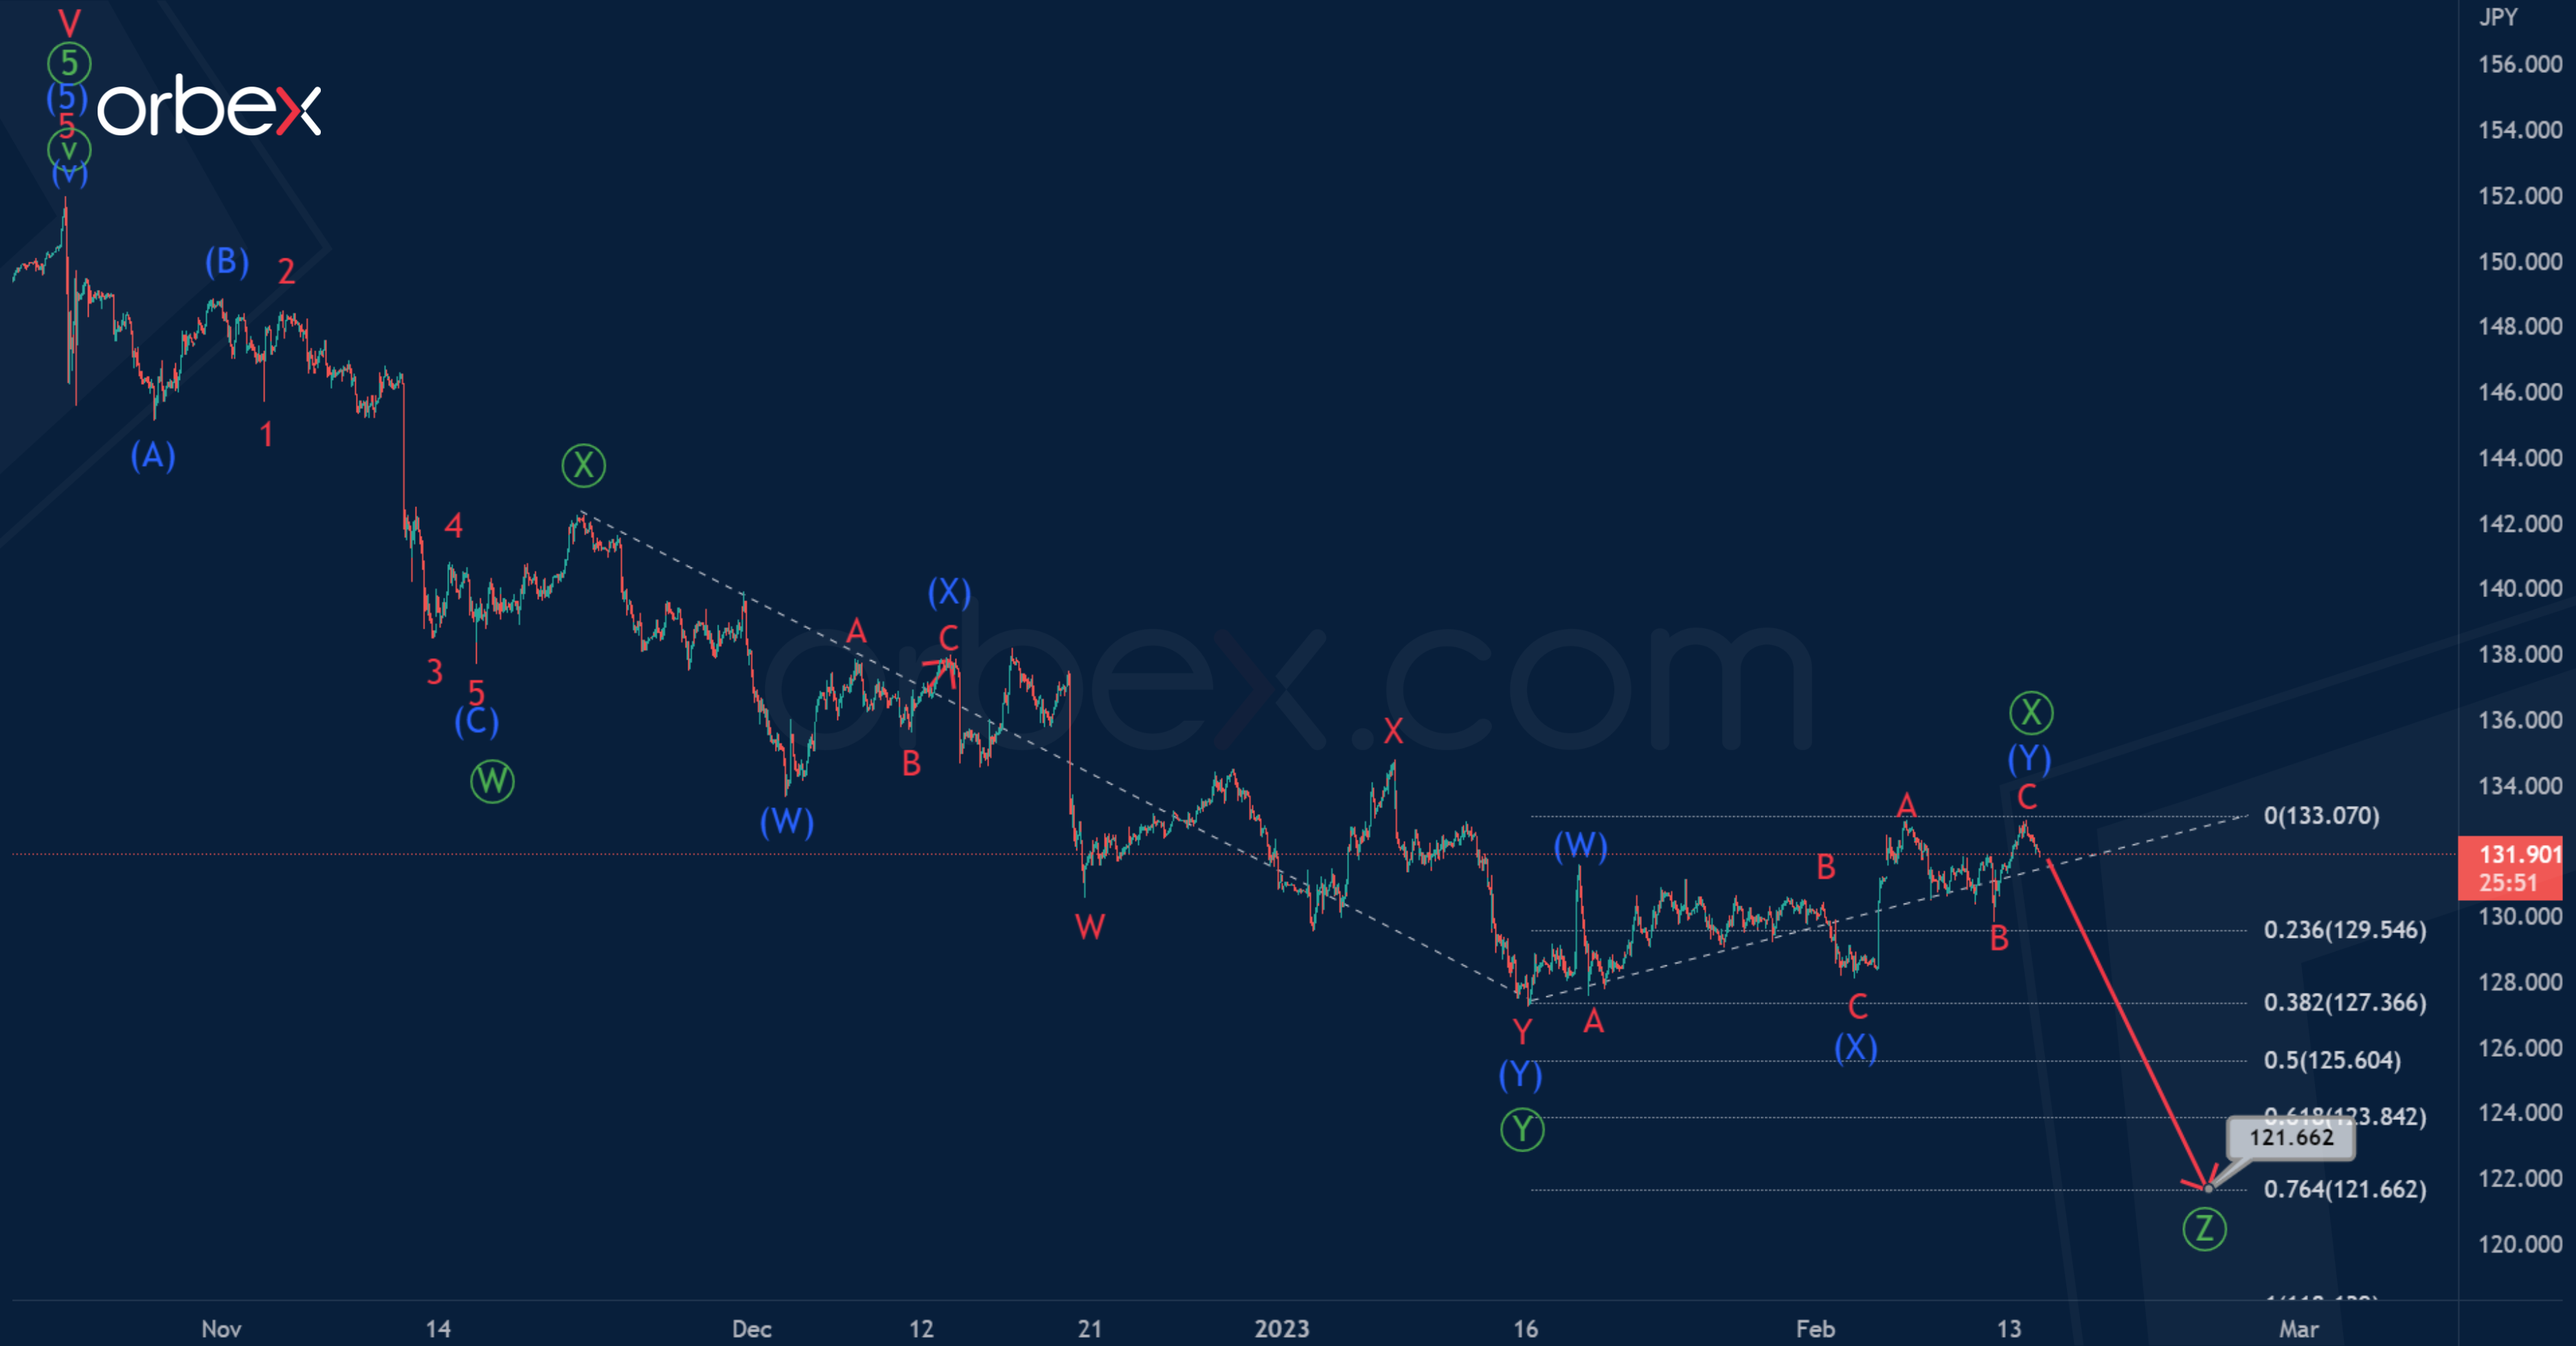
The current USDJPY structure shows the formation of a bearish trend, which takes the form of a triple zigzag of the primary degree. It is possible that the sub- waves have been completed to date.
However, the second intervening wave looks like a fully completed double zigzag consisting of intermediate sub-waves (W)-(X)-(Y), so it can be considered complete.
Thus, in the near future, a fall in the wave may begin towards 121.66. At that level, wave will be at 76.4% of wave.
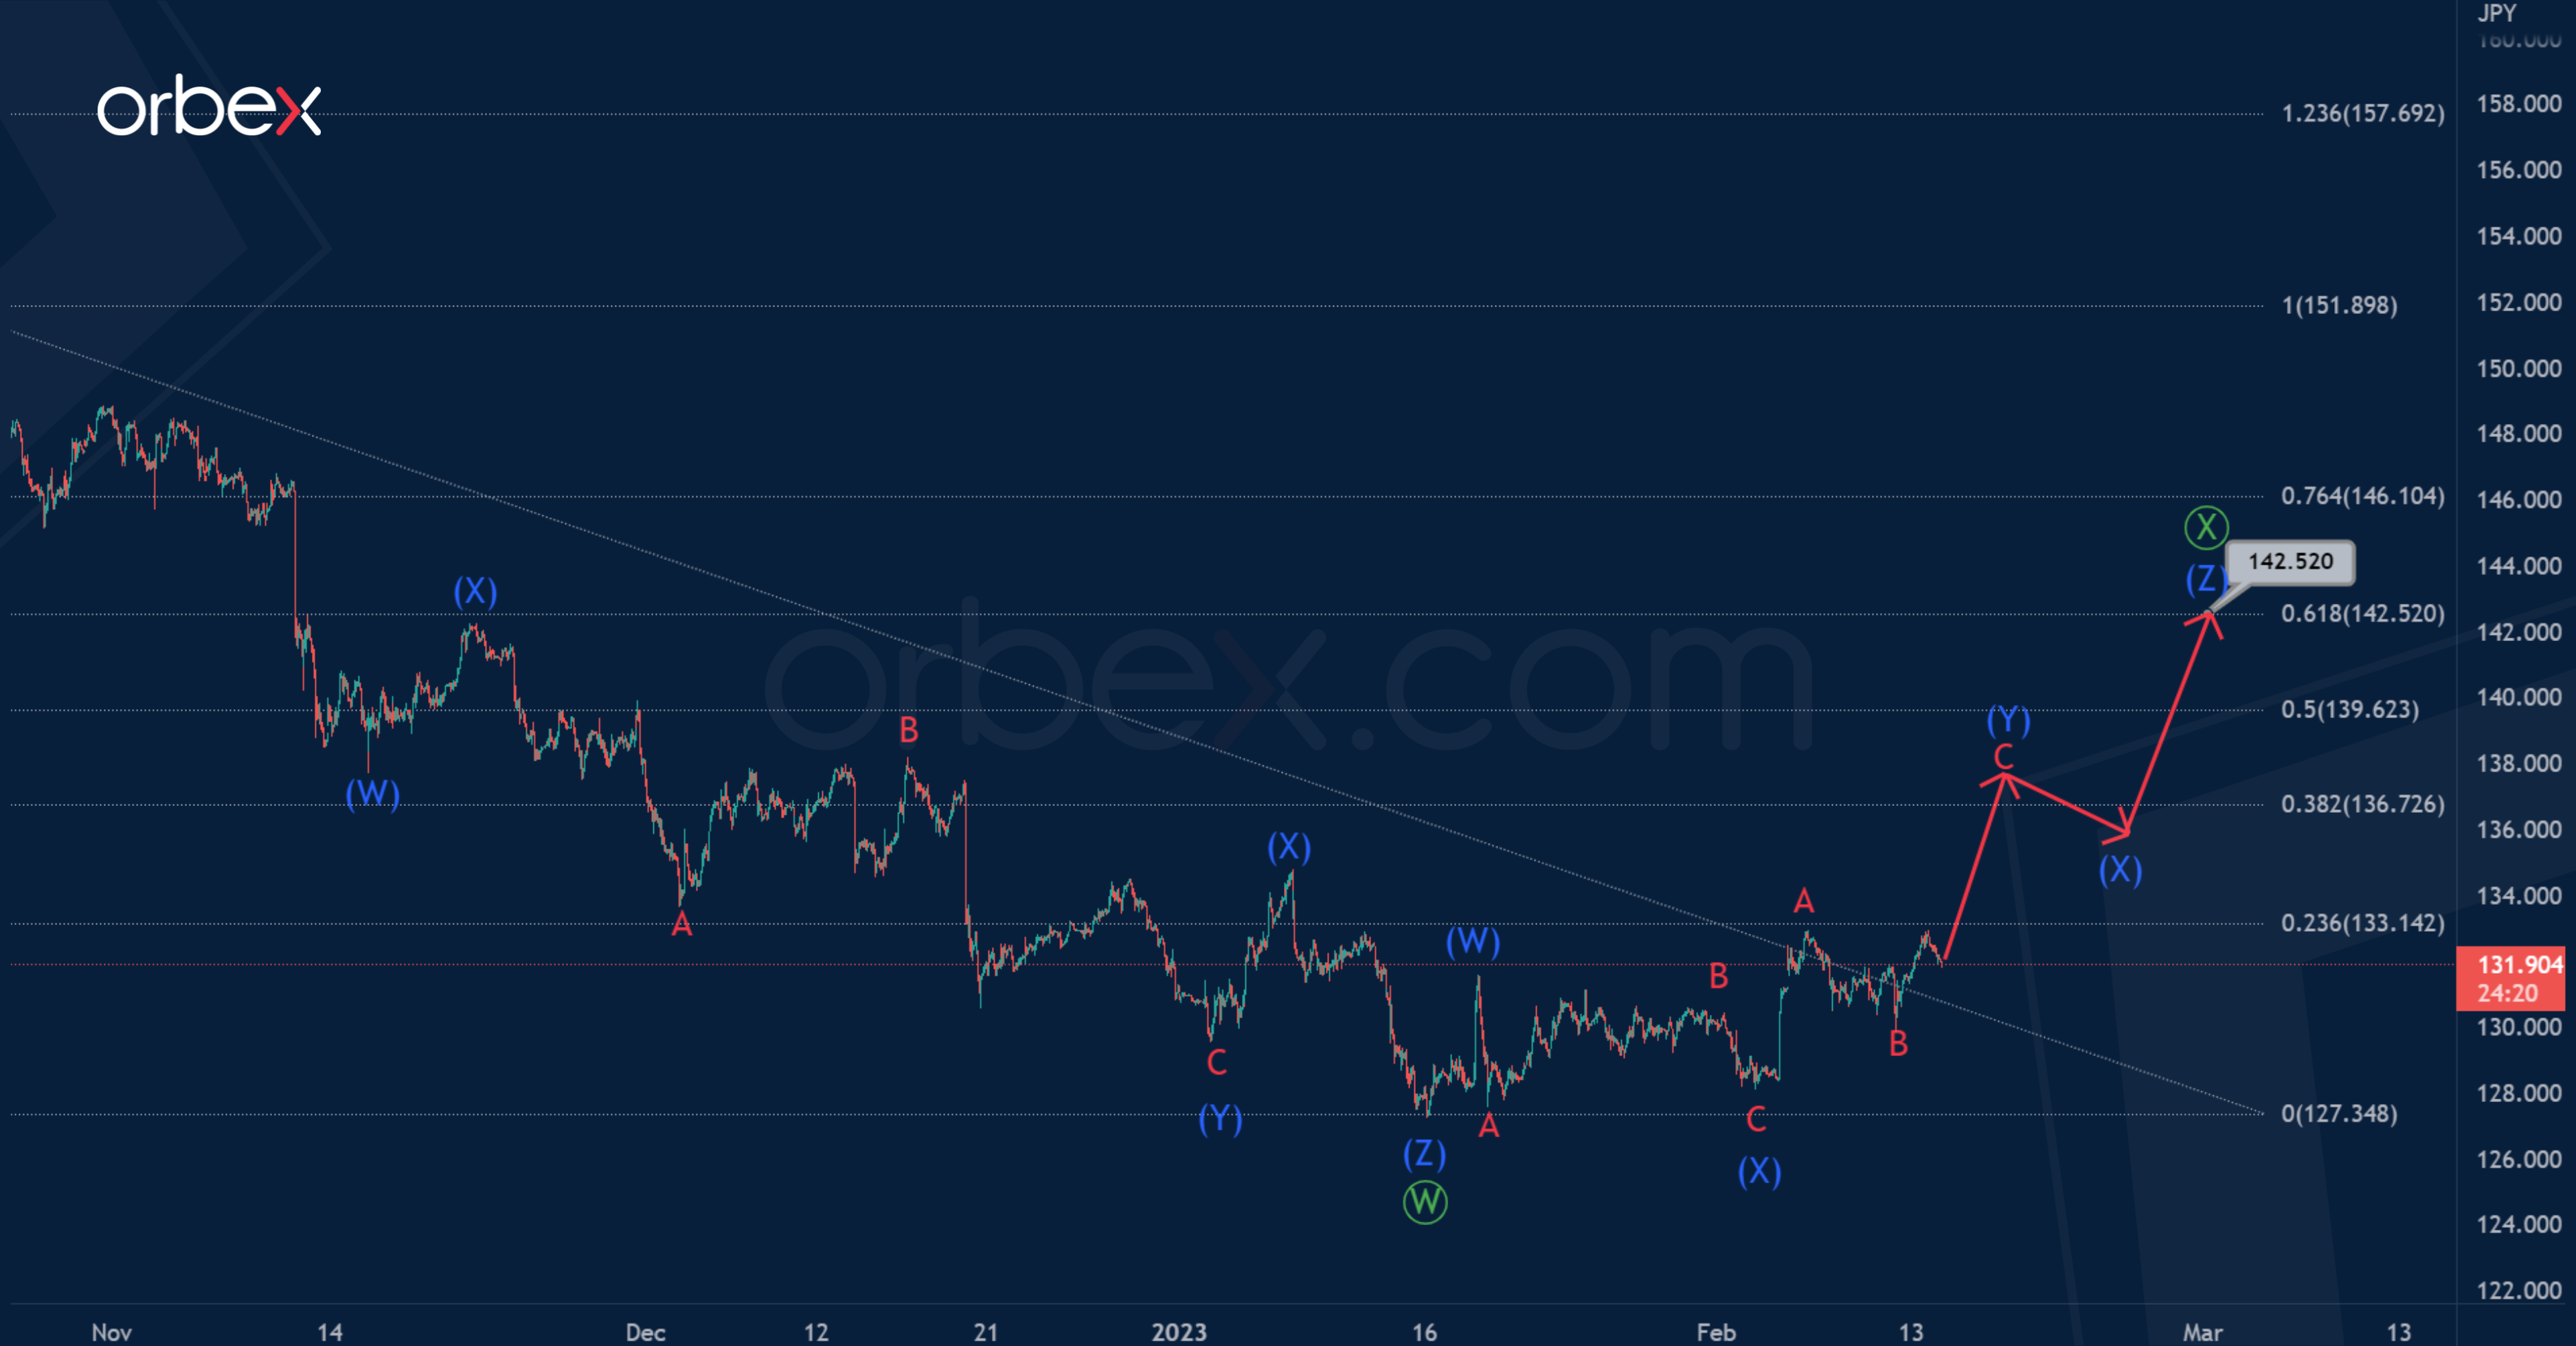
In an alternative scenario, within the bearish double zigzag, only the first actionary wave is completed, and the intervening wave is still under development.
It is possible that in the near future the growth will continue in the wave towards 142.52. The intervening wave may take the form of a triple zigzag (W)-(X)-(Y)-(X)-(Z), as shown on the chart.
Dow Jones 30 Tests Supply Area
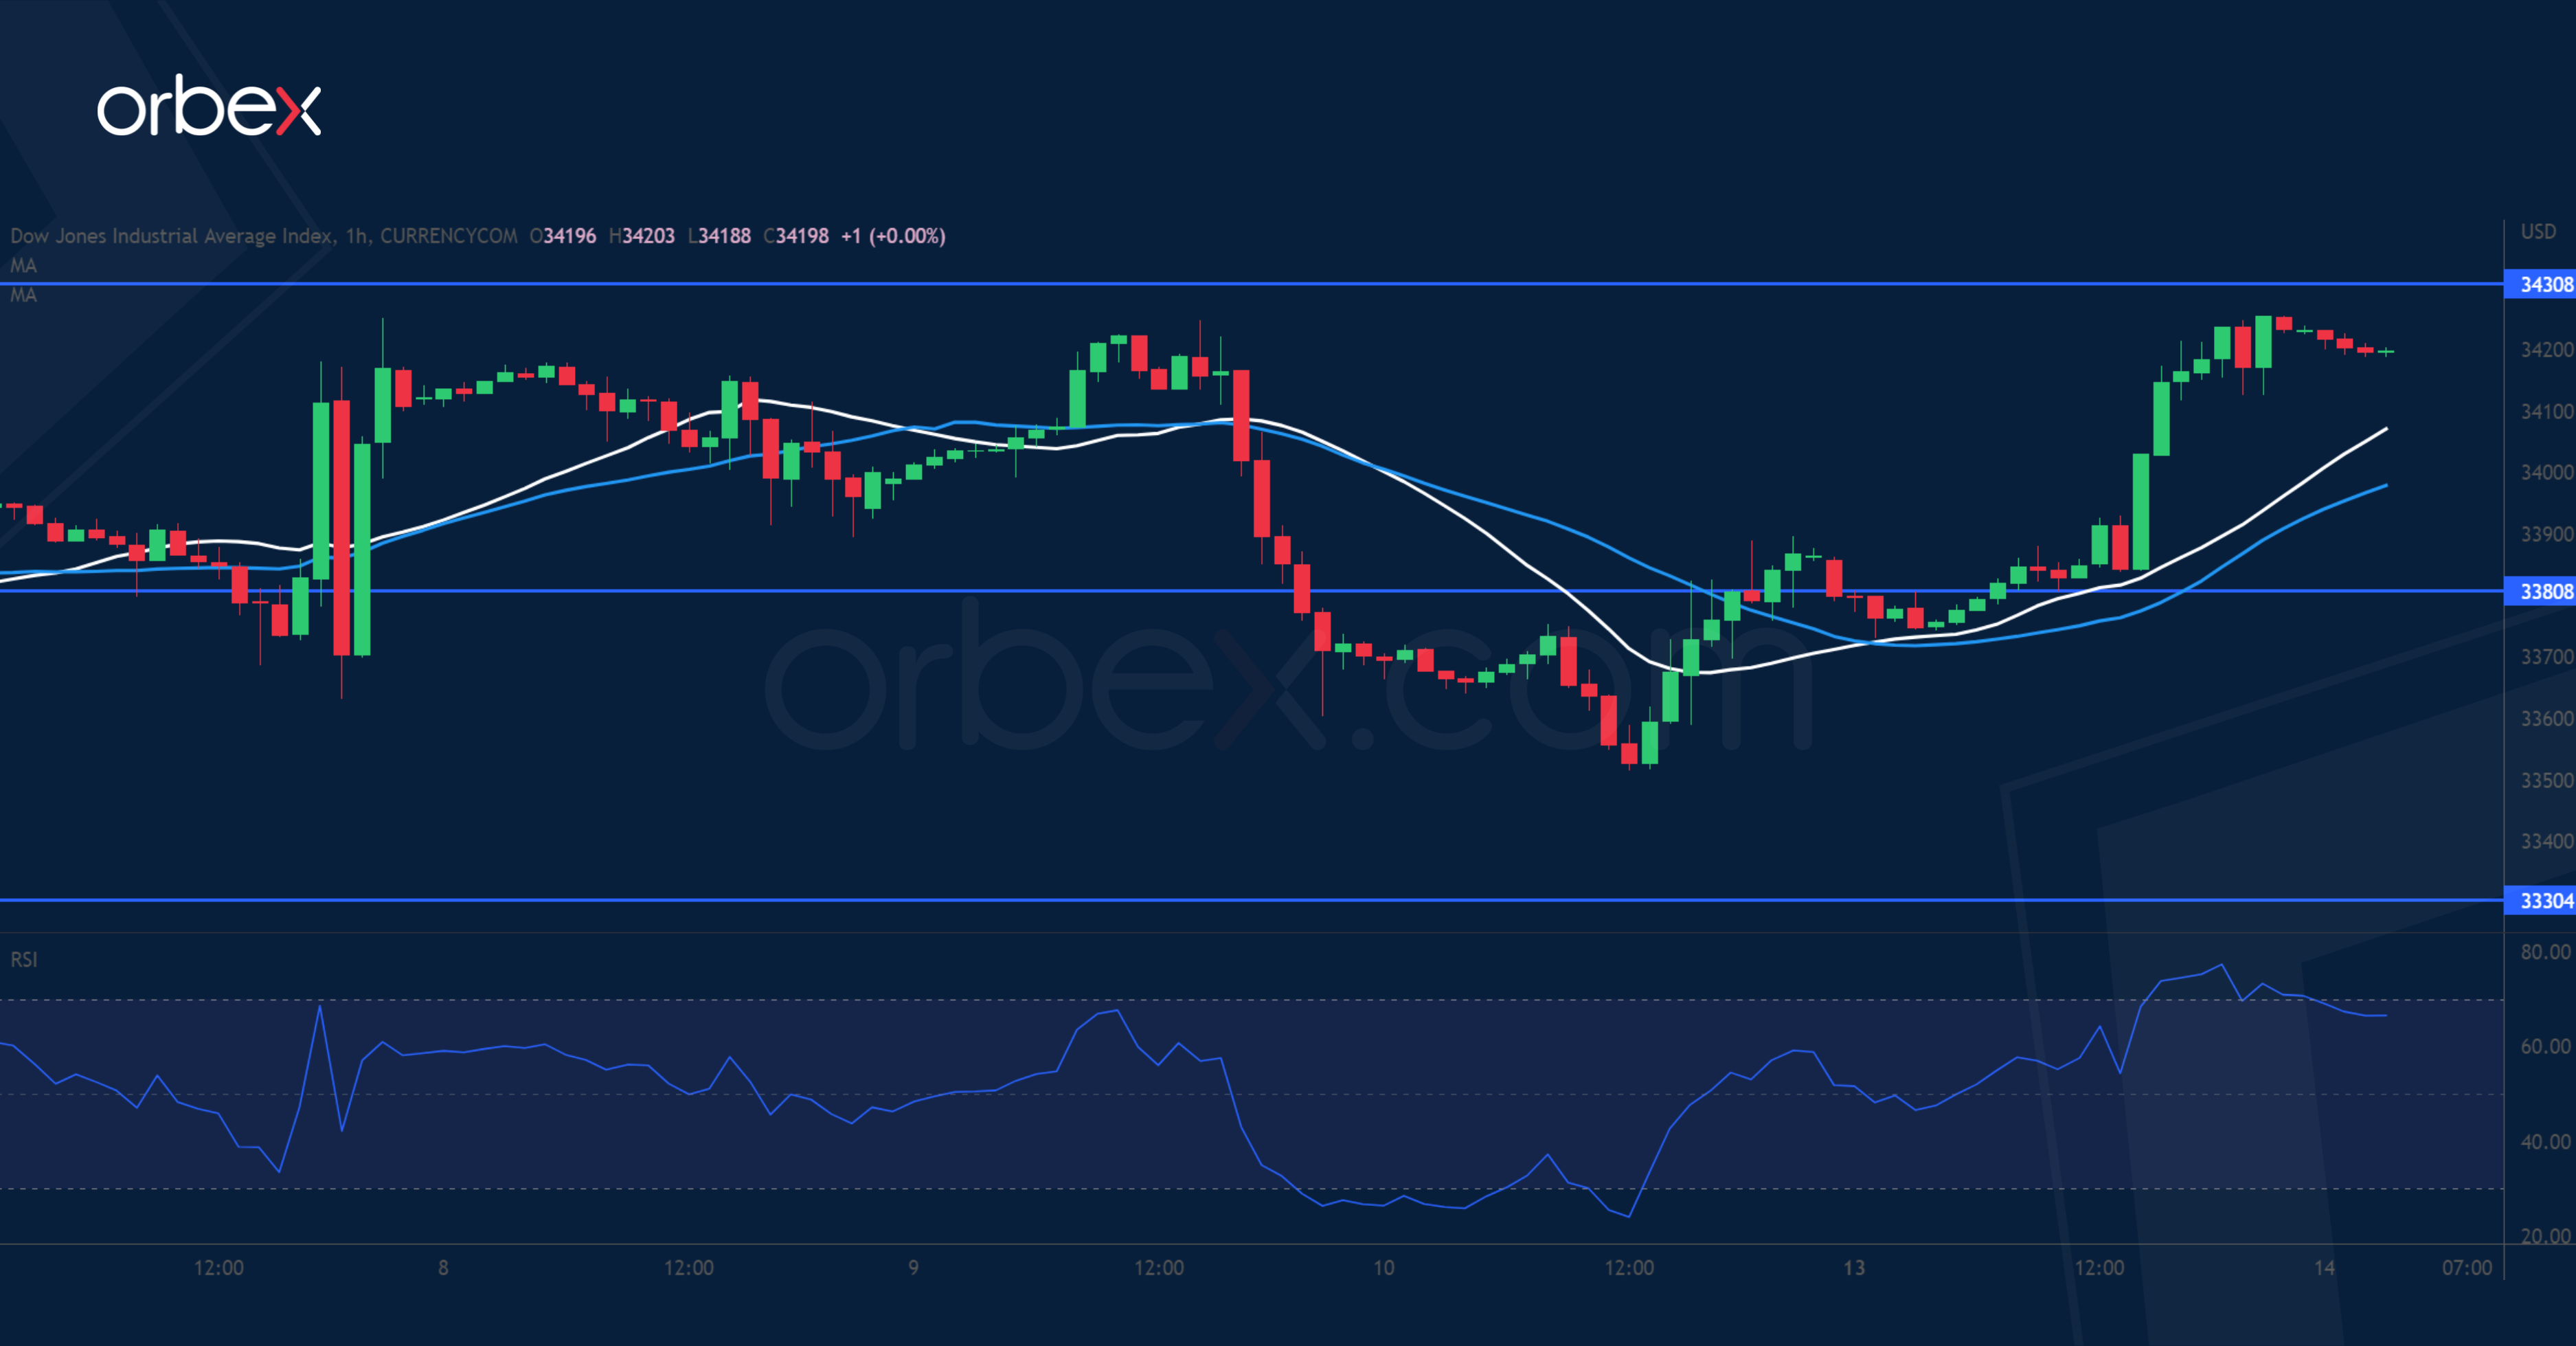
The Dow Jones 30 steadies as investors reposition ahead of January’s CPI reading. On the daily chart, the index is consolidating its gains in a triangle pattern. Despite a choppy price action, the general direction still tilts to the upside as pullbacks have been brief. The supply zone around 34300 has kept the bulls in check but its breach would force the bears to throw in the towel and open the door to an extended rally to last December’s peak at 34900. 33800 is a fresh support in case the bulls need to gather strength.
EUR/AUD Grinds Support
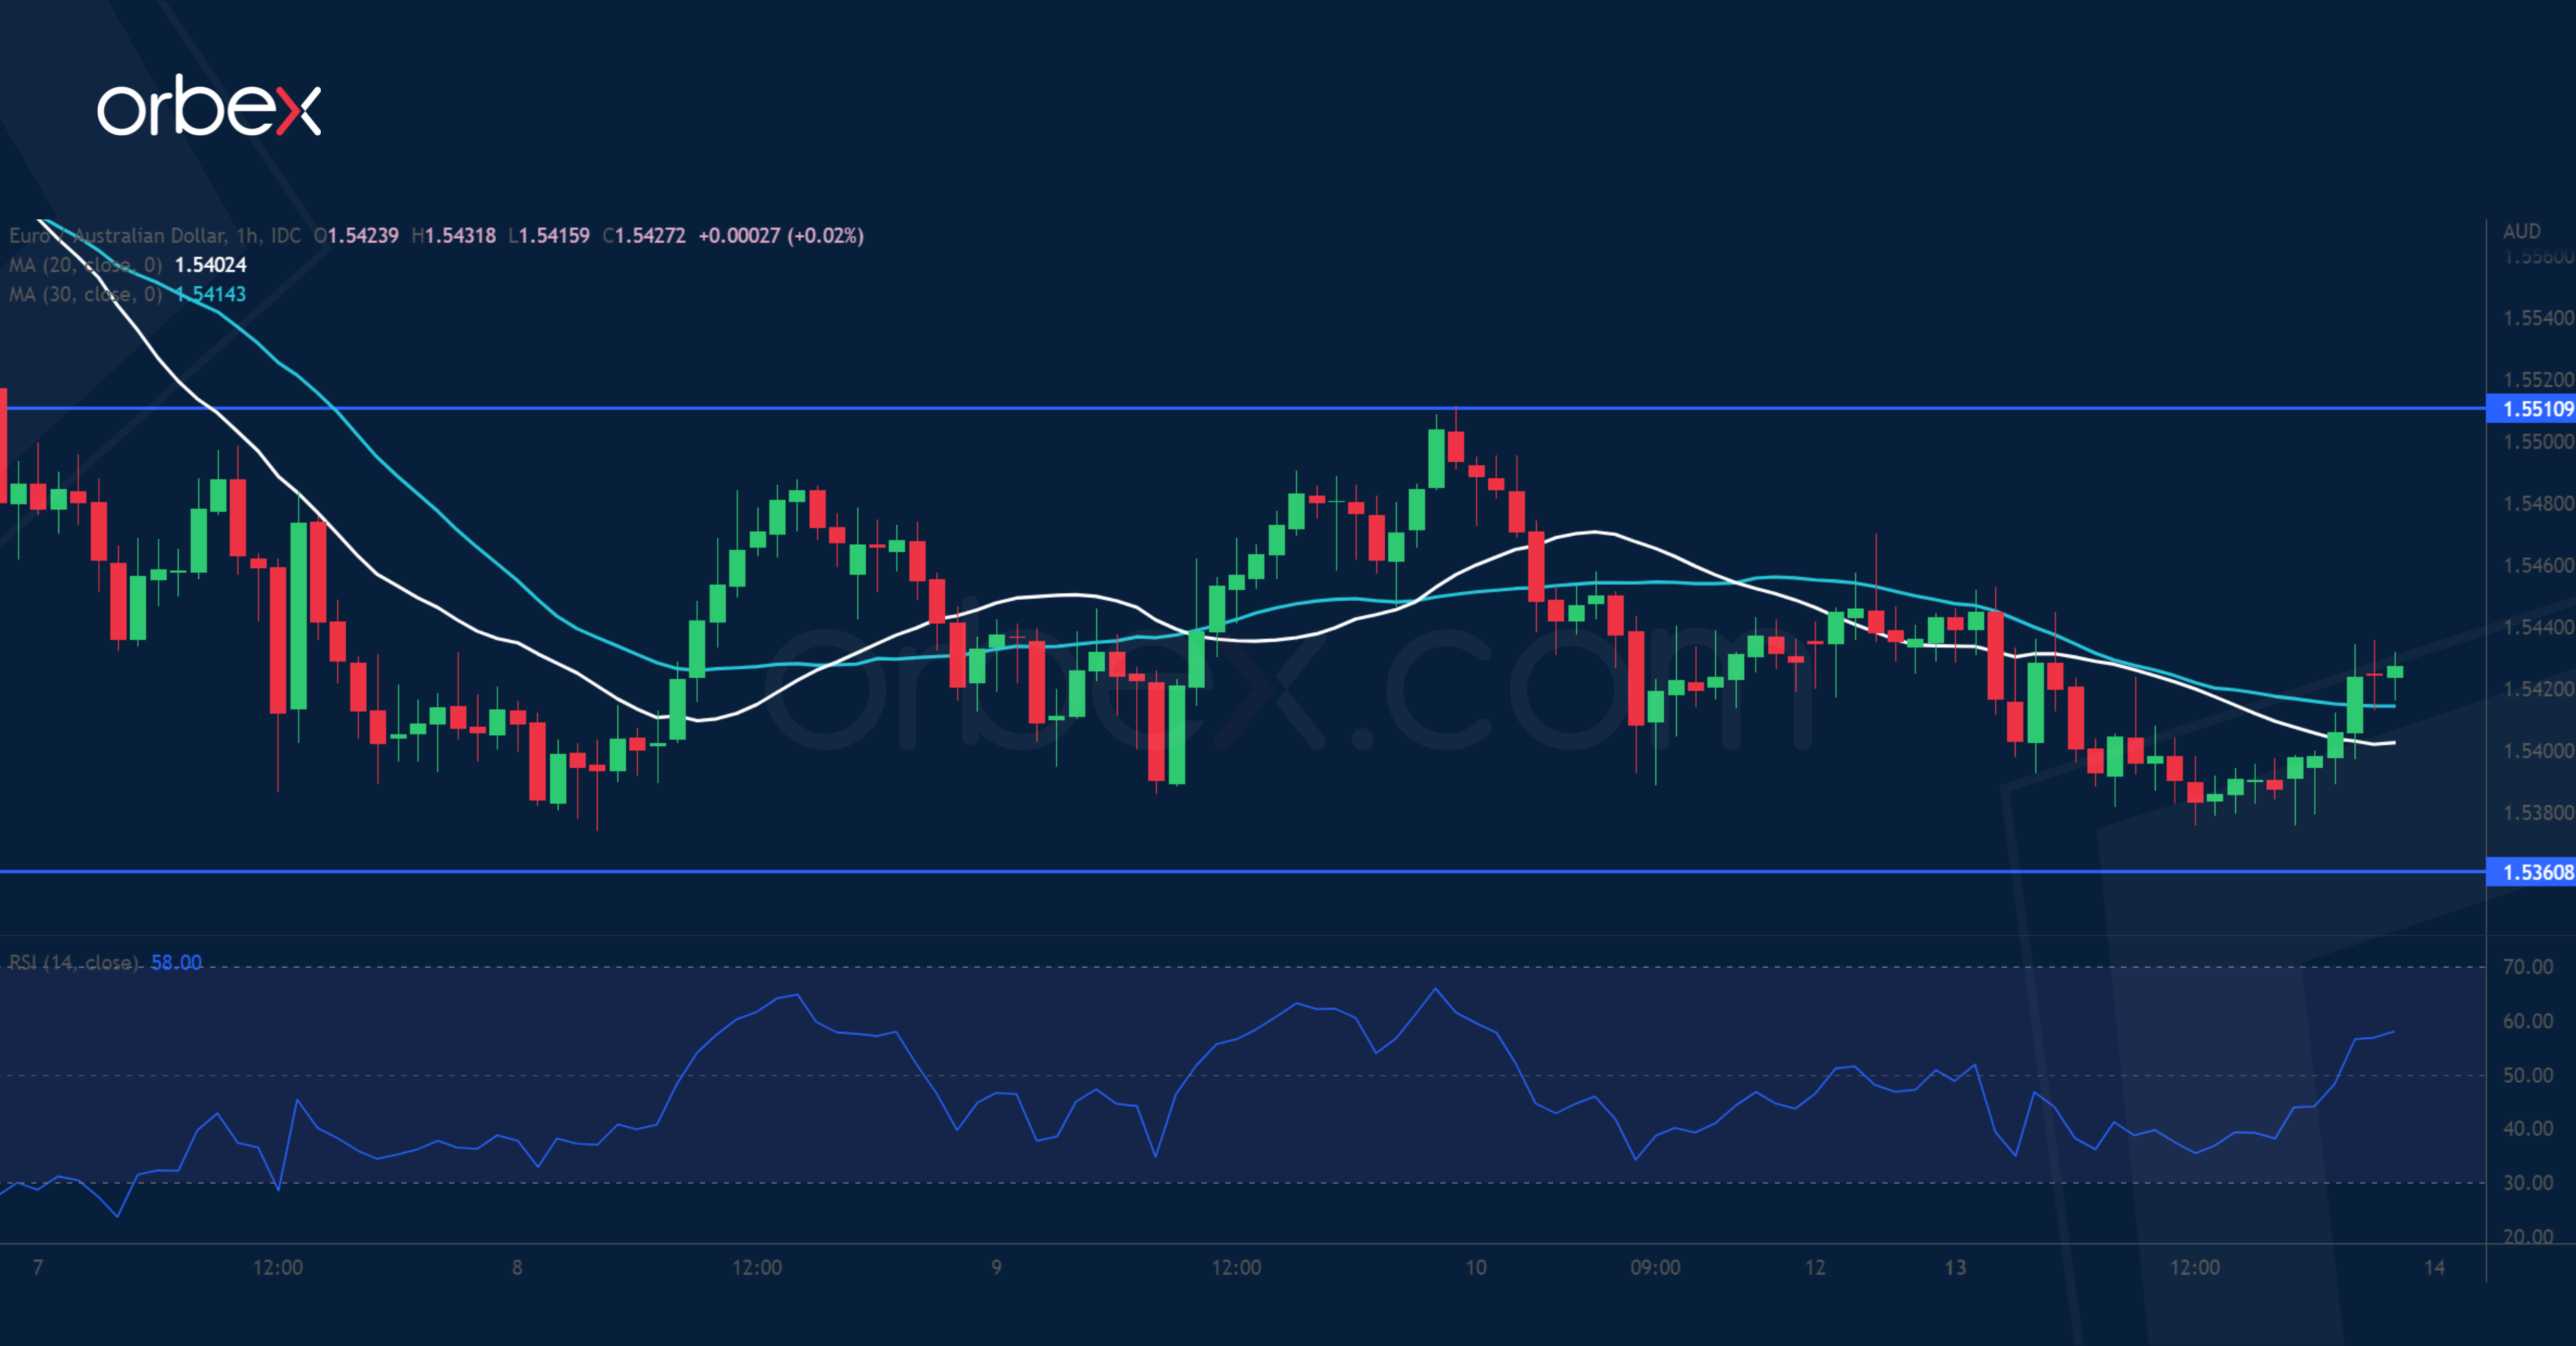
The Australian dollar holds strong as markets remain risk-on. On the daily time frame, a close below last November’s consolidation zone at 1.5300 has put the bulls on the defensive. A previous rebound came to a halt at 1.5650, suggesting a strong downward pressure. The single currency is treading water above 1.5360 and its breach would expose the floor at 1.5270 where a bearish breakout could trigger a sell-off towards 1.5000. On the upside, stiff selling could be expected in the supply zone between 1.5510 and 1.5560.
USD/JPY Tests Resistance
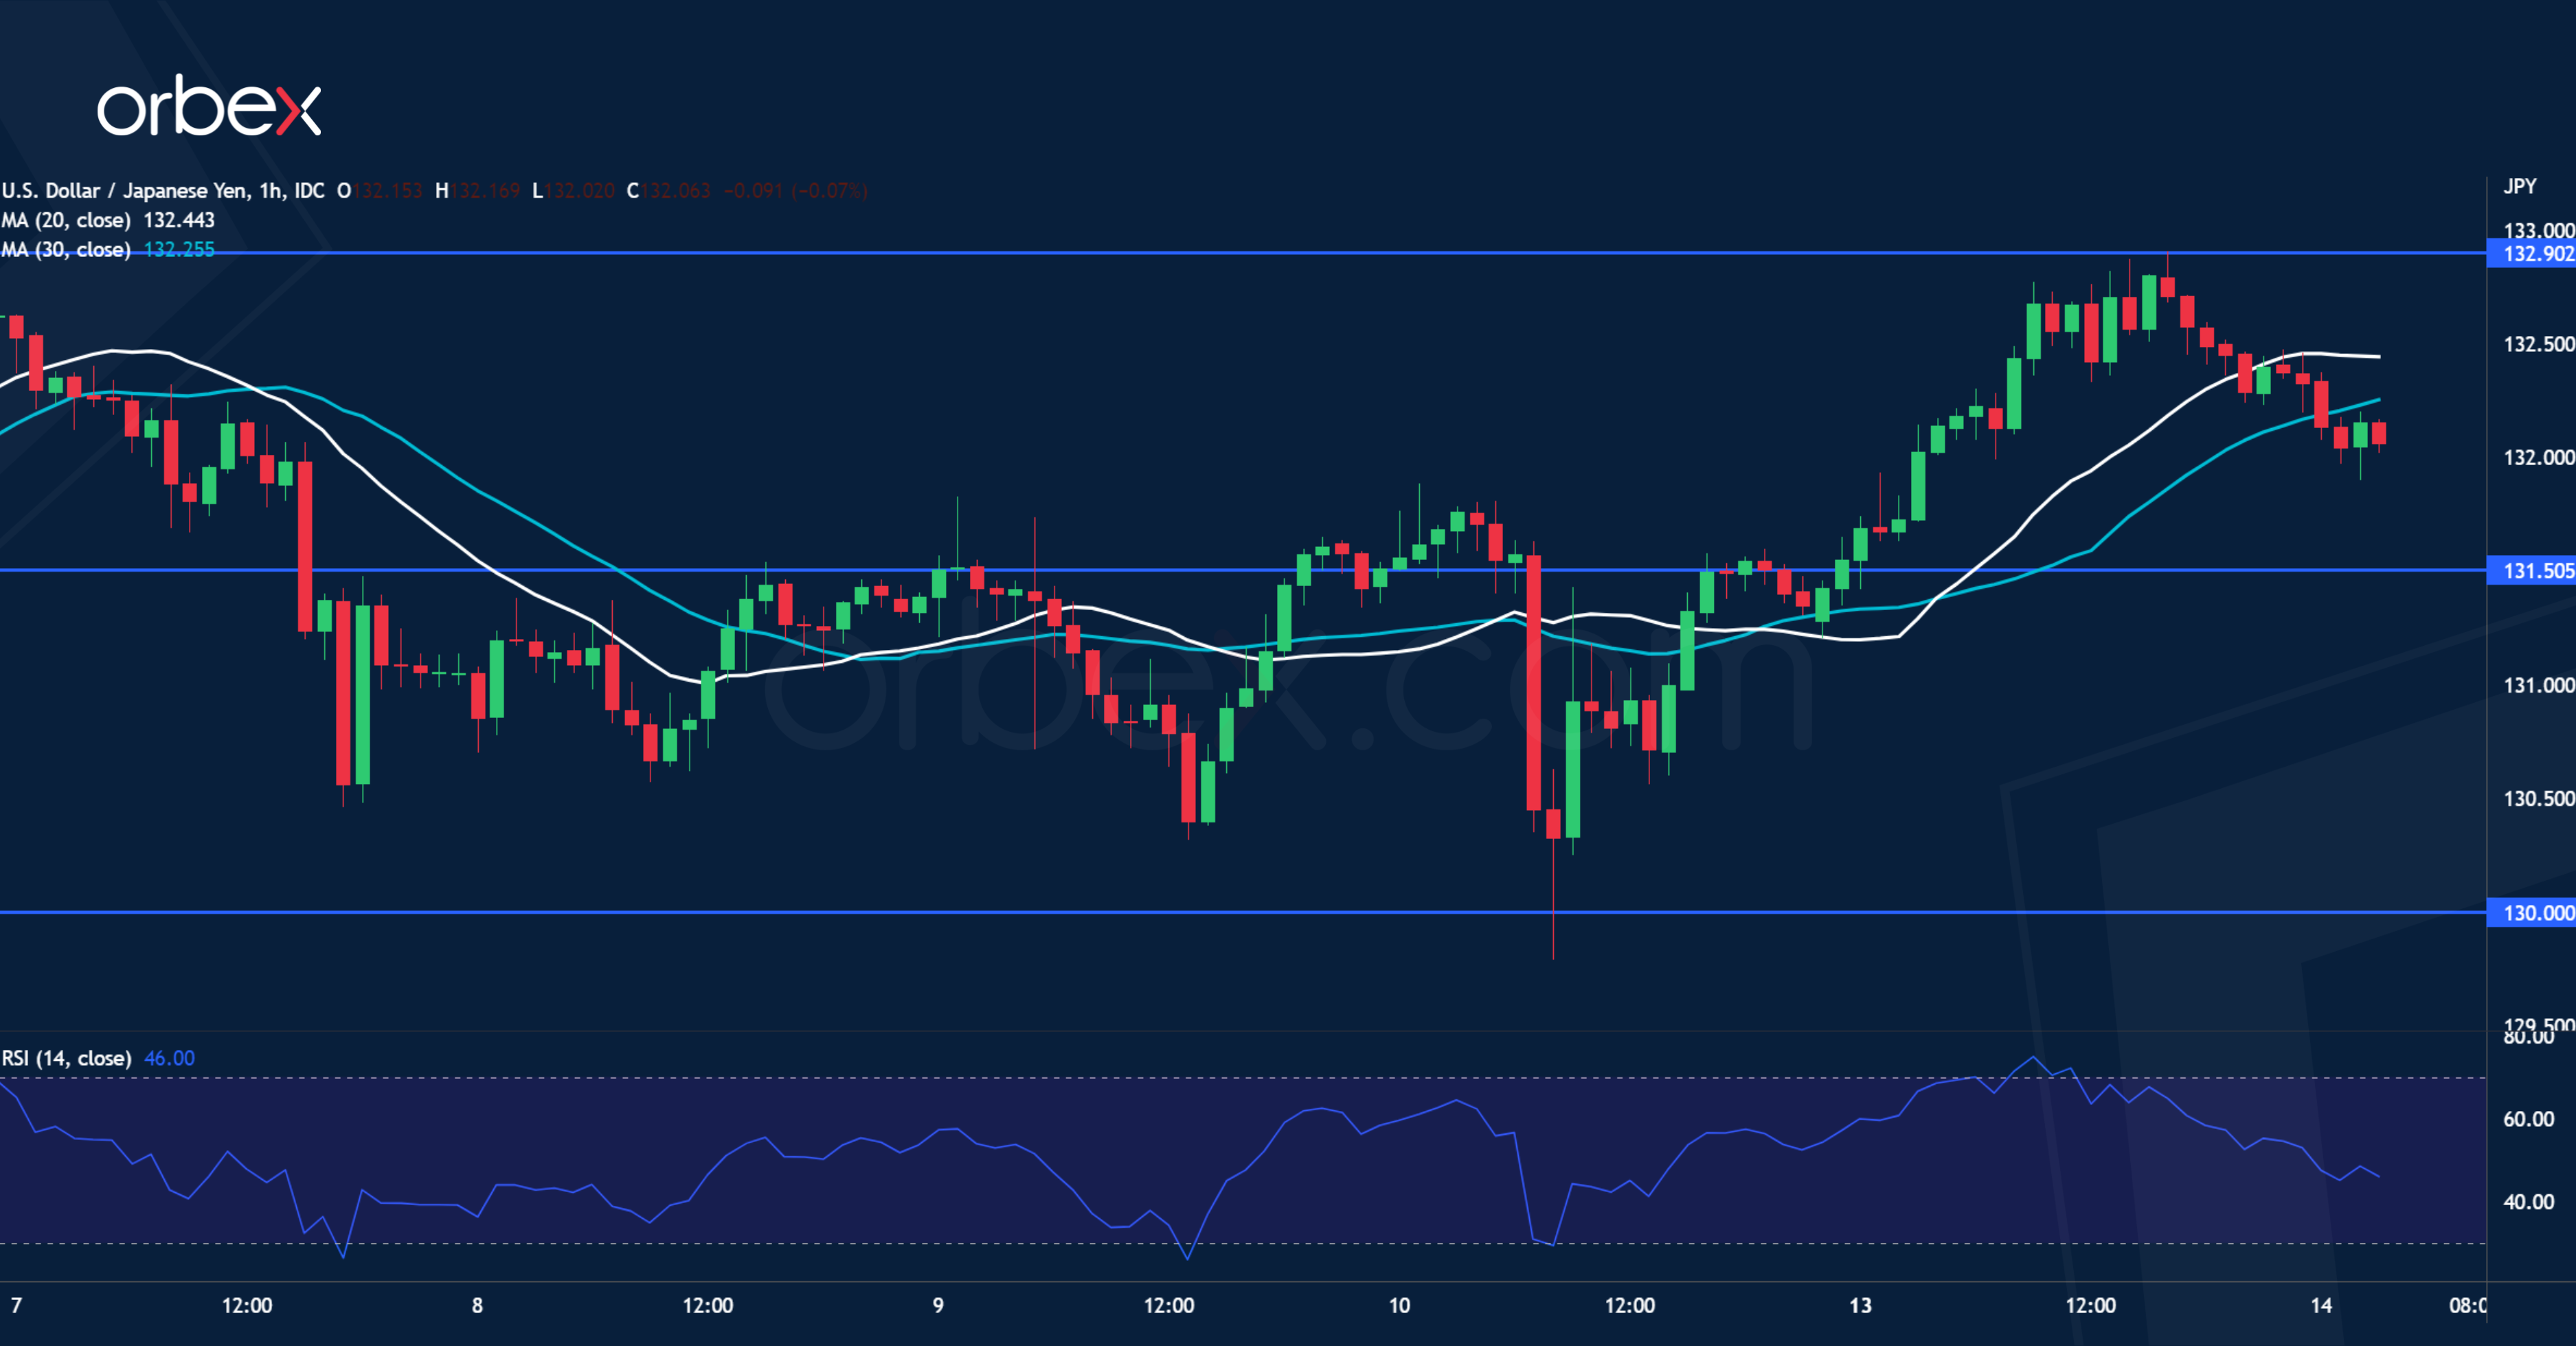
The Japanese yen struggled as the Q4 GDP fell short of expectations. The pair’s latest retracement found support over the psychological level of 130.00 which coincides with a resistance level from a previous swing low. A subsequent break above 131.80 indicates solid commitment from the buy side. A close above 132.90 would attract momentum buyers and send the pair to the daily resistance at 134.70. An overbought RSI has tempered the bounce and 131.50 is a key level to keep the optimism going in the short-term.
GBP/JPY Daily Outlook
Daily Pivots: (S1) 159.04; (P) 160.11; (R1) 161.84; More...
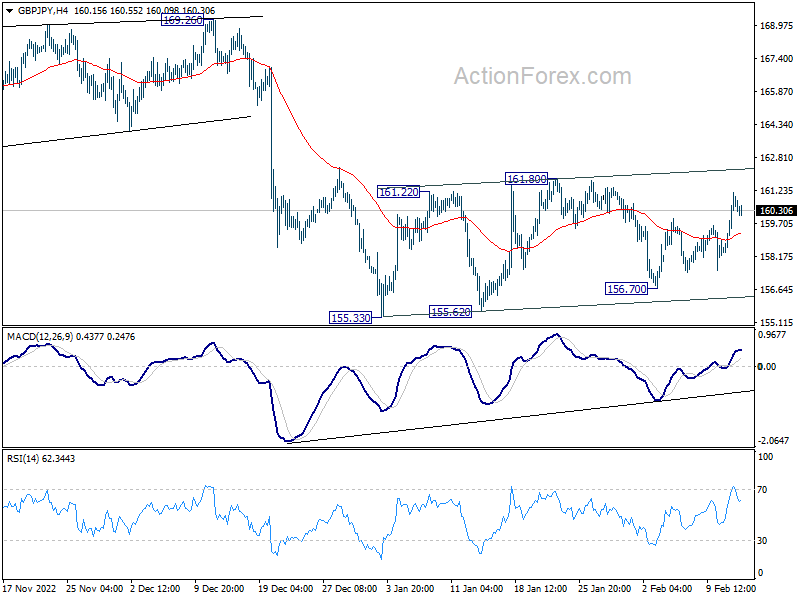
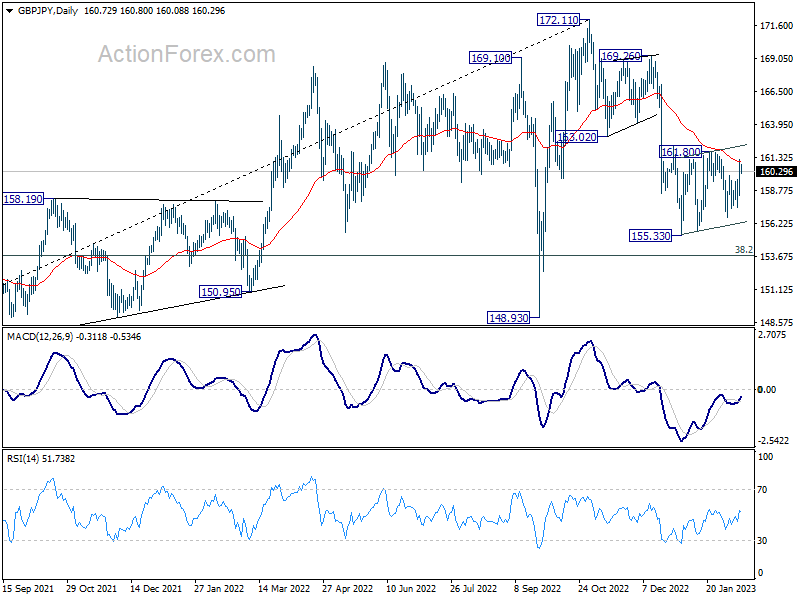
Intraday bias in GBP/JPY remains neutral for the moment. Further decline is mildly in favor. On the downside, break of 155.33 low will resume the fall from 172.11 to 153.70 fibonacci level next. On the upside, sustained trading above 55 day EMA (now at 160.99) will turn bias to the upside, for stronger rise back to 169.26/172.11 resistance zone.
In the bigger picture, as long as 163.02 support turned resistance holds, decline from 172.11 medium term top is expected to continue to 38.2% retracement of 123.94 to 172.11 at 153.70. Sustained break there will raise the change of trend reversal and target 61.8% retracement at 142.34. Nevertheless, break of 163.02 support turned resistance will argue that the decline has completed, and retain medium term bullishness.
EUR/JPY Daily Outlook
Daily Pivots: (S1) 140.70; (P) 141.54; (R1) 142.87; More....
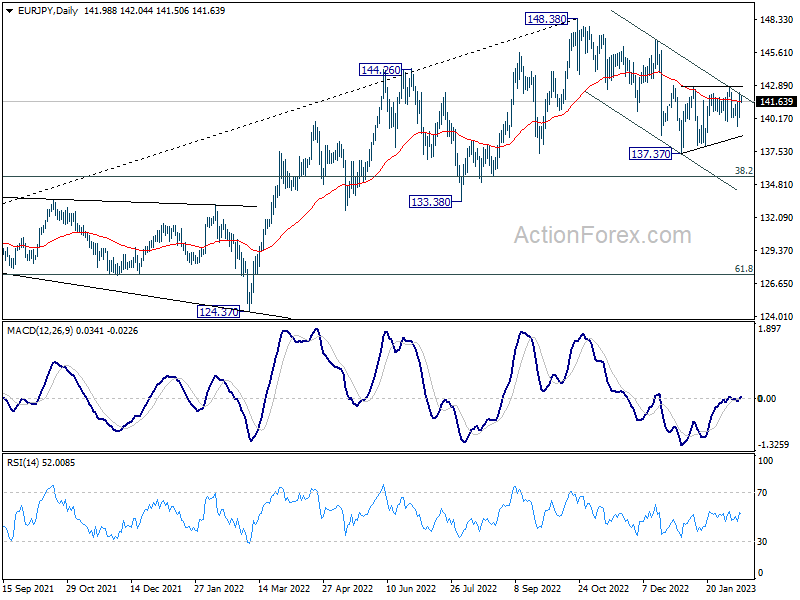
Intraday bias in EUR/JPY stays neutral at this point. Further decline is mildly in favor. Break of 137.37 will resume the whole fall from 148.38 to 135.40 fibonacci level. On the upside, however, break of 142.84 will argue that the correction from 148.38 has completed at 137.37 already. Further rise would be seen to 146.71 resistance next.
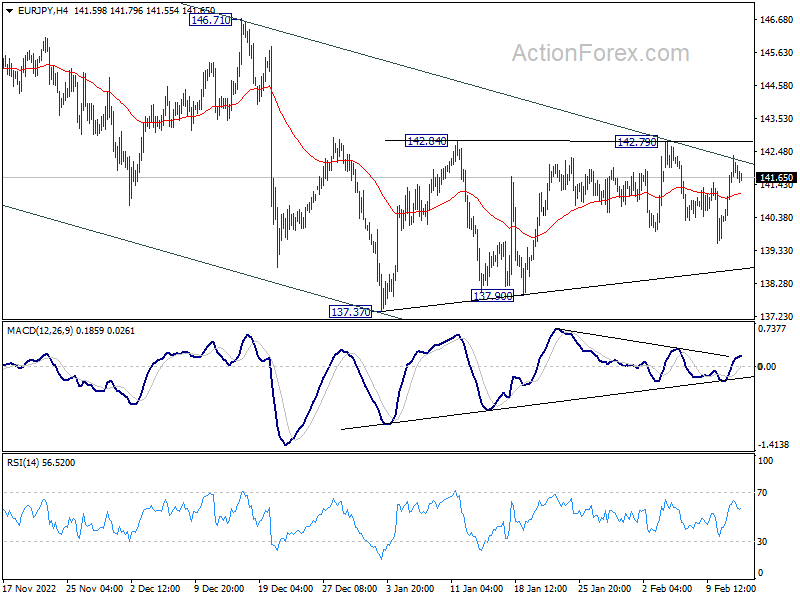
In the bigger picture, as long as 55 week EMA (now at 138.87) holds, larger up trend from 114.42 (2020 low) is still in progress for 149.76 long term resistance. However, firm break of 55 week EMA will bring deeper fall to 38.2% retracement of 114.42 to 148.38 at 135.40. Sustained break there will raise the chance of trend reversal, and target 61.8% retracement at 127.39.
EUR/GBP Daily Outlook
Daily Pivots: (S1) 0.8814; (P) 0.8844; (R1) 0.8865; More...
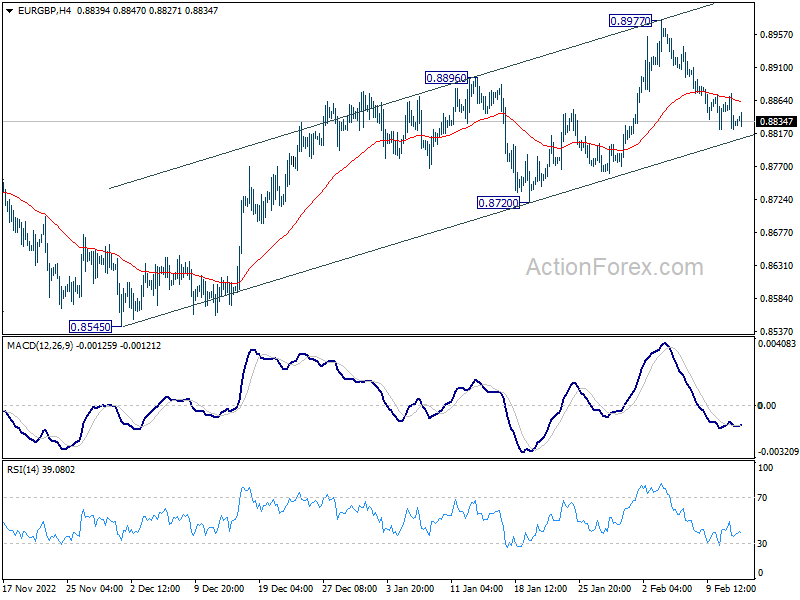
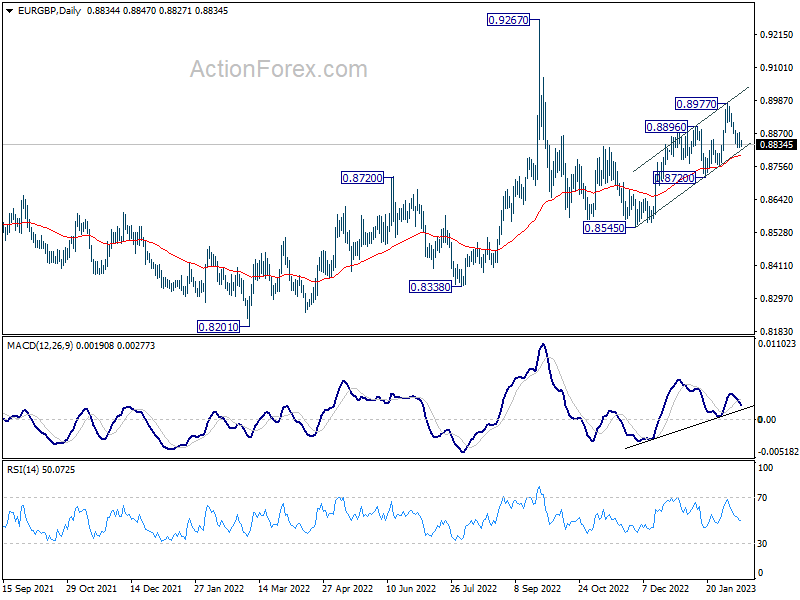
Intraday bias in EUR/GBP remains neutral and outlook is unchanged. Further rally is expected as long as 0.8720 support holds. On the upside, break of 0.8977 will resume whole rebound from 0.8545 towards 0.9267 high. On the downside, however, break of 0.8270 will turn near term outlook bearish again.
In the bigger picture, the notable support from 55 day EMA (now at 0.8780) retains near term bullishness. Break of 0.8896 should target 0.9267 (2022 high) and possibly above, to resume whole up trend from 0.8201 (2022 low). However, break of 0.8270 support and sustained trading below 55 day EMA will set the stage for 0.8545 and below.
EUR/AUD Daily Outlook
Daily Pivots: (S1) 1.5360; (P) 1.5416; (R1) 1.5453; More...
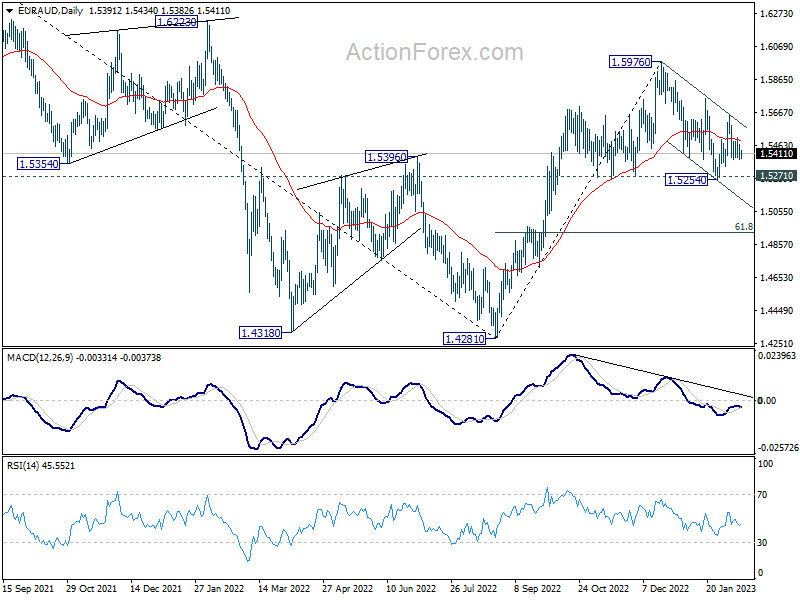
Intraday bias in EUR/AUD stays neutral and outlook is unchanged. On the downside, firm break of 1.5254/71 will carry larger bearish implication and resume the fall from 1.5976. On the upside, above 1.5650 will resume the rebound to 1.5749 resistance.
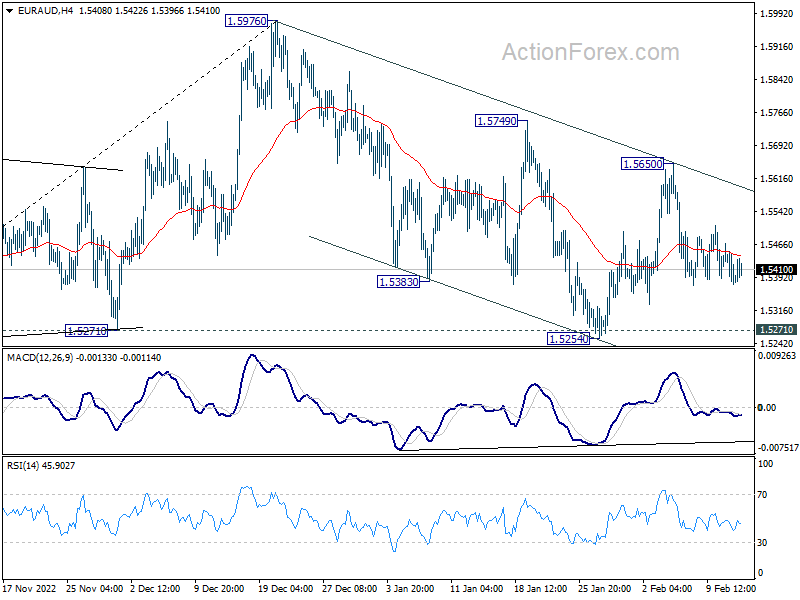
In the bigger picture, it's still early to confirm if rise from 1.4281 represents bullish trend reversal. But as long as 1.5271 support holds, such rally is in favor to continue. Break of 1.5976 will target 1.6434 key resistance next. On the other hand, firm break of 1.5271 will retain medium term bearishness instead.
EUR/CHF Daily Outlook
Daily Pivots: (S1) 0.9846; (P) 0.9862; (R1) 0.9877; More....
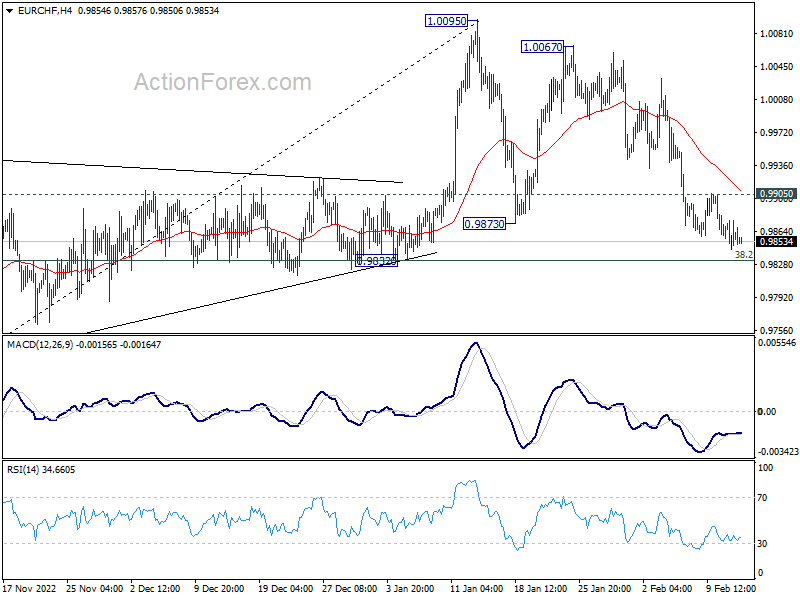
No change in EUR/CHF's outlook as fall from 1.0067 could extend lower. But downside should be contained by 38.2% retracement of 0.9407 to 1.0095 at 0.9832 to complete the corrective pattern from 1.0095. On the upside, break of 0.9905 minor resistance will turn bias back to the upside for 1.0067/95 resistance zone. However, sustained break of 0.9832 will carry larger bearish implications.
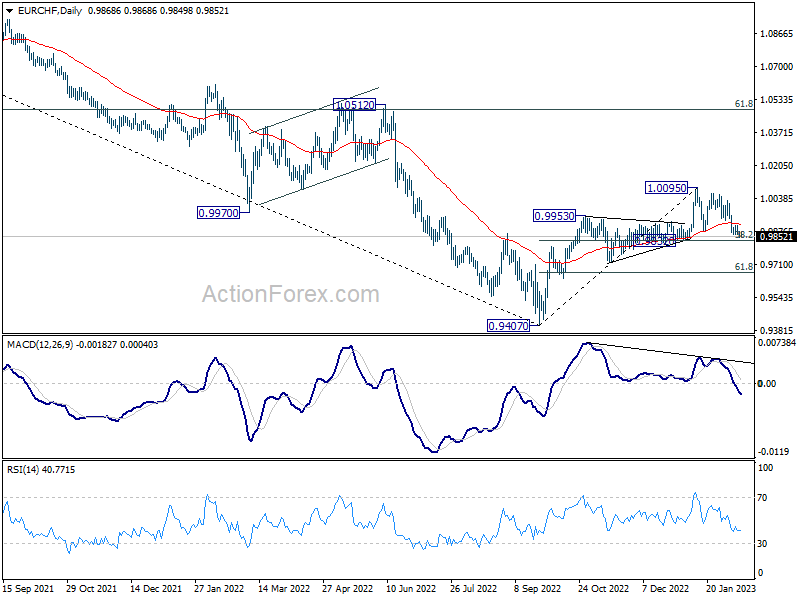
In the bigger picture, the rejection by 55 week EMA (now at 1.0025) mixed up the outlook. On the upside, sustained trading above 55 week EMA will raise the chance of bullish trend reversal. Rise from 0.9407 should then target 1.0505 cluster resistance (2020 low at 1.0505, 61.8% retracement of 1.1149 to 0.9407 at 1.1484). However, firm break of 0.9832 support will revive medium term bearishness and bring retest of 0.9407 low instead.
Today It’s All Counting Down to this Afternoon’s US January CPI Report
Markets
Upcoming key US inflation data didn’t prevent a constructive start to the new trading week. Equities gradually gained traction during European and US dealings. The economic forecasts of the European Commission lowered this and next year’s inflation outlook to 5.9% (from 6.1%) and 2.5% (from 2.6%). 2023 growth was upwardly revised to 0.9% from 0.3%. Lower inflation and higher growth evidently are good news for risk assets, but the revision was no big surprise. Still the Euro Stoxx 50 gained 1.03%. US indices closed higher between 1.1% (Dow) and 1.4% (Nasdaq). Bond markets showed a mixed picture. In the end, the US curve again inverted further with the 2-y yield unchanged but the 30-y ceding 4.3 bps. German short term yields (2y & 5y) added about 2 bps. Longer maturities were little changed. On FX markets, the dollar struggled as risk sentiment stayed mild. DXY failed to try a new attack on last week’s 103.96 correction top (close 103.34). USD/JPY closed at 132.41 (from 131.28), but this was mainly yen weakness as markets scaled back expectations for a real hawkish BoJ policy change under new governor Ueda.After setting a new ST correction low early in the session, EUR/USD also captured a better bid in line with equities to close the day at 1.0723. EUR/GBP declined quite sharply intraday. The pair tested last week’s low near EUR/GBP 0.8825, but a break didn’t occur (close 0.8836).
This morning, Asian equites again underperform compared to the US and Europe yesterday (gains of <1.0%, China little changed). US yields are easing marginally and so does the dollar (DXY 103.15; USD/JPY 132.0; EUR/USD 1.0735). Of course, today it’s all counting down to this afternoon’s US January CPI report. The monthly dynamics for headline CPI is expected to reaccelerate to 0.5% (from 0.1%) bringing the Y/Y measure at an expected 6.2% (from 6.5%). Core inflation is expected at 0.4% M/M and 5.5% (from 5.7%). The data might be an indication that easy part of the deceleration in inflation might be behind us. An upward surprise (which we see as possible) could reinforce the Fed-rhetoric to bring the policy rate well above 5.0% and keep it at an elevated level for longer. US short-term yields already discount a Fed peak policy rate close to 5.20%. In case of upward surprise, the key question is whether this will trigger a further inversion of the US yield curve or whether expectations for interest rates to stay high for longer will also lift yields at the belly of the curve. First resistance for the US 5y and 10-y yield respectively stand at 4.03% and 3.90%. Signs of stubbornly high inflation, annex a hawkish Fed reaction also could support recent USD rebound. For EUR/USD first support comes in at 1.0680/56. UK labour market data this morning came out strong with a monthly job growth of 107k and weekly earnings ex-bonus at 6.7% from 6.4%. Sterling jumps higher in a first reaction with EUR/GBP again closing in on the 0.8825 support area.
News Headlines
The Biden administration yesterday announced the sale of another 26 million barrels of oil from its Strategic Petroleum Reserve. These will be released on the market in April and will take the SPR to a new low dating back to 1983. The US sold an unprecedented amount of 180 mln barrels from the reserves last year to counter surging energy prices after the Russian invasion. This time however, the sale is actually required by 2015 legislation. US lawmakers have used SPR sales as a way to finance spending proposals, often through mandates that the sales occur years in the future, as is the case now. But with SPR at historically low levels, the move draws criticism and the Energy Department itself has sought to stop it. The US WTI oil reference after the announcement dropped from intraday highs around $80.5/barrel to just north of $79.