Sample Category Title
But Why?
Looking at the market pricing, you could’ve hardly guessed, but yesterday’s US inflation report was not brilliant.
On a monthly basis, the headline inflation ticked higher from 0.1% to 0.5% as expected.
But on a yearly basis, both headline and core inflation didn’t ease as much as expected. Core inflation fell from 5.7% to 5.6%, instead of the 5.5% expected by analysts, while headline inflation eased from 6.5% to 6.4%, versus 6.2% expected by analysts.
And if we take it to the decimal point, that easing was even less. In fact, US headline inflation barely eased from 6.45% to 6.41%.
On the contrary, over the past three months, core inflation for example rose from 4.3% to 4.6%. And valentines had to spend 17% more on a romantic dinner this year!
So, nothing in that inflation report was ok.
And hotter inflation is not the elephant in the room. It is very much in line with the abnormally tight US jobs market.
This suggests that the rate hikes from the Federal Reserve (Fed) don’t translate into a weaker jobs market just yet and inflation, which has been encouragingly trending lower since summer gives signs that we may be soon coming to a point where it will be harder to make progress.
Services and shelter are the areas that should show improvement, and for now, it doesn’t look promising.
Why equities rallied?
You certainly expected to see a bearish market reaction to a strong US CPI data, right?
Well, the reaction was… mixed. The US stocks opened the day higher, then the S&P500 fell, which was the normal reaction, but then it rebounded to close the session near flat.
Nasdaq also gapped higher at the open, sold off, but rebounded to close the session 0.70% higher.
It’s perhaps because there were so many red flags about the possibility that inflation ticked higher that investors were happy that the data wasn’t so bad after all.
And/or, optimism in the market is so strong that neither the Fed, nor the data couldn’t do anything to hammer it.
Either way, a few more Fed members made hawkish comments after the data, but all investors heard was ‘bla bla bla’.
Sometimes it takes markets some time to come back to their senses.
But it’s worth noting that the downside risks prevail, though there is no reason for the equity rally to stall. If a disappointing inflation print couldn’t reverse the rally, I don’t see what can.
This morning, US futures are in the negative.
FX and yields at the wake of the US CPI
Still, treasury markets seemed more down to earth, as the US 2-year yield ticked to the highest levels since last November, activity on Fed funds futures gave a little more than 12% probability for a 50bp hike at the next FOMC meeting, versus around 9% at the start of the week.
But the dollar index remained stuck below its 50-DMA.
Gold extended gains to $1843 on the back of stronger yields and firmer US dollar.
The EURUSD found support above the 50-DMA, which stands around the 1.0715 mark.
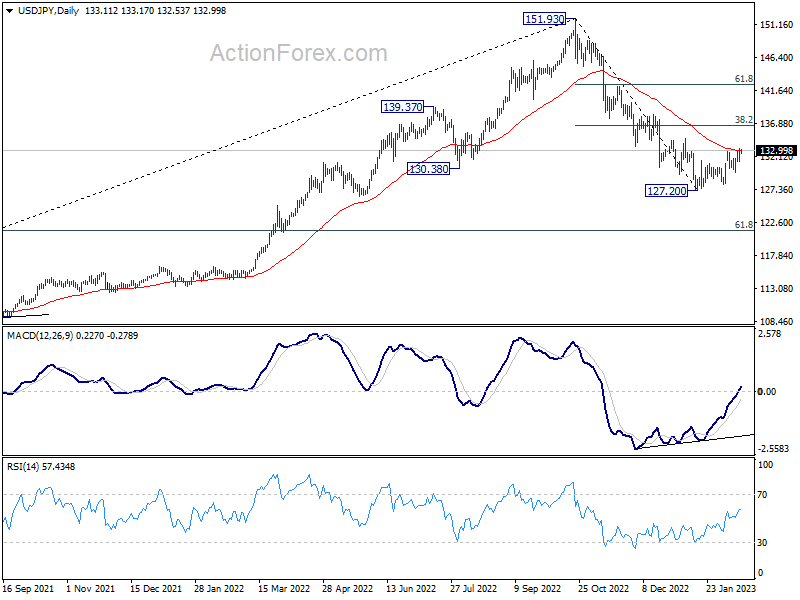
The dollar-yen cleared resistance near its own 50-DMA level, and is now testing the 133 offers, the minor 23.6% Fibonacci retracement, to the upside. I don’t see a particular reason for the dollar to soften given the latest inflation figures, but there is always a risk that the new BoJ governor Ueda says something like ‘we will scrap the YCC policy because it makes no sense’ and boom, the pair could go below 130 before you even know. So the risks are still tilted to the downside in USDJPY.
in the UK, inflation in January still eased more than expected to 10.1%. That’s not the sharp easing that Mr. Bailey was talking about, and with a 6.7% wages growth on average, we may never see inflation in Britain crash, but both headline and core inflation in Britain eased in January. Sterling took a dive post data.
Crude oil remains offered into the 100-DMA, near $81pb level, and the bears are in charge of the market this morning as the latest API data showed a massive 10 mio barrel build in US oil inventories last week, while Biden Administration announced there would be further releases from the strategic petroleum reserves of 26 million barrels earlier this week.
The more official EIA data is due today, and will show a similar surprise. So, US crude is certainly on its way to test the 50-DMA to the downside, near $77pb.
Hawkish Fed Talk after CPI Report
Market movers today
In the US, retail sales figures are the highlight today and it will be interesting to see whether consumer spending continued to cool at the start of 2023, despite the strong labour market. Empire manufacturing for February is also released.
After wage growth again surprised on the upside yesterday, the UK inflation report for January will reveal whether core inflation pressures are still on the rise, adding to the risk of more hikes from Bank of England.
The delayed Q4 2022 GDP figures are released in Norway.
The 60 second overview
US inflation push yields higher: US January CPI came out broadly in line with our expectations, as headline CPI grew 0.5% m/m and core CPI 0.4%. That said, the details continued to illustrate persistent underlying price pressures, and markets reacted by pricing in a larger probability of Fed continuing its hiking cycle beyond May and now pricing a peak rate around 5.25% in July. Core Services ex. Shelter inflation remained steady at 0.6% m/m, but the figure was pulled down by negative contribution from healthcare inflation, largely linked to negative base effects in health insurance prices. Excluding healthcare and shelter, core services inflation picked up to 0.65% m/m (from 0.35%), while core goods CPI also rose by 0.07% after three months of consecutive decline.
For now, we stick to our forecast of two more 25bp Fed hikes, and first rate cuts only in early 2024. Besides realized inflation and labour market data, we will keep a close eye out for how inflation expectations develop. Both market and consumer survey based expectations have ticked slightly higher recently, which supports the case for maintaining nominal rates higher for longer.
Fed officials signal risk of higher rate peak: In comments after the CPI print, Dallas Fed President said that "We must remain prepared to continue rate increases for a longer period than previously anticipated, if such a path is necessary to respond to changes in the economic outlook or to offset any undesired easing in conditions." Also talking after the CPI release, Richmond Fed President Thomas Barkin stated that "if inflation persists at levels well above our target, maybe we'll have to do more [than anticipated]". Another Fed member Patrick Harker from Philadelphia Fed said that "It's going to be above 5% in the Fed funds rate. How much above 5? It's going to depend a lot on what we're seeing."
US says three mystery objects likely private: US National Security Spokesman John Kirby said Tuesday, that the three unknown objects the US shot down in recent days were likely private and not linked to China. As we wrote yesterday, US Secretary of State Anthony Blinken and China's top foreign policy diplomat Wang Yi are weighing a meeting at the side lines of the Munich Security Conference starting Friday.
NATO has for the first time opened for Finland and Sweden joining separately. "So the main question is not whether Finland and Sweden are ratified together," Secretary-general Jens Stoltenberg told reporters on Tuesday. "The main question is that they are both ratified as full members as soon as possible. And I'm confident that both will be full members, and are working hard to get both ratified as soon as possible." Turkey is currently holding up Sweden's membership accusing Stockholm of holding Kurdish activists and over allowing the burning of the Koran in front of the Turkish embassy in Sweden.
Equities: Equities little changed yesterday after yoyo moving during the day. However, underneath the surface an interesting outperformance of growth stocks took place. This happened although the US CPI report came out hotter than expected and yields moved higher across the curve with further inversion. For us, this can only be explained by the classic FOMO reaction as investors have been missing out on the rally in growth stocks since October. However, we see this change in correlations as temporary and argue for growth stocks to suffer if we see further lift to yields. Some of this also visible in futures this morning. In US yesterday, Dow -0.5%, S&P 500 -0.03%, Nasdaq +0.6% and Russell 2000 -0.1%. Asian markets broadly lower this morning led by South Korea dropping 1.7%. Futures in Europe slightly negative while US down a bit lead by Nasdaq.
FI: Bond yields and interest rates rose on the back of the stronger than expected US inflation data released yesterday. 10Y US Treasury yields rose almost 10bp on the back of the US inflation numbers before falling 3-4bp by the end of the trading session. There was a spill-over effect to European bond yields and these also rose.
FX: Initial gyrations in G10 FX after US CPI, but soon the USD came out as a marginal winner with EUR/USD moving toward low 1.07 and USD/JPY testing the upper end of the 130-133 range. EUR/SEK made attempts toward year lows around 11.06 in the early part of the European session but then gradually edged higher during the day alongside EUR/NOK.
Credit: Credit markets tightened markedly during the day, but after the release of the US CPI figures, sentiment changed and both iTraxx Xover and Main closed more or less unchanged in 77bp and 401bp, respectively.
Nordic macro
Norwegian GDP is released today. Growth was much stronger than expected towards the end of last year. Although we expect it to slow in December, with mainland GDP falling 0.2% m/m, this would still give solid growth of 0.7% q/q for Q4. That said, it will be worth looking out for any revisions of previous data, as these can sometimes change the picture quite considerably.
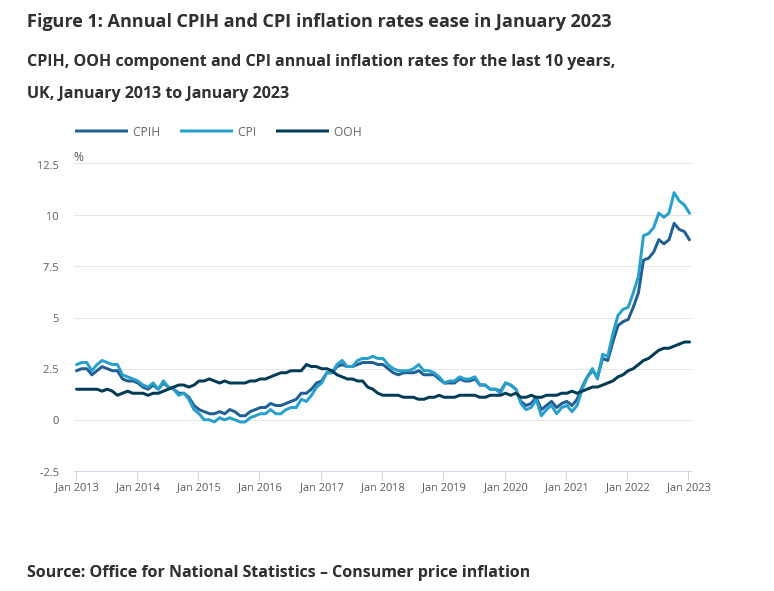
UK CPI slowed more than expected to 10.1% yoy in Jan
UK CPI slowed from 10.5% yoy to 10.1% yoy in January, below expectation of 10.3% yoy. CPI core slowed from 6.3% yoy to 5.8% yoy, below expectation of 6.2% yoy.
The largest downward contribution to annual inflation came from transport (particularly passenger transport and motor fuels), and restaurants and hotels, with rising prices in alcoholic beverages and tobacco making the largest partially offsetting upward contribution to the change.
Also released, RPI came in at 0.0% mom, 13.4% yoy, versus expectation of 0.1% mom, 13.2% yoy. PPI input was at -0.1% mom, 14.1% yoy, versus expectation of 0.2% mom, 14.7% yoy. PPI output was at 0.5% mom, 13.5% yoy, versus expectation of 0.1% mom, 14.4% yoy. PPI core output was at 0.6% mom, 11.1% yoy, versus expectation of 0.7% mom, 11.9% yoy.
Elliott Wave View: Ethereum (ETHUSD) 5 Waves Down Calling for More Downside
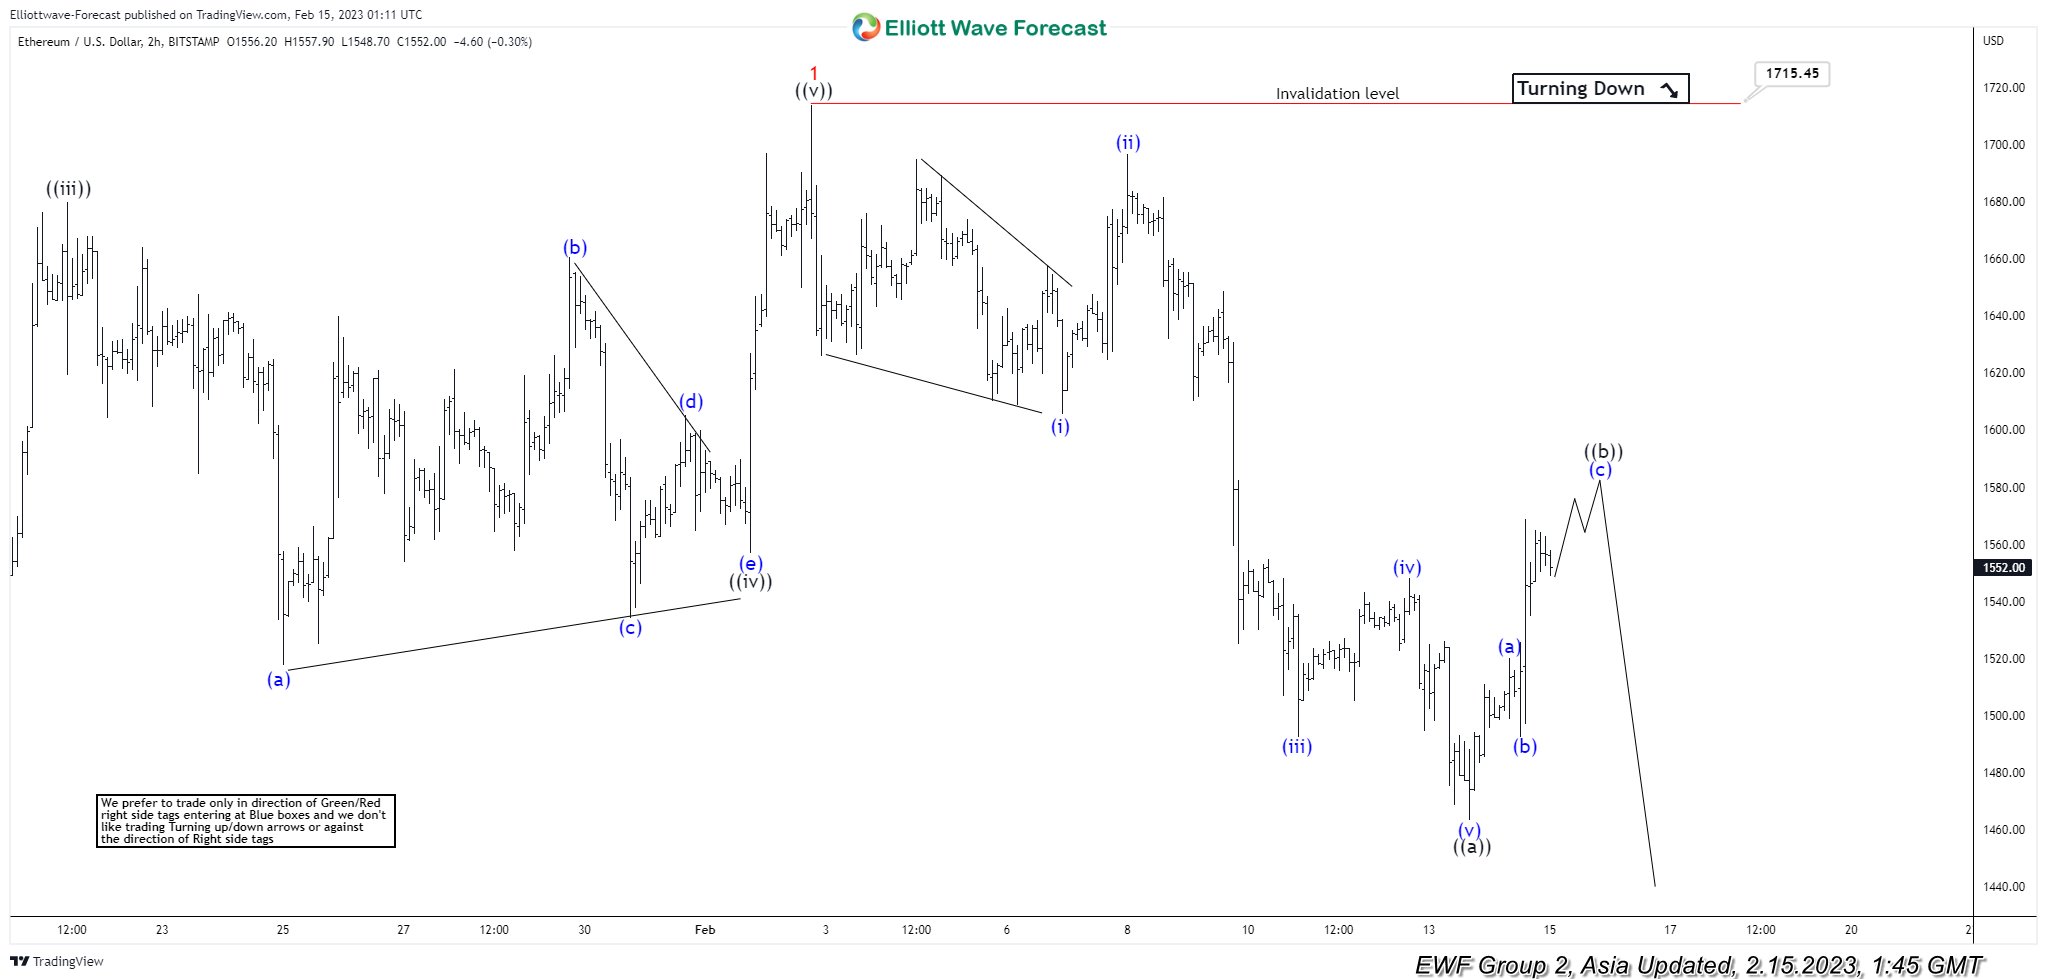
Cycle from 9.11.2022 low in Ethereum (ETHUSD) is in progress as a 5 waves impulse Elliott Wave structure. Up from 9.11.2022 low, wave 1 ended at 1714.10. Wave 2 dips is currently ongoing with internal subdivision as a zigzag Elliott Wave structure. Down from wave 1, wave (i) ended at 1605.6 and rally in wave (ii) ended at 1696.90. The crypto currency extends lower in wave (iii) towards 1492.30 and rally in wave (iv) ended at 1548. Final leg lower wave (v) ended at 1463.20 which completed wave ((a)) in higher degree.
Rally in wave ((b)) is now in progress to correct the cycle from 2.2.2023 high. Internal subdivision of wave ((b)) is unfolding as a zigzag Elliott Wave structure in lesser degree. Up from wave ((a)), wave (a) ended at 1520.20, and pullback in wave (b) ended at 1492.30. Expect wave (c) to extend higher and fail below 1715.45 for further downside. Near term, as far as pivot at 1715.45 high stays intact, expect short term rally to fail in 3, 7, or 11 swing for further downside in wave ((c)) of 2. Afterwards, Ethereum should resume higher again as far as 9.11.2022 low at 1071.5 holds.
Ethereum (ETHUSD) 2 Hour Elliott Wave Chart
USD/CAD Daily Outlook
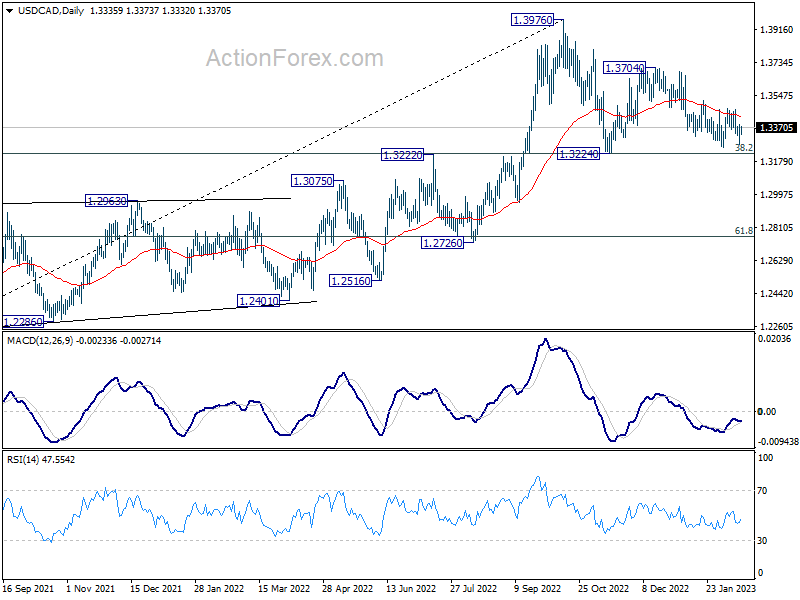
Daily Pivots: (S1) 1.3277; (P) 1.3334; (R1) 1.3393; More....
Intraday bias in USD/CAD stays neutral for the moment. Outlook is unchanged too. The choppy decline from 1.3704 might still extend lower, but strong support is expected to 1.3224 key support to bring rebound. On the upside, above 1.3519 resistance will confirm short term bottoming, and turn intraday bias back to the upside for retesting 1.3704 resistance. However, decisive break of 1.3224 would carry larger bearish implication.
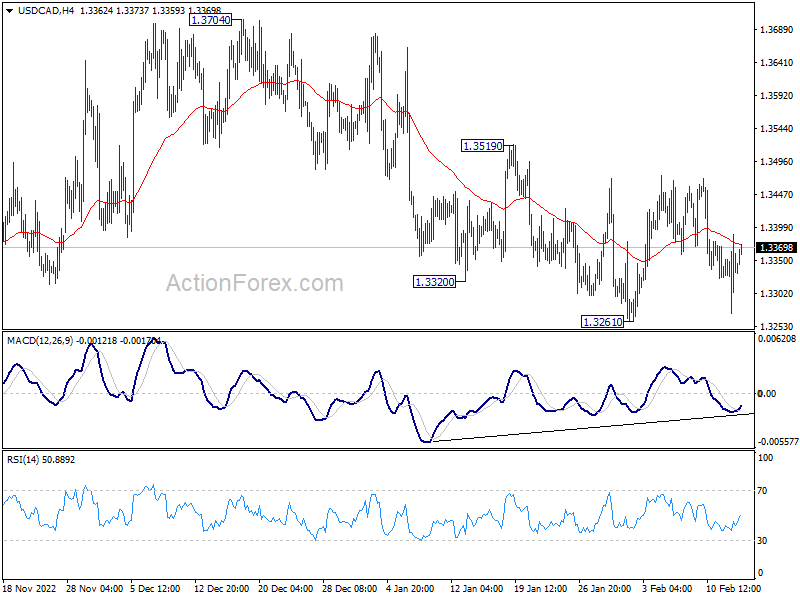
In the bigger picture, as long as 1.3222 cluster support (38.2% retracement of 1.2005 to 1.3976 at 1.3223) holds, larger up trend from 1.2005 (2021 low) is still expected to resume through 1.3976 high at a later stage. However, firm break of 1.3222/3 will indicate that the trend might have reversed. Deeper fall would be seen to next cluster support at 1.2726 (61.8% retracement at 1.2758).
AUD/USD Daily Report
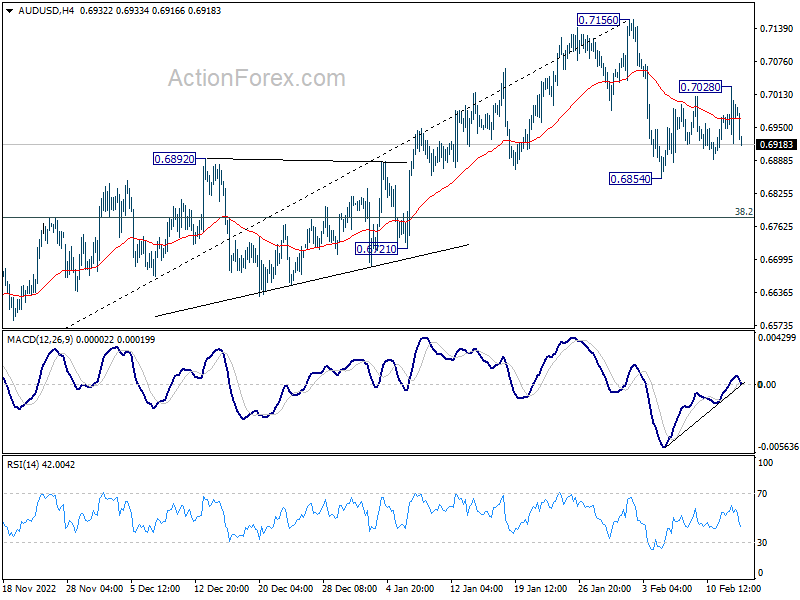
Daily Pivots: (S1) 0.6929; (P) 0.6979; (R1) 0.7036; More...
AUD/USD edged higher to 0.7028 but quickly retreated. Intraday bias remains neutral first. On the downside, break of 0.6854 will resume the correction from 0.7156 to 38.2% retracement of 0.6169 to 0.7156 at 0.6779. On the upside, break of 0.7028 will turn bias back to the upside for retesting 0.7156 high instead.
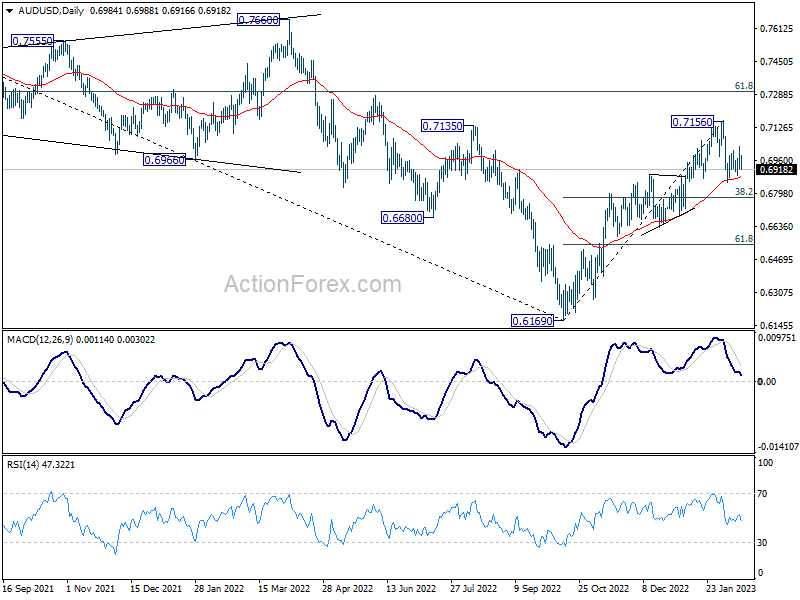
In the bigger picture, corrective decline from 0.8006 (2021 high) should have completed with three waves down to 0.6169 (2022 low). Further rally should be seen to 61.8% retracement of 0.8006 to 0.6169 at 0.7304. Sustained break there will pave the way to retest 0.8006. This will now remain the favored case as long as 0.6721 support holds.
EUR/USD Daily Outlook
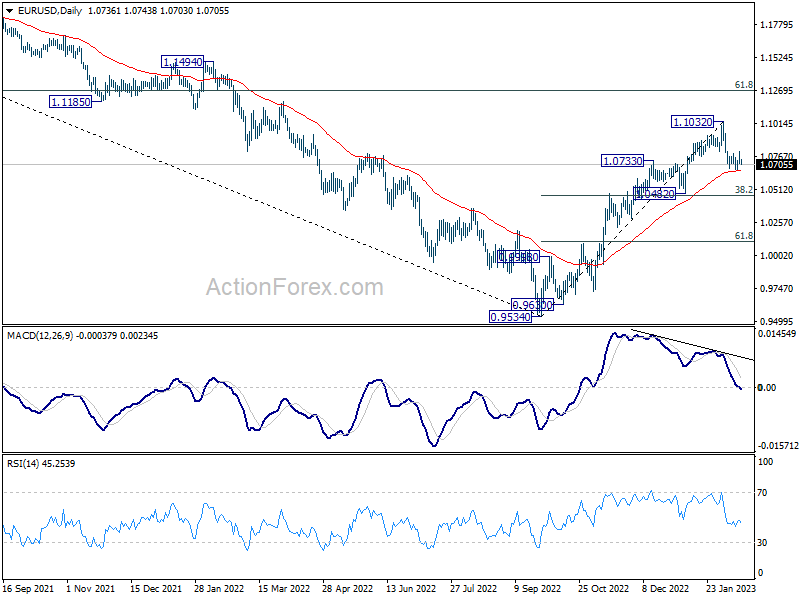
Daily Pivots: (S1) 1.0694; (P) 1.0749; (R1) 1.0791; More...
Intraday bias in EUR/USD remains neutral for the moment. On the downside, break of 1.0654 will resume the corrective fall from 1.1032 to 38.2% retracement of 0.9534 to 1.1032 at 1.0463. Strong support should be seen around there to bring rebound, at least on first attempt. On the upside, firm break of 1.0790 minor resistance will turn bias back to the upside for retesting 1.1032 high instead.
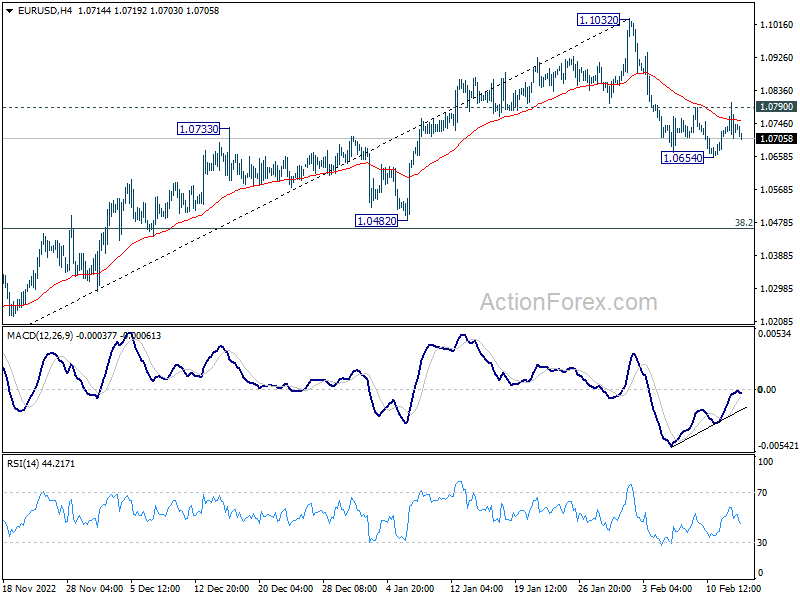
In the bigger picture, the rally from 0.9534 low (2022 low) is a medium term up trend rather than a correction. Further rise is in favor to 61.8% retracement of 1.2348 (2021 high) to 0.9534 at 1.1273 next. This will remain the favored case as long as 1.0482 support holds.
GBP/USD Daily Outlook
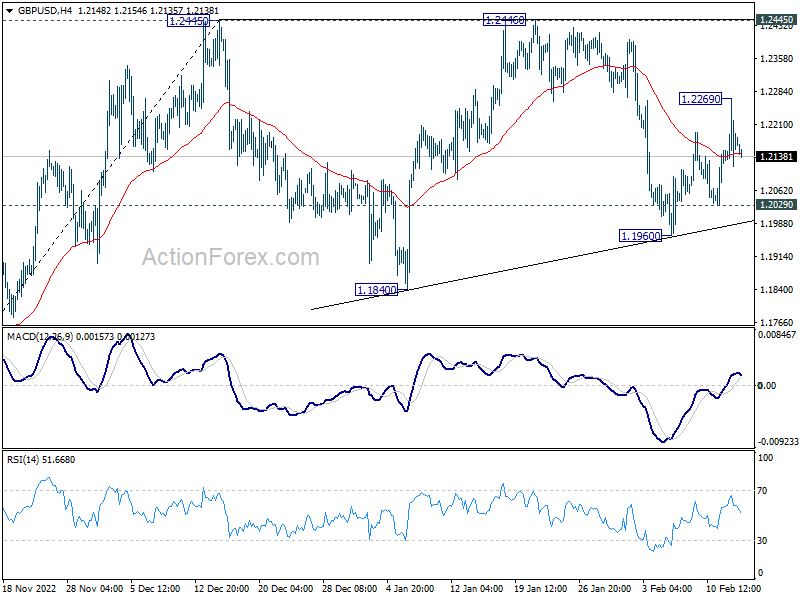
Daily Pivots: (S1) 1.2107; (P) 1.2187; (R1) 1.2256; More...
Intraday bias in GBP/USD is turned neutral again as rebound stalled after hitting 1.2269. Still, the favored case is that corrective pattern from 1.2445 has completed at 1.1960 already. Above 1.2269 will bring retest of 1.2445/6 resistance zone. On the downside however, break of 1.2029 will extend the corrective pattern with another fall through 1.1960, towards 1.1840 support.
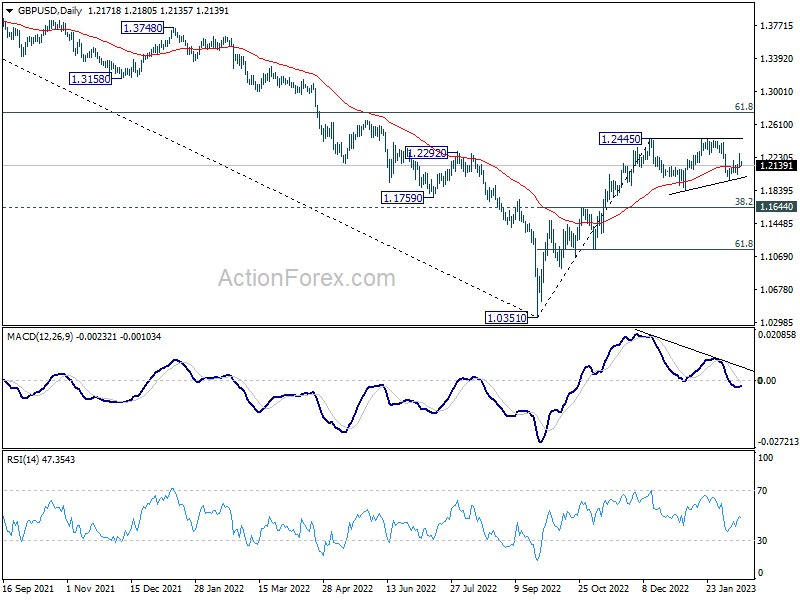
In the bigger picture, rise from 1.0351 medium term bottom is at least correcting whole down trend from 1.4248 (2021 high). Further rise is expected as long as 1.1644 resistance turned support holds. Next target is 61.8% retracement of 1.4248 to 1.0351 at 1.2759. Sustained break there will pave the way back to 1.4248.
USD/CHF Daily Outlook
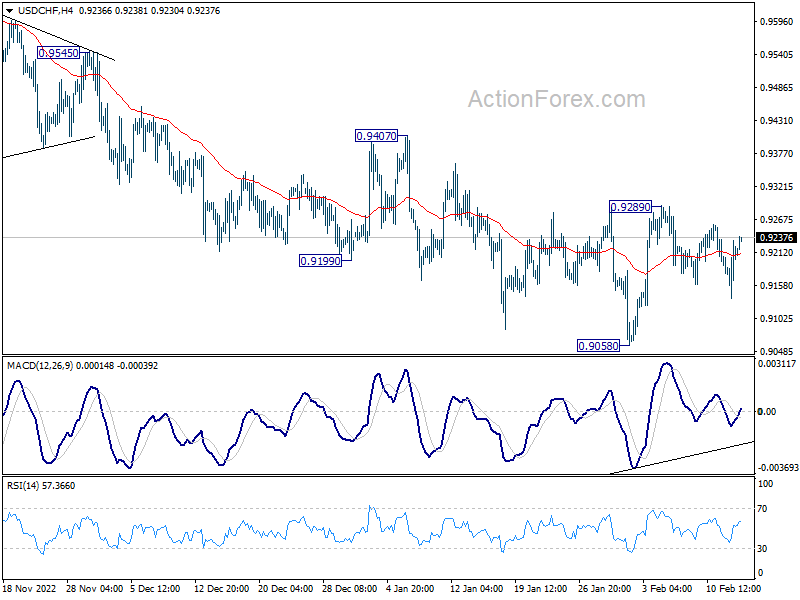
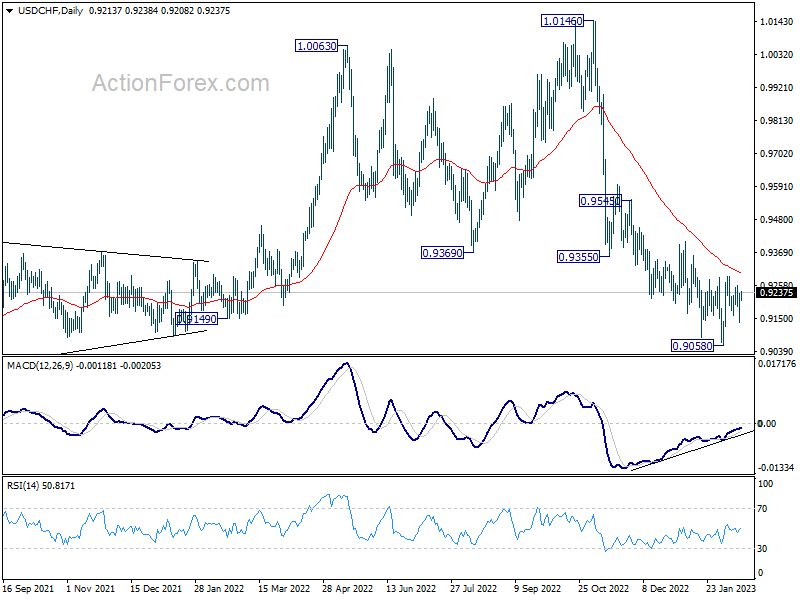
Daily Pivots: (S1) 0.9159; (P) 0.9196; (R1) 0.9255; More...
Intraday bias in USD/CHF remains neutral and outlook is unchanged. On the upside, firm break of 0.9289 resistance will confirm short term bottoming at 0.9058, and bring stronger rise to 0.9407 resistance. On the downside, however, sustained break of 0.9058 will resume larger decline from 1.0146 instead.
In the bigger picture, rise from 0.8756 (2021 low) has completed at 1.0146, well ahead of 1.0342 long term resistance (2016 high). Based on current downside momentum, fall from 1.0146 should be a medium term down trend itself. Next target is a test on 0.8756 low. Strong support should be seen there to bring rebound. Still, further decline will be expected as long as 0.9407 resistance holds, in any case.
USD/JPY Daily Outlook
Daily Pivots: (S1) 131.97; (P) 132.65; (R1) 133.77; More...
Intraday bias in USD/JPY stays on the upside at this point. Rebound from 127.20 short term bottom should extend to 38.2% retracement of 151.93 to 127.20 at 136.64, even as a correction to the decline from 151.39. On the downside, break of 131.49 minor support will turn intraday bias neutral again first.
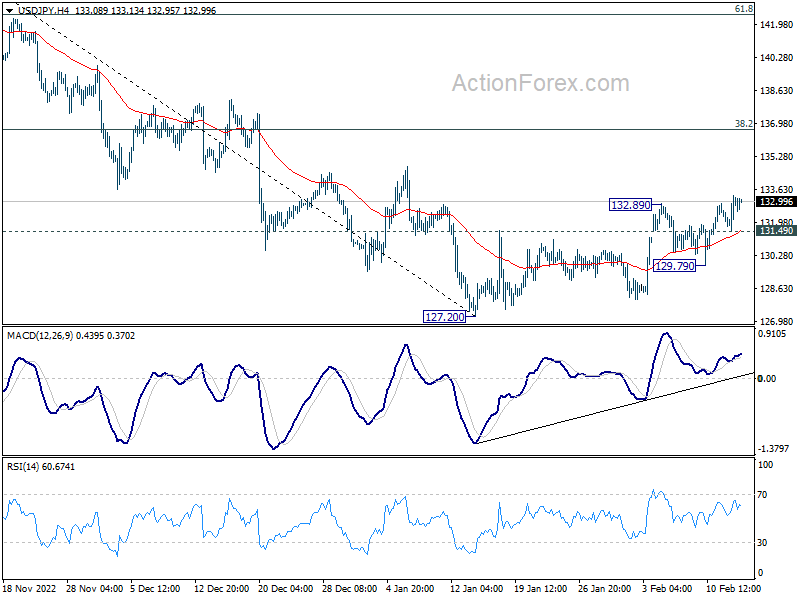
In the bigger picture, prior of 55 week EMA (now at 131.47) raises the chance of medium term bearish reversal, but that's not confirmed yet. Strong rebound from current level, followed by sustained break of 38.2% retracement of 151.93 to 127.20 at 136.64 will argue that price actions from 151.93 is merely a corrective pattern. However, rejection by 136.64 will solidify medium term bearishness for 61.8% retracement of 102.58 to 151.93 at 121.43 and 38.2% retracement of 75.56 to 151.93 at 122.75.