Sample Category Title
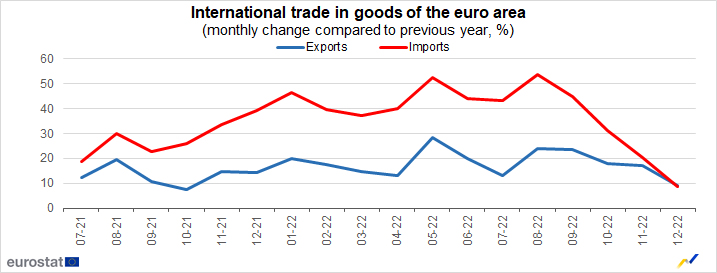
Eurozone goods exports rose 9.0% yoy in Dec, imports rose 8.7% yoy
Eurozone goods exports rose 9.0% yoy to EUR 238.7B in December. Goods imports rose 8.7% yoy to EUR 247.5B. Trade deficit came in at EUR -8.8B. Intra-Eurozone trade rose 9.4% yoy to EUR 212.8B.
In seasonally adjusted term, exports dropped -4.6% mom to EUR 239.7B. Imports dropped -2.9% to EUR 257.9B. Trade deficit widened from November's EUR -14.4B to EUR -18.1B, larger than expectation of EUR -16.0B. Intra-Eurozone trade dropped from EUR 233.5B to EUR 230.9B.
Eurozone industrial production down -1.1% mom in Dec, EU down -0.4% mom
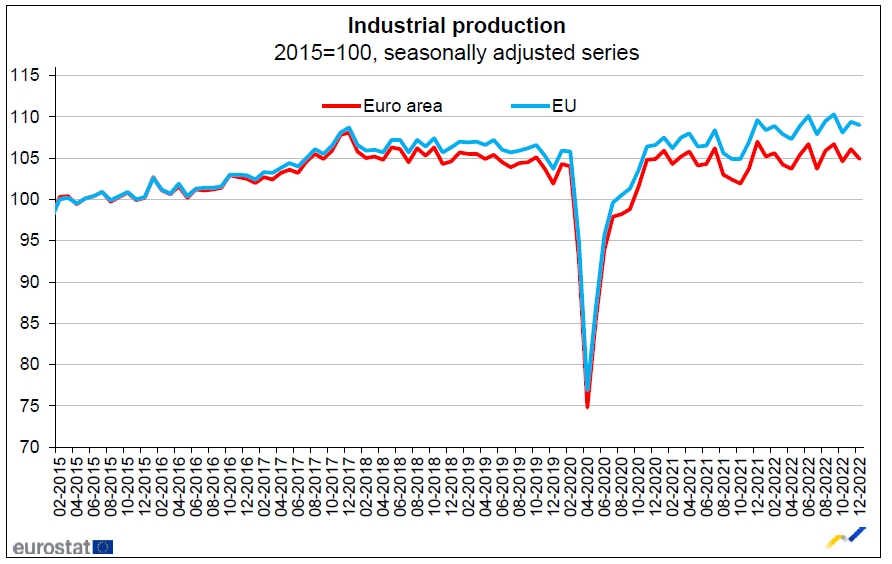
Eurozone industrial production declined -1.1% mom in December, worse than expectation of -0.8% mom. Production of intermediate goods fell by -2.8%, durable consumer goods by -1.4%, non-durable consumer goods by -1.0% and capital goods by -0.4%, while production of energy grew by 1.3%.
EU industrial production dropped -0.4% mom. Among Member States for which data are available, the largest monthly decreases were registered in Ireland (-8.5%), Luxembourg (-5.2%) and Lithuania (-4.0%). The highest increases were observed in Denmark (+13.5%), Portugal (+4.1%) and Hungary (+3.8%).
Gold Plummets to Fresh 5-Week Low
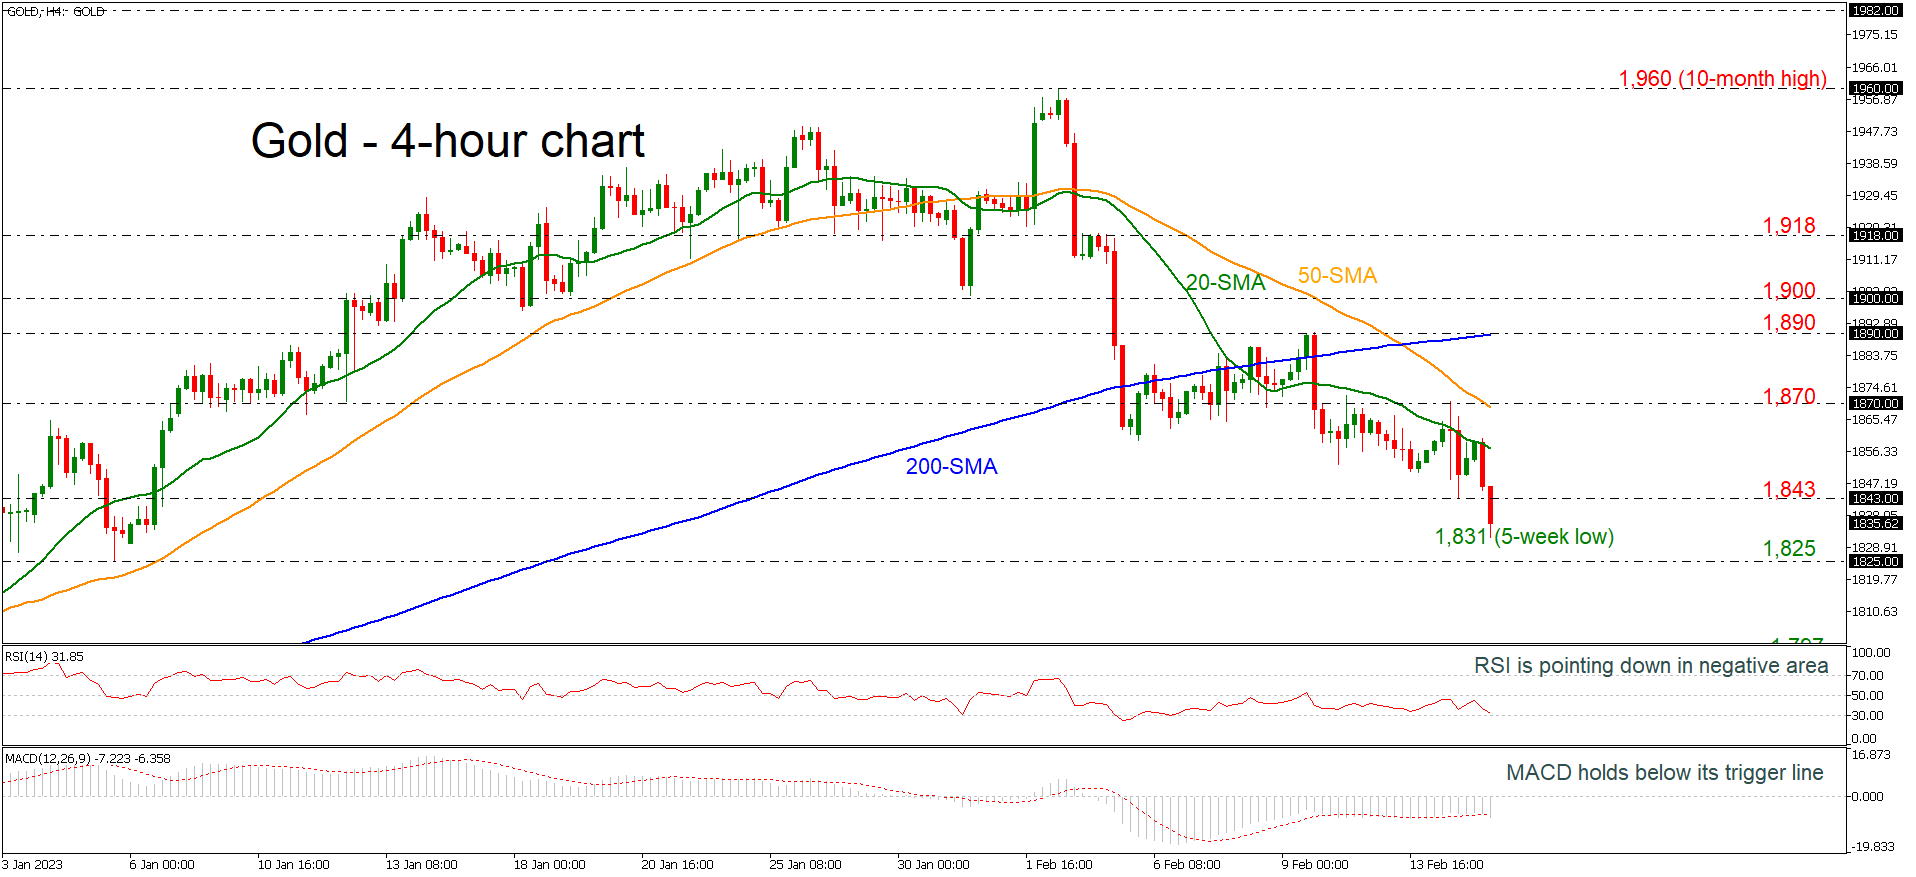
Gold plunged towards a fresh five-week low of 1,831, continuing the strong selling interest of the ten-month peak of 1,960. The RSI is diving towards the oversold territory with strong momentum and the MACD is losing ground beneath its trigger and zero lines. In trend indicators, the 20- and the 50-period simple moving averages (SMAs) are following the descending move in price action.
Further declines may meet support around 1,825, taken from the lows on January 15, while even lower the price may hit the end of December’s trough of 1,797, which could attract traders’ attention.
On the upside, resistance could occur around the 1,843 barrier before testing the 20- and the 50-period SMAs at 1,857 and 1,868 respectively, which stands near the previous peak of 1,870. Higher still, the 200-period SMA at 1,890 would increasingly come into scope, while just above this point lies the psychologically significant level of 1,900, a break of which could shift the bias to a positive one.
The medium-term picture continues to look predominantly bearish, with trading activity taking place below both the 50- and 200-period SMAs.
ECB de Cos: Recent inflation data are somewhat encouraging
ECB Governing Council member Pablo Hernandez de Cos said, "recent data on euro area inflation and some of its key determinants are somewhat encouraging, but the overall situation still requires caution".
But he added that the evidence so far was very preliminary. Careful monitoring is required in some areas, including residual pass-through of inflation shocks, and the symmetry of pass-through of energy price delcines to core inflation and wages, as well ass the effects of Chinese reopening.
"All these will have to be assessed as part of the full projections exercise under way in the run-up to our March meeting," De Cos said.
EURGBP Sees Strong Bullish Momentum after a Negative Week
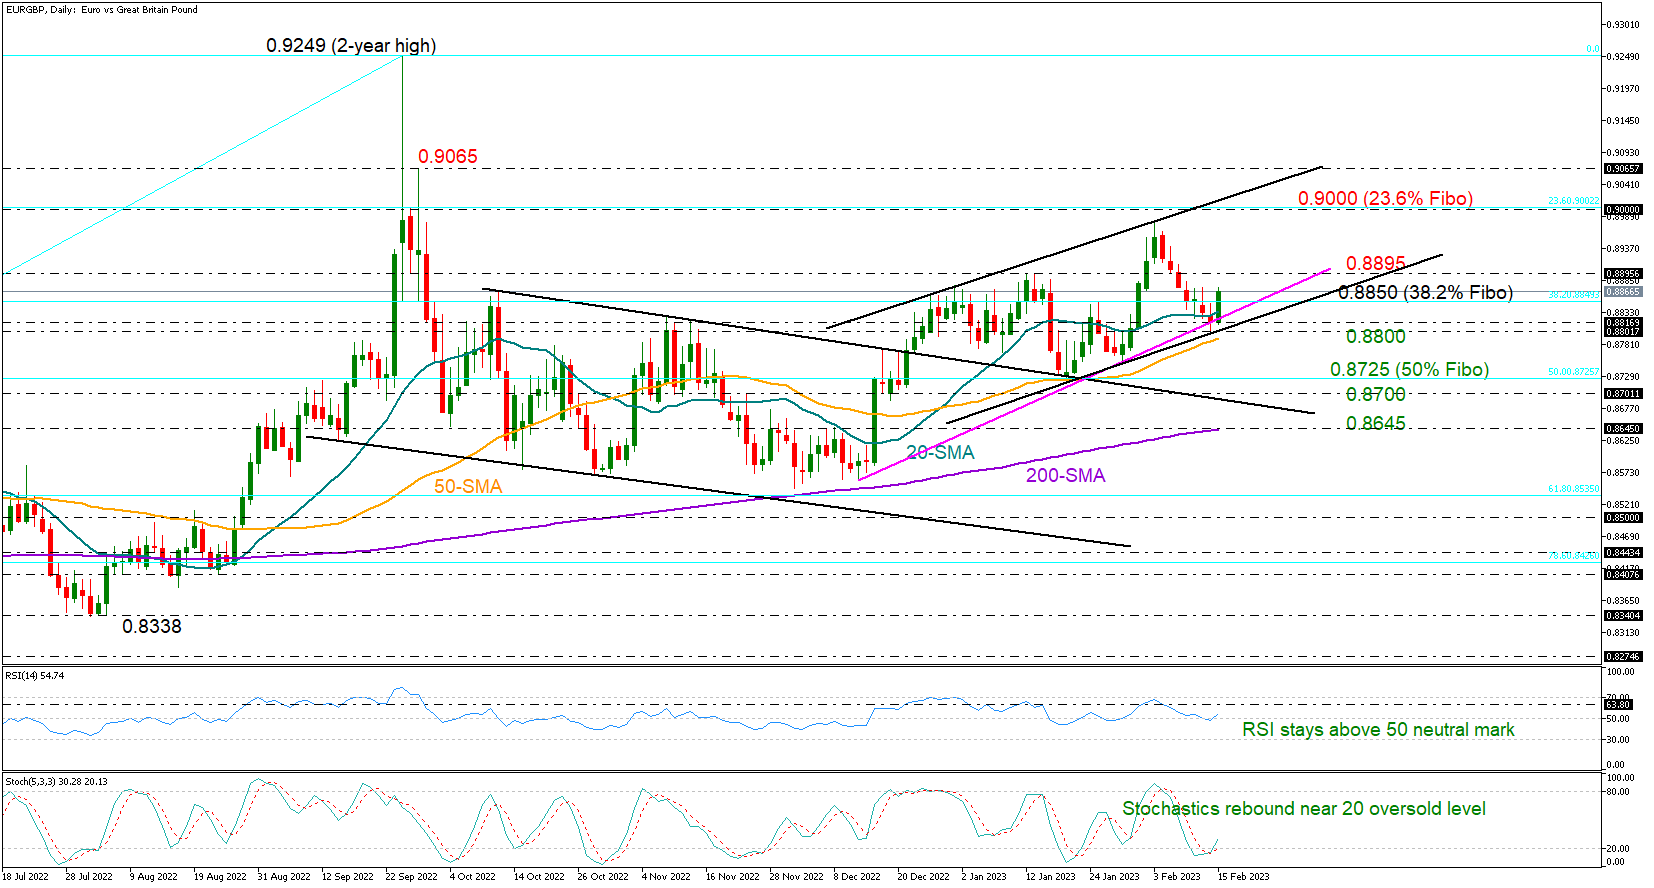
EURGBP revived its bullish momentum on Wednesday after a week of losses, which pressured the pair from February’s high of 0.8978 to the 0.8800 round level.
The pair is aiming to preserve strength above the short-term support trendline around 0.8820 and hold within the bullish channel. If it snaps the 38.2% Fibonacci retracement of the former 0.8201-0.9249 uptrend at 0.8850 too, the recovery may stretch towards the 23.6% Fibonacci of 0.9000 and the channel’s upper surface. Some consolidation around January’s resistance of 0.8895 cannot be excluded. Beyond 0.9000, the spotlight will fall on 0.9065, where the market faced strong rejection last September.
Technically, the market has not confirmed a bullish bias yet. The latest rebound in the RSI and the stochastic oscillator is still in progress, with the former remaining close to its 50 neutral mark and the latter barely increasing above its 30 oversold level.
A pullback below the 0.8800 number could prompt an aggressive decline towards the 50% Fibonacci of 0.8725, where January’s sharp downfall stalled. A continuation lower may immediately stabilize around the descending line from mid-December currently at 0.8700 before meeting the 200-day simple moving average (SMA) at 0.8645. Note that the line maintains a golden cross with the 50-day SMA, feeding hopes that the uptrend from August will resume.
In brief, EURGBP is setting a foothold for its next bullish wave. A close above 0.8895 could clear the way towards the 0.9000 level.
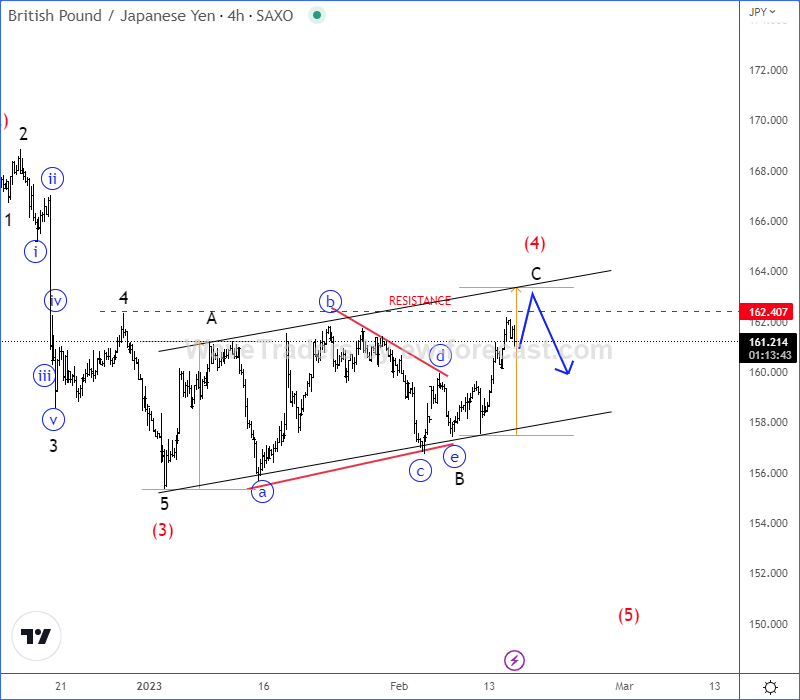
GBP/JPY Finishing an Upward Correction
GBPJPY faced a massive decline recently which we see it as a higher degree wave (3) of a five-wave bearish impulse. So, current recovery should be an upward wave (4) correction within downtrend, especially if we respect slow price action and choppy + overlapped wave structure. We can actually see a three-wave A-B-C corrective rally within (4), but the main reason for a corrective movement is a potential triangle within wave B in the middle. We know that triangles cannot occur in wave 2, so it must be wave B as part of an A-B-C correction.
GBP/JPY: Will the Bullish Trend Reach 176.39?
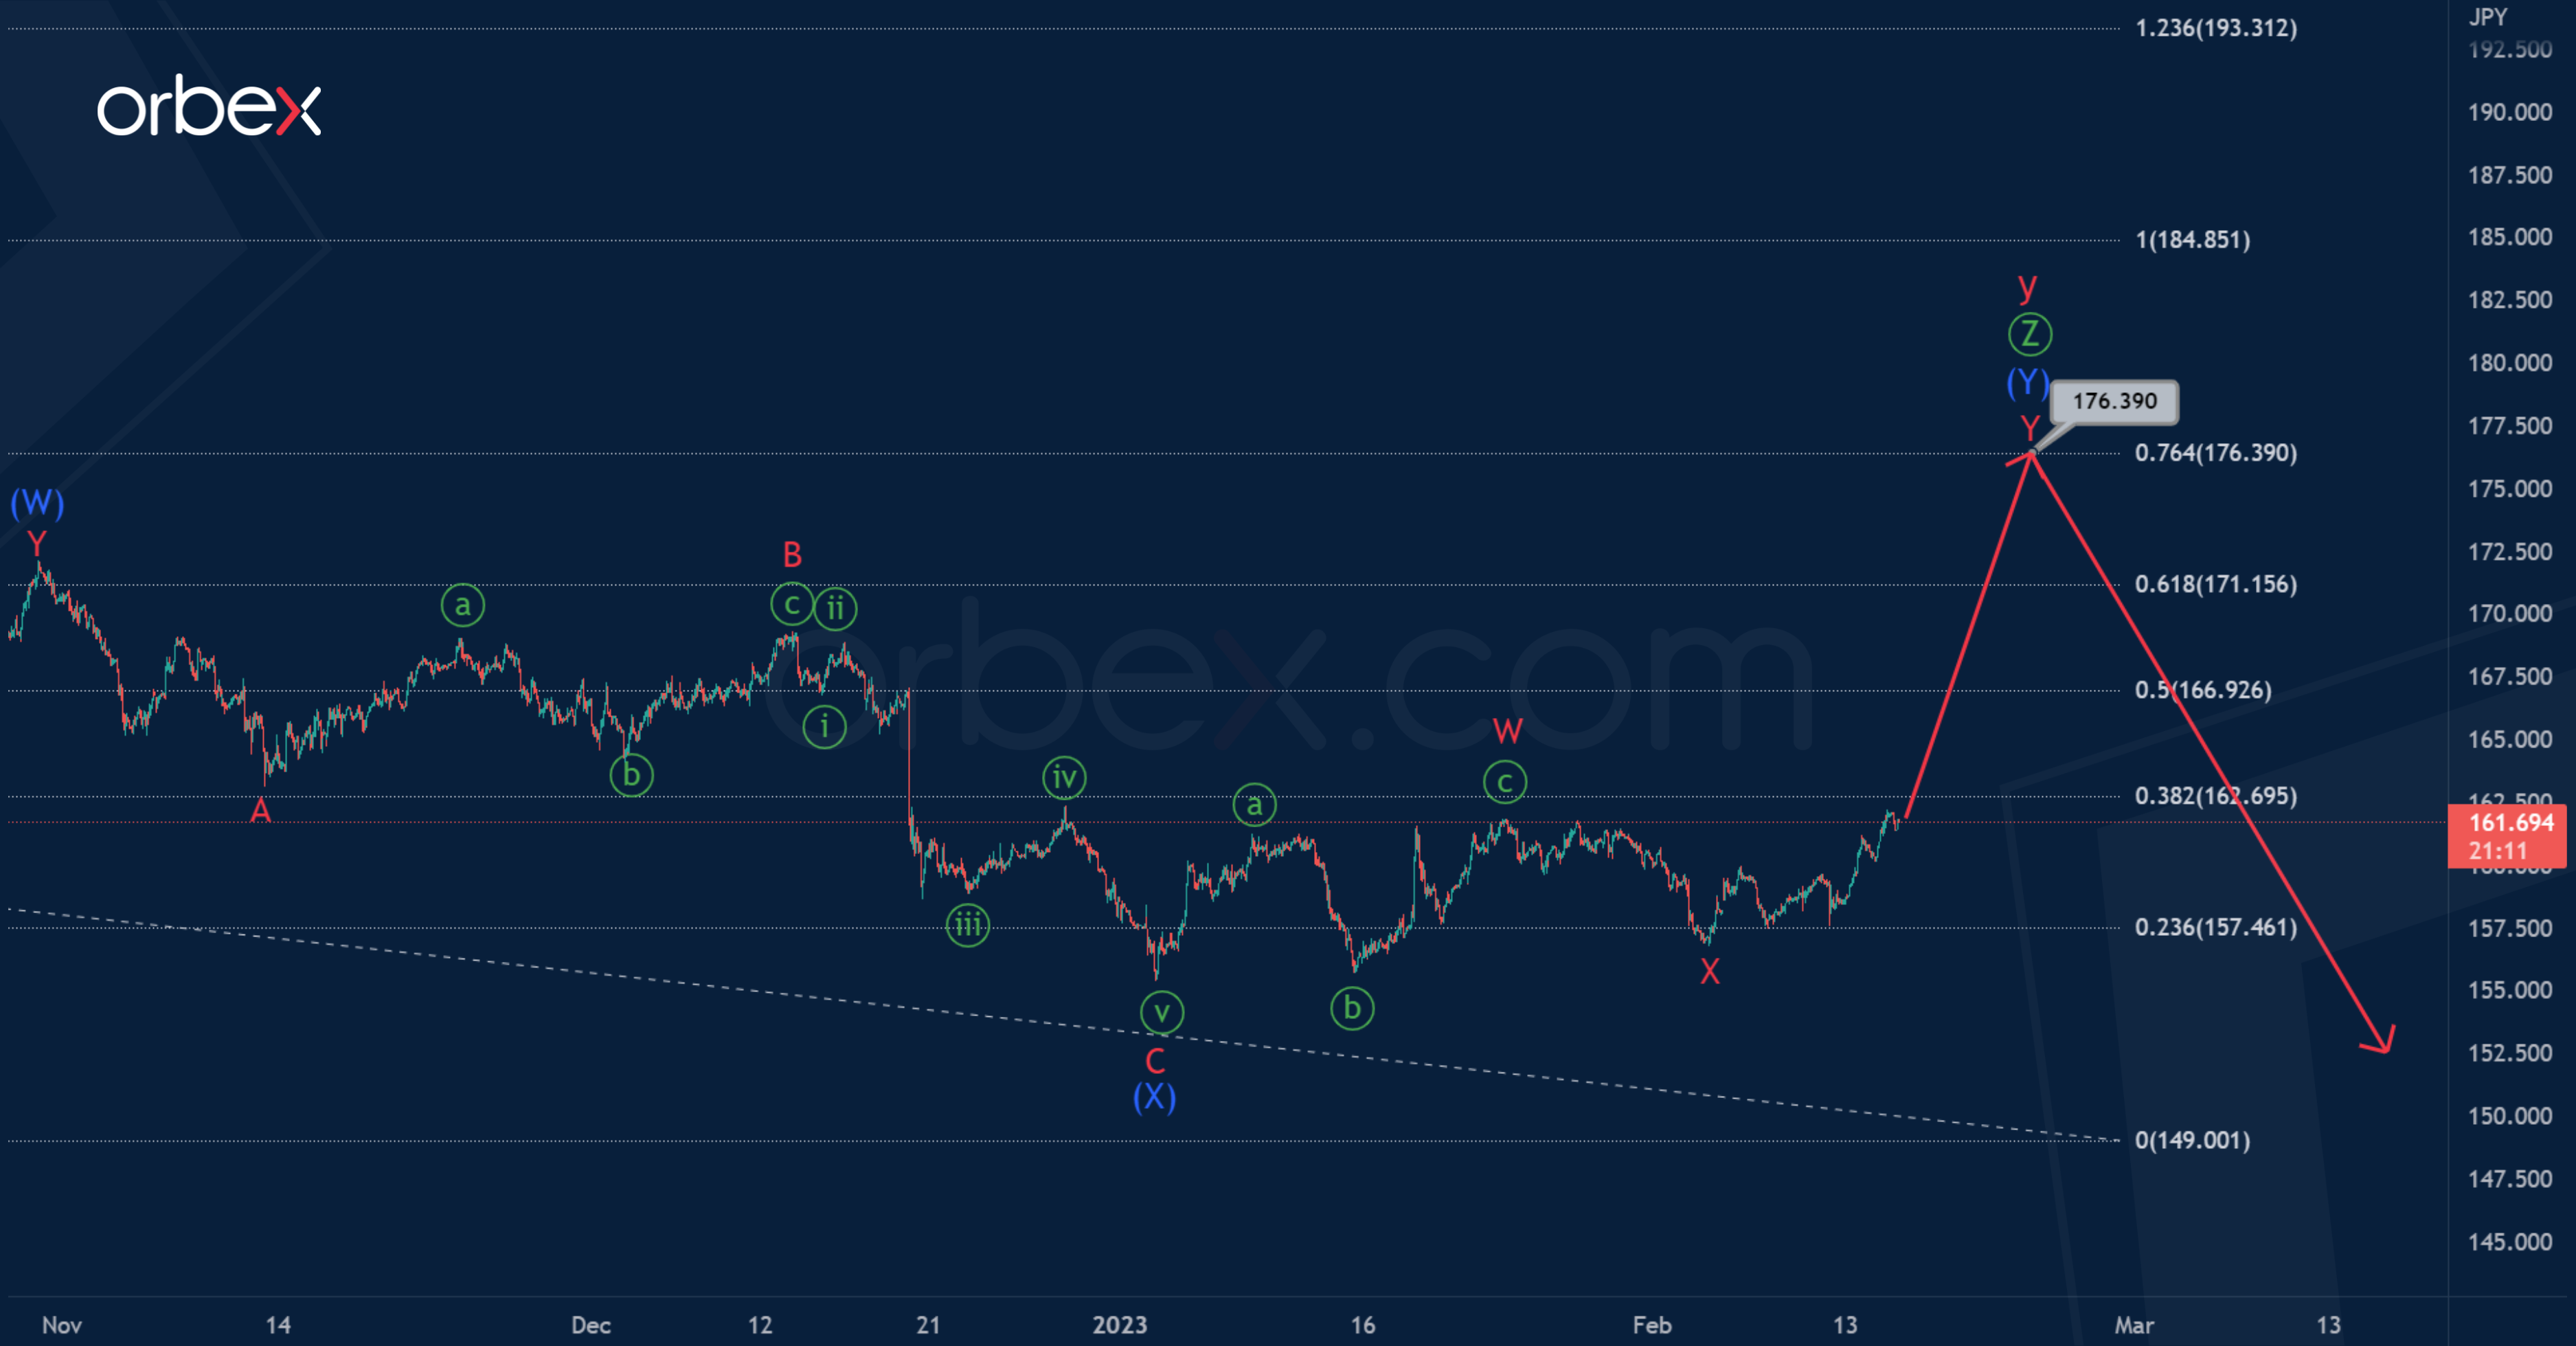
GBPJPY seems to be forming a large correction pattern - a triple zigzag Ⓦ-Ⓧ-Ⓨ-Ⓧ-Ⓩ, or rather its final part - the wave Ⓩ. It may take the form of an intermediate double zigzag (W)-(X)-(Y).
It is assumed that two sub-waves (W) and (X) have already been formed. Now the last actionary wave (Y) is being built, which can take the form of a double zigzag W-X-Y. To complete this double zigzag , a minor sub-wave Y is needed.
The bulls are targeting at 176.39. At that level, wave (Y) will be at 76.4% of previous actionary wave (W).
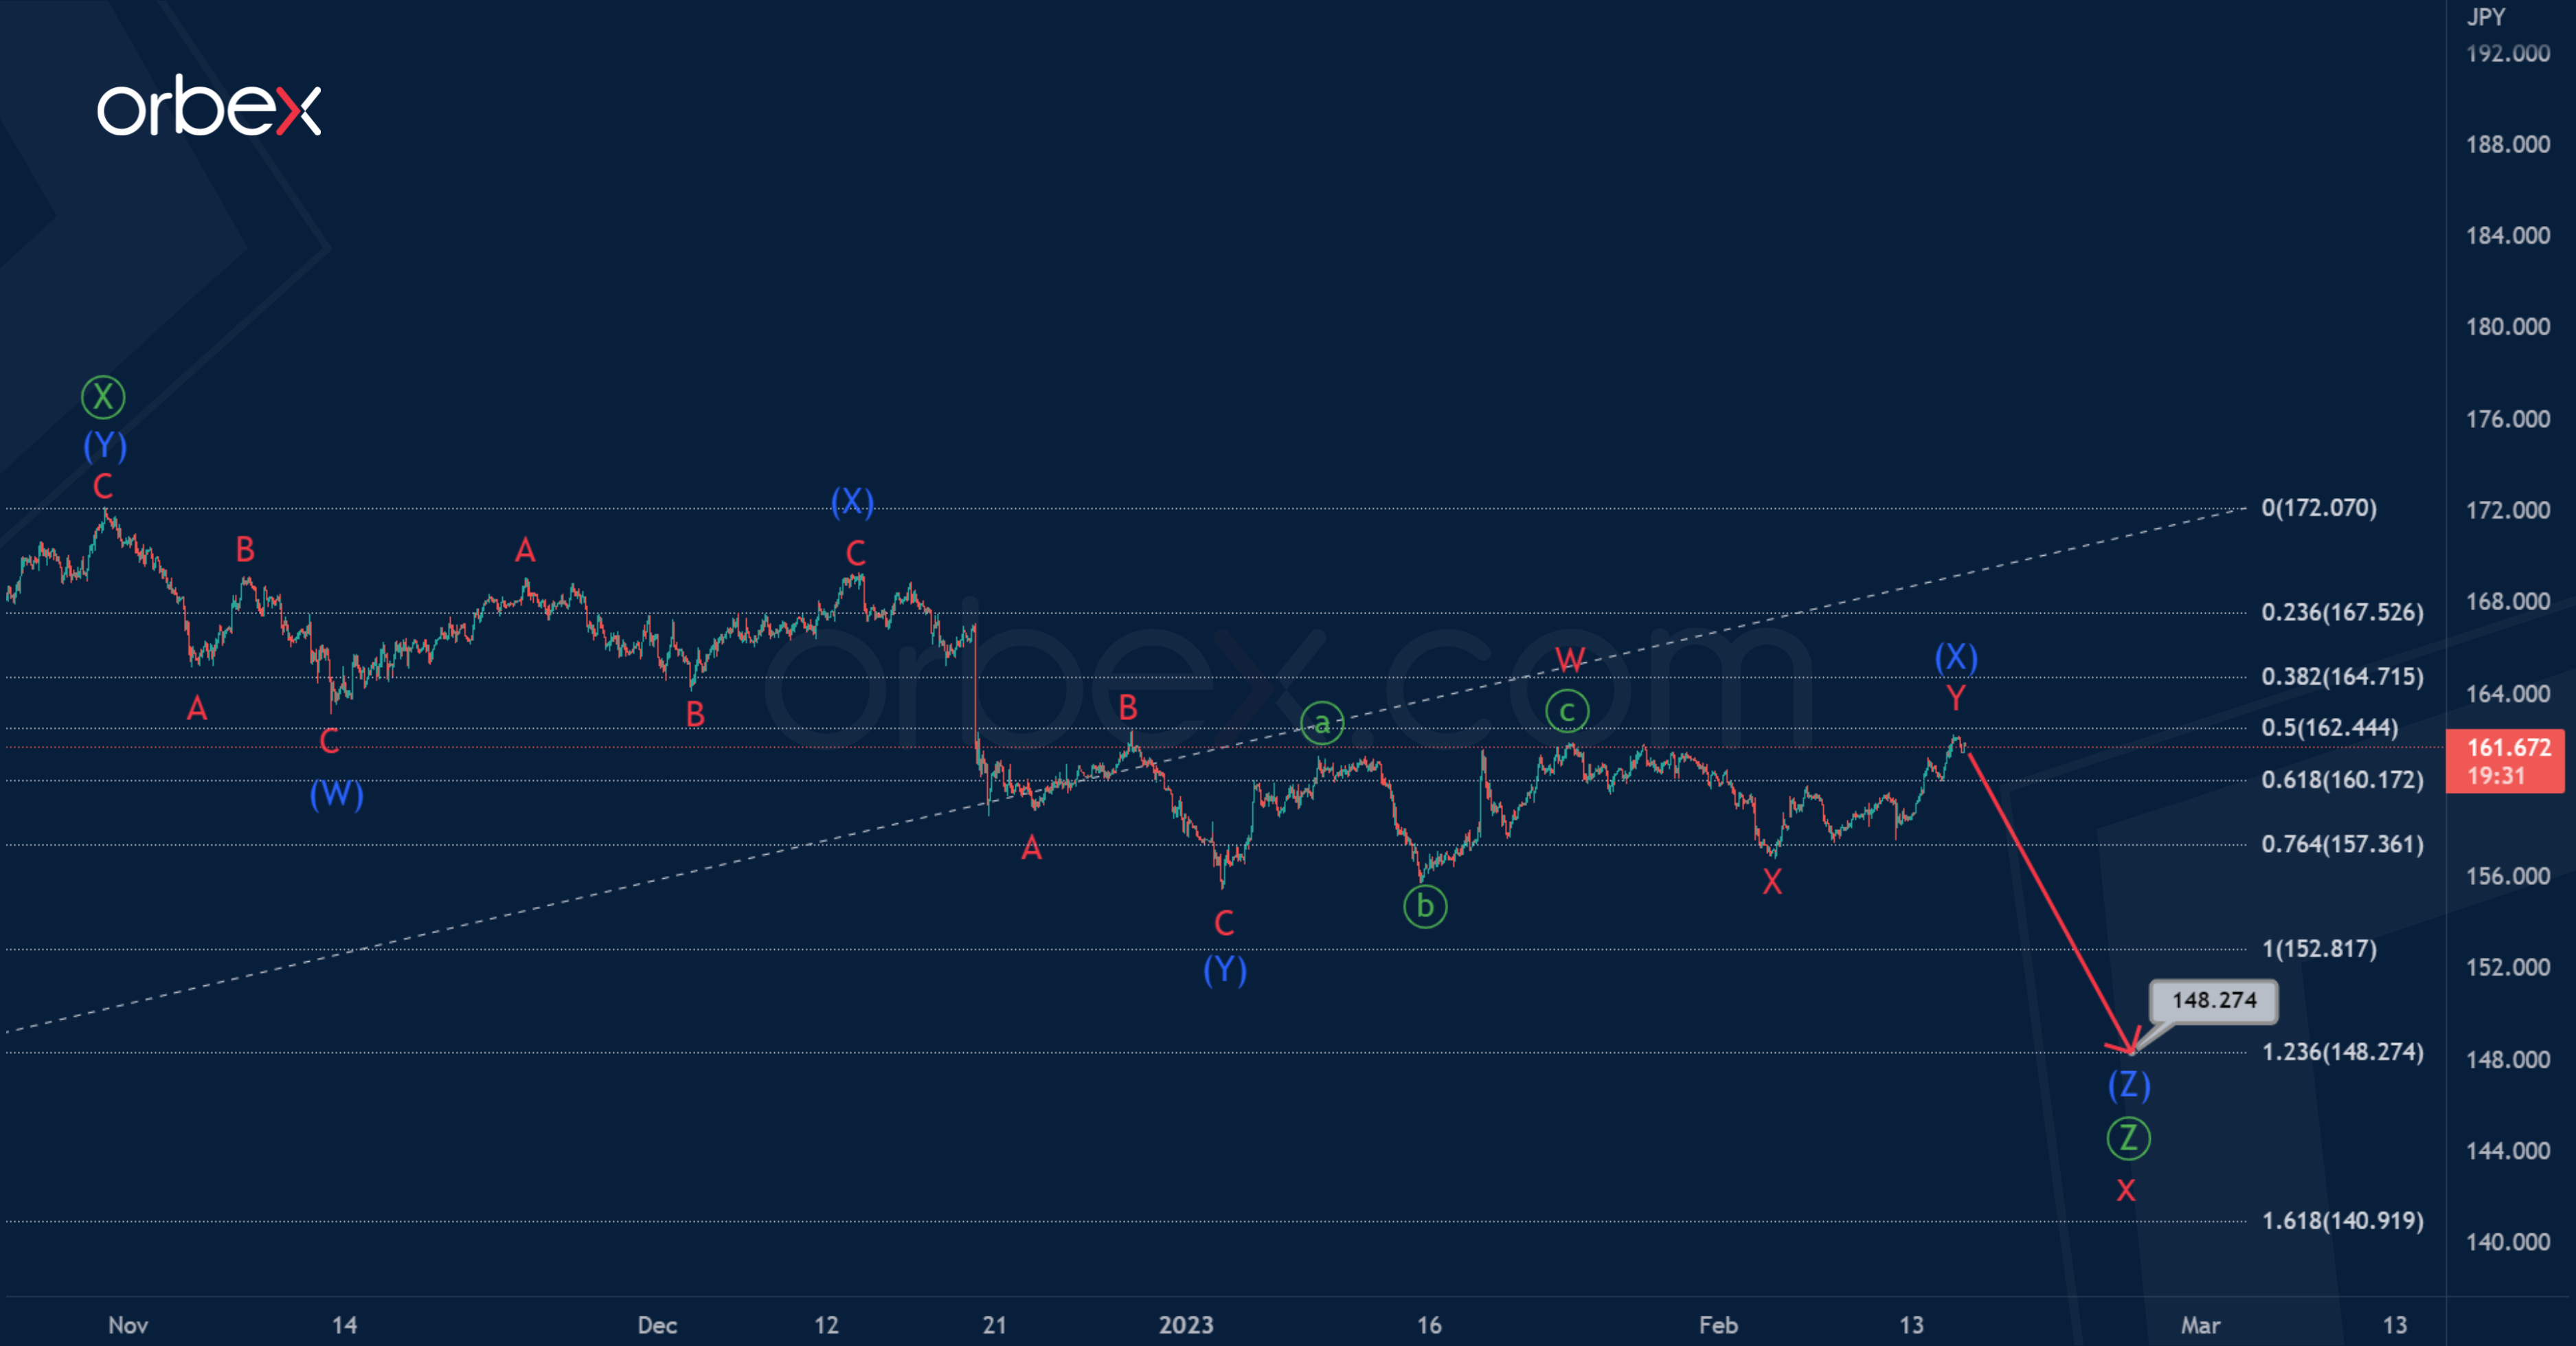
Let’s consider an alternative scenario, as seen above. According to this, a bearish intervening wave x is formed. It can end in the form of a triple zigzag, for the construction of which a final sub-wave Ⓩ is needed.
The current structure of the primary wave Ⓩ suggests an intermediate triple zigzag (W)-(X)-(Y)-(X)-(Z). The first four zigzag sub-waves have already been completed. In the near future, we expect a fall in the sub-wave (Z) to 148.27.
At the specified level, wave Ⓩ will be at 123.6% of actionary wave Ⓨ.
USD/JPY Pair Started a Fresh Increase from 128.20
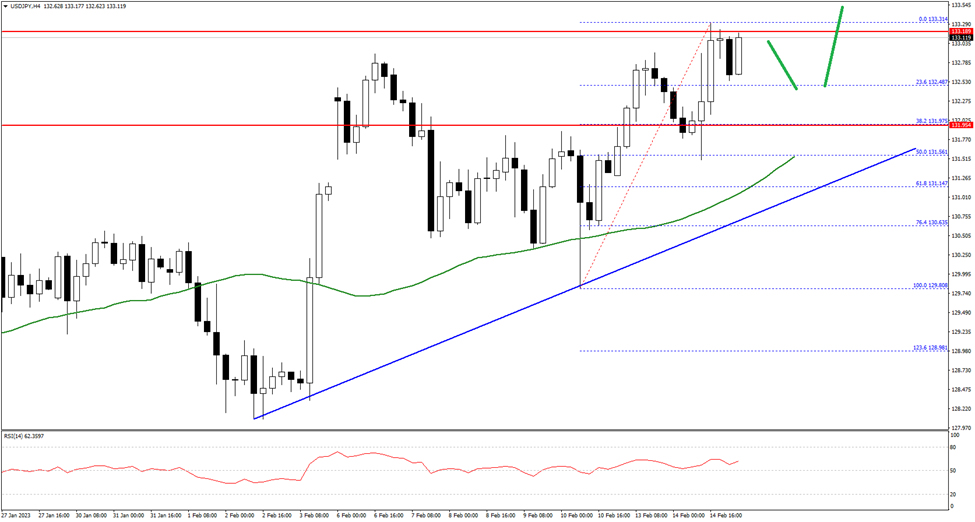
The US Dollar started a fresh increase from the 128.20 support zone against the Japanese Yen. The USD/JPY pair climbed above the 130.00 level to move into a positive zone.
There was a clear move above the 131.20 zone and the 50 hourly simple moving average. The pair is now consolidating above the 132.50 zone. An immediate resistance on the upside is near the 133.30 level.
The next major resistance is near 133.50 on FXOpen. A clear break above the 133.50 resistance could push the price towards 134.00. The next major resistance is near the 134.65 level, where the bears might emerge.
On the downside, an initial support is near the 132.50 zone. The next support sits near the 132.00 zone and a trend line on the hourly chart, below which there is a risk of more downsides towards the 131.20 level.
EURJPY Battles With Upper Boundary of Trading Range
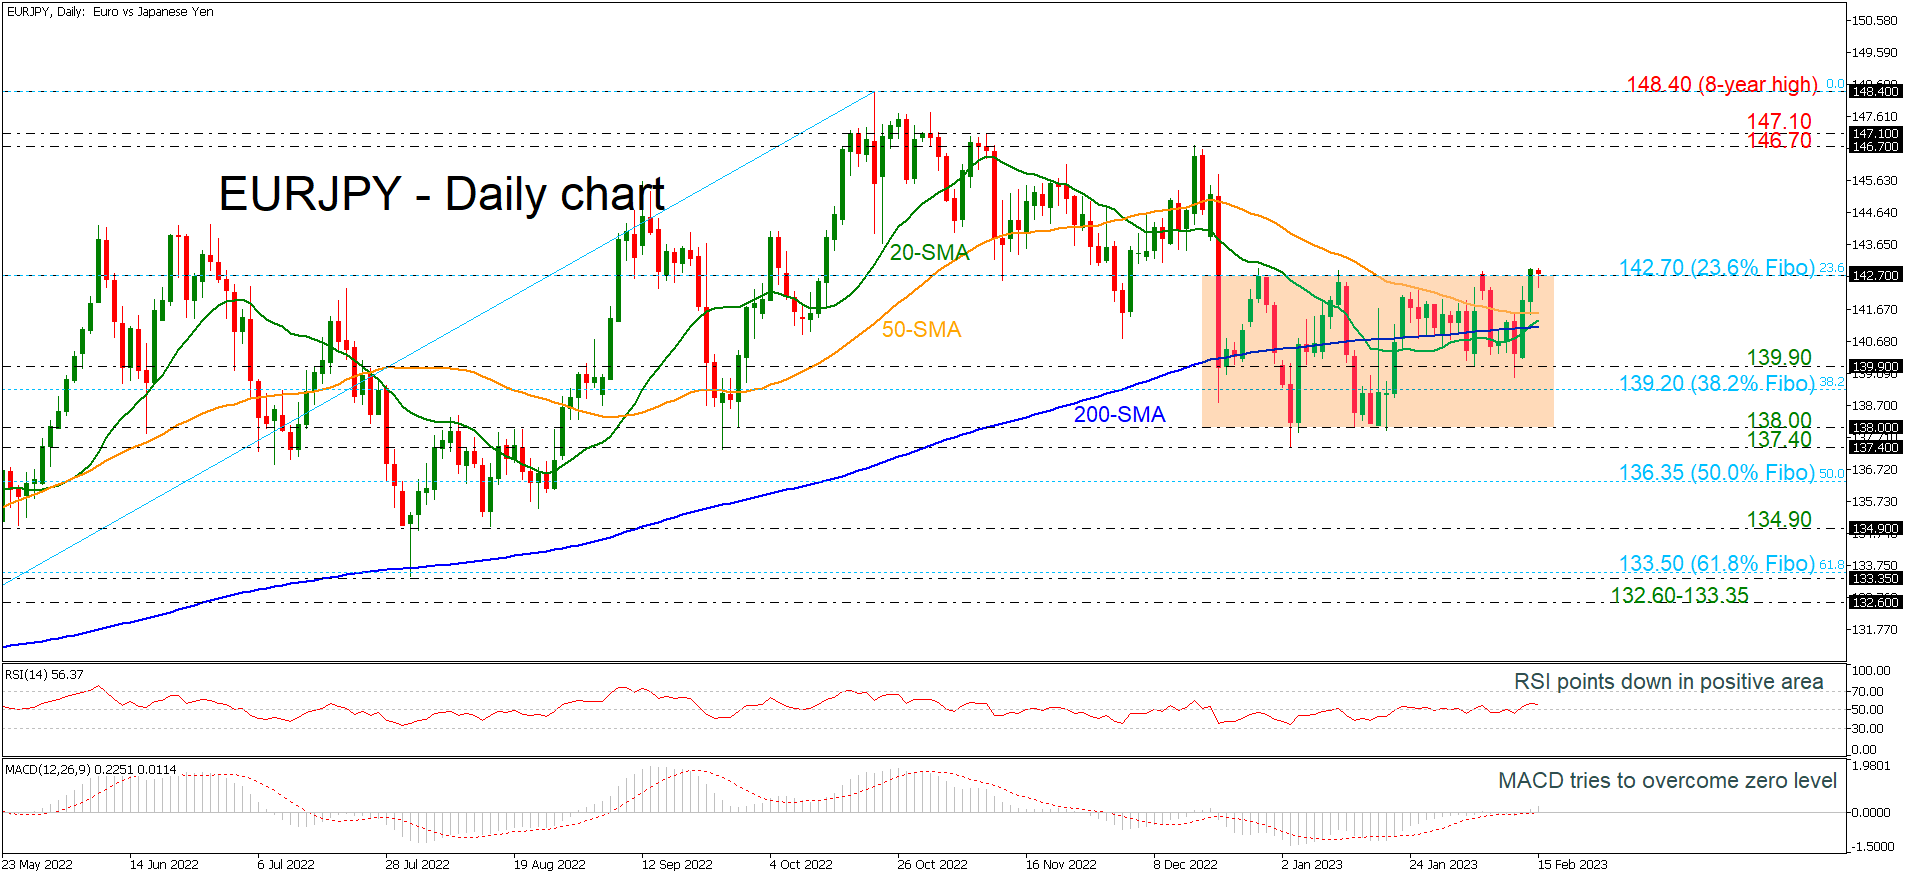
EURJPY is struggling to surpass the upper boundary of the trading range at 142.70, which is also the 23.6% Fibonacci retracement level of the upward wave from 124.40 to 148.40.
In trend indicators, the 20-day simple moving average (SMA) posted a bullish crossover within the 200-day SMA, mirroring the latest rebound off the 139.90 support level. The MACD is extending the positive move above its trigger and zero lines; however, the RSI is pointing down in the bullish territory.
Should the price close decisively above the roof of the channel, seen at 142.70, bulls could extend the upside move towards the 146.70-147.10 resistance area. Further advances could then target the barrier of the eight-year high of 148.40.
On the other hand, a decline could meet the 50-day SMA currently at 141.50 and the bullish crossover of the 20- and 200-day SMAs at 141.10. Slightly lower, the price could retest the middle line of the range approximately at 139.90 before the test of the 38.2% Fibonacci at 139.20. Even lower, the 138.00 psychological mark is a crucial level for a rebound but any moves below it could switch the outlook to negative hitting 137.40 and the 50.0% Fibonacci at 136.35.
All in all, EURJPY shows some signs of bullish movements in the short-term, but it needs to overcome successfully the 23.6% Fibonacci at 142.70.
FTSE 100 Consolidates Gains
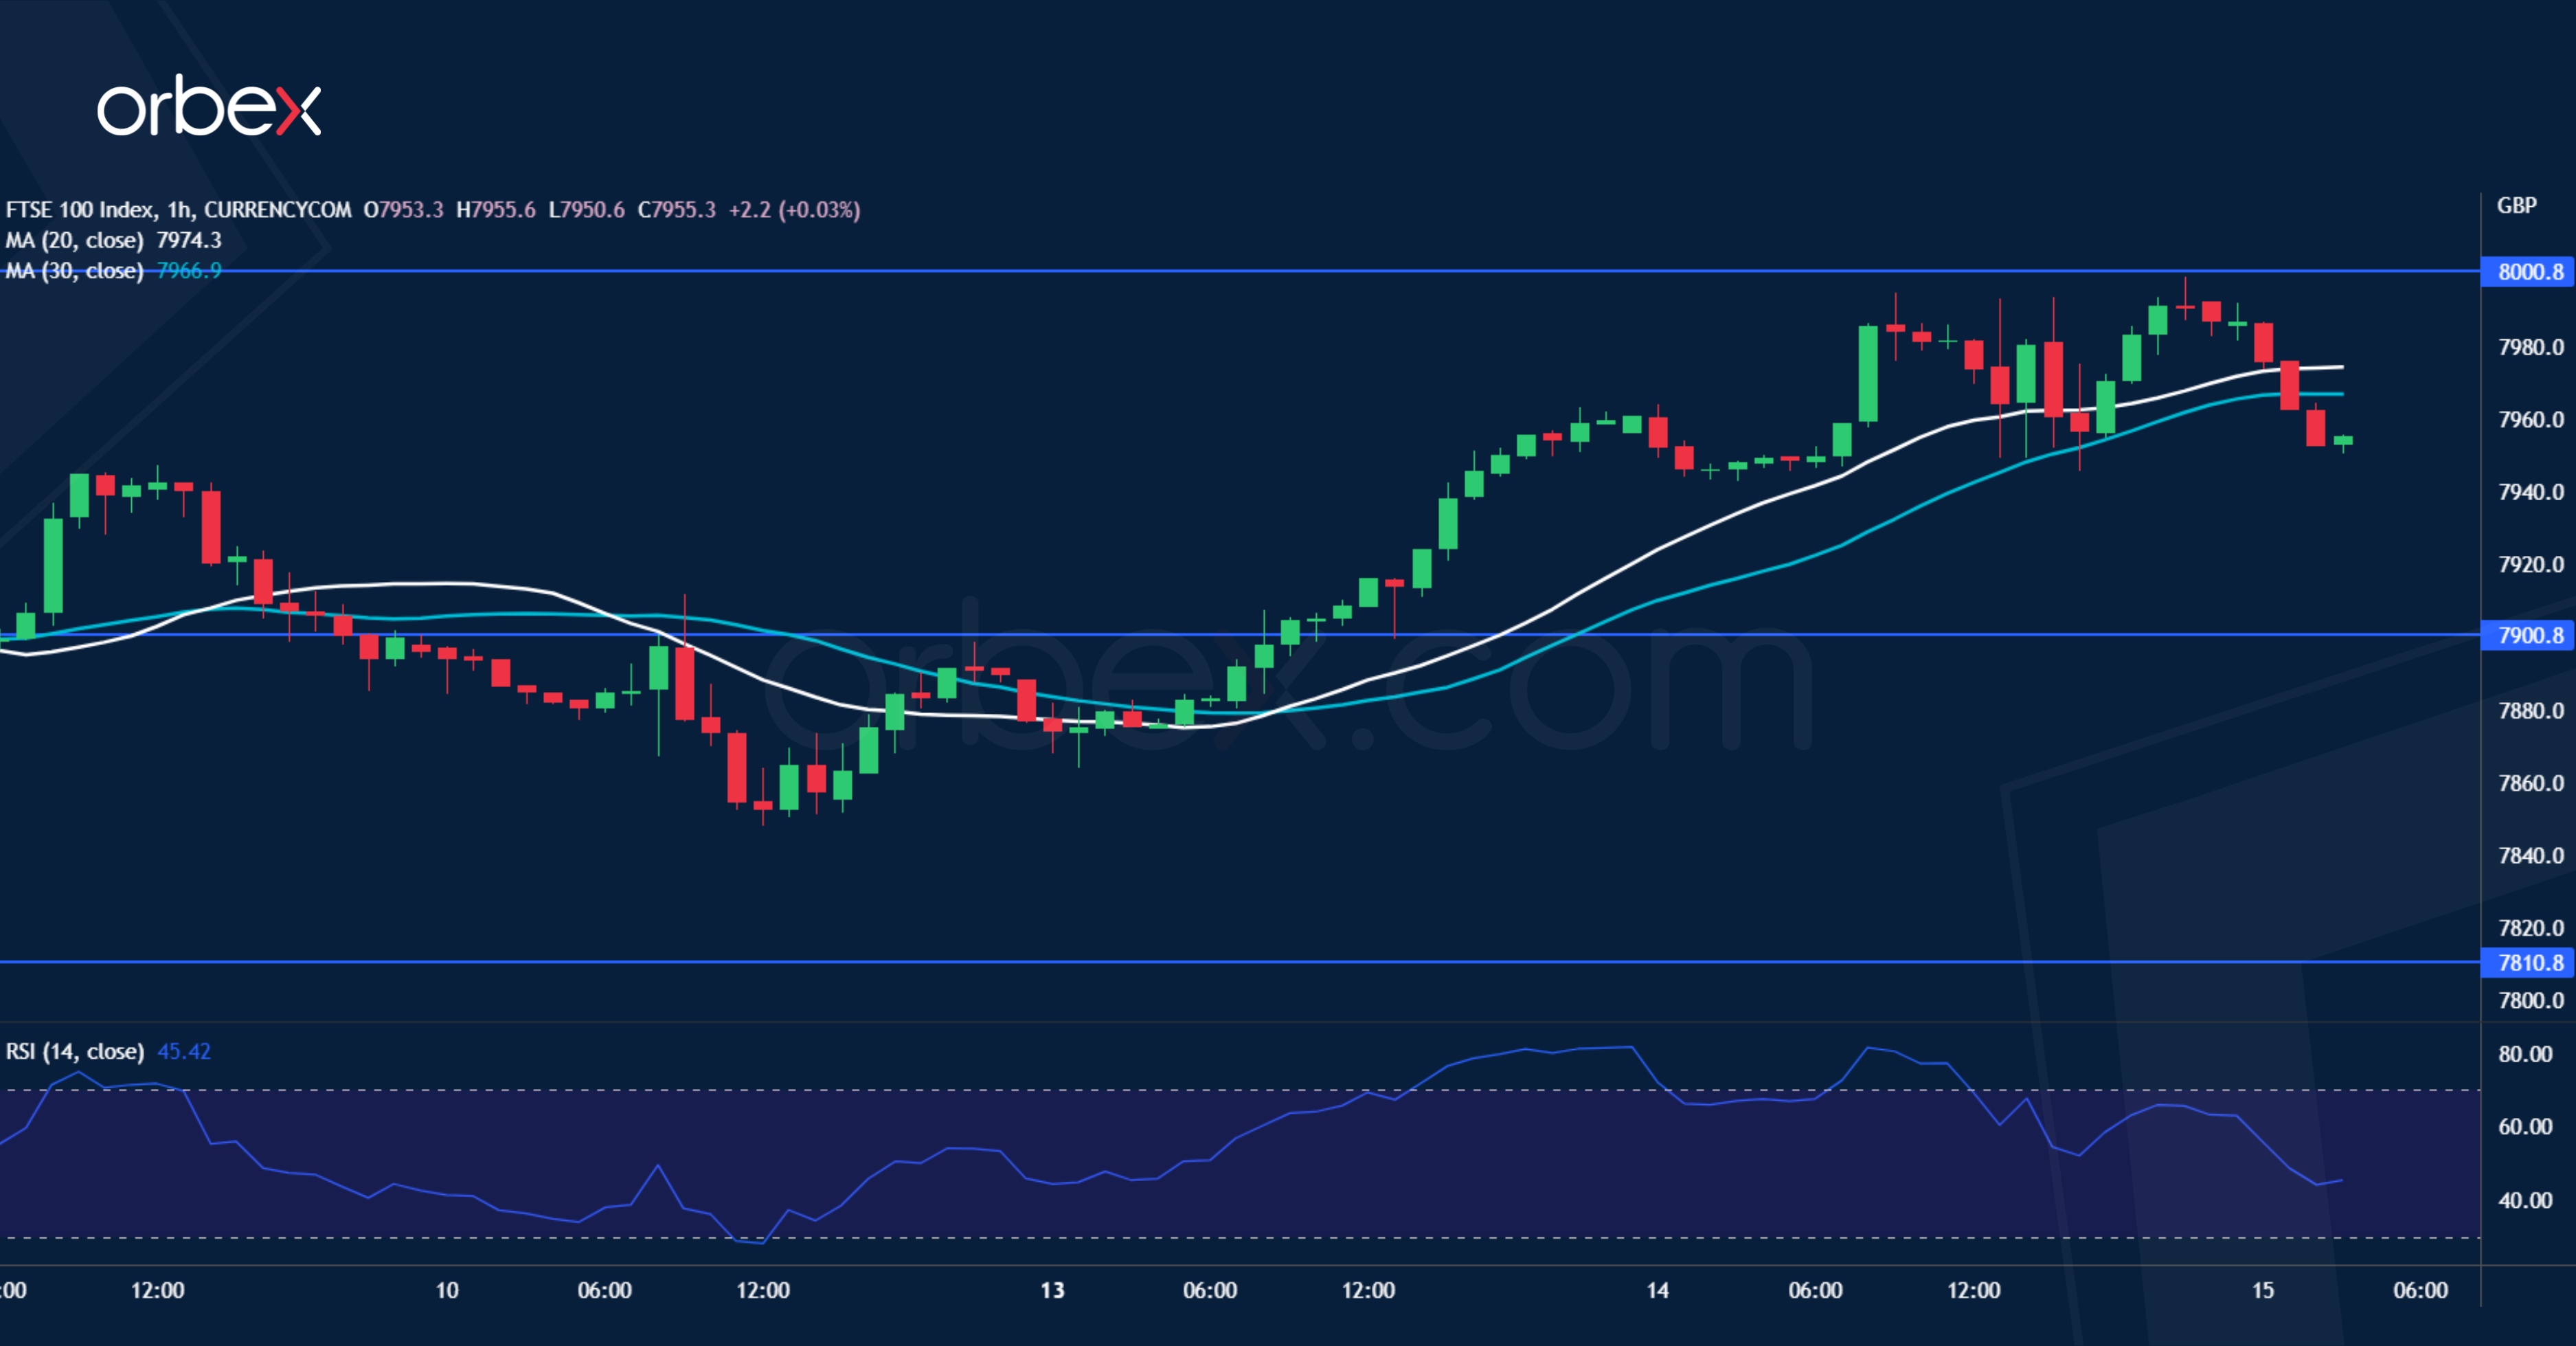
Equities tread water as stubborn inflation tempers the hope that the Fed could pause rate hikes. Still, the FTSE 100 remains on an upward trajectory after bouncing off the 20-day SMA on the daily chart. This is a strong sign that the uptrend has resumed in the medium-term. But the short-term price action could struggle with the hourly RSI showing signs of overextension as the index reaches the round number 8000. A pullback would allow the bulls to catch their breath and 7900 will be the first level to be tested.