Sample Category Title
Australia January Labour Force; As Illness Fades More Than Usual Go On Holidays
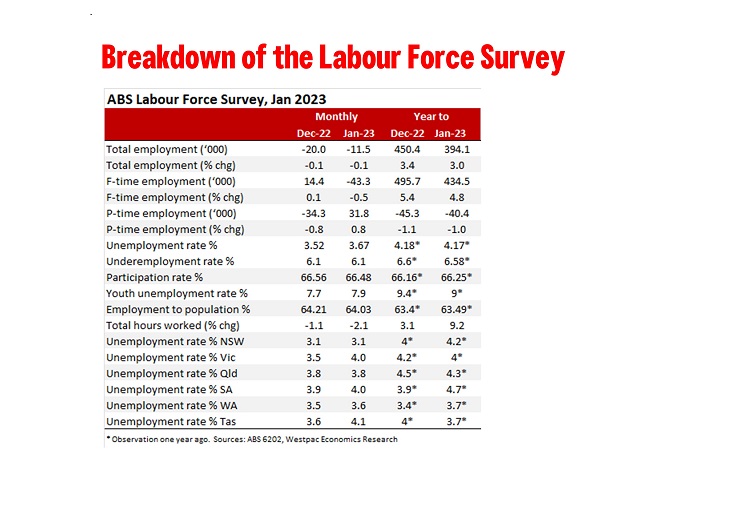
Total employment: -11.5k from -20k (revised from -14.6k); unemployment rate: 3.7% from 3.5% (unrevised 3.5%); participation rate: 66.5% from 66.6% (unrevised 66.6%). We had expected a softening in employment growth through 2023 and as the ABS suggests the recent softer than expected outcomes are due to one off factors associated with annual leave and illness we have not revised our forecast for unemployment be around 4¾% by end 2023.
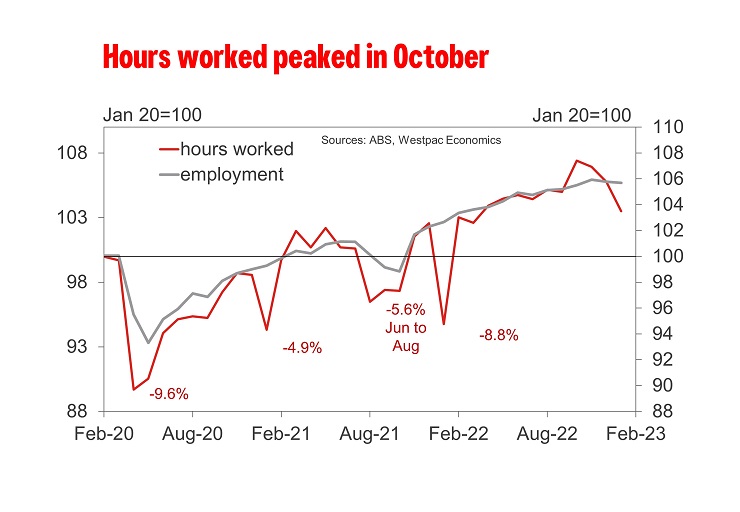
Total employment fell almost 12k in January following on from a 15k decline in December shifting the three-month average change in employment from 45k in November to 33k in December then down to 1k in January. Annual growth in employment has moderated from 6.8%yr in October to 3.4%yr in December then 3.0%yr in January highlighting a significant step down in the pace of employment growth.
The employment to population ratio fell 0.2ppt to 64.0% in January. While it is still 0.5ppt higher than January 2022 it is also consistent with the moderation in the annual pace in employment growth. The annual change in employment to population peaked at 2.9ppt in October moderating to 0.8ppt in December then down to 0.5ppt in January.
While we agree that there has been a clear step down in employment growth, something we expected to see as the surge out of the COVID recovery lost momentum, the big question for us is: should we take this significant shift in employment growth at the end of 2022 and in early 2023 as the start of new softer trend, or even a correction in employment, despite business and household surveys still pointing to robust labour demand?
We don’t think so, as the ABS noted some factors that would make you want to see more data before you accept the past few months being indicative of a new softer trend.
The ABS noted that along with a larger-than-usual increase in unemployment in January, there was also a similarly larger-than-usual rise in the number of unemployed people who had a job to go to in the future. January is the most seasonal month of the year (employment fell 343k in original terms) with people not just leaving jobs but also getting ready to start new jobs or return from leave. In January 2023 the ABS noted that more people than usual with a job, indicating they were starting or returning to work later in the month.
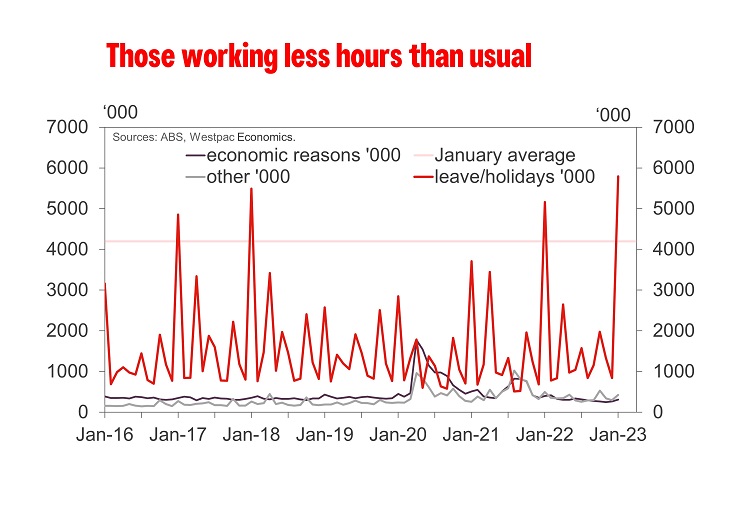
And as we suspected in our preview there was a greater than usual ‘holiday effect’ while the rate of illness improved from December. Seasonally adjusted monthly hours worked declined 2.1% which reflected a higher-than-usual number taking annual leave in January. Early January is the seasonal peak in people taking annual leave. As in 2021 and 2022, January 2023 again saw more than usual taking annual leave with around 43% of those employed working reduced or no hours because they were on leave, compared with around 41% of those employed over the same period before the pandemic.
In January 2023, the proportion of people away from work on sick leave was back around the average, pre-pandemic level, unlike January 2022, when more people than usual were away from work on sick leave.
By state, it is interesting that the unemployment rate lifted in all states expect for NSW and Qld. The unemployment rate was flat in NSW, well below the national average of 3.7%, but we should note that NSW employment contracted 5.1k in January on the back of a 17.2k contraction in December. Unemployment was also flat in Qld at 3.8%, higher than the national average, which is interesting given that employment lifted 17.6k in January in that state.
The unemployment rate lifted to 4.0% from 3.5% in Victoria, it rose from 3.9% to 4.0% in SA and from 3.5 to 3.6% in WA.
Bitcoin Extending Higher in Impulsive Elliott Wave Structure
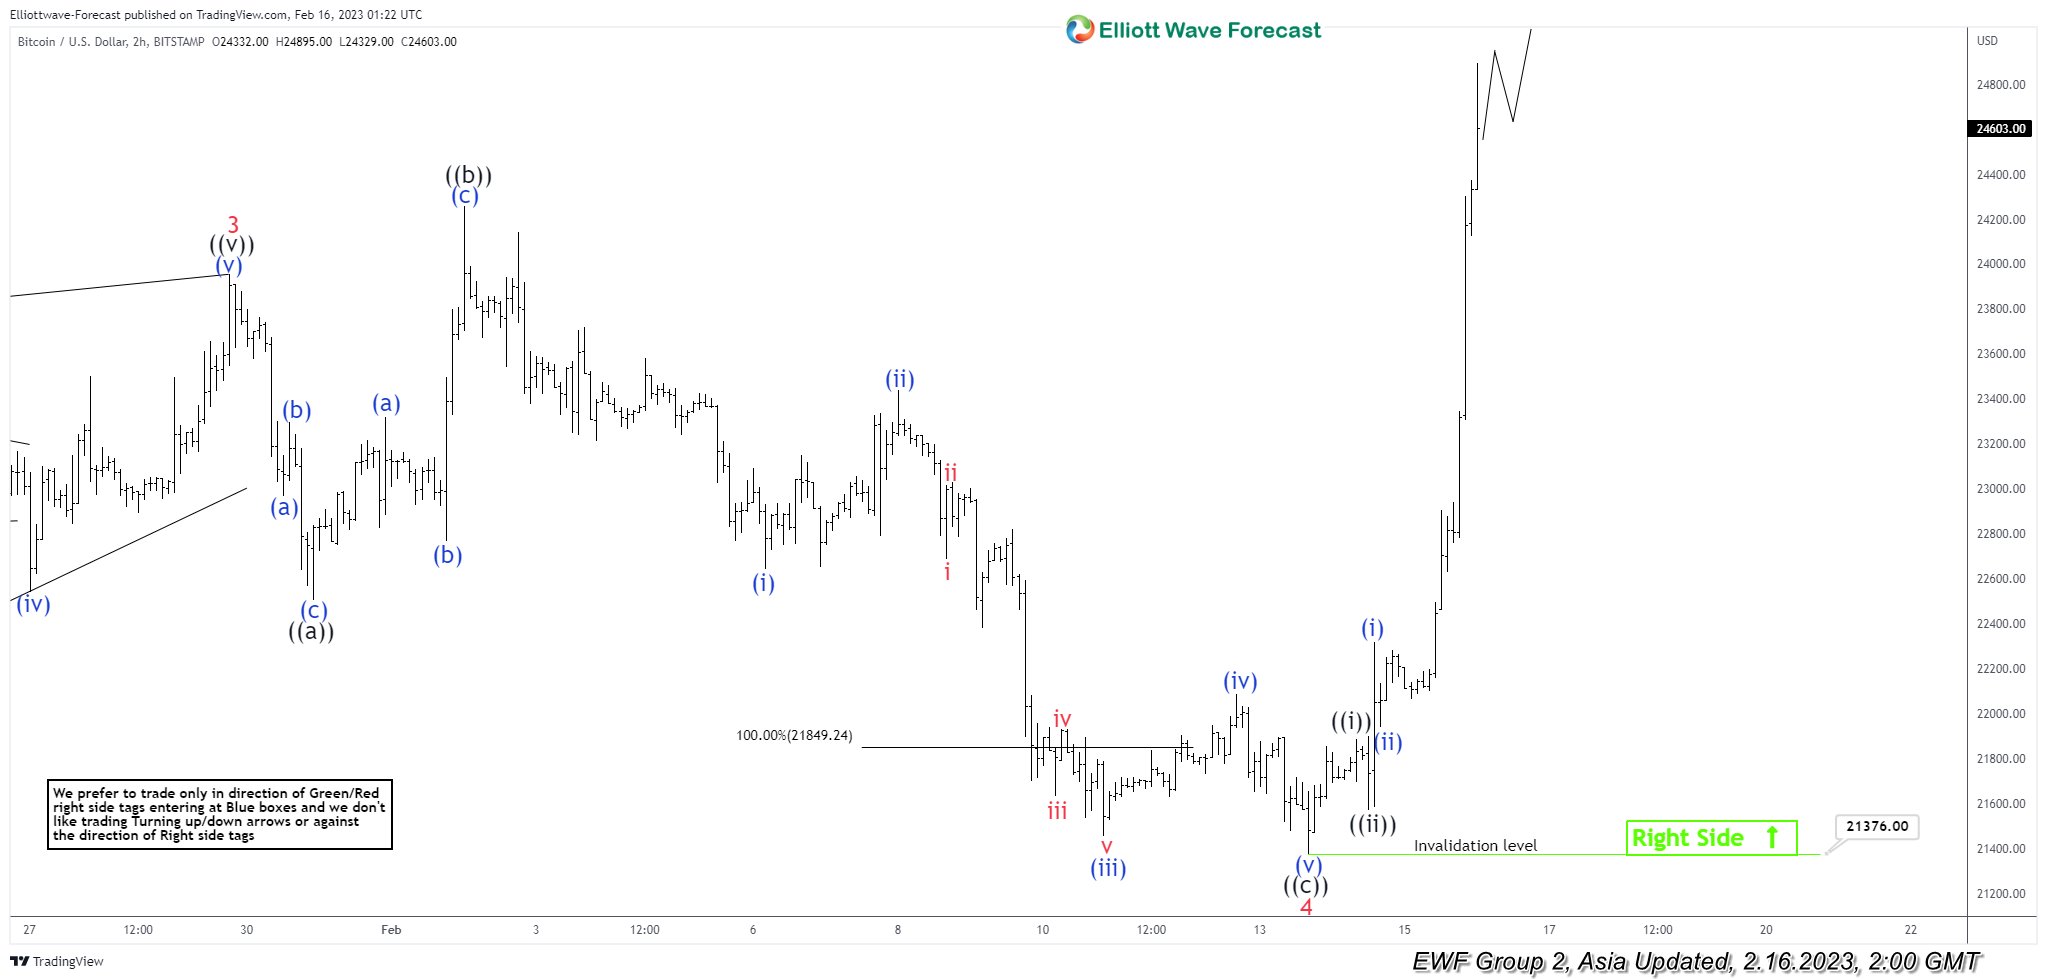
Cycle from 11.22.2022 low is in progress as a 5 waves impulse Elliott Wave Structure. Up from 11.22.2022 low, wave 1 ended at 18373 and pullback in wave 2 ended at 16293. The crypto-currency then extends higher in wave 3 towards 24258 and pullback in wave 4 ended at 21396.16. Internal subdivision of wave 4 unfolded as an expanded flat as the chart below shows.
Down from wave 3, wave ((a)) ended at 22504 in 3 swing. Rally in wave ((b)) ended at 24258 also in 3 swing. Wave ((c)) lower ended at 21396.16 in 5 waves. Down from wave ((b)), wave (i) ended at 22643 and wave (ii) ended at 23439. Wave (iii) ended at 21454, wave (iv) ended at 22086, and final leg lower wave (v) ended at 21396.16 which also completed wave ((c)) and 4 in higher degree. Bitcoin has since turned higher in wave 5. Up from wave 4, wave ((i)) ended at 21885 and pullback in wave ((ii)) ended at 21582. Expect dips to find support in 3, 7, or 11 swing and Bitcoin to extend higher as far as pivot at 21396.16 low stays intact
Bitcoin (BTCUSD) 2 Hour Elliott Wave Chart
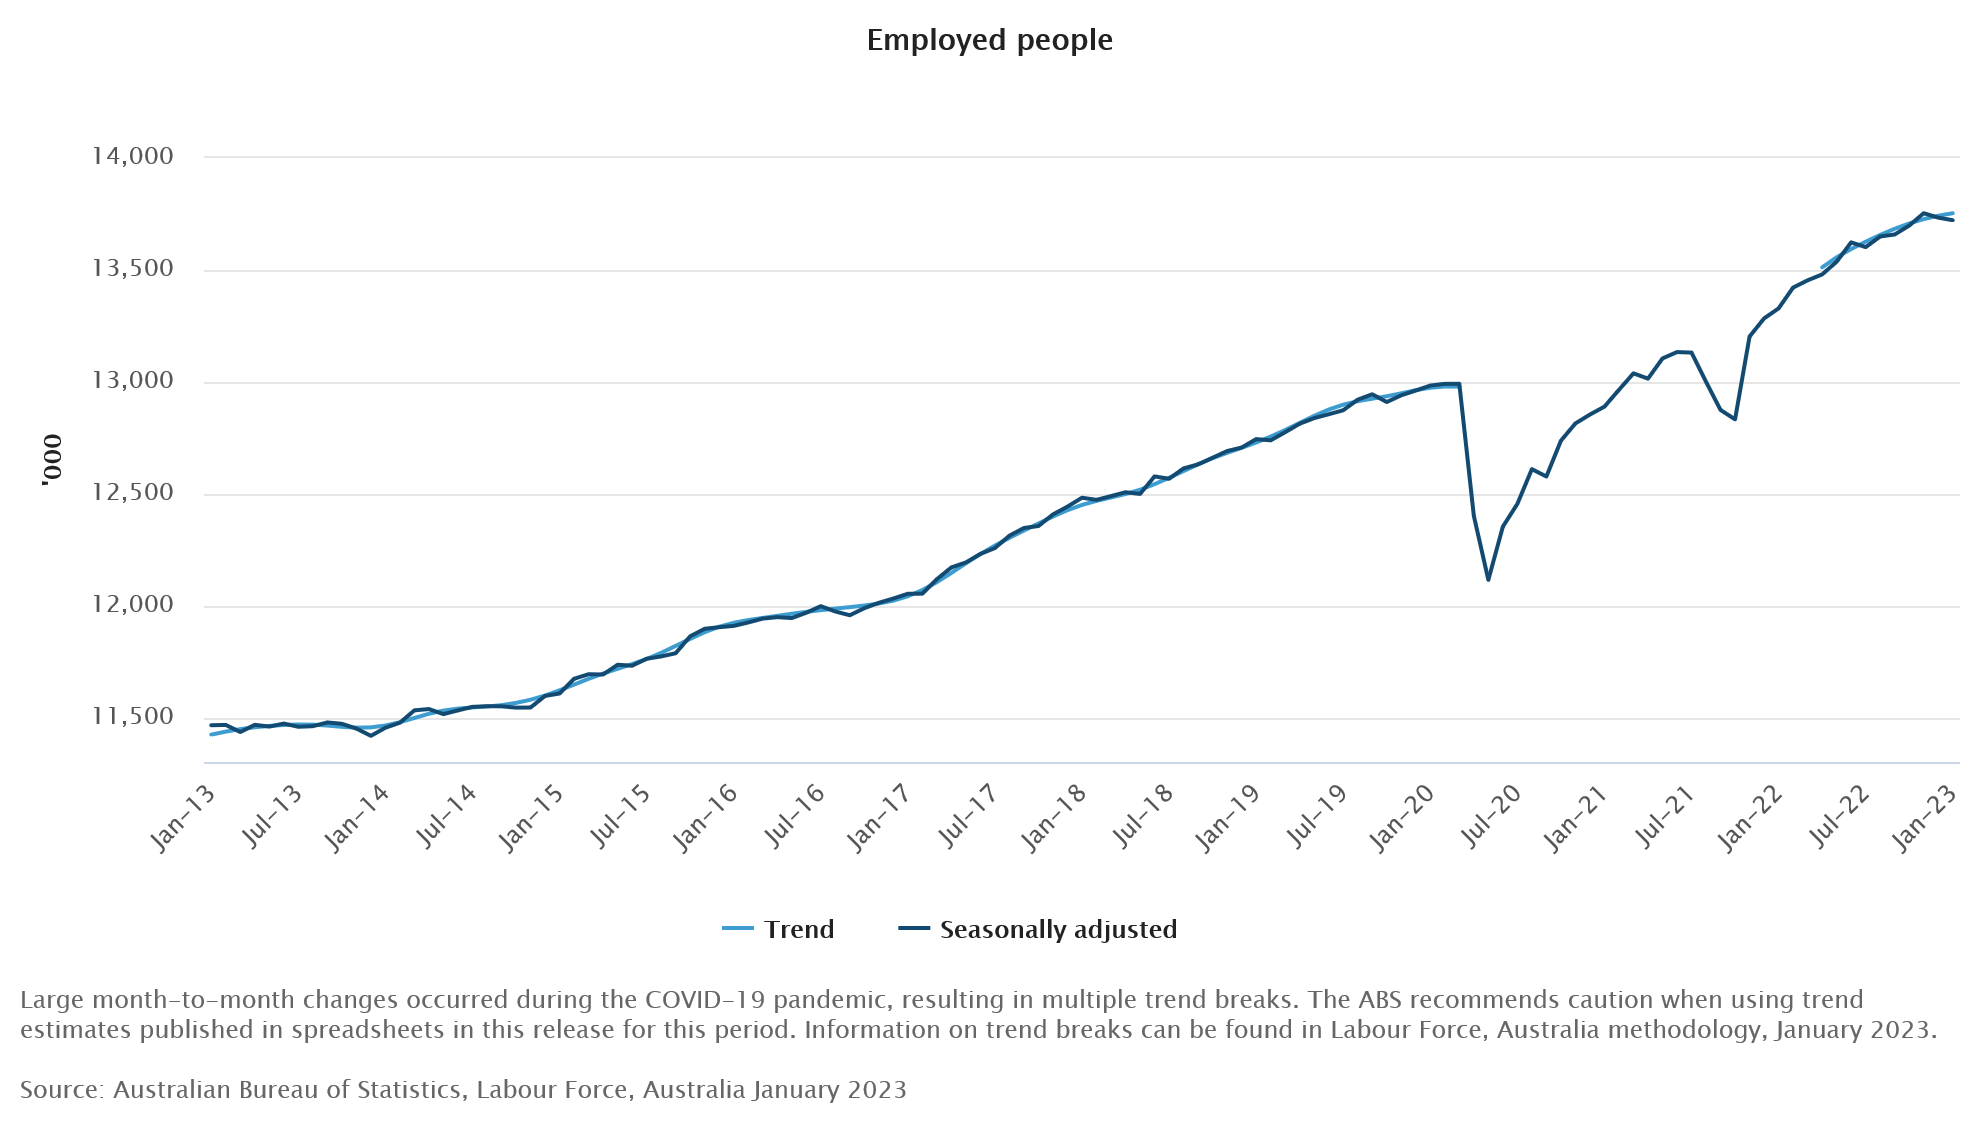
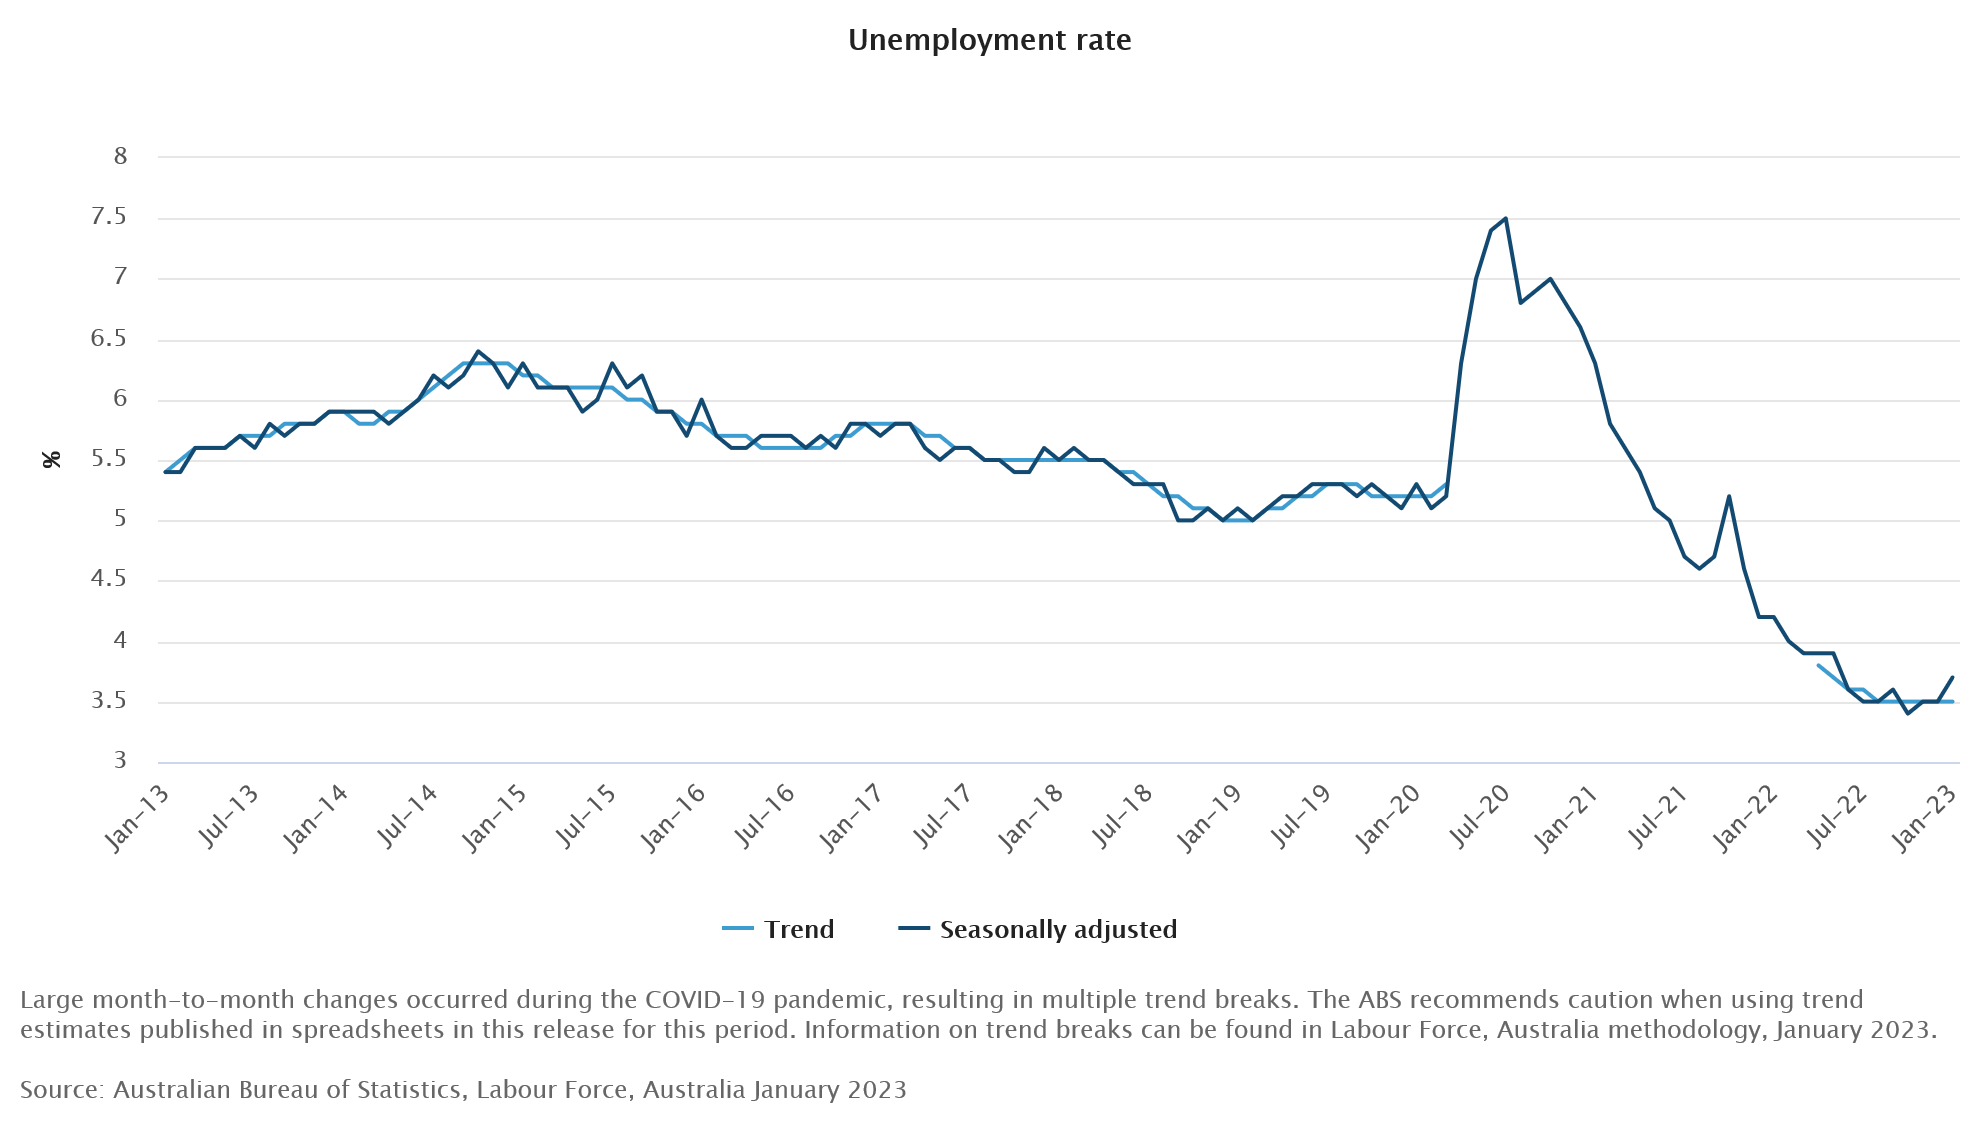
Australian employment down -11.5k in Jan, unemployment rate rose to 3.7%
Australia employment contracted -11.5k or -0.1% mom in January, worse than expectation of 20k growth. Unemployment rate rose from 3.5% to 3.7%, above expectation of 3.5%. Participation rate dropped from 66.6% to 66.5%. Monthly hours worked dropped -2.1% mom.
ABS noted: Along with a larger-than-usual increase in unemployed people in January, there was also a similarly larger-than-usual rise in the number of unemployed people who had a job to go to in the future.
Bjorn Jarvis, ABS head of labour statistics said: "January is the most seasonal time of the year in the Australian labour market, with people leaving jobs but also getting ready to start new jobs or return from leave. This January, we saw more people than usual with a job indicating they were starting or returning to work later in the month."
Japan posts record monthly trade deficit as exports to China tumbled
Japan goods exports rose 3.5% yoy to JPY 6551B in January, better than expectation of 0.8% yoy, but much worse than prior month's 11.5% yoy. Exports to China fell -17.1% yoy on cars, car parts and chip-making equipment. Exports to the US were up 10.2% yoy. Exports to Europe ere up 9.5% yoy.
Imports rose 17.8% yoy to JPY 10048B, below expectation of 18.4% yoy and prior month's 20.7% yoy. Import growth was boosted by coal, liquefied natural gas and crude oil,
Trade deficit came in at JPY -3497B.The monthly deficit was the largest on record going back to 1979.
In seasonally adjusted term, exports dropped -6.3% mom to JPY 7788B. Imports dropped -5.1% mom to JPY 9609B. Trade deficit was largely unchanged at JPY -1821B.
ECB Lagarde: We intend to hike by 50bps in March
In a speech to the European Parliament, ECB President Christine Lagarde reiterated that "we intend to raise interest rates by another 50 basis points at our next meeting in March", and the "evaluate the subsequent path". Future policy decisions will continue to be "data-dependent" and follow a "meeting-by-meeting approach".
While headline inflation moderated to 8.5% as shown in January flash estimate, "price pressures remain strong and underlying inflation is still high" with core inflation at 5.2%. "Even though most measures of longer-term inflation expectations currently stand at around 2%, these measures warrant continued monitoring."
Risks to growth outlook are "now more balanced" than they were in December. Russia's war against Ukraine continues to be a "significant downside risk". But "faster resolution of the energy shock would support growth". Risk to inflation outlook "have also become more balanced, especially in the near term."
What Does the Current Yield Curve Inversion Tell Us About Future Asset Performance?
Economists and market participants enjoy identifying indicators that, according to their analysis, reveal the future economic performance. Among the plethora of such indicators, the inverted 2-year/10-year (2s10s) US yield curve holds a special place in their hearts as it has predicted the most recent recessions. At the moment, the 2s10s US curve trades at an extremely inverted level that has been seen only twice in the past 40 years. What were the economic conditions that led up to this inversion in these two occasions, and what was the market performance after this inversion?
Curve inversion at extreme levels
Before delving into our findings, we have to acknowledge the fact that the period since December 2008, when the first Fed QE programme was implemented, has not been beneficial to the price discovery mechanism. Interventions by the key central banks globally have clearly distorted market pricings. Having said that, the US 2s10s curve is currently trading below -75 bps. This level of inversion was recorded in just two instances the past 40 years, in 1982 and the 2000. These periods are quite dissimilar when examining the economic conditions leading up to the curve inversion.
First instance: February 17, 1982
This period resembles a lot what the world has been going through for the past 1.5 years. Following the 1979 events in the Middle East, oil prices skyrocketed, pushing headline and core inflation rates to record highs. The then Fed Chairman Volcker tried to squeeze inflation by hiking rates, but two recessions took place during the January 1980-November 1982 period. The key difference with today's situation is that in 1982 Fed officials were facing double-digit unemployment rates, the highest since 1941. Currently, unemployment rates are close to record low levels in most countries.
Second instance: May 4, 2000
The dotcom bubble burst in March 2000, which wiped out $5 trillion from stock markets’ capitalization, was one of the key culprits for the curve inversion. The aggressive hikes and the September 11, 2001 events pushed the US to a recession. It was relatively short-lived, from March 2001 to November 2001, and the economic impact in both inflation and unemployment was limited, a completely different situation to the one experienced now globally.
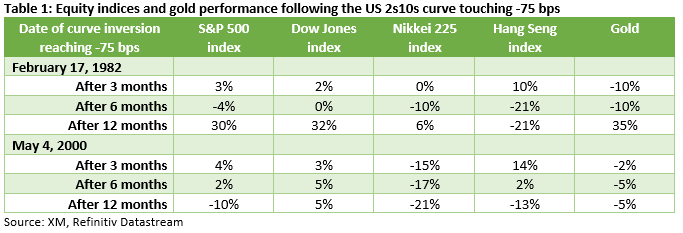
Performance three, six and 12 months after the curve inversion hit the -75 bps level
We have selected the specific level in order to identify the true points of severe curve inversion, and have analysed the performance of key assets in both the 1982 and 2000 periods. Table 1 above shows our findings for four stock indices and gold in an attempt to uncover common trends. The Dow Jones index appears to have positive performance in both periods and across the timeframes examined. Zooming in to specific timeframes, we can see a tendency by both the Nikkei 225 index and gold to underperform three and six months after this severe market inversion take places. Finally, the Hang Seng index appears to rally in the first three months post the curve inversion, but it underperforms significantly at the 12-month timeframe in both 1982 and 2000 periods.
FX and yield performance: common themes arising
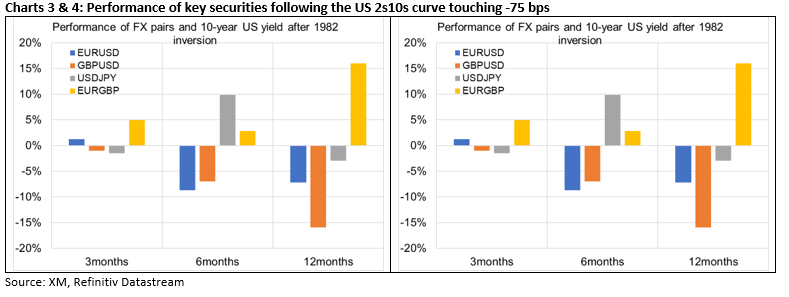
The 10-year US treasury yield is seen dropping in both periods and across the timeframes examined. The drop was more significant in 1982, but the 10-year yield was trading closer to 14.5% back then. Interestingly, the picture is much clearer in the FX world. Both the dollar and euro are seen outperforming sterling across the three, six and 12 months examined and in both the 1982 and 2000 periods, reflecting a lack of confidence for the UK in crisis times. Overall, our findings clearly point to dollar outperformance, which is not unexpected considering the safe-haven flows taking place in such periods.
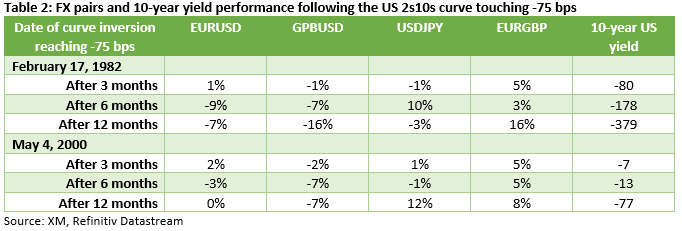
To sum up, the US 2s10s yield curve is trading at extreme inverted levels only seen twice in recent history, in 1982 and 2000. In both periods a recession ensued, justifying the perceived predictive ability of the curve inversion. We had a look at the performance of key securities in the main asset classes post this severe curve inversion and four themes have emerged: 1) the dollar tends to outperform against the remaining major currencies, 2) the euro records gains against sterling, partly confirming its status as the second reserve currency, 3) the 10-year US yield appears to drop aggressively after the acute inversion is recorded, and 4) Dow Jones appears to have positive performance in both periods and across the timeframes examined.
What Does the New BoJ Governor Mean for Yen?
On February 14, the Japanese government officially nominated Kazuo Ueda for taking the helm at the Bank of Japan when Haruhiko Kuroda steps down in April. This has left investors scratching their heads to figure out whether and when the BoJ will scale back its ultra-loose monetary policy as inflation continues to creep up. What does the new Governor mean for the financial community and how might the yen perform hereafter?
Kazuo Ueda set to succeed Governor Kuroda
At its December gathering, the Bank of Japan decided to adjust its yield curve control policy for the first time since March 2021. Officials decided to widen the range of the target band on the 10-year JGB yield from ±25 to ±50 basis points around 0%, which raised massive speculation that the Bank may have started its own tightening crusade at a time when other major central banks, like the Fed, are getting closer to the exit.
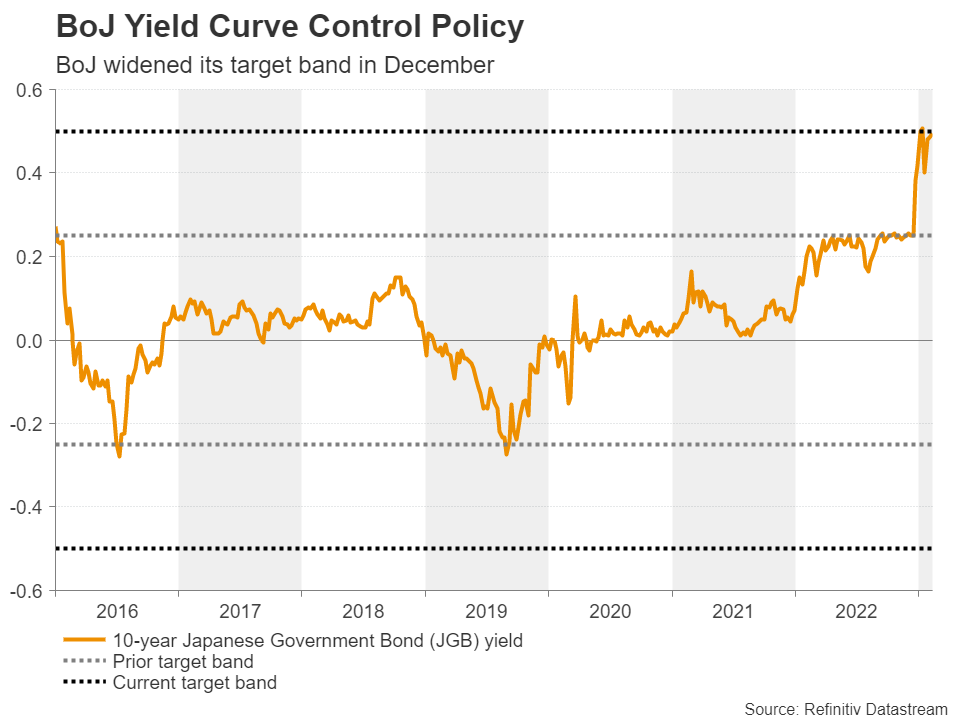
That said, policymakers themselves poured cold water on such expectations at the January gathering, when they decided not to further tweak their yield curve control policy. Rumors that BoJ deputy governor Masayoshi Amamiya, an outright policy dove, will be Kuroda’s successor disappointed yen bulls further and combined with a spectacular jump in US payrolls, this resulted in a rally in dollar/yen.
Just last Friday, the pair pulled back as the yen regained some ground on the first rumor that Ueda will instead be the government’s choice. Traders jumped to the conclusion that he was very unlikely to be as dovish as Amamiya, but they were quickly disappointed again after Ueda said that the current monetary policy remains appropriate.
Perhaps he tried to avoid expressing his personal opinion or making any bold policy comments before he was officially nominated. The government also nominated Ryozo Himino, a former head of Japan’s banking watchdog, and BoJ executive Shinichi Uchida as deputy governors. The nominations still need approval from the Japanese parliament, but with the ruling coalition holding solid majorities in both chambers, it seems like a done deal.
A hawk or a dove?
So, who is Ueda and what does his nomination mean for the BoJ? Kazuo Ueda is an academic with a PhD from the Massachusetts Institute of Technology (MIT). People who know him say that he is a pragmatic policymaker-type academic, who will be willing to adjust according to the needs of the economy. They say that he is a listener and a consensus builder rather than a person with a strong view and a hard line on monetary policy. This makes it hard to categorize him as either a hawk or a dove.
In a column he published last July, Ueda argued against raising interest rates prematurely, but he highlighted the difficulty of maintaining yield curve control as inflation bites harder and pointed to the flaws of this policy. This may be a first sign that he may not be in a rush to take interest rates out of negative territory, but also that he may not hesitate to scrap yield curve control policy entirely should economic conditions warrant so.
Inflation continues to accelerate, wage growth spikes
Regarding Japan’s economy, the country dodged a recession in Q4, as it returned to expansion after contracting in Q3. However, growth was slower than expected as business investment slumped, suggesting that phasing out loose monetary policy conditions may not be an easy task for the Bank of Japan.
Having said that, though, inflation accelerated to 4% in December in both headline and core terms, which is double the BoJ’s objective of 2% and the highest in 41 years, while the acceleration in the Tokyo CPIs for January keeps the risks tilted to the upside.
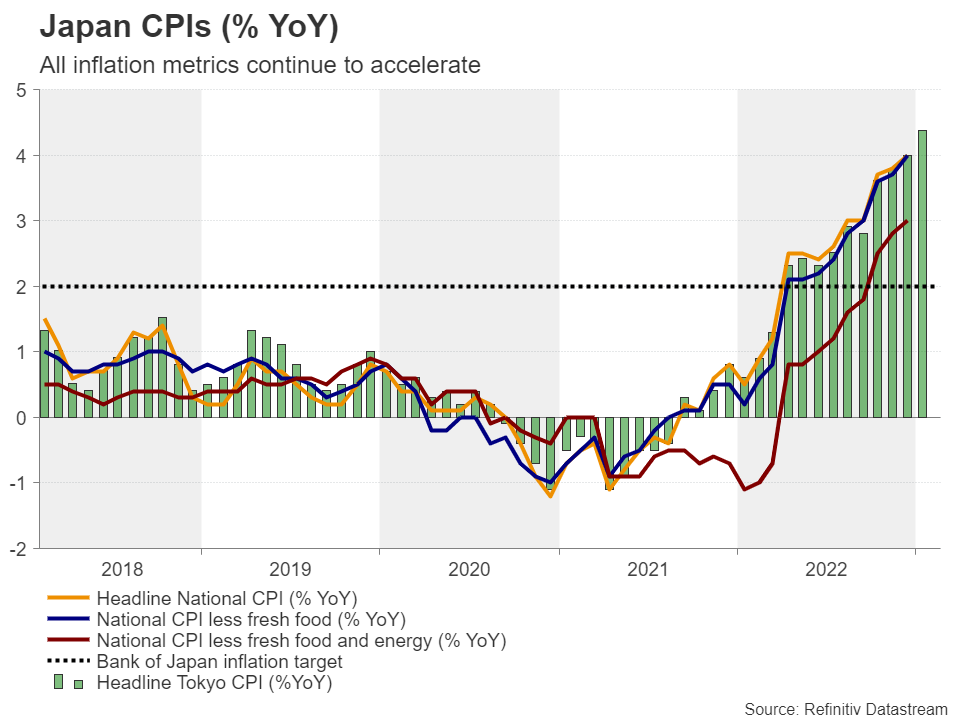
The elephant in the room, however, may be the surge in December’s total cash earnings by 4.8% y/y, the fastest pace in 26 years, which led to the first increase in real wages since March despite accelerating inflation. With Governor Kuroda repeatedly stressing the need to keep ultra-loose policy until wages increase by around 3%, it seems strange that the yen did not respond to this data point.
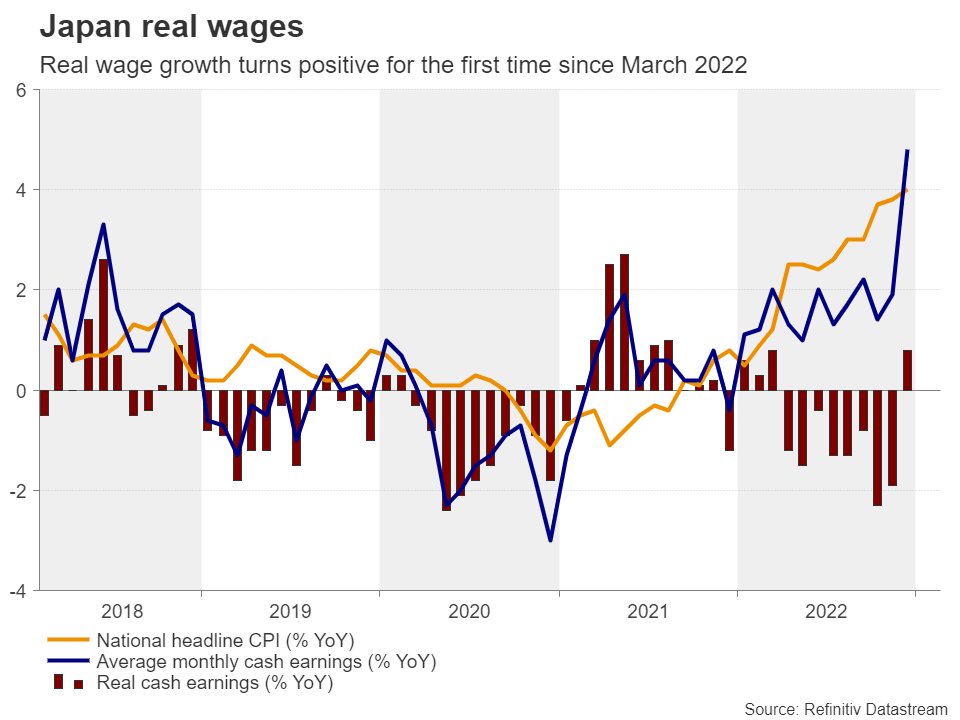
All in all, flying inflation and surging wages are a cocktail that warrants scaling back more accommodation, and that seems to have been the case even before the “shunto” wage negotiations that started on January 23. Should firms agree with unions on pay increases, speculation that the BoJ may need to make another move towards normalization is very likely to increase substantially.
Normalization bets could fuel yen’s engines
With Ueda appearing to be a patient person in terms of interest rates, the focus will be on yield curve control and whether it can be abandoned. Should he become more vocal on that front as he gets closer to taking the spot, the yen’s engines may restart but whether the prevailing downtrend in dollar/yen could resume remains a mystery.
The dollar has been enjoying gains recently as investors substantially raised their implied path with regards to the Fed’s future rate increases, while on top of that, China’s reopening and estimates that the Eurozone may have averted a recession have kept risk sentiment supported and thereby the safe-haven yen weak.
A long way to go before dollar/yen downtrend resumes
For the prevailing downtrend in dollar/yen to continue, a clear dip below 127.20 may be needed. This will confirm a lower low on the daily chart and may pave the way towards the psychological zone of 125.00, marked by the inside swing high of March 28, 2022. If that zone fails to withstand the pressure, its break may set the stage for extensions towards the low of March 31 at 121.25.
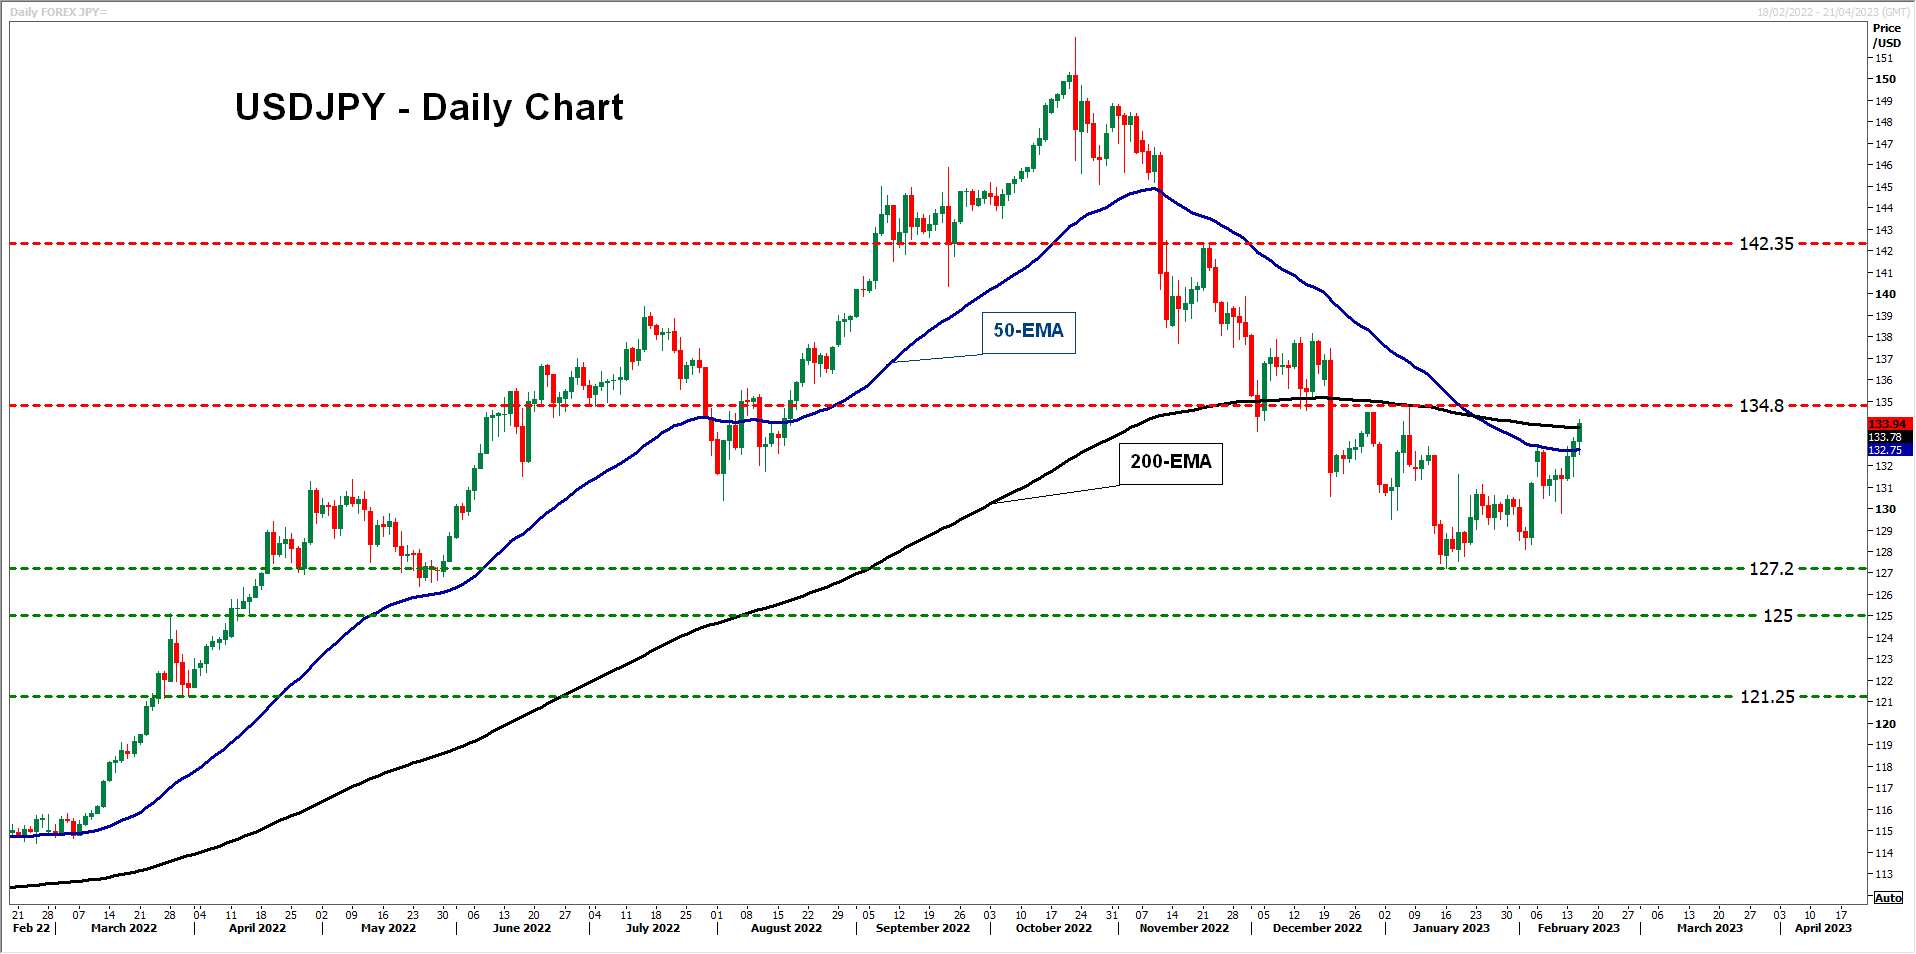
Now, if Ueda’s language is interpreted as more dovish than expected, dollar/yen may extend its recovery. A break above 134.80 would take the pair above both the 50- and 200-day exponential moving averages (EMAs) and may allow advances towards the key territory of 138.00. That zone acted as key resistance between December 7 and 16 and provided decent support between November 15 and 28. Should the bulls defeat the bears there as well, they may then extend their march towards the peak of November 22 at 142.35.
Bitcoin Price Rallies Over 10% To Clear Hurdles
Key Highlights
- Bitcoin price started a fresh increase above the $23,000 resistance.
- BTC broke a major bearish trend line at $22,215 on the 4-hours chart.
- Gold price declined further below $1,850 and $1,842.
- EUR/USD remains at a risk of more losses below 1.0700.
Bitcoin Price Technical Analysis
Bitcoin price formed a base and started a fresh increase above $22,000 resistance. BTC/USD surpassed key hurdles near $22,200 to move into a short-term positive zone.
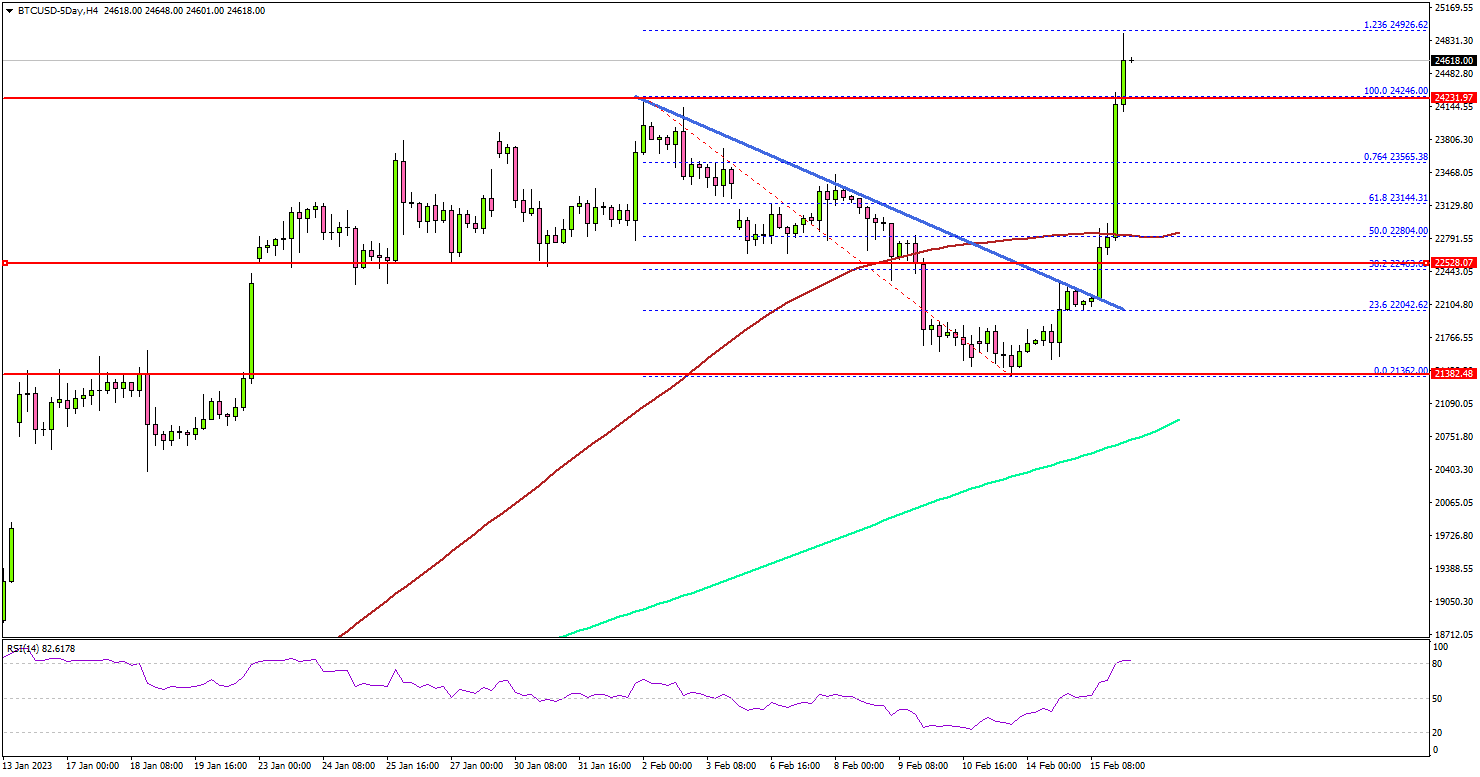
Looking at the 4-hours chart, the price traded above the $22,400 resistance and remained well above the 200 simple moving average (green, 4-hours). It also cleared a major bearish trend line at $22,215.
BTC surged above the $22,800 resistance and the 100 simple moving average (red, 4-hours). Finally, there was a spike above the last swing high at $24,246.
The bears appeared near the $25,000 resistance zone. It is close to the 1.236 Fib extension level of the downward move from the $24,246 swing high to $21,362 low. A close above the $25,000 level may perhaps start another steady increase in the coming sessions.
In the stated case, the price could rise towards the $26,200 level. Any more gains could set the pace for a move towards the $27,000 level.
On the downside, an initial support sits near the $24,250 level. The main breakdown support sits near the $23,250 zone. If there is a downside break and close below $23,250, bitcoin might start another decline in the coming days. In the stated case, it could revisit the $22,500 support or even test $21,400.
Economic Releases
- US Initial Jobless Claims - Forecast 200K, versus 196K previous.
- US Housing Starts for Jan 2023 (MoM) – Forecast 1.360M, versus 1.382M previous.
- US Building Permits for Jan 2023 (MoM) – Forecast 1.350M, versus 1.337M previous.
US 500 Index Rebound Runs into Trouble at 50% Fibo
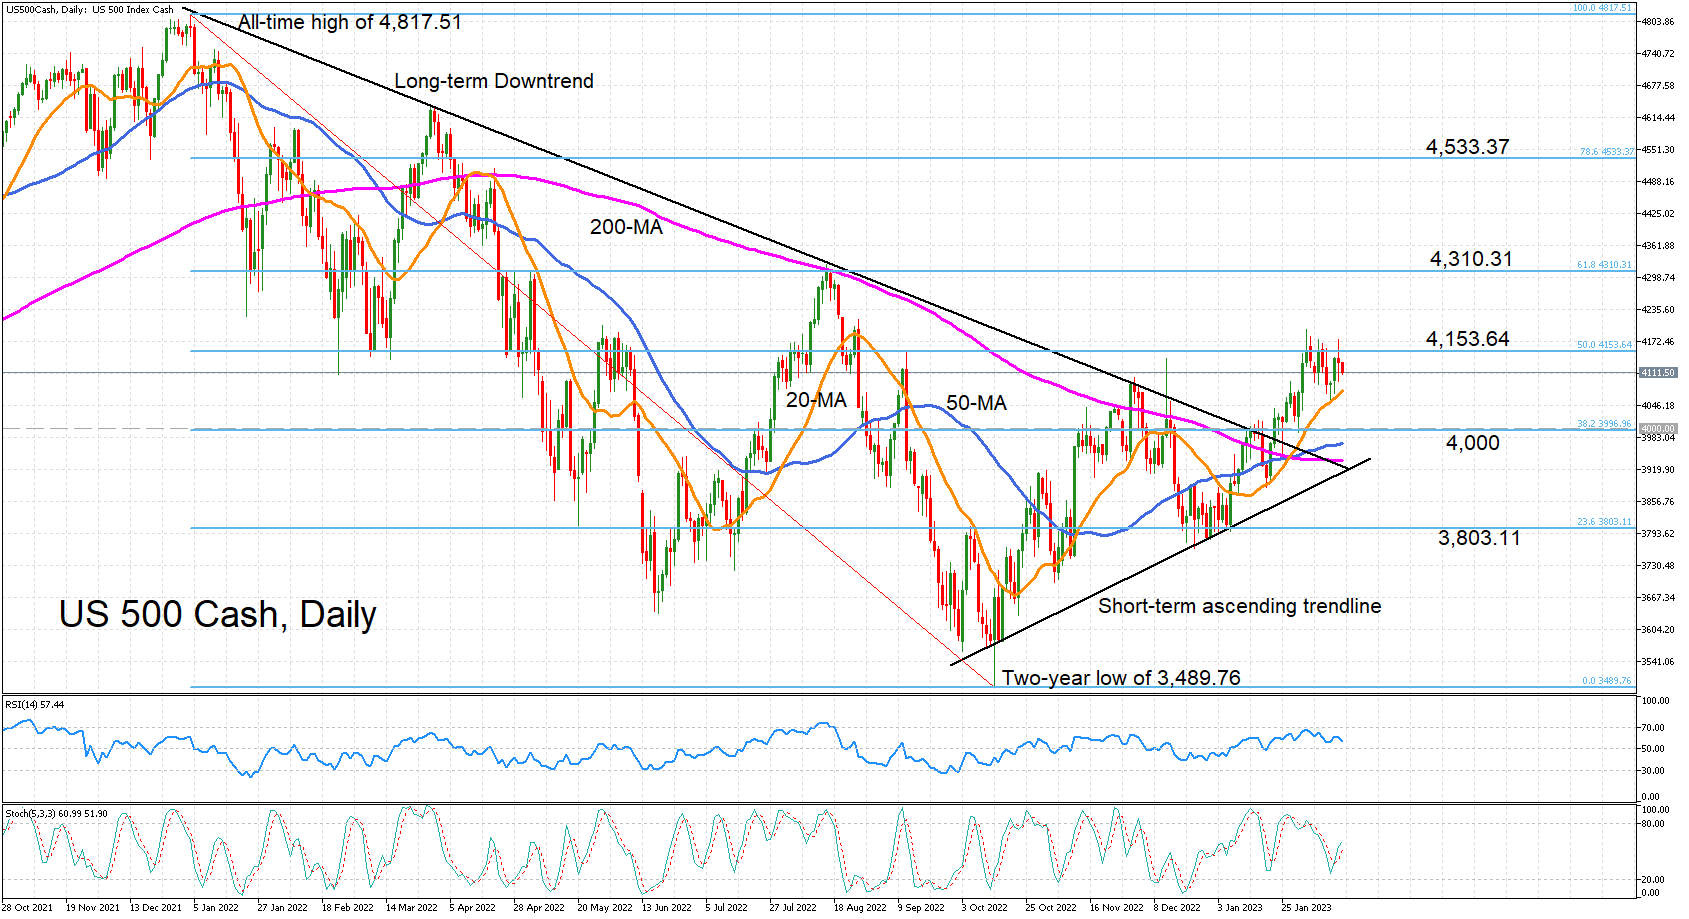
The US 500 stock index (cash) has been edging sideways after the rebound from October’s two-year low of 3489.76 hit the buffers near the 50% Fibonacci retracement of the correction from the all-time high of 4,817.51. The latest upward attempt came on Tuesday, but the bulls could only manage a brief spike above the 50% Fibo of 4,153.64.
The positive momentum has since started to wane, although it has not completely dissipated. The RSI is sloping downwards but is holding a fair distance above the 50 neutral level, while the %K and %D lines of the stochastic oscillator remain positively aligned. Both suggest that further upside is possible in the short term even though the downside risks are increasing.
The 20-day simple moving average (SMA) has been a reliable support for this rebound over the past month and could again shield against steeper selloffs. However, if this support crumbles, there would be nothing stopping the index from hitting the psychologically important 4,000 level. Lower down, the 50- and 200-day SMAs stand ready to halt further declines at 3,970 and 3,938, respectively. But breaching these would bring into scope the ascending trendline as the final hurdle keeping the uptrend intact.
On the other hand, if the bulls succeed in cracking above the 50% Fibonacci, the next big test would come at the 61.8% Fibonacci of 4,310.31, which coincides with the August 2022 top, followed by the 78.6% Fibonacci of 4,533.37.
Summing up, clearing the 50% Fibonacci is essential if the benchmark index will continue to make a recovery towards its all-time high, as is holding above the ascending trendline.