Sample Category Title
Euro Drifting ahead of ECB Meeting
The euro is showing limited movement on Thursday, ahead of the ECB rate meeting. In the European session, EUR/USD is trading at 1.1000.
Euro jumps on dovish Powell
Investors liked what they heard from Jerome Powell at the Fed meeting, which sent the US dollar broadly lower. The euro took full advantage and climbed 1.16% on Wednesday. The Fed raised rates by 25 basis points as was widely expected. The Fed noted that inflation has eased but reminded listeners that it remained much higher than the 2% target. Jerome Powell signaled that more rate hikes are coming and said he did not expect to cut rates this year. This was essentially a repeat of the hawkish message we’ve grown accustomed to hearing from the Fed, but some comments from Jerome Powell struck a positive chord with investors. These included Powell acknowledging that the disinflation process had started and that he expected another couple of rate hikes before winding up the current rate-hike cycle.
Besides inflation, the Fed is focused on employment data, which will make Friday’s nonfarm employment report an important factor in the Fed’s rate plans. In December, nonfarm payrolls fell from 256,000 to 223,000 and the downturn is expected to continue, with an estimate of 190,000 for January. This release could result in further volatility in the currency markets on Friday.
The ECB makes its rate announcement later today and is expected to deliver a 50-bp increase, bringing the cash rate to 3.0%. After that, the pace of monetary tightening will depend largely on the strength of the eurozone economy and inflation levels. The markets are forecasting a terminal rate in the range of 3.25%-3.75%, with the ECB likely to raise rates in 25-bp increments. There has been criticism of the central bank for not communicating effectively with the markets and Lagarde & Co. will have the opportunity to redeem themselves at today’s meeting.
EUR/USD Technical
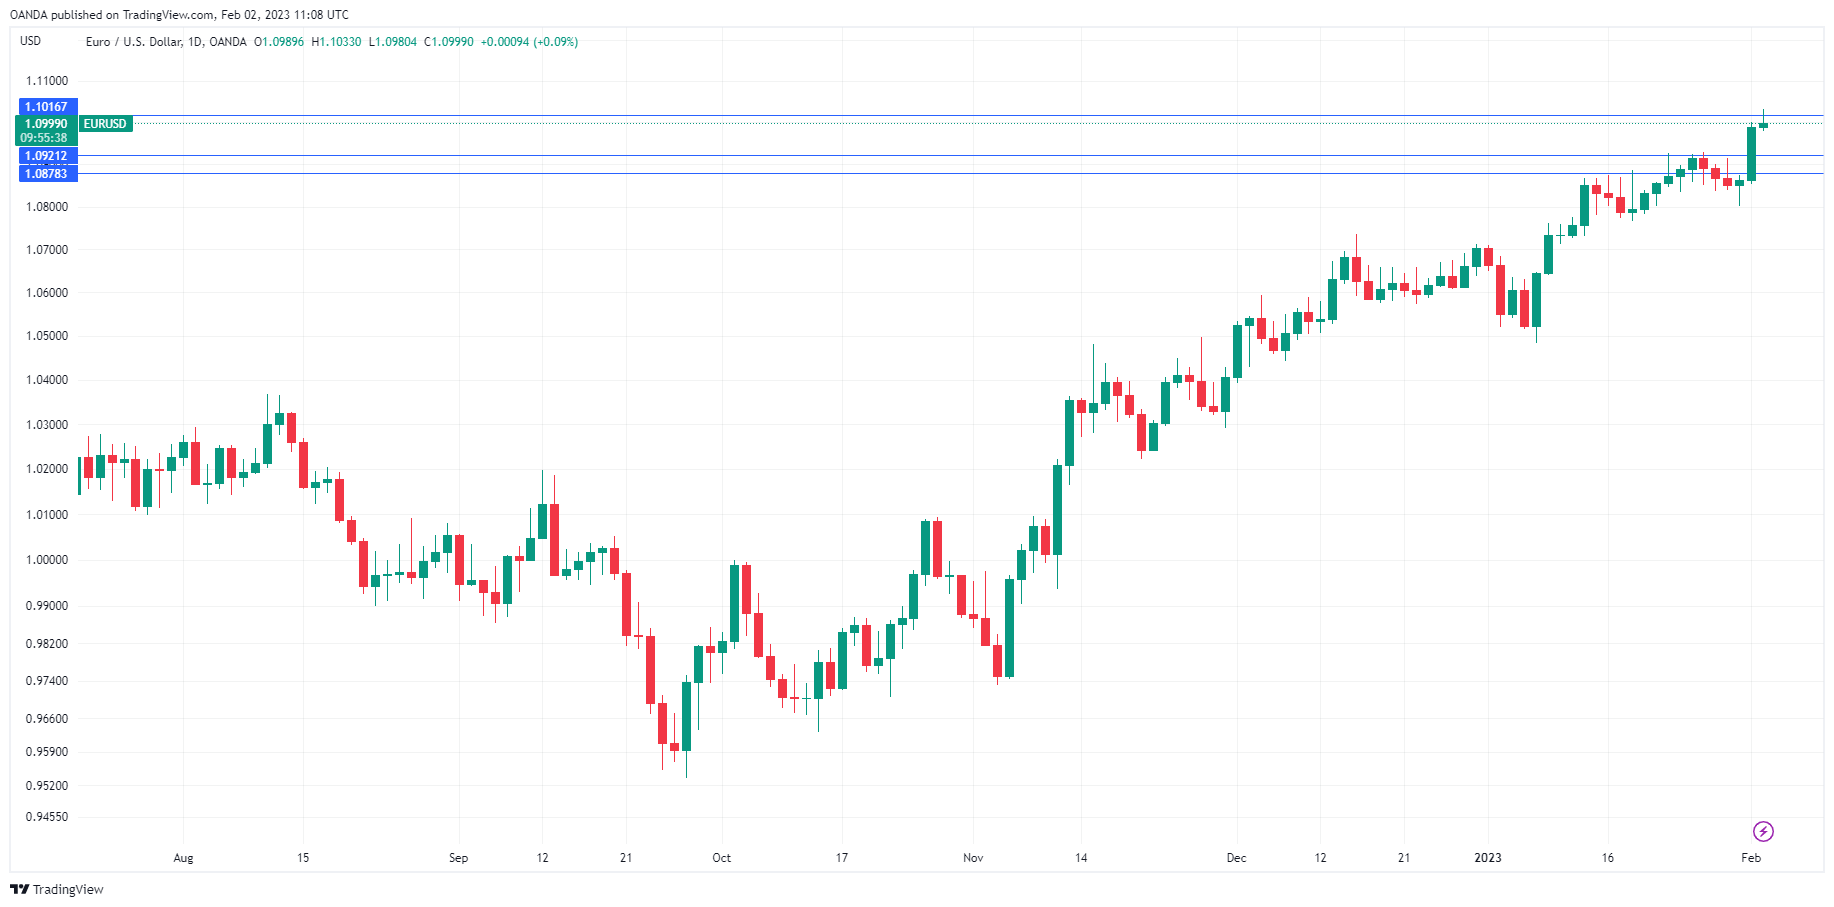
- There is support at 1.0921 and 1.0878
- EUR/USD is testing resistance at 1.1016. Above, there is resistance at 1.1205
BoE hikes 50bps, known hawk consents, two doves dissent again
BoE raises Bank Rate by 50bps to 4.00% as widely expected. The decision was made by 7-2 votes. Swati Dhingra and Silvana Tenreyro voted for no change again, as in December. Known hawk Catherine Mann consented this time.
In the accompanying statement, BoE noted that "domestic inflationary pressures have been firmer than expected". Still the bank expects that rate hike since December 2021 to have an "increasing impact on the economy in the coming quarters".
In the new economic forecasts, annual CPI inflation is expected fall from current 10.5% to around 4% towards the end of the year. Also, conditioned on interest at around 4.50% in mid 2023 and falls back to 3.25% in three years time, CPI will decline to below 2% target in the medium term.
Also, the economy is expected to have a "much shallower" recession than prior expected. Calender -year GFP growth is expected to be at -0.50% in 2023 and -0.25% in 2024 only.
(BoE) Bank Rate increased to 4%
Monetary Policy Summary, February 2023
The Bank of England’s Monetary Policy Committee (MPC) sets monetary policy to meet the 2% inflation target, and in a way that helps to sustain growth and employment. At its meeting ending on 1 February 2023, the MPC voted by a majority of 7–2 to increase Bank Rate by 0.5 percentage points, to 4%. Two members preferred to maintain Bank Rate at 3.5%.
Global consumer price inflation remains high, although it is likely to have peaked across many advanced economies, including in the United Kingdom. Wholesale gas prices have fallen recently and global supply chain disruption appears to have eased amid a slowing in global demand. Many central banks have continued to tighten monetary policy, although market pricing indicates reductions in policy rates further ahead.
UK domestic inflationary pressures have been firmer than expected. Both private sector regular pay growth and services CPI inflation have been notably higher than forecast in the November Monetary Policy Report. The labour market remains tight by historical standards, although it has started to loosen and some survey indicators of wage growth have eased, alongside a gradual decline in underlying output. Given the lags in monetary policy transmission, the increases in Bank Rate since December 2021 are expected to have an increasing impact on the economy in the coming quarters.
Near-term data developments will be crucial in assessing how quickly and to what extent external and domestic inflationary pressures will abate. As set out in the accompanying February Monetary Policy Report, the MPC’s updated projections show CPI inflation falling back sharply from its current very elevated level, of 10.5% in December, in large part owing to past increases in energy and other goods prices falling out of the calculation of the annual rate. Annual CPI inflation is expected to fall to around 4% towards the end of this year, alongside a much shallower projected decline in output than in the November Report forecast.
In the latest modal forecast, conditioned on a market-implied path for Bank Rate that rises to around 4½% in mid-2023 and falls back to just over 3¼% in three years’ time, an increasing degree of economic slack, alongside falling external pressures, leads CPI inflation to decline to below the 2% target in the medium term. There are considerable uncertainties around this medium-term outlook, and the Committee continues to judge that the risks to inflation are skewed significantly to the upside.
The MPC’s remit is clear that the inflation target applies at all times, reflecting the primacy of price stability in the UK monetary policy framework. The framework recognises that there will be occasions when inflation will depart from the target as a result of shocks and disturbances. The economy has been subject to a sequence of very large and overlapping shocks. Monetary policy will ensure that, as the adjustment to these shocks continues, CPI inflation will return to the 2% target sustainably in the medium term. Monetary policy is also acting to ensure that longer-term inflation expectations are anchored at the 2% target.
The Committee has voted to increase Bank Rate by 0.5 percentage points, to 4%, at this meeting. Headline CPI inflation has begun to edge back and is likely to fall sharply over the rest of the year as a result of past movements in energy and other goods prices. However, the labour market remains tight and domestic price and wage pressures have been stronger than expected, suggesting risks of greater persistence in underlying inflation.
The extent to which domestic inflationary pressures ease will depend on the evolution of the economy, including the impact of the significant increases in Bank Rate so far. There are considerable uncertainties around the outlook. The MPC will continue to monitor closely indications of persistent inflationary pressures, including the tightness of labour market conditions and the behaviour of wage growth and services inflation. If there were to be evidence of more persistent pressures, then further tightening in monetary policy would be required.
Looking further ahead, the MPC will adjust Bank Rate as necessary to return inflation to the 2% target sustainably in the medium term, in line with its remit.
Minutes of the Monetary Policy Committee meeting ending on 1 February 2023
1: Before turning to its immediate policy decision, and against the backdrop of its latest economic projections, the Committee discussed: the international economy; monetary and financial conditions; demand and output; and supply, costs and prices.
The international economy
2: Global GDP growth had probably slowed in 2022 Q4, accounted for by weakening growth in the euro area and subdued economic activity in China owing to an increase in Covid cases. UK-weighted world GDP was expected to continue to be subdued in the near term. Global consumer price inflation remained elevated, although it was likely to have peaked in many advanced economies. It was projected to fall over the course of 2023 following declines in energy prices and as global demand weakened and supply chain pressures eased.
3: In the euro area, GDP growth had slowed in recent quarters as real incomes had been squeezed by higher energy and food prices. Following growth of 0.3% in 2022 Q3, GDP had risen by 0.1% in Q4 according to the preliminary flash estimate, a little higher than expected in the November and February Monetary Policy Report projections. The S&P Global euro-area flash composite output PMI had risen a little above the 50 no-change mark in January, although the forward-looking new orders index had remained in contractionary territory.
4: In the United States, GDP had increased by 0.7% in 2022 Q4, only marginally lower than in Q3, and significantly stronger than anticipated in the November and February Report forecasts. Although financial conditions had loosened further since the MPC’s previous meeting, they were much tighter than a year ago and were expected to continue to weigh on growth in coming quarters. Survey indicators such as the ISM PMIs had also pointed towards weaker growth.
5: In China, rising Covid cases had weighed on activity in the final quarter of 2022. GDP growth had been flat in Q4, much weaker than the 1.4% growth rate expected at the time of the November Report, and activity in 2023 Q1 was also expected to be weak. In early December, China had begun to remove Covid restrictions, effectively ending its zero-Covid policy, and mobility measures had fallen sharply. Retail sales had fallen in December relative to a year earlier while industrial production had increased, consistent with the impact of the latest Covid wave being greater on consumption than on manufacturing output. This suggested that global supply chains might be less disrupted than after previous Covid waves in China, reducing any upward impact on global goods prices and hence UK inflation. Moreover, the removal of restrictions would reduce the likelihood of future lockdowns, and hence potential future supply chain disruption. Chinese GDP growth was expected to recover in coming quarters.
6: European natural gas prices had fallen markedly since the MPC’s December meeting. The Dutch Title Transfer Facility spot price, had declined to €58 per MWh, down nearly 60%, and the gas futures curve had also fallen significantly. Relatively mild weather had contributed to lower gas consumption in continental Europe, alleviating supply concerns for next winter as storage levels had remained high. These developments had also caused large downward movements in UK wholesale gas prices. The Brent crude oil spot price had risen by around 5%, to $85 per barrel. The prices of agricultural goods had increased by around 4% since the MPC's December meeting.
7: Global consumer price inflation appeared to have peaked. In the euro area, the flash estimate had suggested that annual headline HICP inflation decreased for the third consecutive month in January, falling by 0.7 percentage points to 8.5%. The decline had been driven by a reduction in energy price inflation. Core inflation had remained unchanged at 5.2%. In the United States, annual PCE inflation had fallen to 5.0% in December, its lowest level since September 2021, and down from 5.5% in November. Upward pressure from energy and core goods prices had continued to fade. Core PCE inflation had declined to 4.4%.
8: The MPC discussed how monetary policy tightening over the past year had affected economic activity in the United States and the euro area. Financial conditions had possibly tightened a little more than in previous tightening cycles in the United States, including mortgage rates, but had been somewhat more similar to historical episodes in the euro area. Indicators of consumption had declined, broadly in line with what might have been expected in the United States, while the broader real income squeeze was contributing materially to the weakness in the euro area. Given lags in the transmission of monetary policy, it was too early to judge the impact on inflation, but published forecasts from both the Federal Reserve and the ECB had suggested some persistence in inflationary pressures.
Monetary and financial conditions
9: Many central banks had continued to tighten monetary policy, and market pricing implied that policy rates were likely to increase further in the near term. In December, both the Federal Open Market Committee (FOMC) and the ECB Governing Council had increased policy rates by 50 basis points. The target range for the federal funds rate was 4¼ to 4½% and the interest rate on the ECB’s deposit facility was 2%. The FOMC and ECB Governing Council were expected to increase rates by a further 25 and 50 basis points respectively at their forthcoming meetings concluding on 1 and 2 February. The peak in the market-implied policy path in the United States was little changed since the MPC’s previous meeting, at a little under 5%. In the euro area, the peak in the market-implied policy path had risen somewhat, to a little under 3½%.
10: A large majority of respondents to the Bank’s latest Market Participants Survey (MaPS) expected Bank Rate to be increased by 50 basis points at this MPC meeting, broadly consistent with market-implied pricing. The median MaPS respondent expected Bank Rate to reach a peak of 4¼% in March and to remain at that level throughout the rest of 2023, broadly unchanged since the previous survey. The market-implied path for Bank Rate rose to around 4½% by the middle of this year, down a little since the MPC’s previous meeting and further closing the gap with the median path in the MaPS.
11: Further out, market-implied paths remained consistent with expectations of a reduction in policy rates. In the United States, by end-2025, the market implied policy path was around 2 percentage points lower than the expected peak in rates, compared with around 1 percentage point lower in the United Kingdom and euro area.
12: Risky asset prices had risen globally since the November Monetary Policy Report, including in the period since the MPC’s December meeting. Easing global inflation concerns had supported risk appetite. Overall, stronger equity prices, narrower corporate borrowing spreads and lower expectations for policy rates had contributed to some loosening in global financial conditions since the November Report. In the United Kingdom, those moves had in part reflected an unwinding of the higher premia required to invest in UK assets associated with the market volatility in late September and October last year.
13: The sterling effective exchange rate had depreciated somewhat since the previous MPC meeting, but remained around 1% higher than at the time of the November Report. Over the quarter, there had been a broad-based depreciation of the US dollar, consistent with some improvement in global risk sentiment as well as the somewhat larger declines in US interest rate expectations relative to other advanced economies over the period.
14: There had been a further reduction in financial market participants’ near-term inflation expectations since the MPC’s December meeting, in part reflecting falls in wholesale gas prices. In the United Kingdom, the median of MaPS respondents’ expectations for CPI inflation one and two years ahead had fallen to 3.5% and 2.5% respectively, compared to 5.5% and 3.0% in the previous survey in December. At both the three and five-year horizons, median CPI inflation expectations had remained at 2%, although responses had still been skewed to the upside.
15: The Committee discussed movements in UK medium-term inflation compensation measures. There had been a material reduction in these measures since their peak last March, although they had remained above their average levels of the previous decade. Interpreting moves in inflation compensation measures remained challenging, particularly following the significant market volatility last September and October, when there had been large distortions from the repricing in long-dated and index-linked UK government debt, and associated pressure on liability-driven investment (LDI) funds. Nevertheless, looking further back, market contacts had attributed the majority of the fall in these measures since last March to fundamental factors, including falling central expectations for inflation and changing perceptions of the balance of risks around the inflation outlook. That said, market technical factors, including those associated with pressure on LDI funds last autumn, were also attributed a significant role in explaining moves in inflation compensation measures.
16: There had been a continued reduction in UK owner-occupied fixed-term mortgage rates since the Committee’s previous meeting, but rates had remained materially higher than in the summer. The average quoted rates on two-year fixed-rate 90% and 75% loan-to-value mortgages stood at 6.0% and 5.4% in December, around 30 basis points and 50 basis points lower than in November. Preliminary data for January suggested that rates had fallen by a further 25 basis points. Spreads on these mortgage products relative to their relevant risk-free rate had fallen since November, leaving them not far from their 2016 to 2019 average levels.
17: There had been a large net reduction in sterling broad money in 2022 Q4. Cumulatively, net money outflows from October to December had more than reversed the very large increase recorded in September. These flows were accounted for primarily by some firms in the financial sector. One contributory factor to these large flows was likely to have been the significant market volatility towards the end of September, associated with developments at LDI funds.
18: On 12 January, the MPC had been informed that the Bank of England had completed its sales of its temporary holdings of UK government bonds purchased in autumn 2022 on financial stability grounds.
Demand and output
19: Although UK quarterly GDP growth in 2022 Q3 had been revised down to -0.3% in the Quarterly National Accounts, it was stronger than had been expected at the time of the November Monetary Policy Report. Estimates of GDP had been revised lower in preceding quarters, which meant that the level of GDP in Q3 had remained slightly below its pre-Covid level. Although the weakness in the third quarter in part reflected the additional bank holiday for the Queen’s state funeral in September, it had primarily been driven by weakness in underlying output.
20: Monthly GDP had been estimated to have risen by 0.1% in November, following a 0.5% increase in October. Bank staff now expected GDP to have grown by 0.1% in 2022 Q4 as a whole, stronger than at the time of the November Report. Underlying output had remained weak. The small rise in headline GDP expected in Q4 in part reflected some temporary factors such as the recovery in activity following the Queen’s state funeral.
21: GDP was expected to decline by 0.1% in 2023 Q1. Business surveys such as the S&P Global/CIPS UK flash PMIs, in which the output and new orders indices had remained below the 50 no-change mark in January, were consistent with small falls in GDP. Other business surveys had painted a similar picture of output growth being close to zero. The future output PMI, which covered firms’ expectations for output over the next year, had increased in recent months but remained below its historical average. Continued underlying weakness in GDP growth was in part likely to reflect the fall in real household incomes, and hence consumer spending, due to high global energy and tradeable goods prices.
22: Household consumption had contracted by 1.1% in 2022 Q3, and spending on goods, as indicated by retail sales volumes, had been on a downward trend since spring 2021, in part due to spending transitioning from goods to services following the pandemic. Contacts of the Bank’s Agents had noted customers trading down to lower-priced products and a drop in demand for household goods. GfK consumer confidence had remained around historically low levels in January.
23: Business investment had been weak for some time and had fallen by 2.5% in 2022 Q3. Overall, business investment was around 8% below its pre-Covid level and was likely to remain subdued in the near term. Intelligence from the Bank’s Agents suggested that weak demand, tighter financial conditions and uncertainty about the outlook were holding back investment spending.
24: Housing investment growth had slowed to close to zero in 2022 Q3. The weakness in the economic outlook, combined with the impact of higher mortgage rates on the housing market, were expected to continue to weigh on housing investment. Leading indicators of house prices such as the Halifax and Nationwide indices had also pointed to falls since September. These recent moves were in contrast to the trend observed since the pandemic of strong growth in housing investment, activity and prices. The latest Credit Conditions Survey suggested that the availability of secured lending to households had declined in 2022 Q4, with further falls in availability expected in 2023 Q1. Loan approvals for house purchase had declined sharply in November and December when mortgage pricing had been more expensive. The Committee noted that although the causal links between house prices and spending had been reasonably modest historically in the United Kingdom, house prices had tended to have a strong correlation with consumption.
25: There was some evidence that the slowdown in output growth was leading to a softening in labour demand, although the labour market had remained tight. Labour Force Survey (LFS) employment growth had slowed over the second half of 2022, reflecting the past slowdown in GDP growth, and timelier survey indicators of labour demand had been consistent with stagnating employment. Business contacts of the Agents had reported a further easing in recruitment difficulties, but that hiring and retention difficulties had remained above normal across a range of sectors. Although the number of job vacancies had fallen, they had remained elevated. The LFS unemployment rate had remained at a historically low level of 3.7% in the three months to November, and in the February Report forecast was projected to rise only gradually over the course of the year. Many of the Agents’ business contacts had reported that they were reluctant to reduce headcount actively, and intended to accommodate weaker demand through attrition or by reducing working hours.
Supply, costs and prices
26: Twelve-month CPI inflation had edged down to 10.5% in December, from 10.7% in November, accounted for by a decline in fuel prices on the month. Core CPI inflation, excluding energy, food, beverages and tobacco, had remained unchanged at 6.3%, and was broadly in line with the November Monetary Policy Report projection. Core goods inflation had fallen by more than had been anticipated, to 5.8%, but services inflation had surprised to the upside, rising to a 30-year high of 6.8%.
27: In the February Report forecast, CPI inflation was projected to fall to around 8% by the middle of this year, as previous large increases in energy and other goods prices dropped out of the calculation of the annual rate. Core goods inflation was expected to continue to moderate, albeit remaining robust, consistent with global supply chains improving and survey indicators of manufacturers’ cost pressures easing.
28: Retail gas and electricity prices were currently subject to the Government’s Energy Price Guarantee (EPG). The EPG for a typical annual dual-fuel bill was due to increase from £2,500 to £3,000 in April. Retail energy prices were also expected to rise by 20% at that point, because even though wholesale gas futures prices had fallen recently, those declines were unlikely to push Ofgem’s energy price caps for April below the revised EPG. A 20% increase would be smaller than the increase of more than 50% in household energy bills in April 2022, such that the direct contribution of energy to twelve-month CPI inflation was expected to fall. If sustained, the latest falls in gas futures prices would push the Ofgem price caps below the EPG ceiling in July, and so pull down household energy prices.
29: Services CPI inflation was expected to remain around recent historically high rates over the first half of the year, in large part reflecting ongoing strength in pay growth. Bank staff analysis suggested that labour costs tended to be the predominant driver of services inflation in the long run, although higher non-labour input costs and firms rebuilding their margins had also been pushing up services prices recently.
30: The Committee discussed the potential persistence of recent inflation dynamics, and the role of wages in particular. A series of global shocks over the past few years had resulted in sharp and successive increases in the prices of tradeable goods, including energy, which continued to be passed through supply chains. There had been signs that these global pressures were beginning to abate. But the risk of greater inflation persistence, through the interactions of global pressures with domestic wage and price setting, remained in the context of a tight labour market. Relatedly, measures of inflation expectations over the year ahead had remained elevated.
31: Annual private sector regular Average Weekly Earnings growth had risen to a little over 7% in the three months to November, 0.7 percentage points above the November Report projection. Annual private sector wage growth was expected to flatten off at a similar rate in 2023 H1, consistent with higher-frequency pay growth also plateauing. A survey of firms conducted by the Bank’s Agents suggested that the average pay settlement in 2023 would rise at a broadly similar rate as in 2022. Survey respondents had expected consumer price inflation to be the main driver of pay settlements. Within the survey, there were tentative indications of pay pressures moderating over the year, with expected pay settlements a little lower in the second half of the year than in the first half. The measure of pay for new permanent hires in the KPMG/REC survey, which was a leading indicator for private sector pay growth three to four quarters ahead, suggested a more pronounced slowing in pay growth later in the year.
32: Measures of inflation expectations had fallen back from their recent peaks, but most were still at elevated levels. The Citi/YouGov household measures of inflation expectations over the next year and five-to-ten years ahead had edged down in January, to 5.4% and 3.5% respectively, following steeper falls in December. Respondents to the Decision Maker Panel in January had revised down their expectations for CPI inflation over the year ahead, to 6.4%, but had left their own price expectations unchanged, at 5.8%. Professional forecasters responding to the Bank’s latest quarterly survey were, on average, projecting CPI inflation to fall to 3.9% in one year’s time, and to be in line with the 2% inflation target three years ahead.
The immediate policy decision
33: The MPC sets monetary policy to meet the 2% inflation target, and in a way that helps to sustain growth and employment.
34: UK domestic inflationary pressures had been firmer than expected. Both private sector regular pay growth and services CPI inflation had been notably higher than forecast in the November Monetary Policy Report. The labour market had remained tight by historical standards. The unemployment rate had been 3.7% in the three months to November, below the MPC’s assessment of the long-term equilibrium rate of unemployment, which stood at just above 4%. GDP growth had surprised to the upside in 2022 H2, relative to the November Report forecast. Underlying output was declining gradually, however. There were signs that the labour market had started to loosen and some survey indicators of wage growth had eased. Wholesale gas prices had fallen recently, and consumer price inflation was likely to have peaked across many advanced economies. Measures of UK inflation expectations had fallen back from their recent peaks, but most were still at elevated levels.
35: As set out in the accompanying February Monetary Policy Report, the MPC’s updated projections showed CPI inflation falling back sharply from its current very elevated level, of 10.5% in December, in large part owing to past increases in energy and other goods prices falling out of the calculation of the annual rate. Annual CPI inflation was expected to fall to around 4% towards the end of this year, alongside a much shallower projected decline in output than in the November Report forecast.
36: In the latest modal forecast, conditioned on a market-implied path for Bank Rate that rose to around 4½% in mid-2023 and fell back to just over 3¼% in three years’ time, an increasing degree of economic slack, alongside falling external pressures, led CPI inflation to decline to below the 2% target in the medium term. There were considerable uncertainties around this medium-term outlook, and the Committee continued to judge that the risks to inflation were skewed significantly to the upside, primarily reflecting the possibility of greater persistence in domestic wage and price setting, and also upside risks to the wholesale energy price conditioning assumption. Qualitatively, an inflation forecast that took into account these upside risks was judged to be much closer to the 2% target at the policy horizon than the modal central projection.
37: The MPC’s remit was clear that the inflation target applied at all times, reflecting the primacy of price stability in the UK monetary policy framework. The framework recognised that there would be occasions when inflation would depart from the target as a result of shocks and disturbances. The economy had been subject to a sequence of very large and overlapping shocks. Monetary policy would ensure that, as the adjustment to these shocks continued, CPI inflation returned to the 2% target sustainably in the medium term. Monetary policy was also acting to ensure that longer-term inflation expectations were anchored at the 2% target.
38: Seven members judged that a 0.5 percentage point increase in Bank Rate, to 4%, was warranted at this meeting. Economic activity had weakened, but there had been some signs of greater resilience in the most recent data. Headline CPI inflation had begun to edge back and was likely to fall sharply over the rest of the year, as a result of past developments in energy and other goods prices. However, the labour market had remained tight and domestic price and wage pressures had been stronger than expected, suggesting risks of greater persistence in underlying inflation. Measures of inflation expectations were still at elevated levels. The risks to the inflation outlook in the medium term were both large and asymmetric, with a skew towards greater persistence. This warranted additional weight being put on recent strength in the labour market and inflation data, and relatively less on the medium-term projections. A 0.5 percentage point increase in Bank Rate at this meeting would address the risk that domestic wage and price pressures remained elevated even as external cost pressures waned.
39: Two members preferred to leave Bank Rate unchanged at 3.5% at this meeting. The real economy remained weak, as a result of falling real incomes and the tightening in financial conditions over the past year. There were continuing signs that the downturn was affecting the labour market, especially in more forward-looking indicators. At the same time, the lags in the effects of monetary policy meant that sizeable impacts from past rate increases were still to come through. That implied the current setting of Bank Rate would be likely to reduce inflation to well below target in the medium term. As the policy setting had become increasingly restrictive, this would bring forward the point at which recent rate increases would need to be reversed.
40: The extent to which domestic inflationary pressures eased would depend on the evolution of the economy, including the impact of the significant increases in Bank Rate so far. There were considerable uncertainties around the outlook. The MPC would continue to monitor closely indications of persistent inflationary pressures, including the tightness of labour market conditions and the behaviour of wage growth and services inflation. If there were to be evidence of more persistent pressures, then further tightening in monetary policy would be required.
41: Looking further ahead, the MPC would adjust Bank Rate as necessary to return inflation to the 2% target sustainably in the medium term, in line with its remit.
42: The Chair invited the Committee to vote on the proposition that:
- Bank Rate should be increased by 0.5 percentage points, to 4%.
43: Seven members (Andrew Bailey, Ben Broadbent, Jon Cunliffe, Jonathan Haskel, Catherine L Mann, Huw Pill and Dave Ramsden) voted in favour of the proposition. Two members (Swati Dhingra and Silvana Tenreyro) voted against the proposition, preferring to maintain Bank Rate at 3.5%.
Operational considerations
44: On 1 February 2023, the total stock of assets held for monetary policy purposes was £838 billion, comprising £826 billion of UK government bond purchases and £11.5 billion of sterling non‐financial investment‐grade corporate bond purchases.
45: The following members of the Committee were present:
- Andrew Bailey, Chair
- Ben Broadbent
- Jon Cunliffe
- Swati Dhingra
- Jonathan Haskel
- Catherine L Mann
- Huw Pill
- Dave Ramsden
- Silvana Tenreyro
- Clare Lombardelli was present as the Treasury representative.
46: As permitted under the Bank of England Act 1998, as amended by the Bank of England and Financial Services Act 2016, David Roberts was also present on 27 January, as an observer for the purpose of exercising oversight functions in his role as a member of the Bank’s Court of Directors.
GBP/USD Outlook: Sterling Expects Stronger Direction Signals from BOE
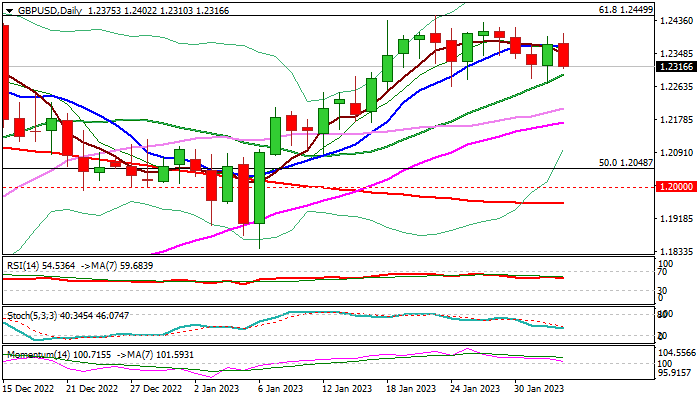
Cable stands at the back foot on Thursday, ahead of BOE policy meeting, though the price action remains within larger 1.2263/1.2247 near-term range and lacking clearer direction.
Technical studies are mixed on daily chart, while warning comes from formation of reversal pattern on weekly chart after the action was repeatedly capped by falling weekly Ichimoku cloud base, though signal still needs more downside action to be verified.
On the other hand, fundamentals are expected to be pound’s main driver today, as markets shift focus on BOE policy meeting, after positive impact from dovish Fed on Wednesday was short-lived.
The Bank of England is widely expected to raise interest rate by 50 basis points to 4.0% (the highest since 2008) in the 10th straight rate hike, though tiny possibility that the central bank may opt for a smaller 25 basis points hike, should not be completely ignored.
The UK policymakers face two opposite forces, as core inflation is not easing yet while the economy is expected to enter recession and also not sure yet about the impact of their recent aggressive policy tightening that keeps in play the dose of uncertainty.
Today’s dip, in case of 50 basis points hike scenario, would likely offer better levels to enter long positions in anticipation of fresh strength on hawkish BOE (50 basis points hike / signals of further tightening / clear signs of end of steep rate climb phase).
Psychological 1.24 level marks initial barrier, followed by 1.2447 (Dec 14 / Jan 23 peaks / Fibo 61.8% of 1.3748/1.0348) break of which would signal bullish continuation and expose target at 1.2666 (May 27 high).
Conversely, sterling may lose ground if BOE opts for more conservative 25 basis points hike.
Res: 1.2355; 1.2402; 1.2447; 1.2490.
Sup: 1.2293; 1.2263; 1.2216; 1.2145.
EUR/USD: Euro Keeps Firm Tone, ECB Likely to Provide Fresh Boost
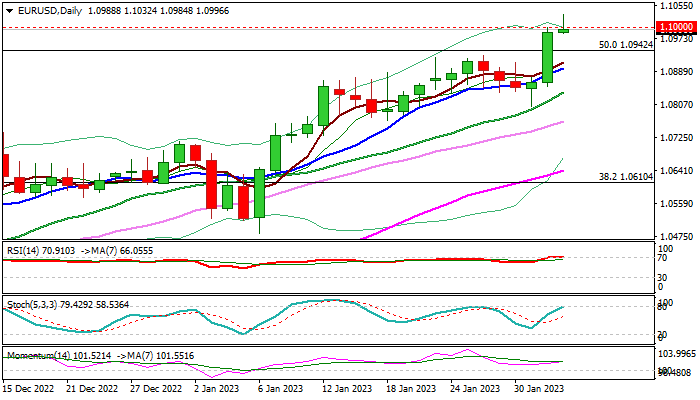
The Euro is holding firm tone in European trading on Thursday and consolidating around psychological 1.10 level, just under new ten-month high (1.1032), hit in extension of Wednesday’s 1.1% advance.
The single currency appreciated after Fed raised rate by 25 basis points, in line with expectations, but markets perceived the action as dovish, giving fresh boost to riskier assets.
Traders shift focus to today’s ECB policy meeting, as the central bank is expected to raise interest rates by another 50 basis points to 2.5% and signal more hikes in coming months.
Many expect that the ECB may follow Fed and start easing the pace of tightening, also partially due to deteriorating bloc’s economic picture, though the signals from policymakers so far point to firm stance and continuing fight against inflation.
Technical structure has significantly improved, following bullish signal on Wednesday’s break and close above the top of thick falling weekly cloud (1.0930) and pivotal Fibo barrier at 1.0942 (50% retracement of 1.2349/0.9535), with today’s probe through psychological 1.10 barrier (for the first time since early April) adding to positive signals.
Bulls eye immediate target at 1.1073 (100WMA), but could accelerate towards 200WMA (1.1224) and Fibo 61.8% (1.1274) if the ECB reaffirms its strong hawkish stance.
Shallow dips should provide better buying opportunities, with bullish bias to remain intact while the price action stays above rising 10DMA (1.0898).
Res: 1.1032; 1.1072; 1.1184; 1.1274.
Sup: 1.0942; 1.0898; 1.0838; 1.0800.
European Currencies Ahead of the Banks’ Statements
Information is not investment advice
The Backstory
On Thursday, the 2nd of February, the Bank of England will publish its report concerning interest rates and inflation data for the Eurozone. Professionals and investors anticipate that Andrew Bailey’s lead team of policymakers will likely raise interest rates to 4%; the highest in over a decade, for the tenth time in a row.
How does this affect the Forex market?
If the ECB raises interest rates, it makes borrowing more expensive, which can increase the demand for the euro and cause its value to appreciate. Conversely, if the ECB lowers interest rates, borrowing becomes cheaper, which can decrease the demand for the euro and cause its value to depreciate.
What do the charts have to say?
Considering the fundamental breakdown above, we will draw our conclusions from the outlook of price on the charts using price action.
EURUSD - Weekly Timeframe
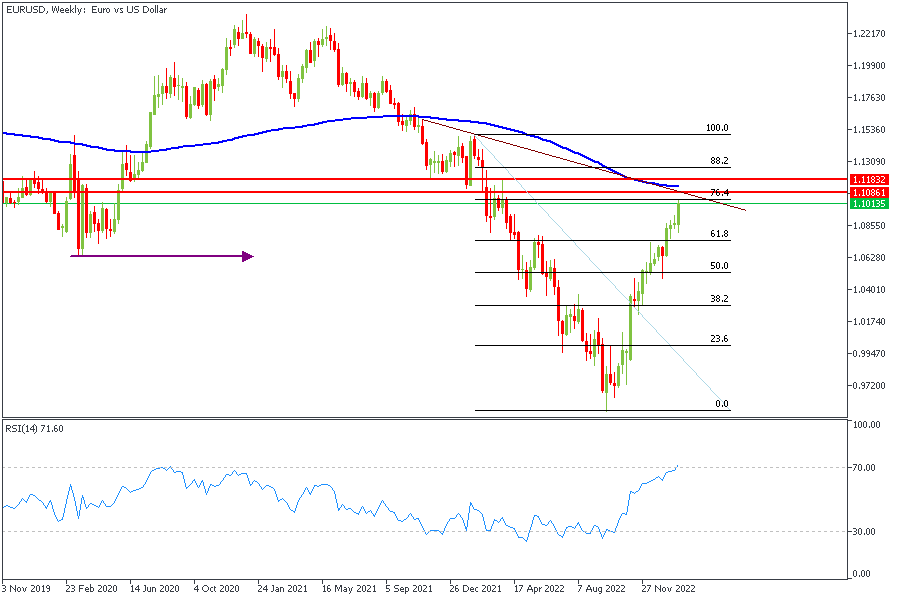
On the weekly timeframe as seen from the chart above, EURUSD is currently keying into a key resistance area. The 200-day moving average can also be seen aligning perfectly with a trendline resistance to serve as added confluence. We can also mention the Fibonacci retracement level, and the RSI (Relative Strength Index) which is in the overbought position (above 70). All these points are at the likelihood of a continuation of the overall downtrend on the weekly timeframe.
Analysts’ Expectations:
- Direction: Bearish
- Target: 1.07100
- Invalidation: 1.11840
EURGBP - Daily Timeframe
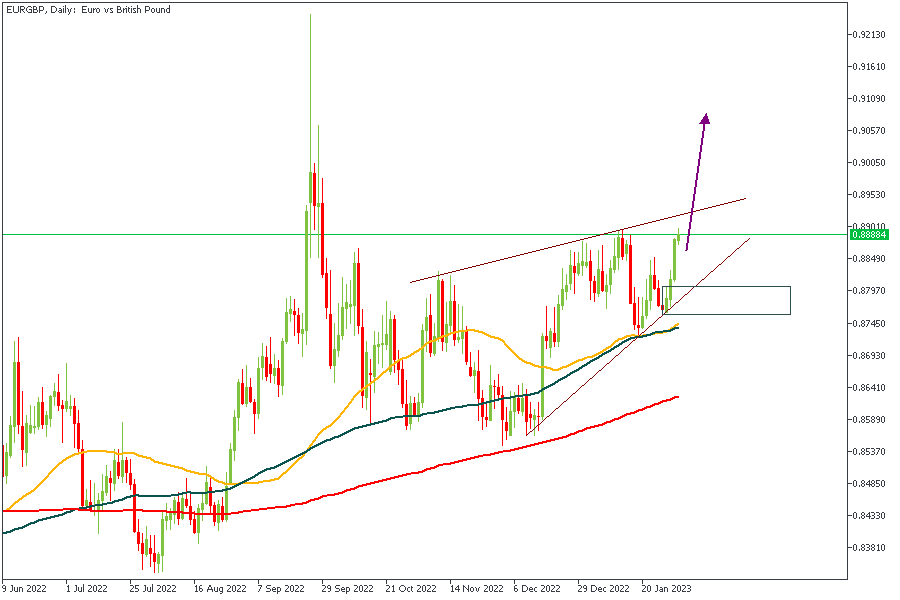
EURGBP from the chart is trading within a rising wedge whilst trading above the moving average array. Though the direction here is not crystal clear, our expectation is that price will likely continue bullish until it rides into the induced wick of the swing high (highest high on the chart).
Analysts’ Expectations:
- Direction: Bullish
- Target: 0.90250
- Invalidation: 0.87500
EURJPY- 4Hour Timeframe
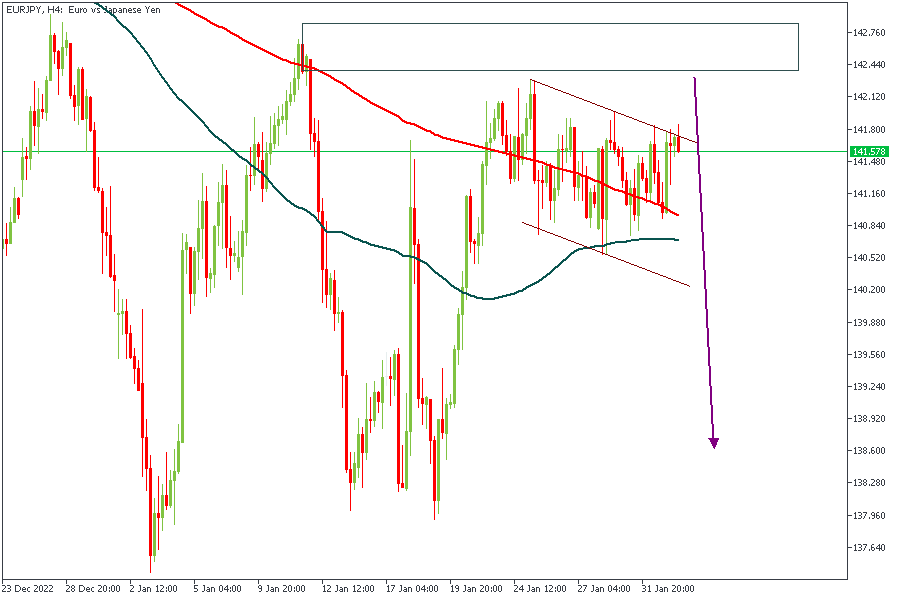
The price action on the EURJPY chart shows an interesting area of accumulation (inside the downward channel). The marked rectangle is an area of supply that price is likely to tap into before giving the actual bearish impulse according to the trend based on the 100- and 200- day moving averages.
Analysts’ Expectations:
- Direction: Bearish
- Target: 140.200
- Invalidation: 142.820
EURCAD - Weekly Timeframe
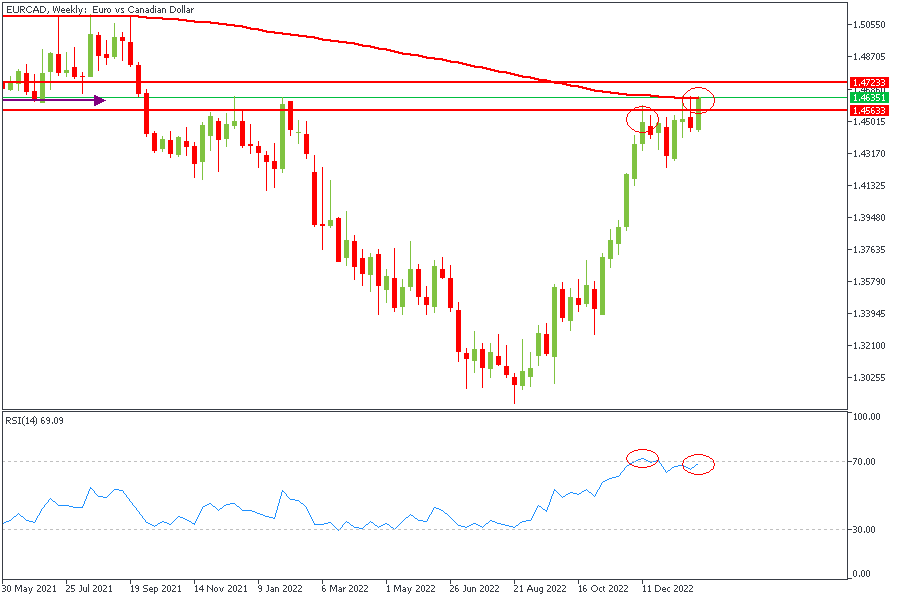
This EURCAD chart has a real potential of providing some good movement. The reason for this is because of the divergence on the RSI (Relative Strength Index) in the overbought position. The 200-Period Moving Average is also a formidable area of resistance, and considering how it overlaps the weekly pivot zone, we can expect some real action shortly.
Analysts’ Expectations:
- Direction: Bearish
- Target: 1.71450
- Invalidation: 1.47250
Important
The trading of CFDs comes at a risk. Thus, to succeed, you must manage risks properly. To avoid costly mistakes while you look to trade these opportunities, be sure to do your due diligence and manage your risk appropriately.
EURUSD Aims for Uptrend Extension after FOMC Boost
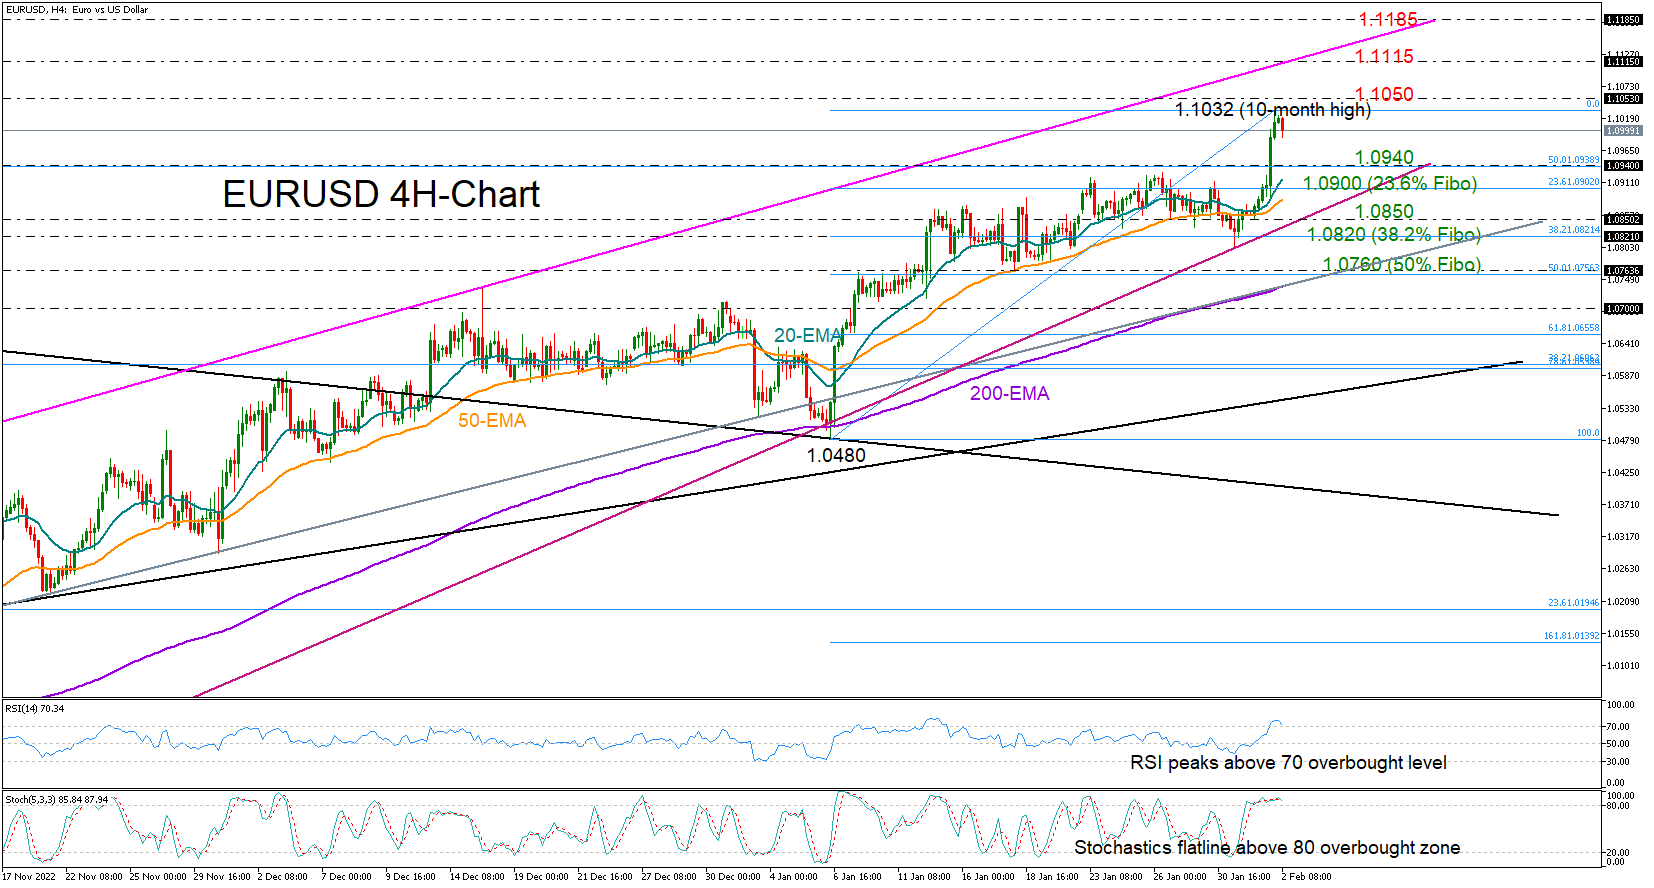
EURUSD advanced to a ten-month high of 1.1032 in the wake of a less hawkish FOMC policy statement late on Wednesday, which telegraphed that monetary tightening is probably having the desired impact on inflation.
The pair mildly trimmed some gains earlier today, edging slightly below the 1.1000 level as the RSI and the stochastics on the four-hour chart flagged overbought conditions.
While a pause can be reasonable after the latest spike, yesterday’s close above the 1.0940 bar, which overlaps with the 50% Fibonacci retracement of the 1.2348-0.9535 downtrend, is feeding optimism that the recovery will probably continue towards the key resistance line from November at 1.1115. Before it reaches that place, some congestion may develop around 1.1050. Should the bulls cross above the trendline, they may next target March’s high of 1.1185.
In case downside pressures persist, the price may revisit the 1.0940 region. The 20- and 50-period exponential moving averages (EMAs), which have been limiting bearish actions since mid-January, are approaching that territory and could prevent a forceful decline below the 1.0900 round level. This is also where the 23.6% Fibonacci retracement of the latest upleg from 1.0480 is located. If the bears dominate, the spotlight will immediately fall on the ascending trendline from November 3 around 1.0850 and the 1.0820 region. Even lower, another support trendline from November 21 could halt the bears near 1.0760.
In summary, EURUSD is expected to push for fresh highs in the short term, although some profit-taking is possible following the latest quick rally in the market.
EURUSD Forecasting The Rally After Elliott Wave Zig Zag Pattern
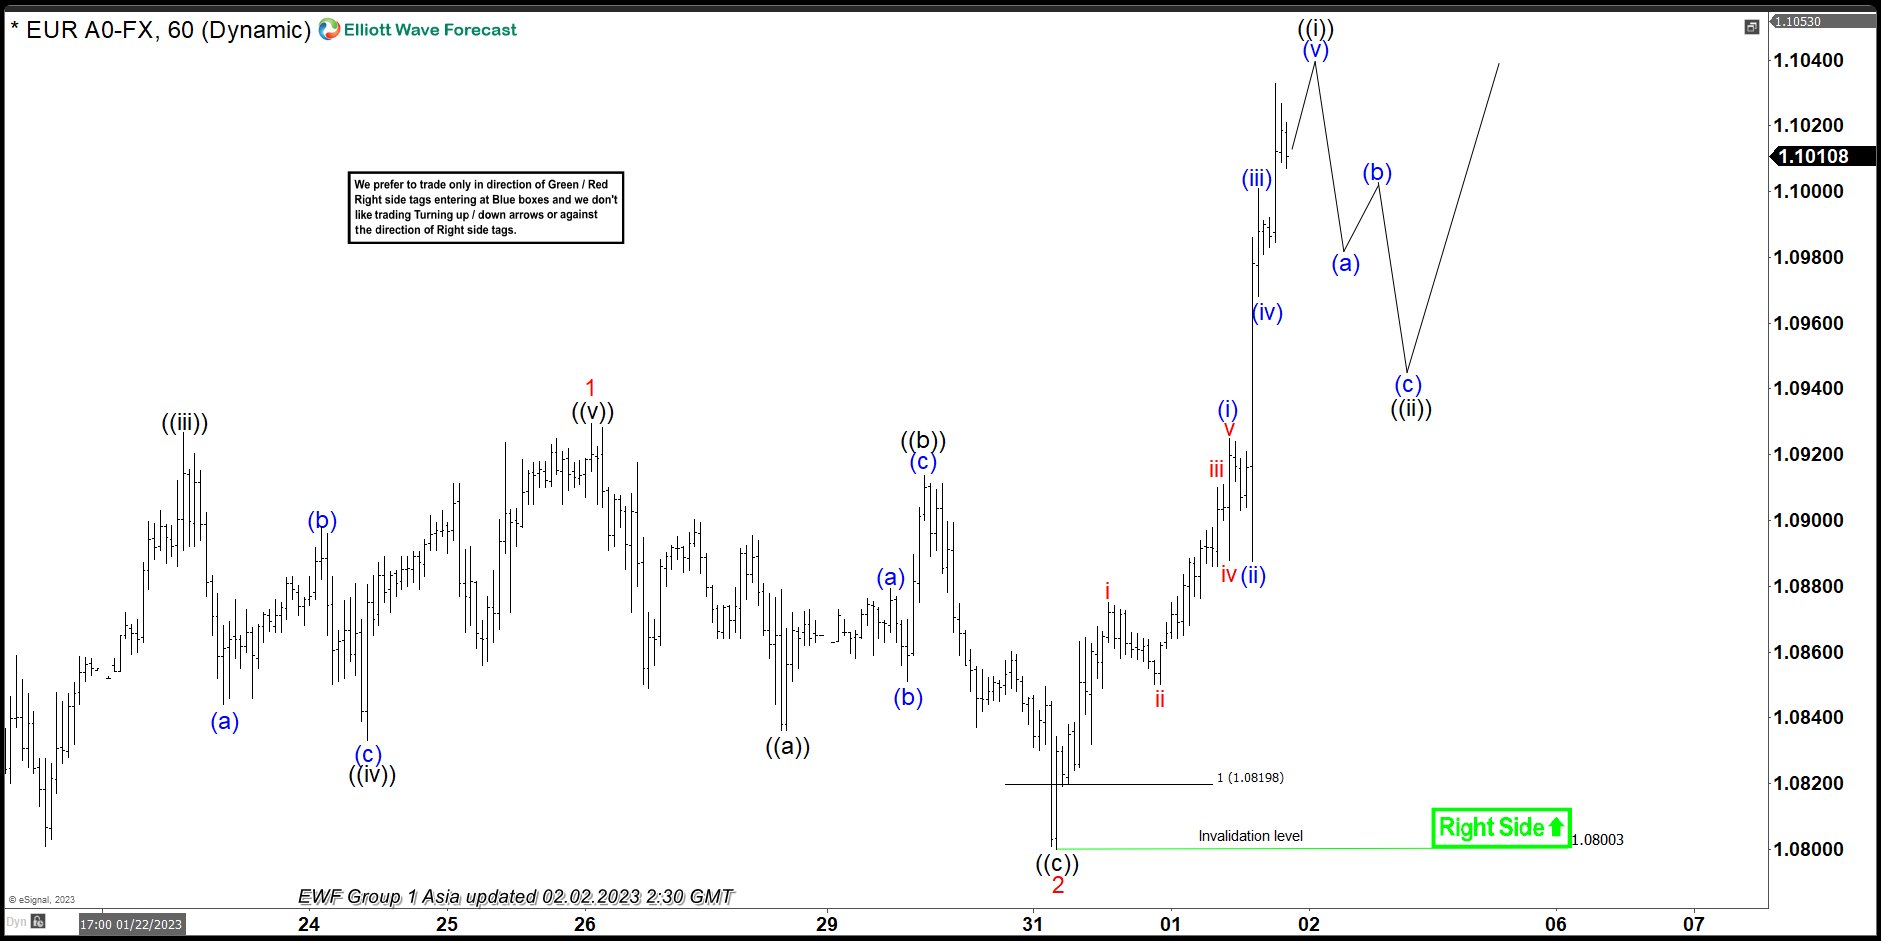
Hello fellow traders. In this technical blog we’re going to take a quick look at the Elliott Wave charts of EURUSD, published in members area of the website. As our members know, recently EURUSD made a pull back that has had a form of Elliott Wave Zig Zag pattern. We expected the pair to find buyers at the extreme zone from the 01/26 peak. In the further text we are going to explain the Elliott Wave Pattern and the forecast
Before we take a look at the real market example, let’s explain Elliott Wave Zigzag.
Elliott Wave Zigzag is the most popular corrective pattern in Elliott Wave theory . It’s made of 3 swings which have 5-3-5 inner structure. Inner swings are labeled as A,B,C where A =5 waves, B=3 waves and C=5 waves. That means A and C can be either impulsive waves or diagonals. (Leading Diagonal in case of wave A or Ending in case of wave C) . Waves A and C must meet all conditions of being 5 wave structure, such as: having RSI divergency between wave subdivisions, ideal Fibonacci extensions and ideal retracements.
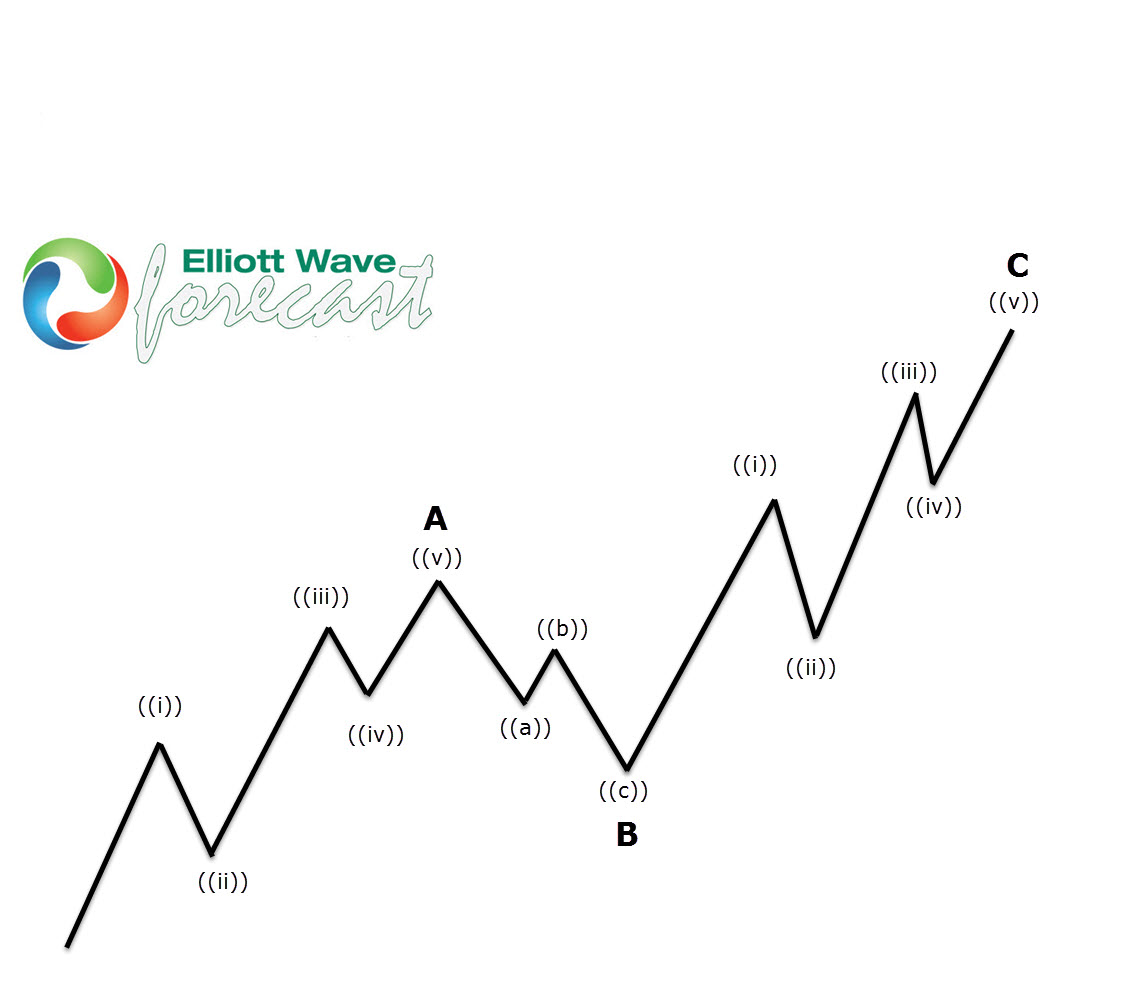
At the chart below we can see what Elliott Wave Zig Zag pattern looks like in real market.
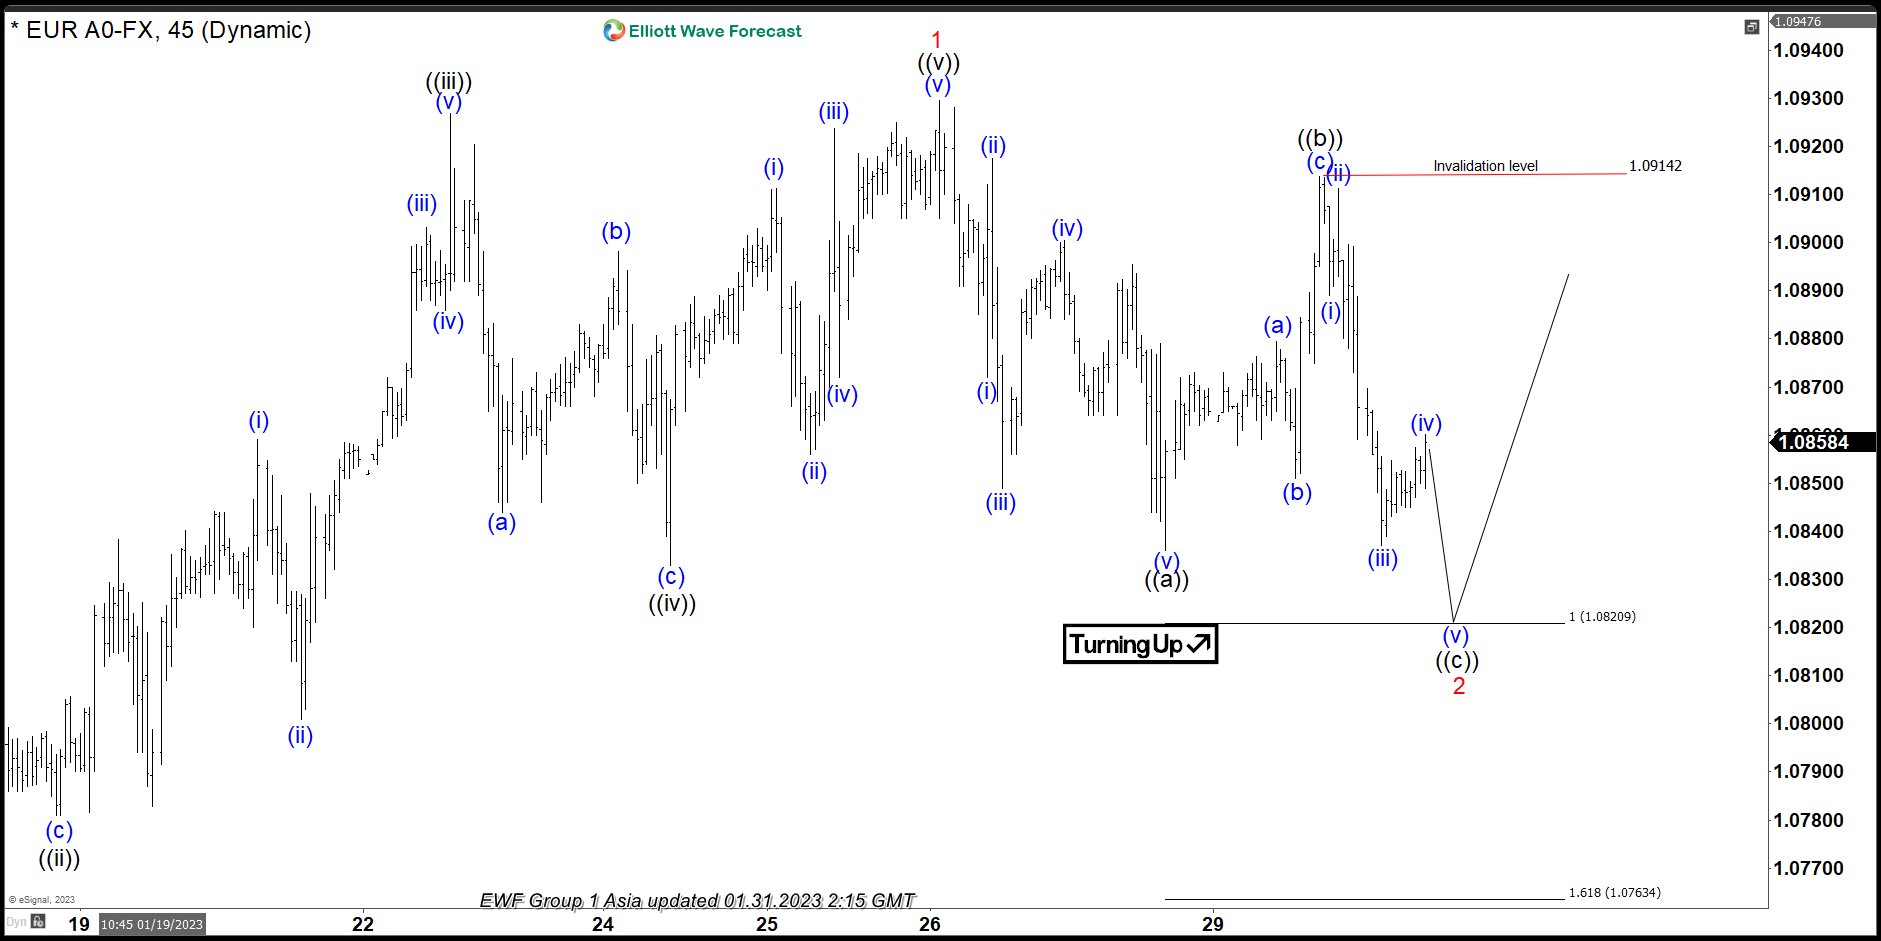
EURUSD H1 London Update 01.31.2023
EURUSD is giving us pull back against the 1.048 low. Correction looks incomplete at the moment. First leg has a form of 5 waves, so we assume pull back is unfolding as Elliott Wave Zig Zag Pattern. That means both ((a)) and ((c)) legs should have a form of 5 waves structure. At this stage ((c)) leg is still missing another wave down . We are calling for another marginal push lower toward marked reversal area: 1.0820-1.0763 ( buyers zone). That area we got by measuring extreme zone with Fibo Extension tool ((a)) – ((b)). At that zone sellers will be taking profits and we expect buyers to appear for further upside toward new highs ideally.
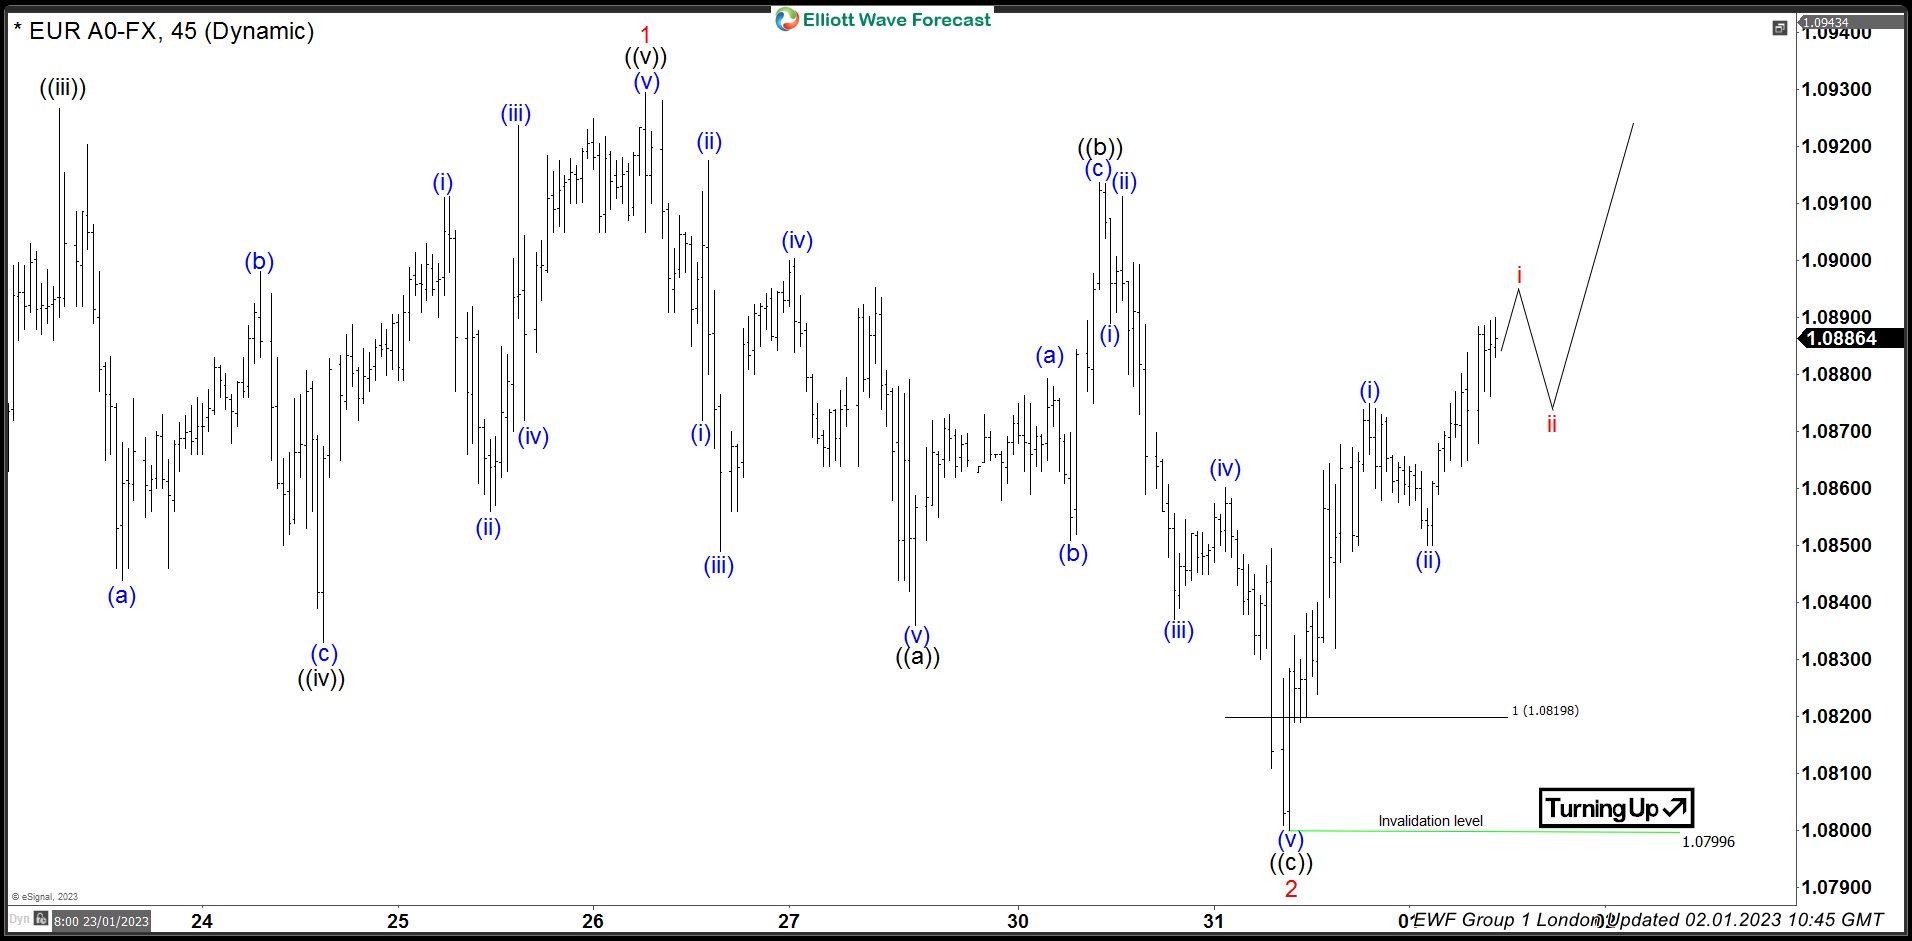
EURUSD H1 London Update 02.01.2023
The pair is giving us nice reaction from the marked zone and we count 2 red red pull back completed at 1.0799 low. Now, as far as the price holds above that low we expect to see further extension higher and break above 1 red high : 01/26 to confirm next leg up is in progress.
EURUSD H1 London Update 02.02.2023
The pair made further rally as expected. We got break of 1 red ( 01/26) peak, confirming next leg up is in progress. EURUSD can remain supported in near term as far as 1.0800 pivot holds. It should ideally keep finding buyers in 3,7,11 swings.
Keep in mind that market is dynamic and presented view could have changed in the mean time. You can check most recent updates in the membership area of the website. Remember that not every chart is trading recommendation. Best instruments to trade are those having incomplete bullish or bearish swings sequences. We put them in Sequence Report and best among them are shown in the Live Trading Room. You can check most recent charts in the membership area of the site.
Aussie Hits 8-month High after Fed Meet
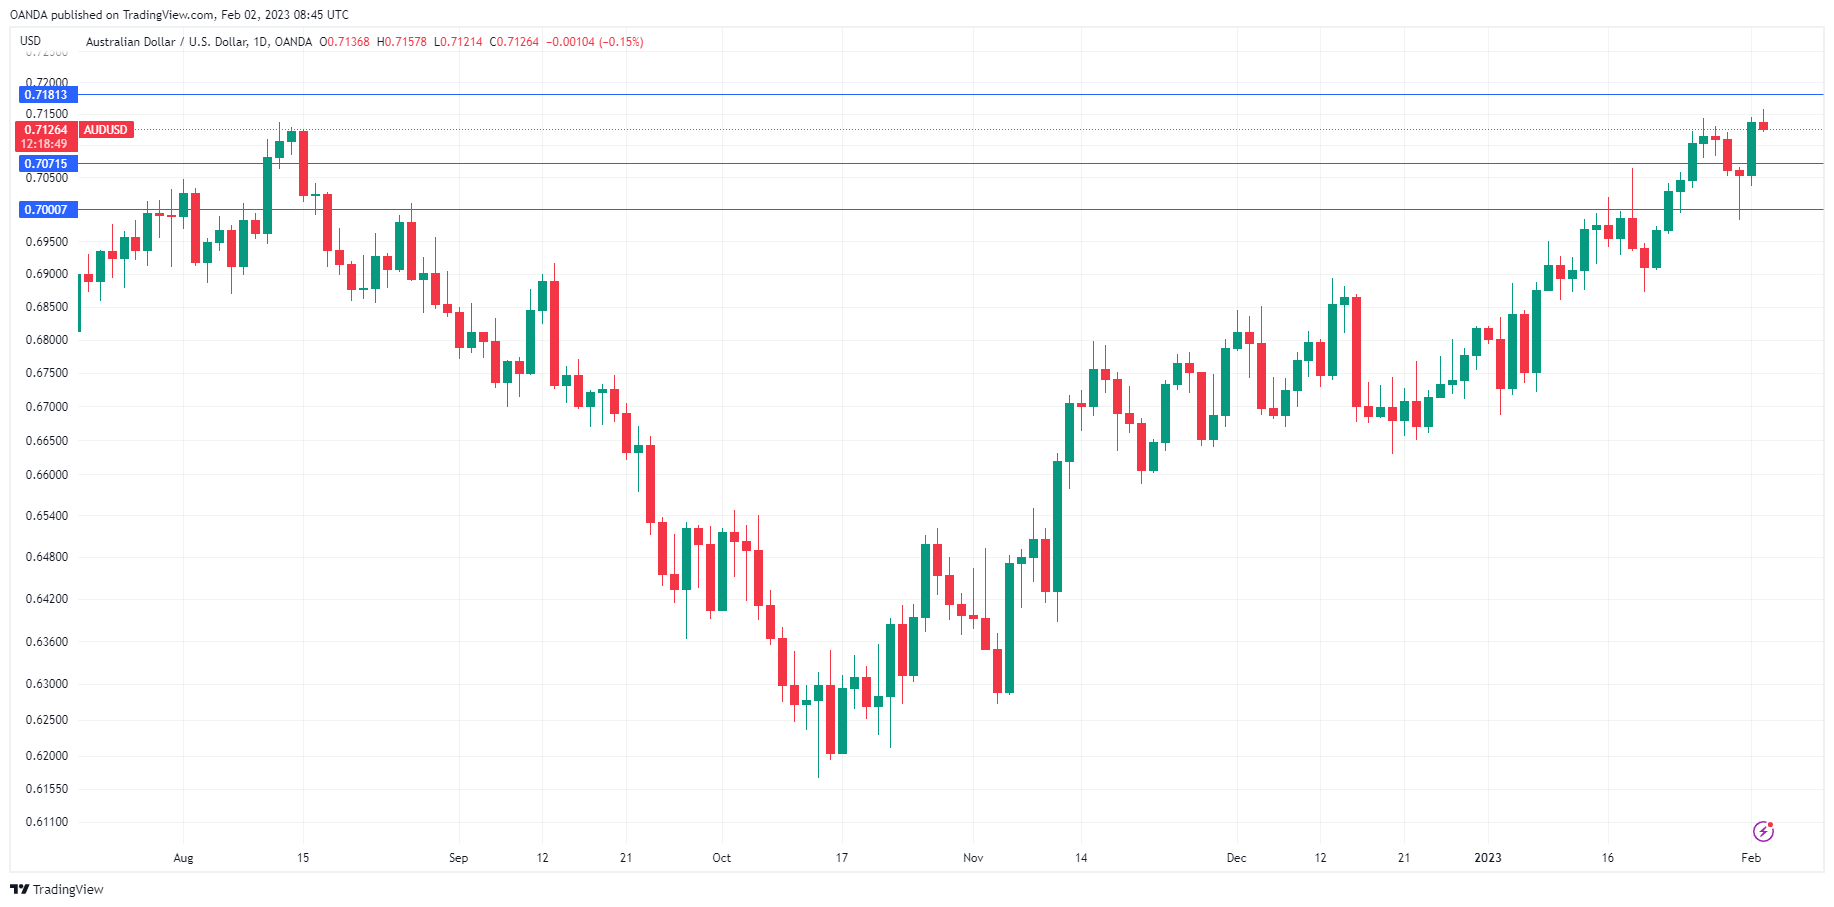
After a sluggish start to the week, AUD/USD bounced back on Wednesday with gains of 1.18%. The pair has edged lower on Thursday and is trading at 0.7137 in the European session.
Powell sends US dollar lower
The Federal Reserve raised rates by 25 basis points at the Wednesday meeting, as expected. The Fed noted that inflation has eased but reminded listeners that it remained much higher than the 2% target. Jerome Powell signaled that more rate hikes are coming and said he did not expect to cut rates this year. Sounds hawkish, right? Well, the US dollar initially recorded gains but headed lower after Powell acknowledged that the disinflation process had begun, which was sweet music to the ears of the financial markets. The result was a dovish hike and the Australian dollar surged against its US counterpart. The US dollar index is in retreat and has fallen to 100.99.
There are two more inflation reports ahead of the Mar. 22 meeting and if they show inflation continues to fall, the Fed could wrap up the current rate-tightening cycle at that meeting. Besides inflation, the Fed is focused on employment data, which will make Friday’s nonfarm employment report an important factor in the Fed’s rate plans. In December, nonfarm payrolls fell from 256,000 to 223,000 and the downturn is expected to continue, with an estimate of 190,000 for January.
The Reserve Bank of Australia meets next week and is expected to deliver a modest 25-basis point hike. The cash rate is currently at 3.10% and the markets are estimating that the peak rate will rise to somewhere between 3.6%-3.85%. This means that more hikes are on the way after February, but the pace of the rates will be data-dependent, especially on inflation reports.
AUD/USD Technical
- AUD/USD faces resistance at 0.7181 and 0.7282
- 0.7071 has switched to support, followed by 0.7000
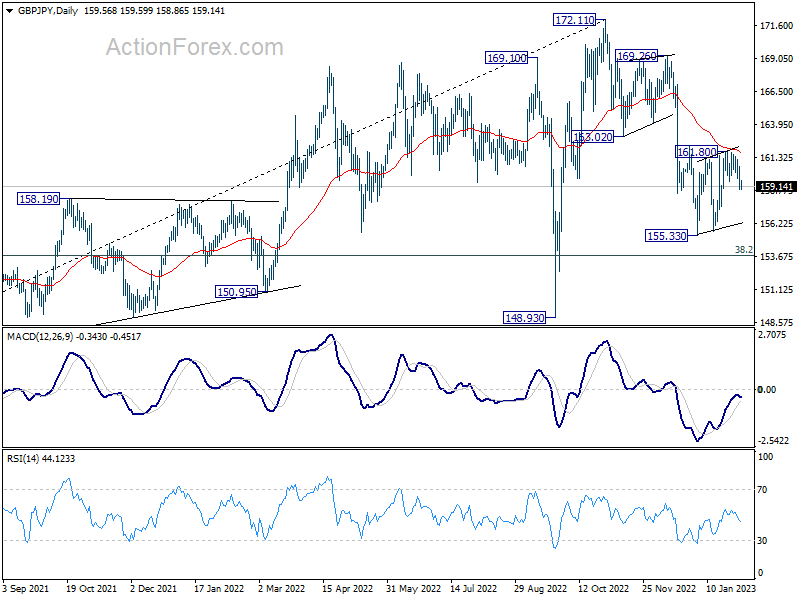
GBP/JPY Daily Outlook
Daily Pivots: (S1) 158.77; (P) 159.73; (R1) 160.53; More…
Intraday bias in GBP/JPY stays neutral for the moment. On the upside, sustained trading above 55 day EMA (now at 161.70) will turn bias to the upside, for stronger rise back to 169.26/172.11 resistance zone. On the downside, break of 155.33 low will resume the fall form 172.11 to 153.70 fibonacci level next.
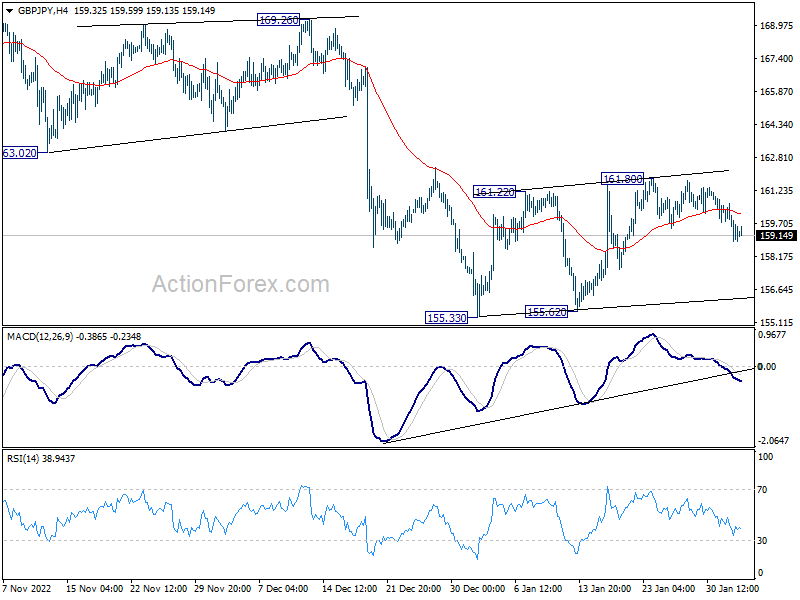
In the bigger picture, as long as 163.02 support turned resistance holds, decline from 172.11 medium term top is expected to continue to 38.2% retracement of 123.94 to 172.11 at 153.70. Sustained break there will raise the change of trend reversal and target 61.8% retracement at 142.34. Nevertheless, break of 163.02 support turned resistance will argue that the decline has completed, and retain medium term bullishness.