Sample Category Title
EUR/JPY Daily Outlook
Daily Pivots: (S1) 141.15; (P) 141.49; (R1) 142.07; More….
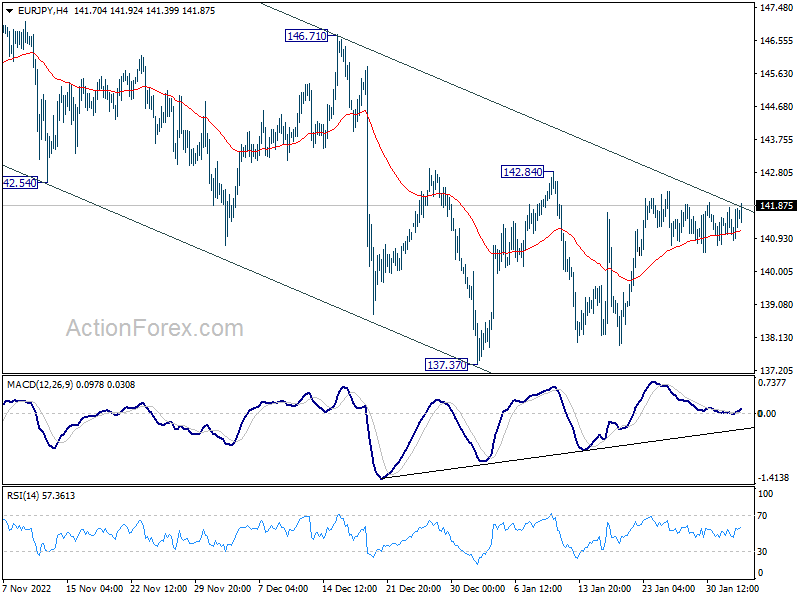
Intraday bias in EUR/JPY remains neutral at this point. On the upside, decisive break of 142.84 resistance will argue that the correction from 148.38 has completed. Stronger rally should then be seen back to 146.71 resistance. On the downside, however, break of 137.37 will resume the whole decline from 148.38 to 135.40 fibonacci level next.
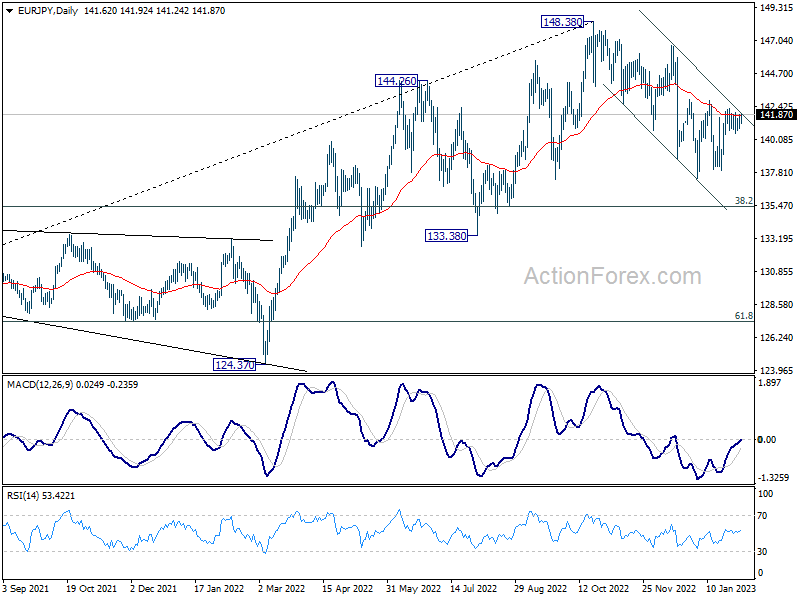
In the bigger picture, as long as 55 week EMA (now at 138.81) holds, larger up trend from 114.42 (2020 low) is still in progress for 149.76 long term resistance. However, firm break of 55 week EMA will bring deeper fall to 38.2% retracement of 114.42 to 148.38 at 135.40. Sustained break there will raise the chance of trend reversal, and target 61.8% retracement at 127.39.
EUR/GBP Daily Outlook
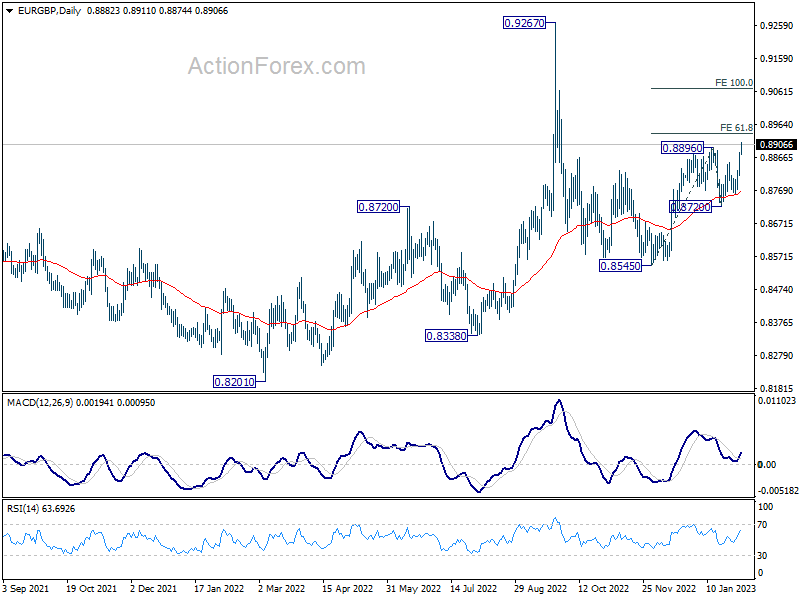
Daily Pivots: (S1) 0.8835; (P) 0.8860; (R1) 0.8906; More…
EUR/GBP's rally from 0.8545 resumed by breaking through 0.8896 resistance. Intraday bias is back on the upside for 61.8% projection of 0.8545 to 0.8896 from 0.8720 at 0.8937. Firm break there could prompt upside acceleration to 100% projection at 0.9071. On the downside, break of 0.8720 support is now needed to indicate short term topping. Or, outlook will remain bullish in case of retreat.
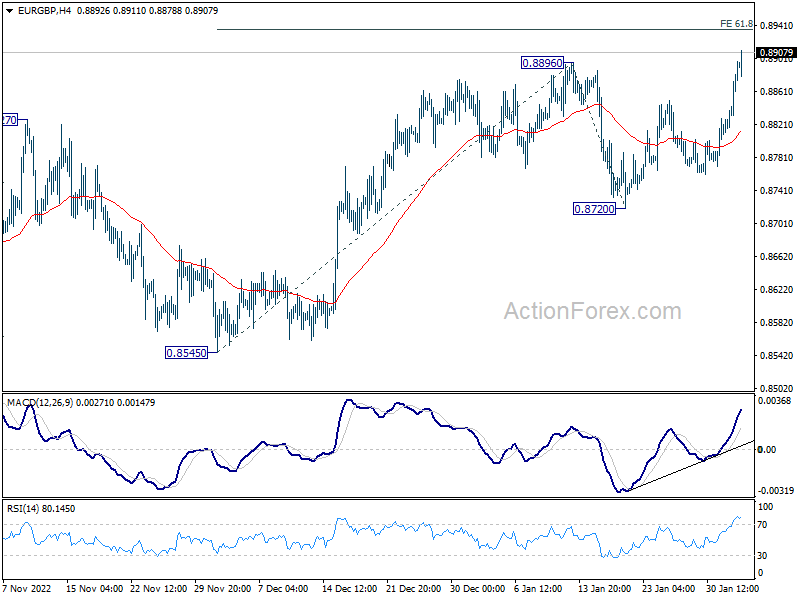
In the bigger picture, the notable support from 55 day EMA (now at 0.8752) retains near term bullishness. Break of 0.8896 should target 0.9267 (2022 high) and possibly above, to resume whole up trend from 0.8201 (2022 low). However, break of 0.8270 support and sustained trading below 55 day EMA will set the stage for 0.8545 and below.
EUR/AUD Daily Outlook
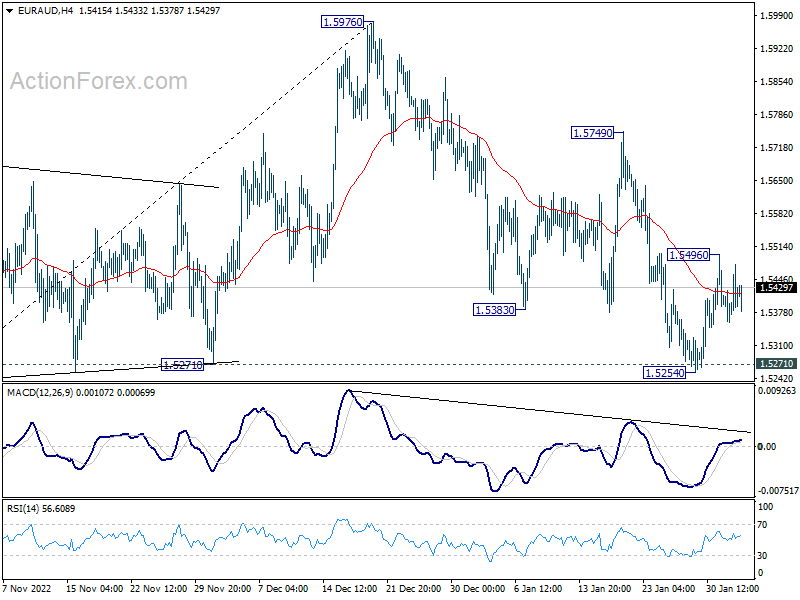
Daily Pivots: (S1) 1.5346; (P) 1.5412; (R1) 1.5465; More…
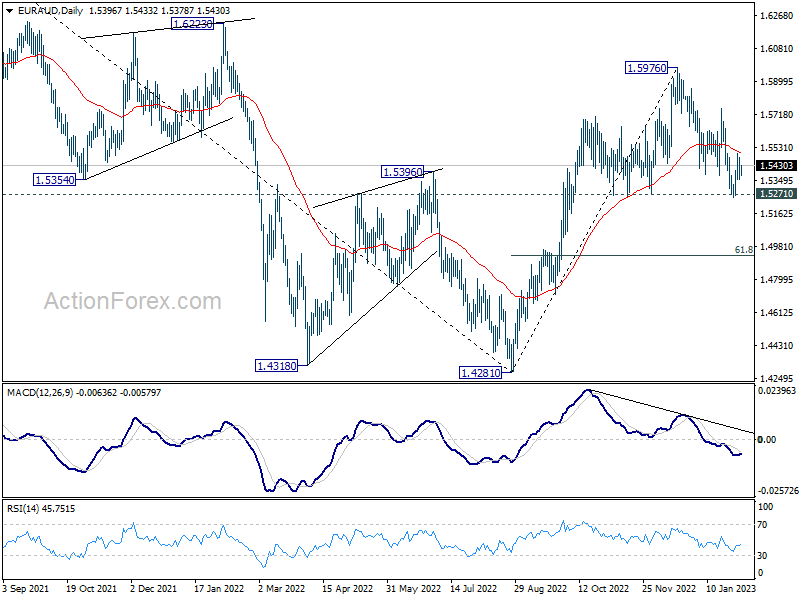
Intraday bias in EUR/AUD remains neutral for the moment. On the upside, above 1.5496 will affirm the case of short term bottoming 1.5254, after defending 1.5271 key support. Intraday bias will then be turned back to the upside for 1.5749 resistance and above. On the downside, decisive break of 1.5271 will carry larger bearish implication and bring deeper fall to 61.8% retracement of 1.4281 to 1.5976 at 1.4928.
In the bigger picture, it's still early to confirm if rise from 1.4281 represents bullish trend reversal. But as long as 1.5271 support holds, such rally is in favor to continue. Break of 1.5976 will target 1.6434 key resistance next. On the other hand, firm break of 1.5271 will retain medium term bearishness instead.
EUR/CHF Daily Outlook
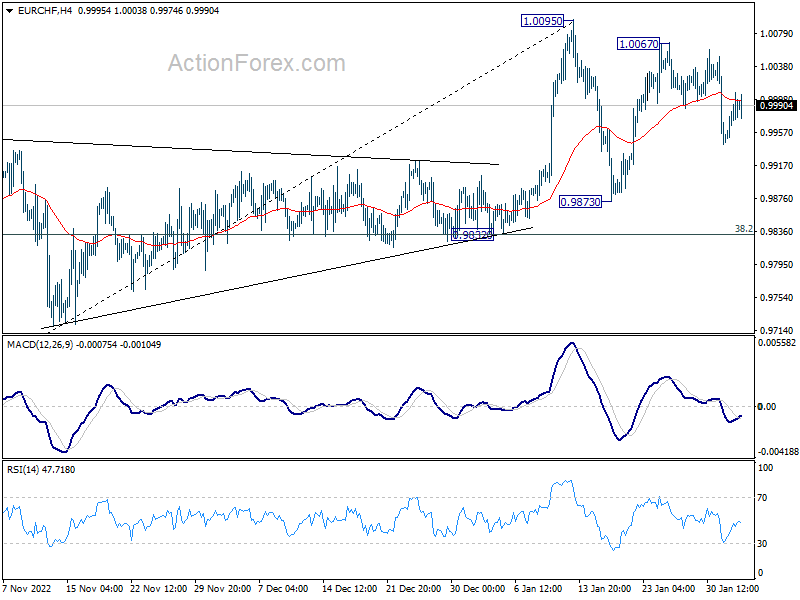
Daily Pivots: (S1) 0.9952; (P) 0.9981; (R1) 1.0013; More….
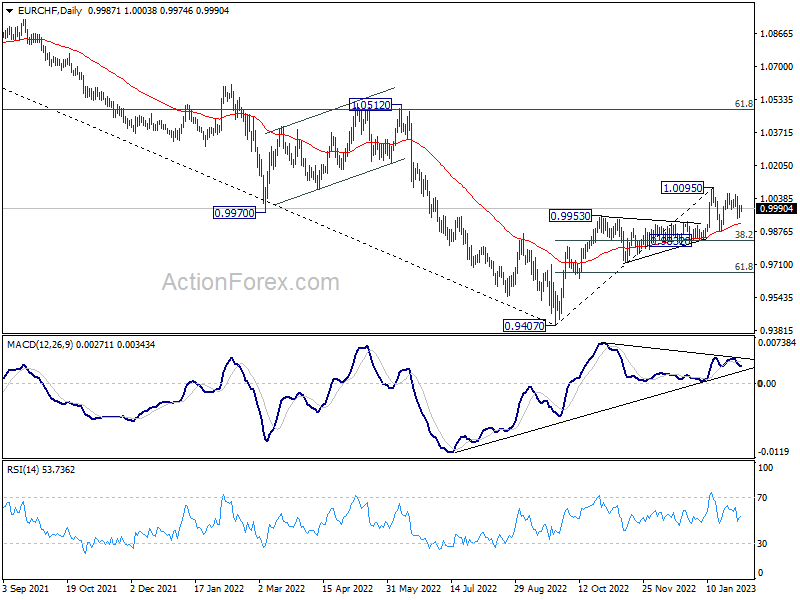
Intraday bias in EUR/CHF is turned neutral first with current recovery. Outlook is unchanged that corrective pattern from 1.0095 is extending. Risk will stay on the downside as long as 1.0067 resistance holds. IN case of another fall, break of 0.9873 support could be seen. But downside should be contained by 38.2% retracement of 0.9407 to 1.0095 at 0.9832 to bring rebound.
In the bigger picture, the initial rejection by 55 week EMA (now at 1.0039) mixed up the outlook. On the upside, sustained trading above 55 week EMA will raise the chance of bullish trend reversal. Rise from 0.9407 should then target 1.0505 cluster resistance (2020 low at 1.0505, 61.8% retracement of 1.1149 to 0.9407 at 1.1484). However, firm break of 0.9832 support will revive medium term bearishness and bring retest of 0.9407 low instead.
AUDUSD Unlocks New 8-Month High
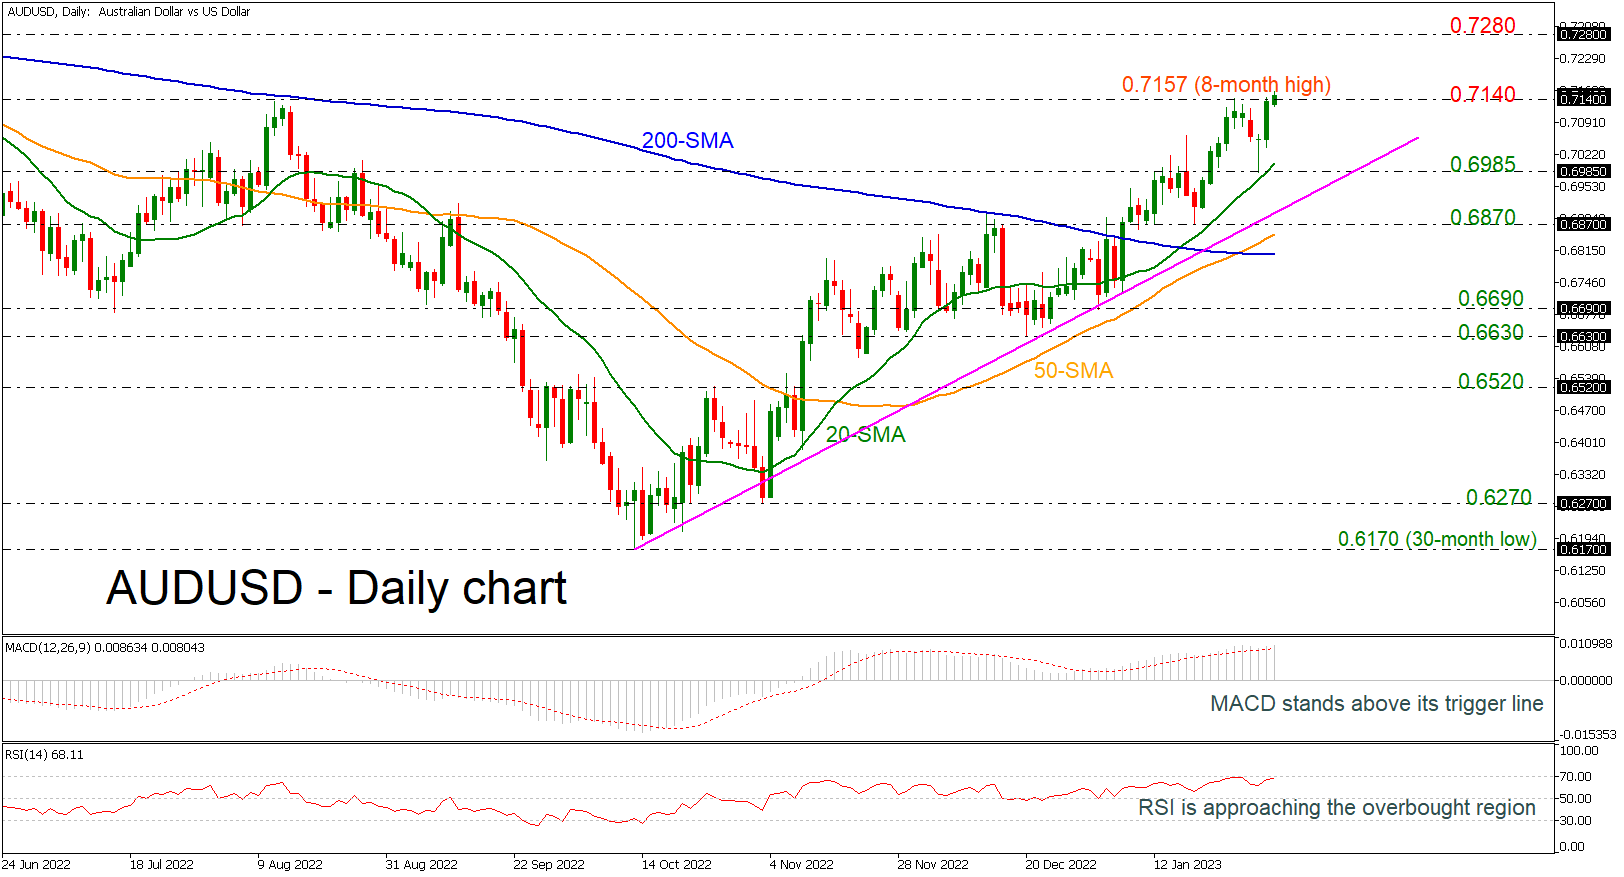
AUDUSD surged to a fresh eight-month high of 0.7157 earlier today, boosting the rebound off the 0.6985 support level. The price is creating a steep bullish tendency after it bottomed at 0.6170 with the technical oscillators standing in positive region. The MACD is extending its move above its trigger and zero lines, while the RSI is approaching the overbought region.
More increases could open the way towards the 0.7280 resistance, taken from the high in May 2022, while if the bulls hold control and move higher they could reach the inside swing high of 0.7555, registered in October 2021.
Alternatively, a drop lower could meet the 20-day simple moving average (SMA) near the 0.6985 support level. A step below the uptrend line could change the outlook to neutral, challenging the 0.6870 barrier and the bullish crossover within the 50- and the 200-day SMAs at 0.6815.
Summarizing, AUDUSD is currently strongly bullish; however, any moves beneath the 200-day SMA could switch the bias to bearish.
WTI Oil Futures Retreat Below 50-day SMA
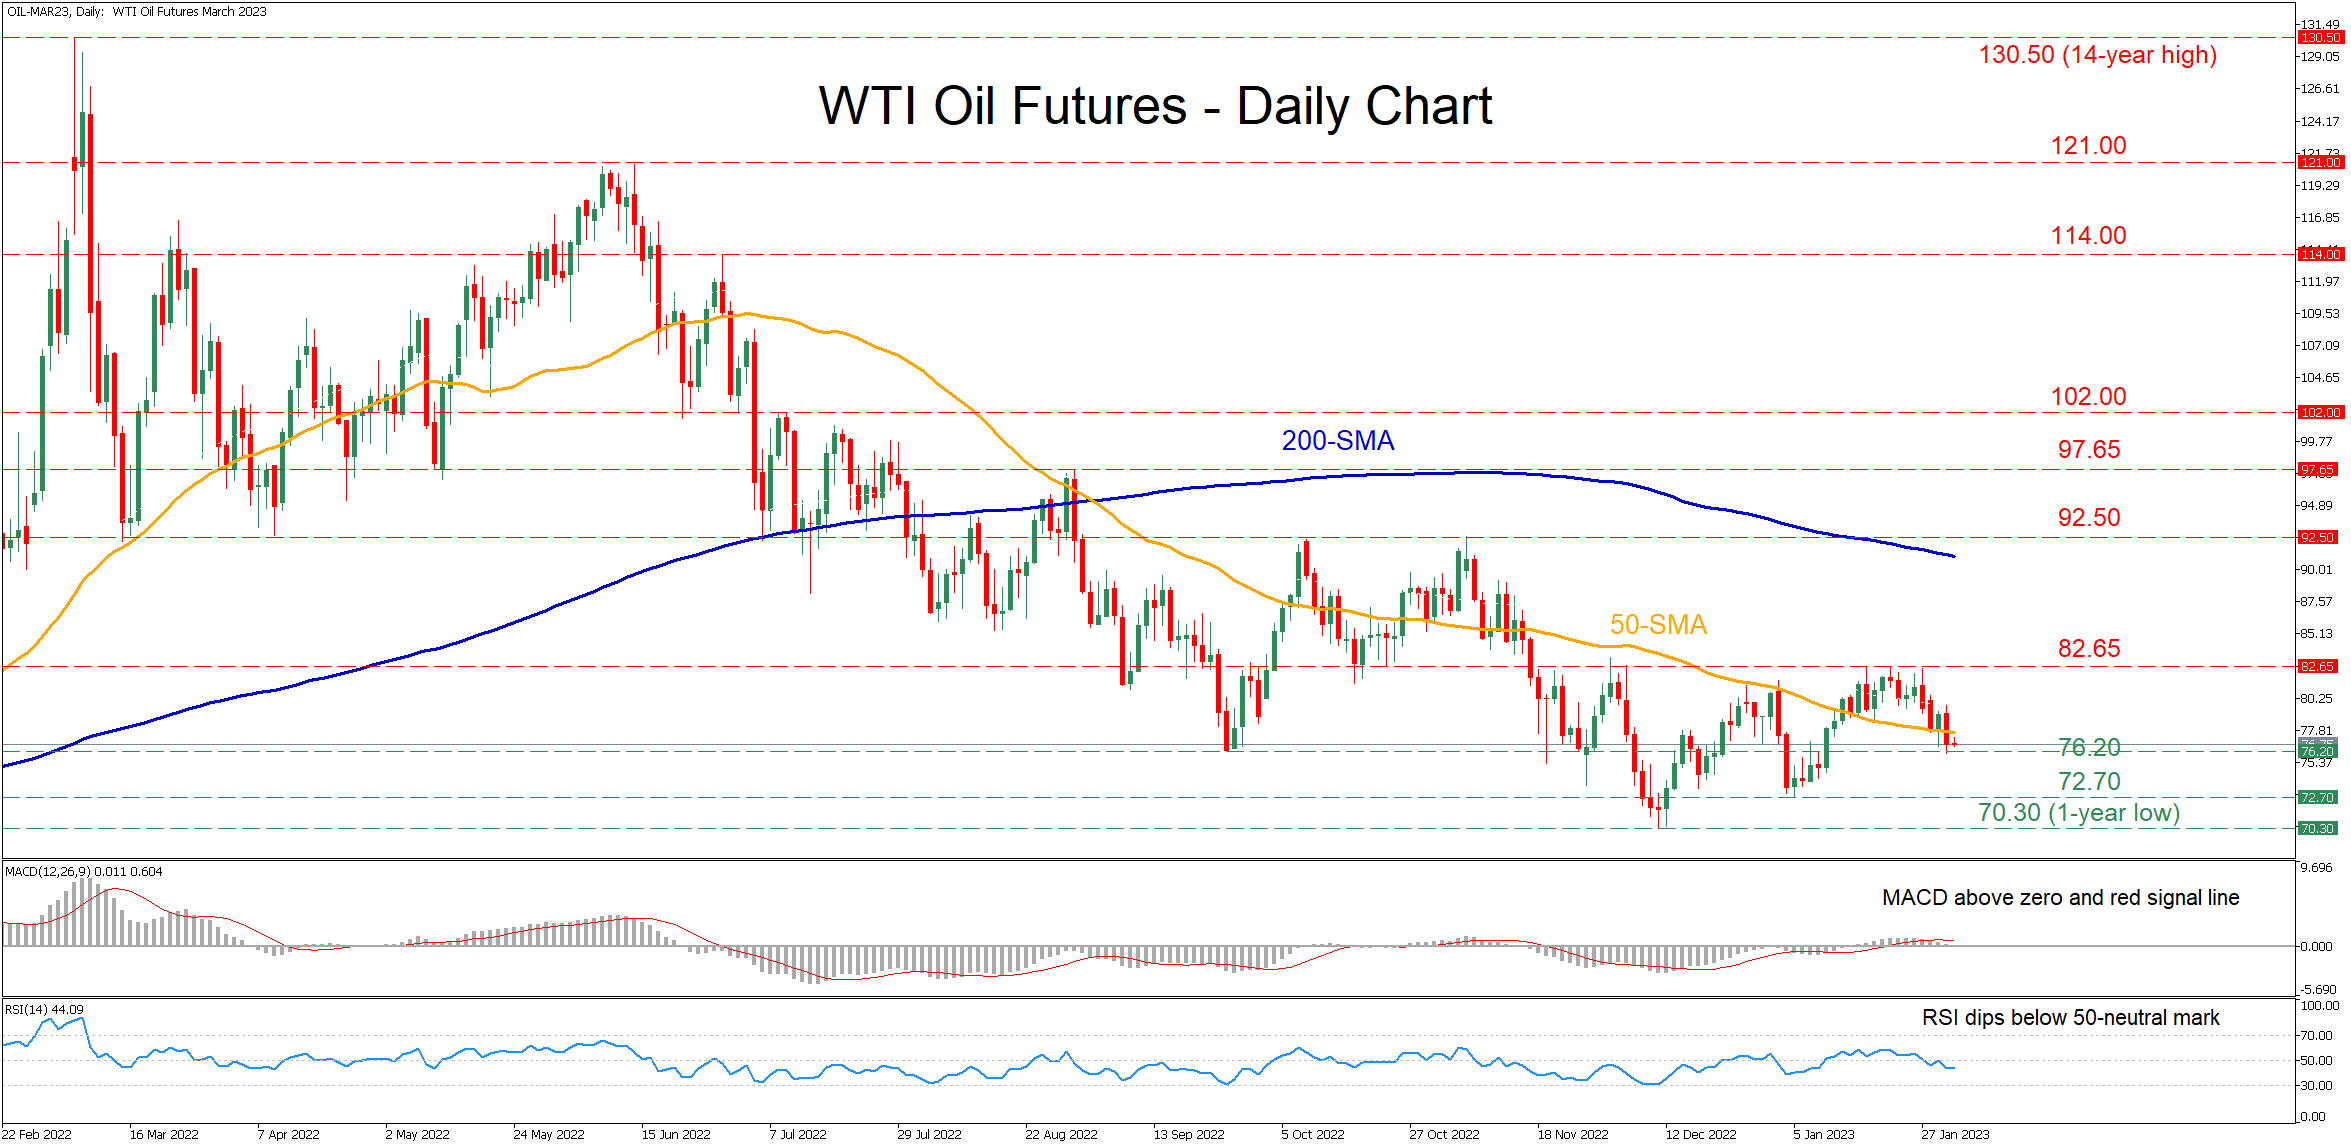
WTI oil futures (March delivery) have been stuck in a prolonged downtrend since June, posting a fresh one year-low of 70.30 in December. In the short-term, the commodity has begun another round of weakness, with the price dropping beneath its 50-day simple moving average (SMA).
The momentum indicators currently suggest that selling pressures are intensifying. Specifically, the MACD histogram has dropped below its red signal but remains above zero, while the RSI is flatlining below its 50-neutral mark.
To the downside, if the price extends its decline, immediate support could be found at the recent low of 76.20. Piercing through that zone, the commodity could challenge the 2023 bottom of 72.70. A break below that region may pave the way for the one-year low of 70.30.
On the flipside, should buyers regain control and push the price above the 50-day SMA, the recent resistance region of 82.65 might curb an initial rebound. Conquering this barricade, the bulls could aim for the November high of 92.50 before the 97.65 hurdle appears on the radar. Even higher, the price advance could cease at 102.00, which acted both as support and resistance in June.
In brief, WTI oil futures’ technical picture seems to be deteriorating as the price fell below the crucial 50-day SMA. For that bearish sentiment to reverse, the commodity needs to reclaim the aforementioned technical level.
NZD/USD Bullish for 2023, More Upside after A-B-C Pullback – Elliott Wave Forecast
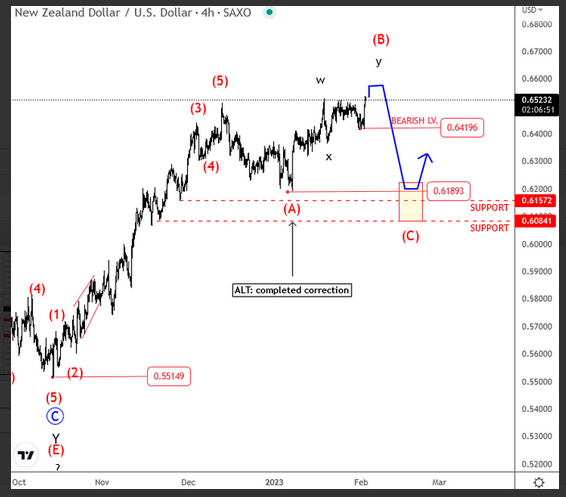
NZD/USD turned bullish as expected after we spotted a completed five-wave bearish cycle within wave C back in October 2022. Notice that the recent rise is much more extended and clearly made by five waves up without overlaps up from the lows, so it's an impulse; a change in trend that will send prices even higher in 2023. However, nothing moves in straight lines. We know that after every five waves, a three-wave correction occurs which can be underway as an irregular/expanded flat correction, currently with subwave (B) in progress, which is looking overlaping up from 0.6183, so the upside can be limited as bulls are looking tired. That said, be aware of a wave (C) still, but 0.7419 support should be taken out first.
US Oil: End of Correction Hints at New Impulse
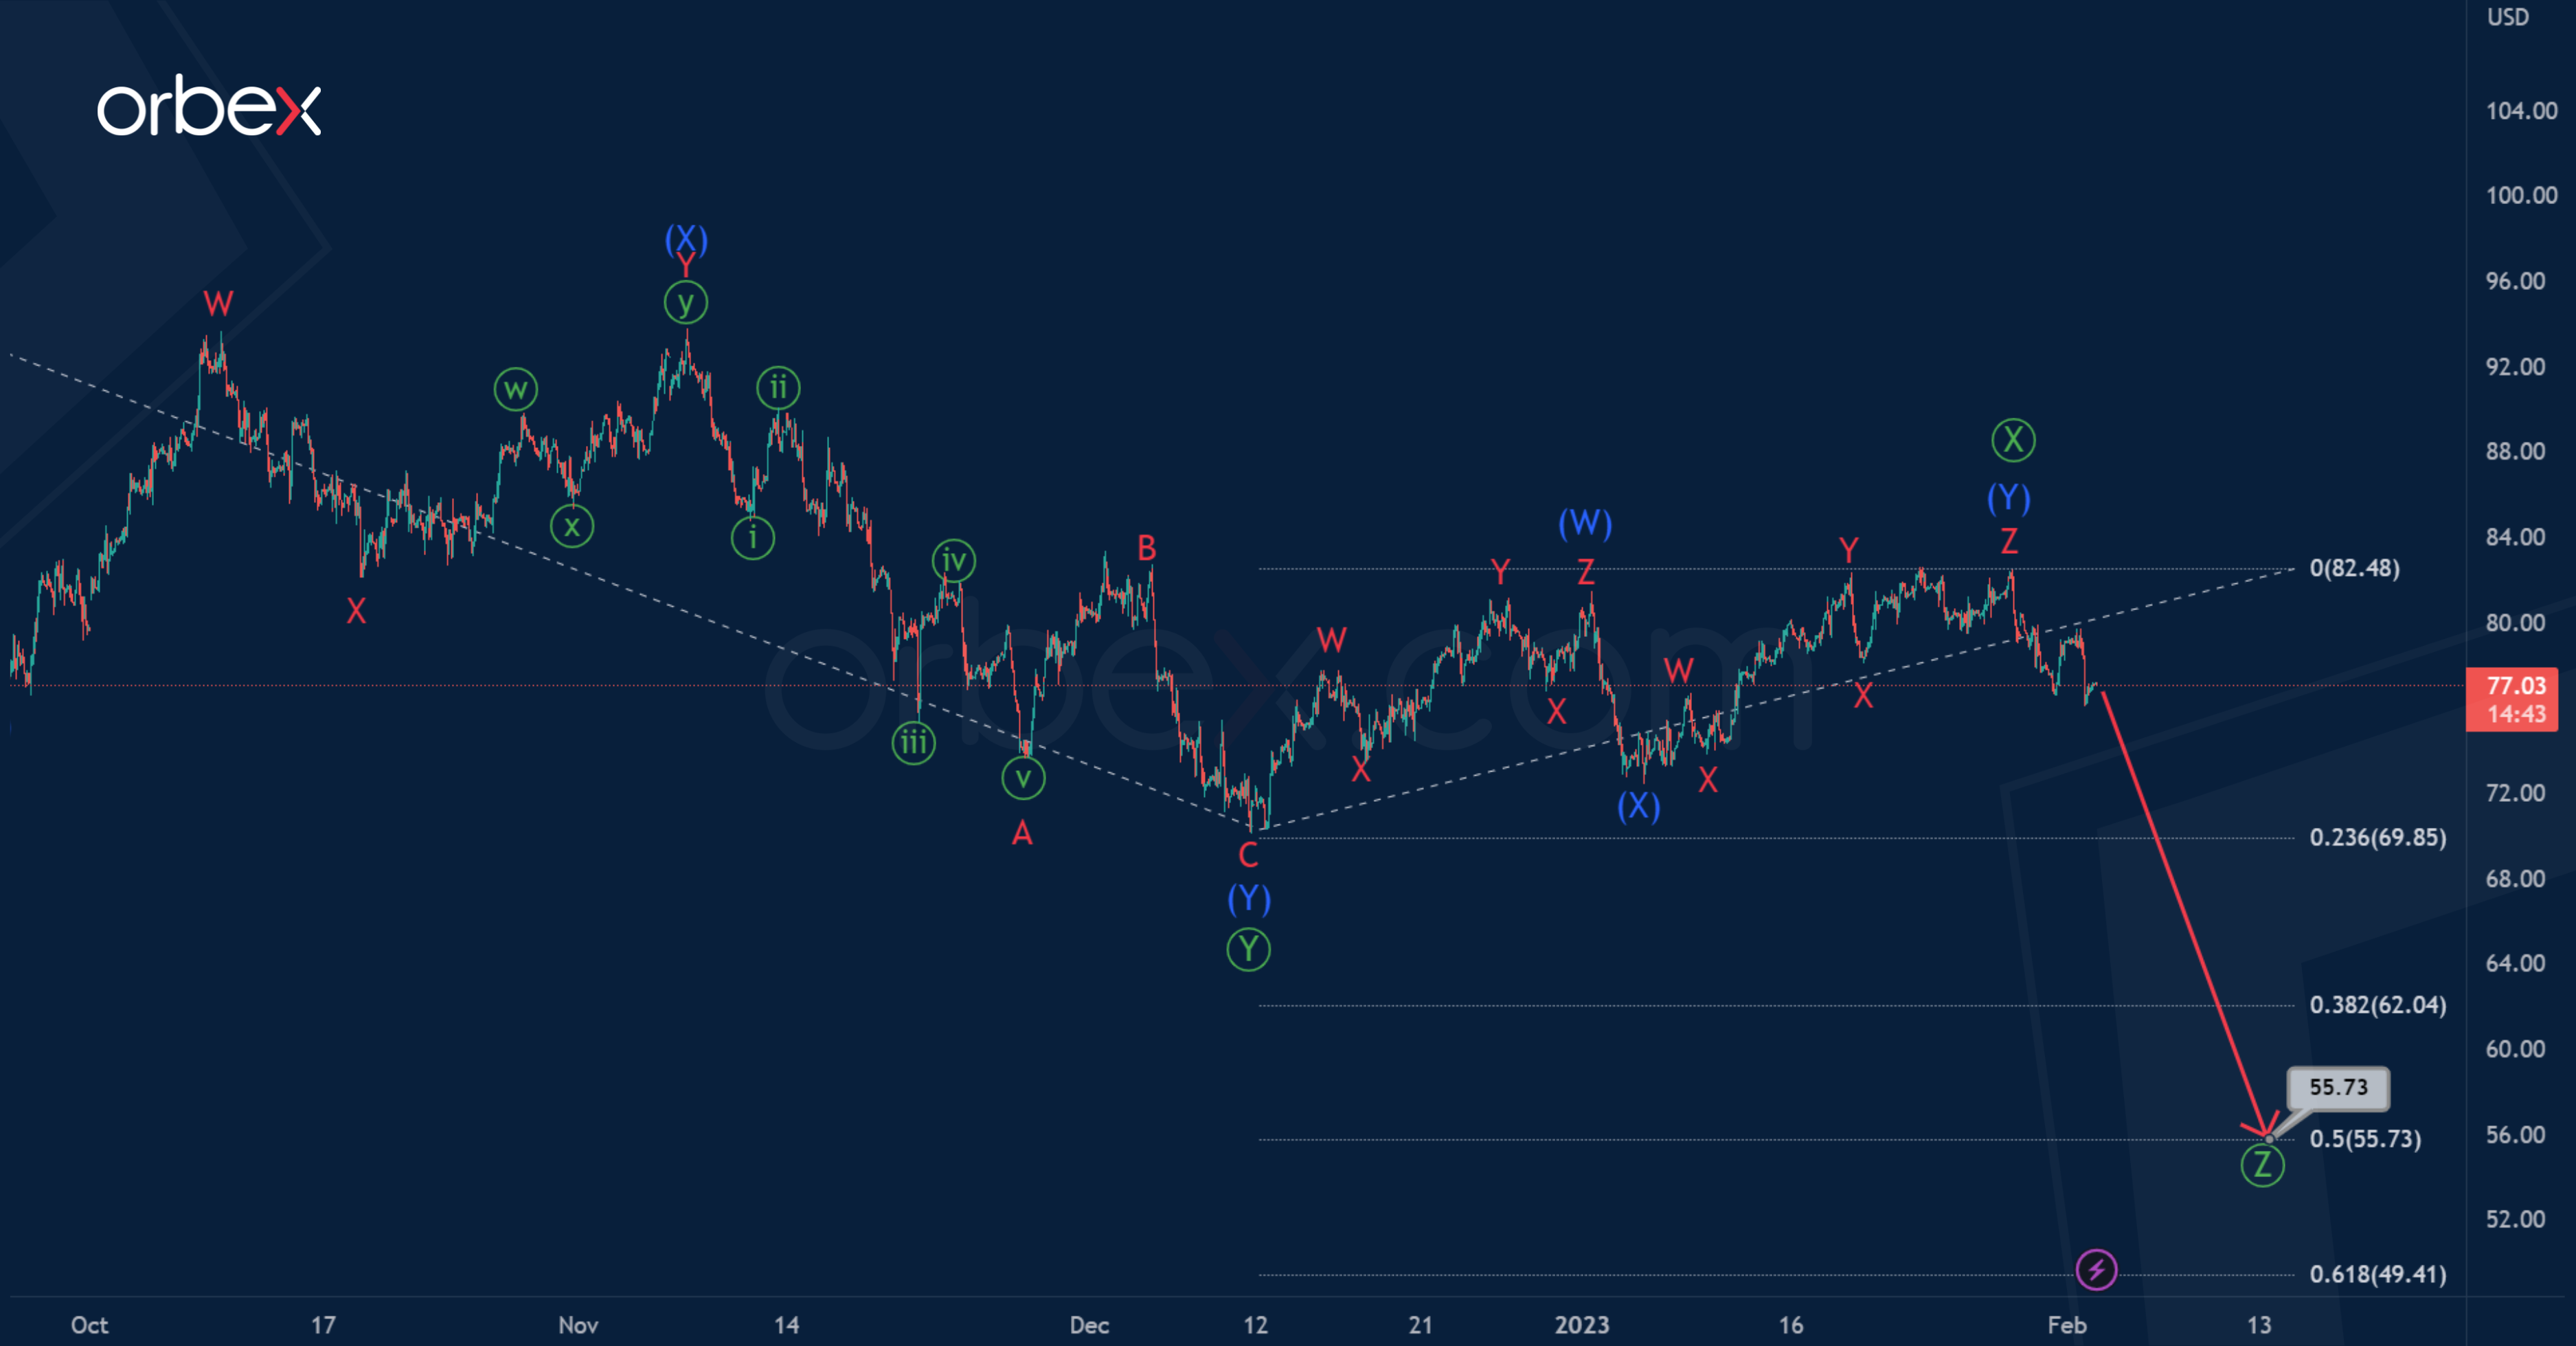
In the long term, USOIL may form a triple zigzag Ⓦ-Ⓧ-Ⓨ-Ⓧ-Ⓩ. The primary waves Ⓦ-Ⓧ-Ⓨ seem fully completed.
Since December 2022, the market has been moving in an upward primary wave Ⓧ. Perhaps it takes the form of an intermediate double zigzag (W)-(X)-(Y), and now the price is going up in the last actionary wave (Y).
It is likely that the wave (Y) will end near 90.44, taking the form of a zigzag A-B-C. At that level, wave Ⓧ will be at 38.2% of wave Ⓨ.
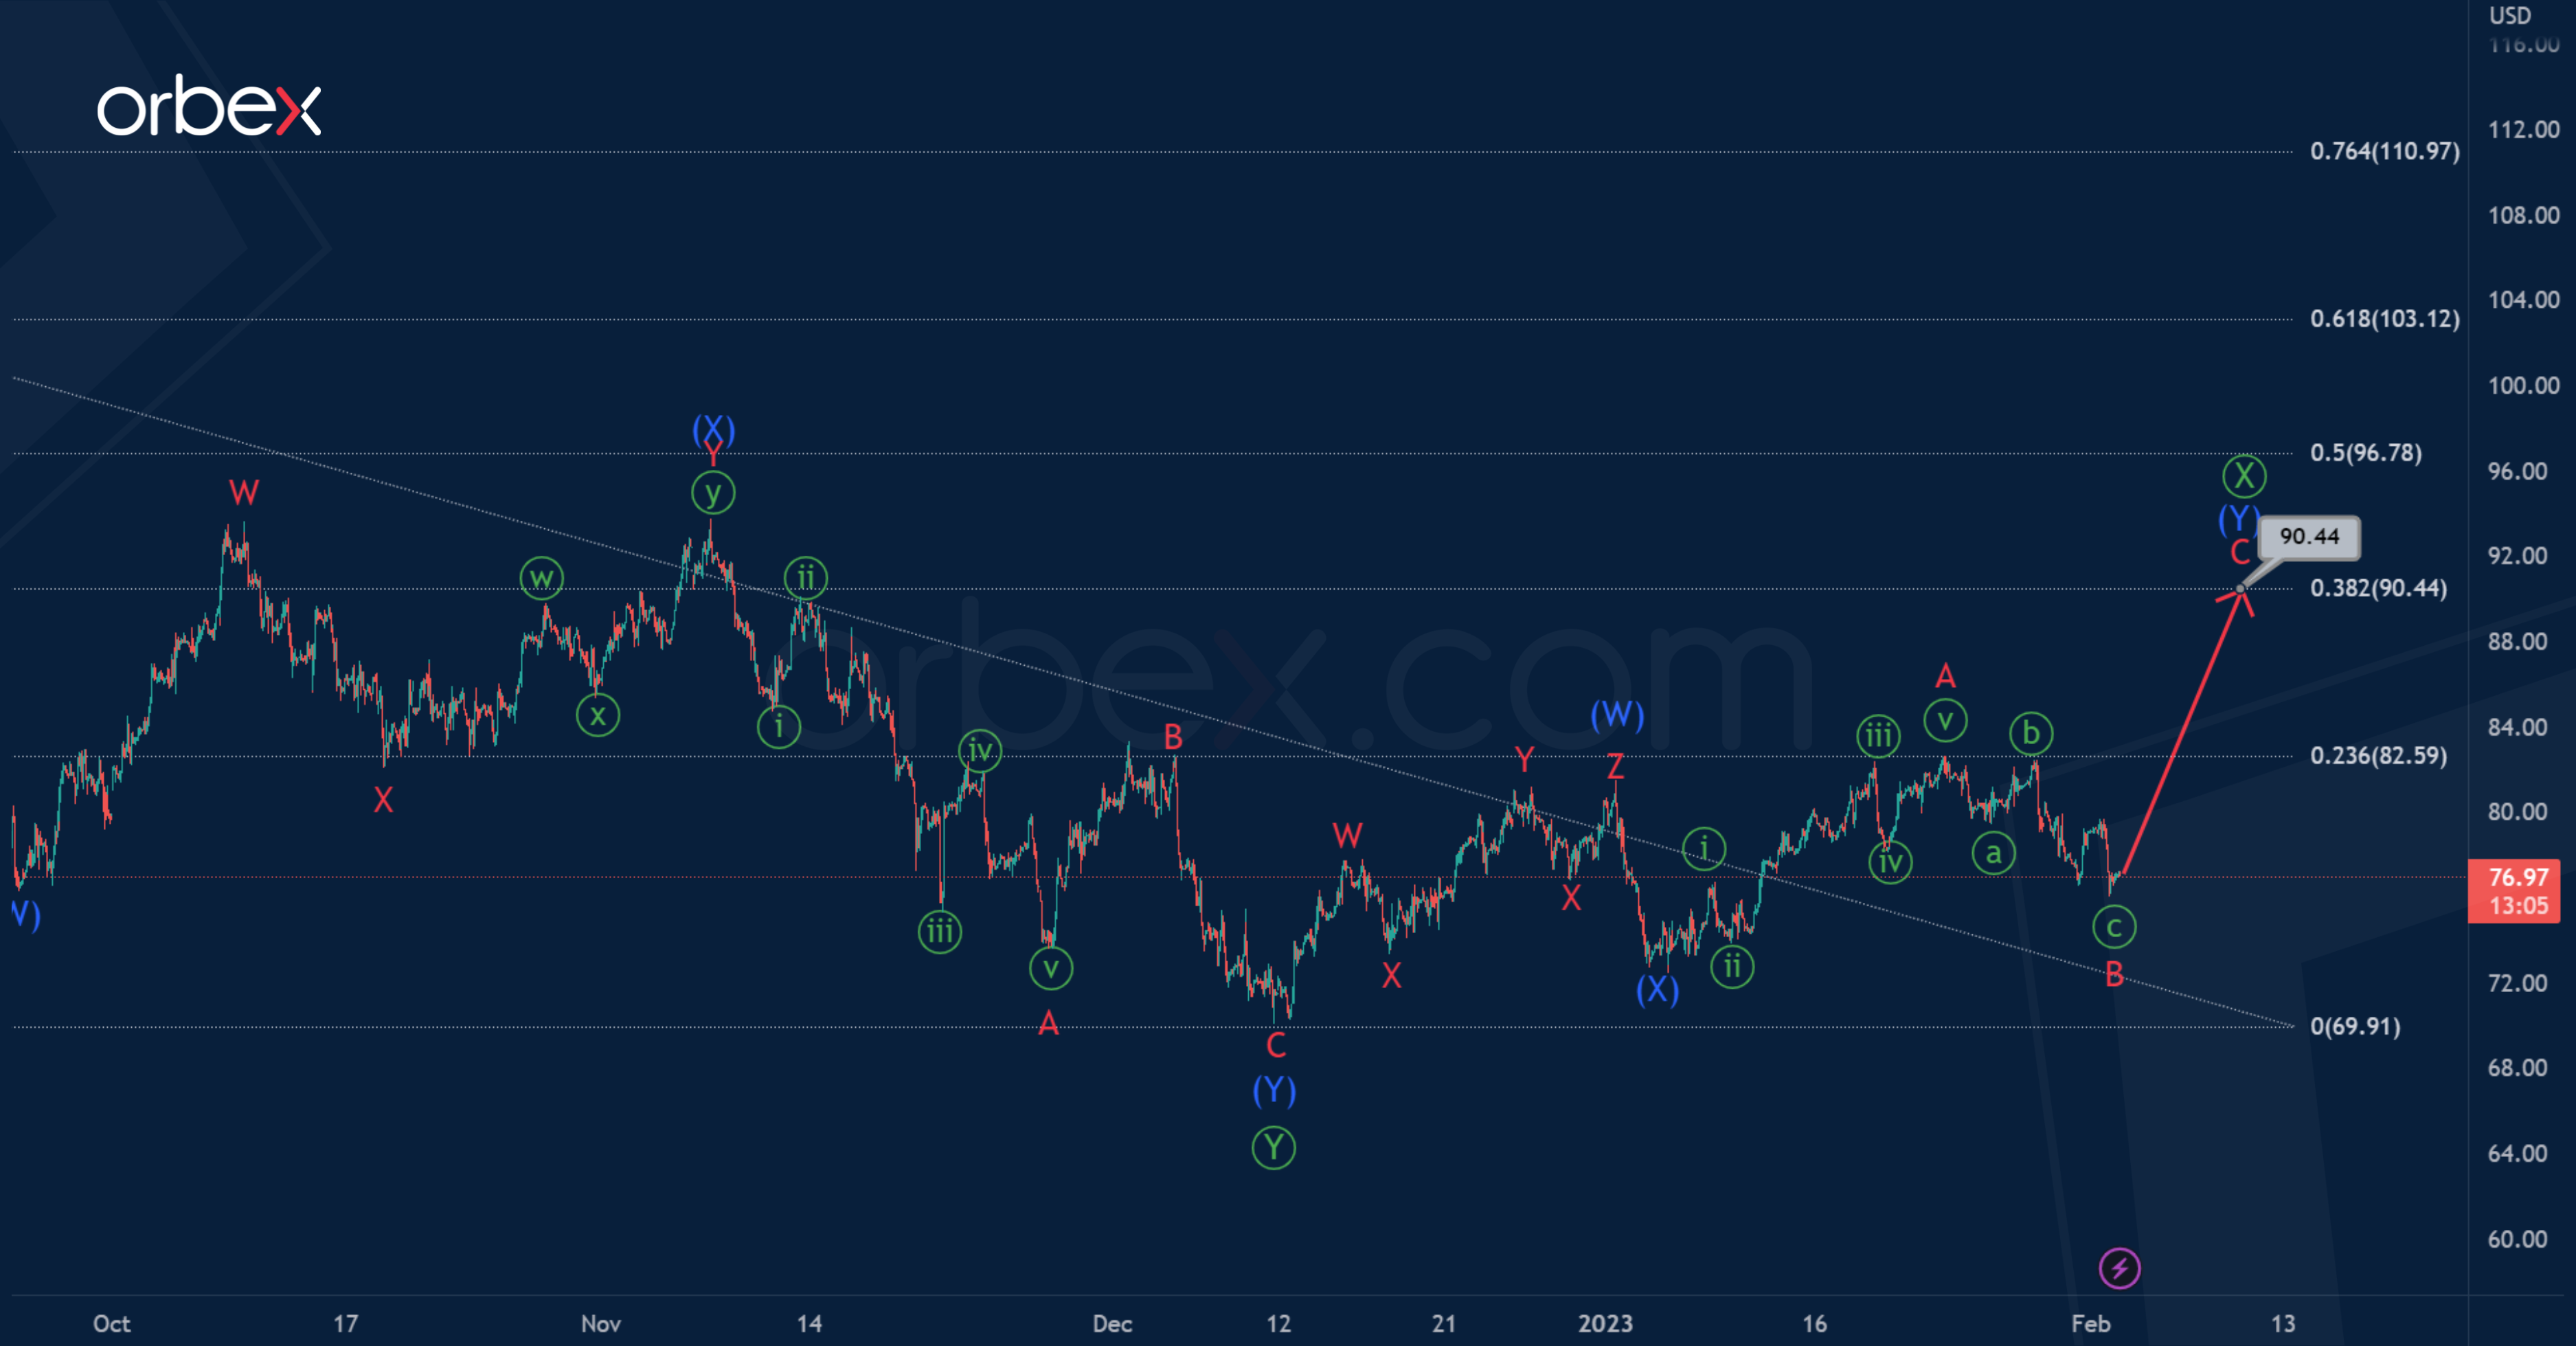
There is a possibility that the intervening wave Ⓧ has already been completed at the previous maximum of 81.70.
Most likely, now and in the near future we will observe a decline and the development of the primary actionary wave Ⓩ.
It is likely that the bearish trend will continue to 55.73. At that level, primary wave Ⓩ will be at 50% of wave Ⓨ.
US Oil Fails to Bounce
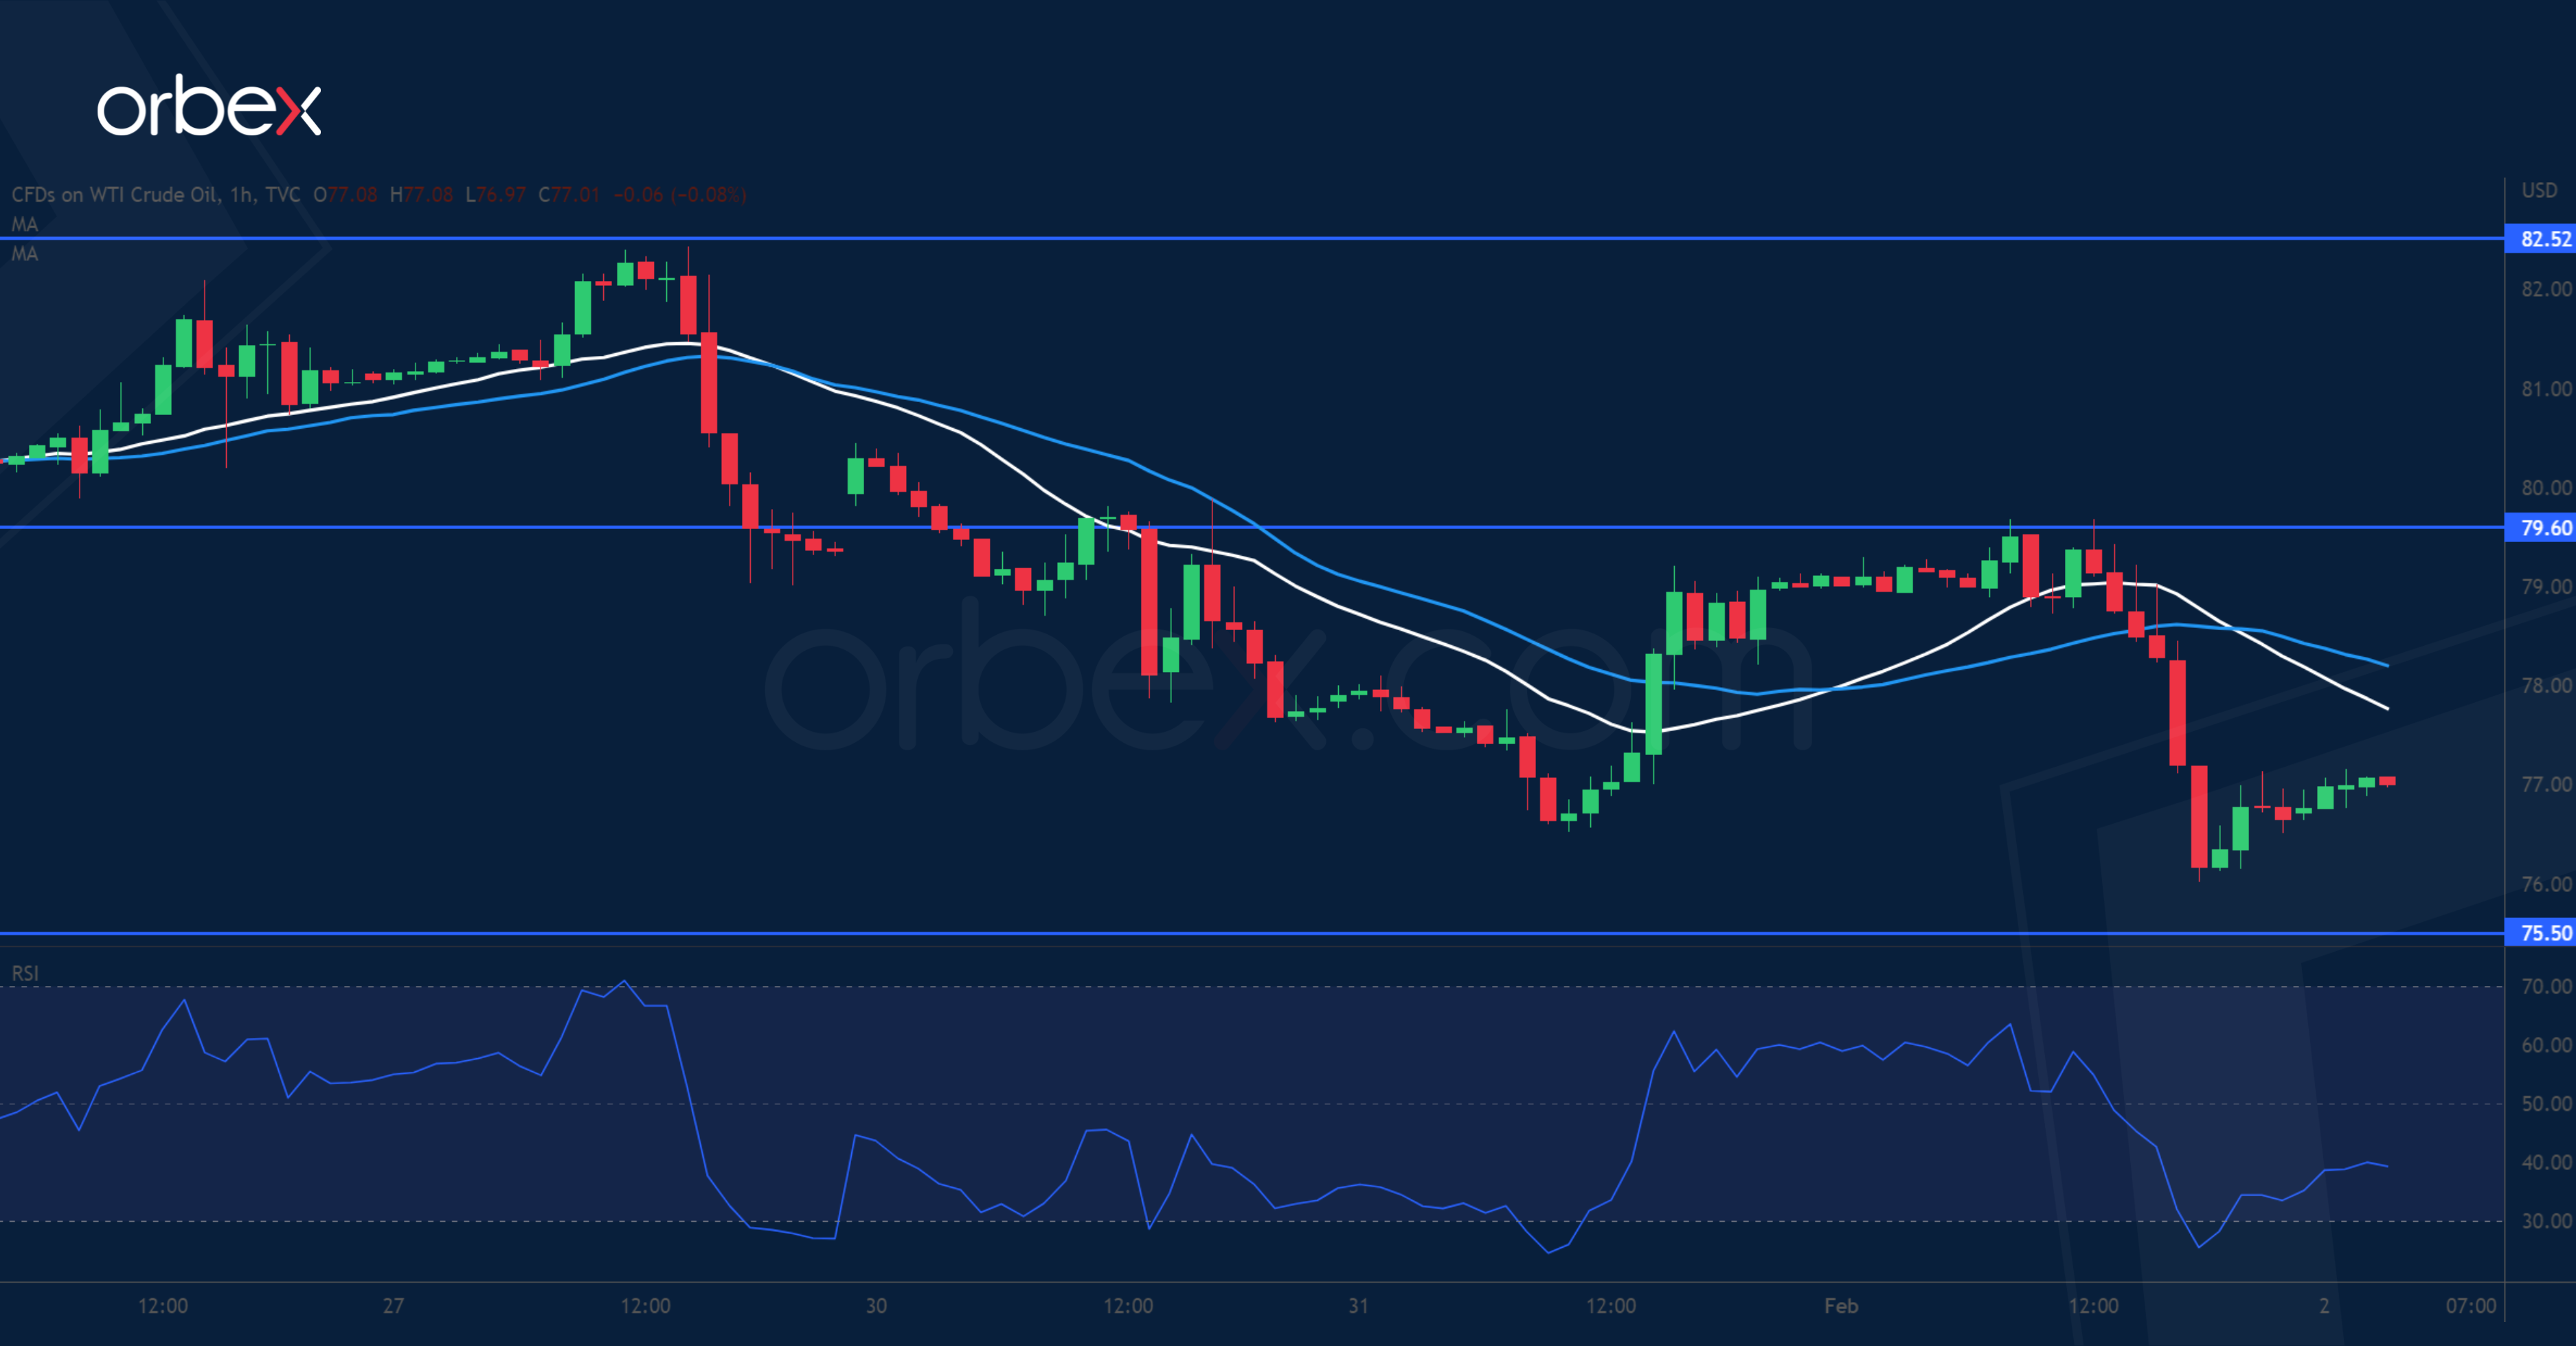
WTI crude slipped after a larger-than-expected rise in US stockpiles. A dip below the previous swing low at 78.00 has shaken out some weaker hands. A limited bounce came to a halt at 79.60 and a drop below 76.50 is a sign of renewed downward pressure. 75.50 is the next step to see if buyers would step in. Failing that, the round number at 73.00 would be in the bears’ crosshairs. The RSI’s another dip into oversold territory may lead to some bargain hunting and profit-taking but stiff selling pressure could be expected at rebounds.
XAU/USD Breaks Higher
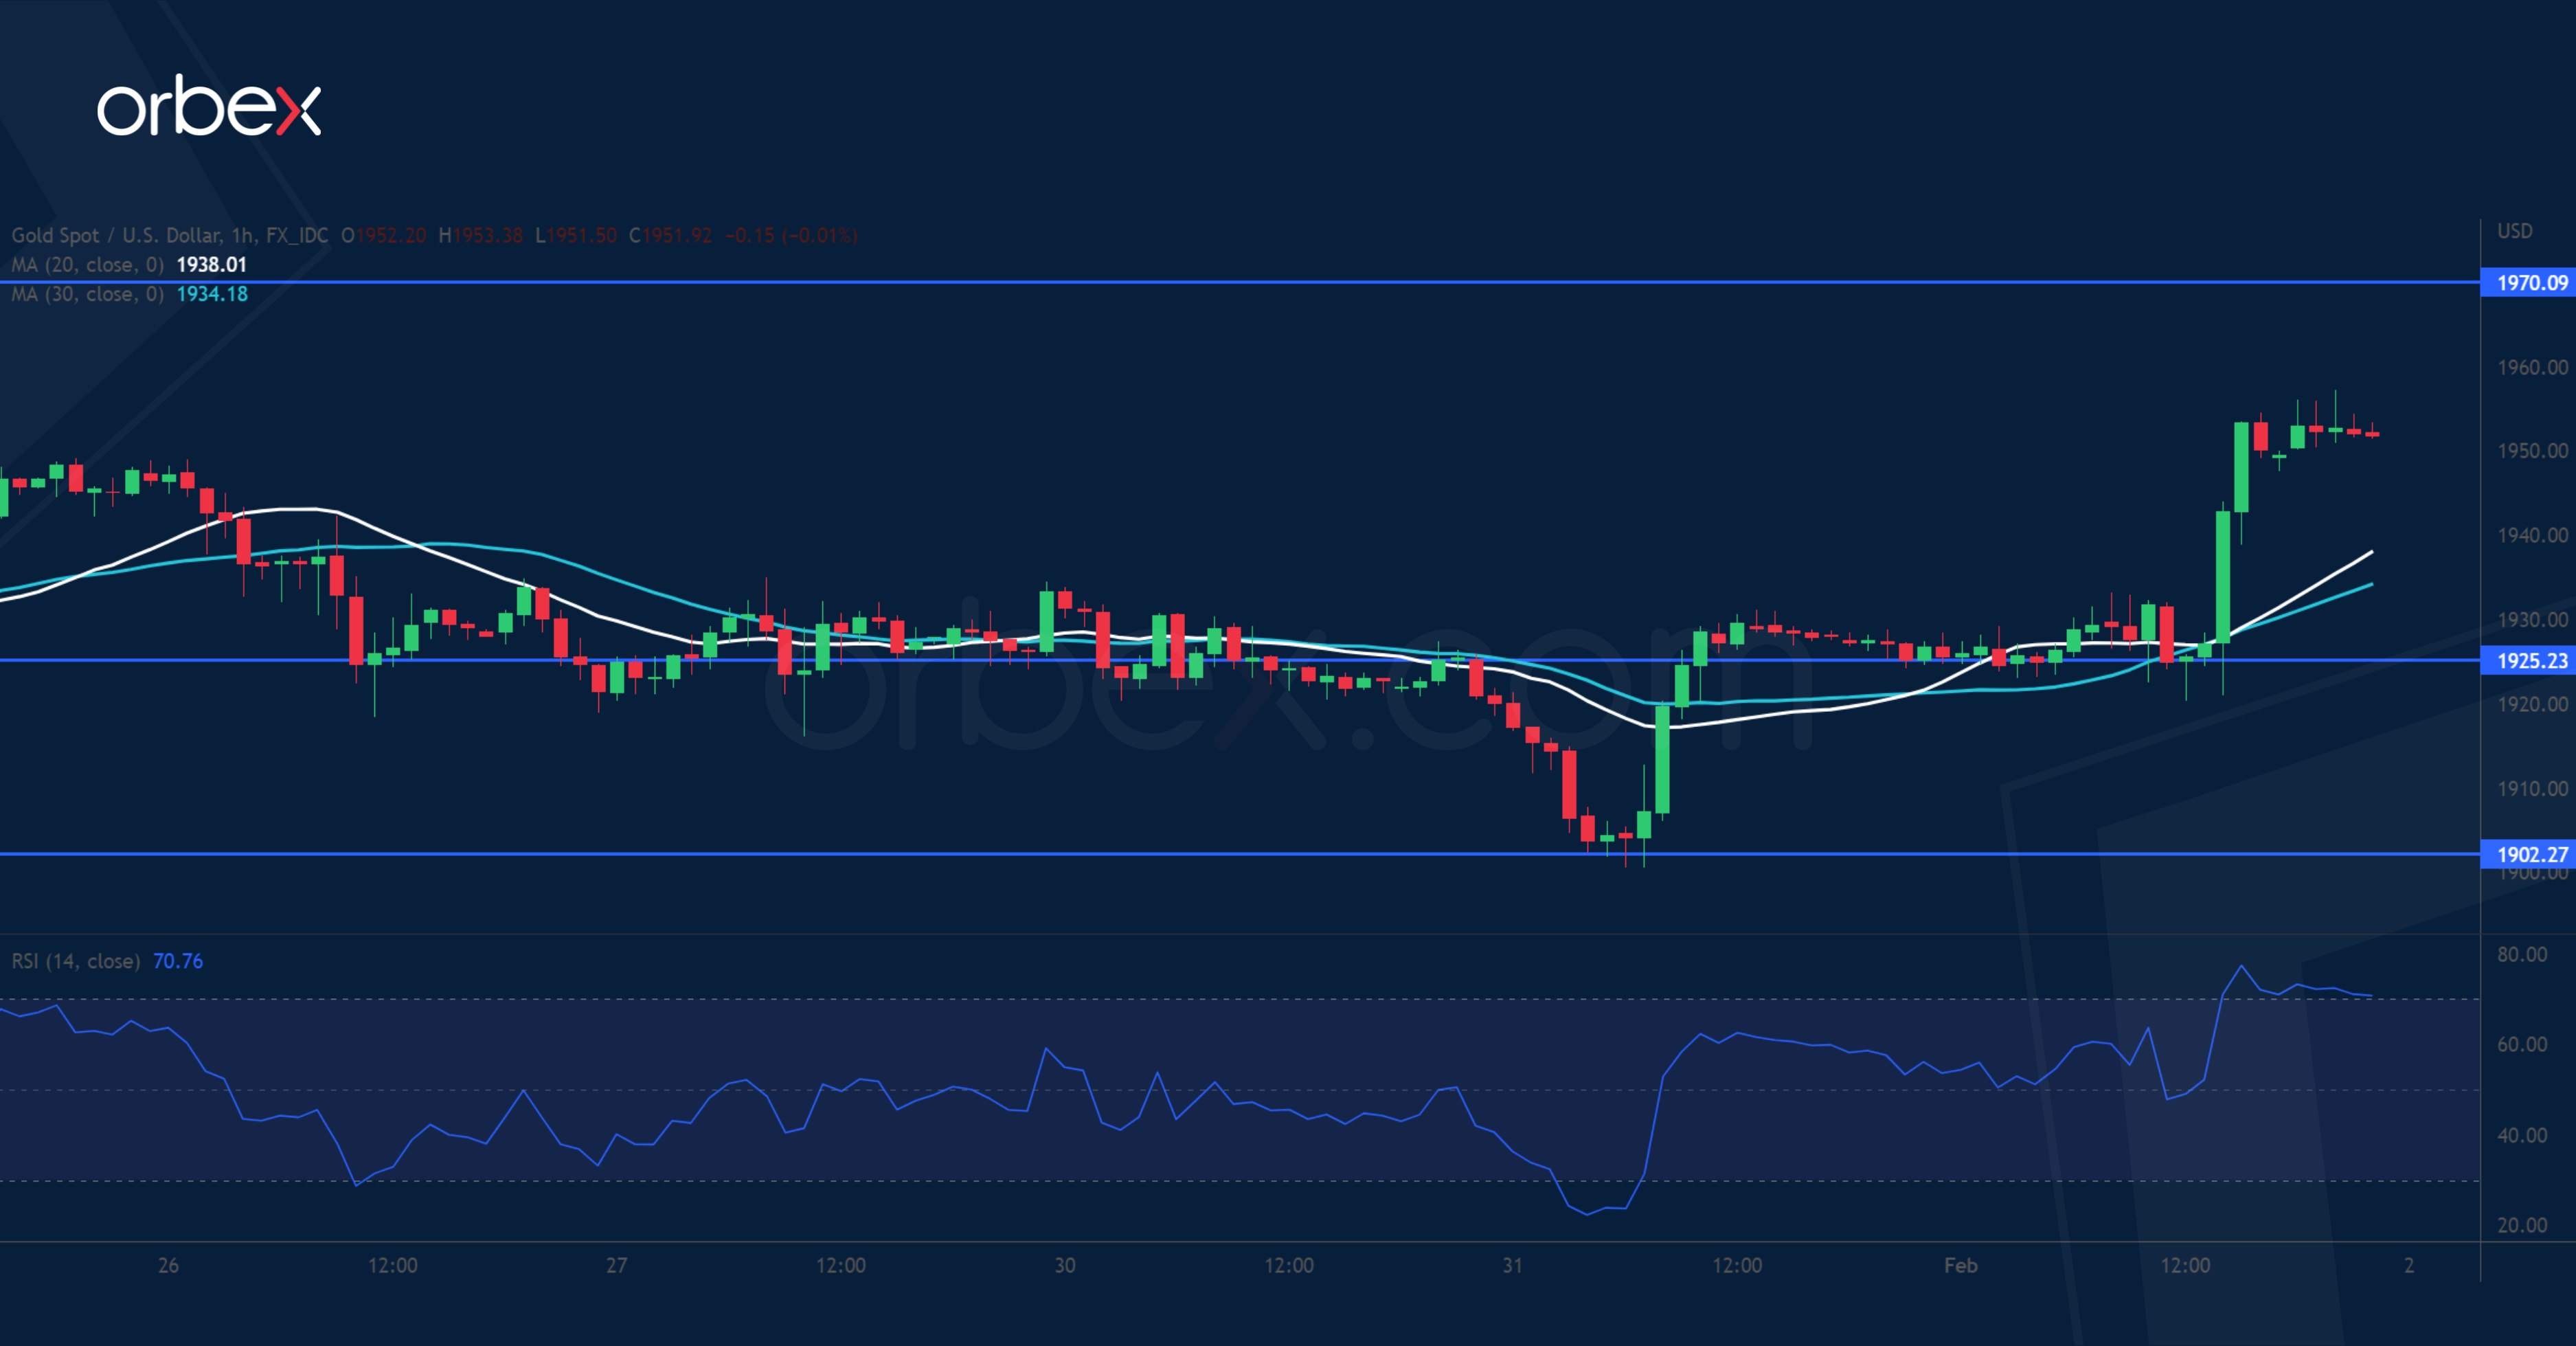
Gold surges as the US dollar tumbles across the board post-FOMC. On the daily chart, the precious metal is still grinding the demand-turned-supply zone 1950-1995. After a drop below 1915, a tentative breakout has been contained at 1902 along the 20-day SMA. A subsequent rally above 1935 and 1949 indicates that the bulls are still in control. The bullish continuation would pave the way for a climb to April’s peak of 1995, with 1970 as an intermediate resistance. An overbought RSI may cause a temporary pullback towards 1925.