

Sample Category Title
Yields Decline Despite Central Bank Tightening
Market movers today
Rounding off an eventful week, the main event today will be the US January jobs report. Consensus is looking for a moderation in the non-farm payrolls growth, yet the recent data releases have been mixed. The ADP private sector employment growth was weaker than expected, but the JOLTs data and the Conference Board's consumer survey surprisingly pointed towards improving labour market conditions.
The ISM Services Index is also due for release from the US, consensus is looking for a modest uptick in line with the PMI and following the sharp weakening in December.
The December euro area Producer Price Index will also be released today, consensus is looking for another modest decline in m/m terms.
The 60 second overview
It was again a dramatic day in the financial markets with a significant decline in interest rates and bond yields despite the tightening of monetary policy from both ECB and BoE. The markets took the ECB's communication as a sign that the ECB is close to ending its hiking cycle, as bond yields rallied strongly. This is too some extent similar to what happened after the FOMC market on Wednesday. We judge that yesterday's communication reflects a very split governing council. We still expect the ECB to hike its policy rates by 50bp in March and 25bp in May.
Hence, the markets are much more focused on the continued decline in headline inflation (rather than core-inflation) and that central banks are getting closer to the peak even though central banks have stressed the need to do more in terms of tightening. However, the potential rate hikes are no longer coming as a surprise as we are getting close to the end of the hiking cycle.
The focus now shifts to the US labour market report, which is expected to show a slowdown as the consensus forecast for the non-farm payrolls for January is 189,000, down from 223,000 in December. The unemployment rate is seen rising to 3.6% from 3.5%.
The impact from the central bank meetings on equities and FX markets was much less dramatic with a modest rise in equity markets as well as small changes in EUR/USD and USD/JPY.
FI: The European fixed income markets rallied on the back of both the BoE and ECB meetings despite the tightening of monetary policy. However, the big surprise was the comment from ECB's Lagarde that they intend to hike by 50bp in March rather than communicating clearly that 50bp in March was a necessary condition to get inflation down.
FX: As repricing of central banks is back in the drivers' seat for G10 FX crosses it was coherent to see USD trading weaker after the Fed and then EUR moving lower vs peers like USD, SEK, GBP and JPY after the ECB, even as risk appetite soared. EUR/USD dropped one figure and ended the day at 1.09. EUR/SEK briefly back below 11.30 after ECB. GBP erased some of its losses during the evening and EUR/GBP is close to where it was before BOE.
Credit: Credit markets rallied yesterday on the back of the guidance provided at the ECB meeting, which was perceived as dovish. As a result, iTraxx Main was tighter by 6bp to 73bp while Xover tightened 27bp to 381bp. Separate from this, the QT modalities released later in the day suggest that ECB will be stepping up its efforts to 'green' its corporate bond holdings through a stronger tilt of reinvestments towards issuers with better climate performance. This is due to take place from 1 March 2023. Also, ECB primary market purchases are to be phased out from this date for the private sector programmes, with the exception of corporate bonds placed by issuers with better climate performance and corporate green bonds. As all eyes were on the ECB meeting, no new issuance took place in euros.
Apple, Amazon, Google Dampen Nood, US NFP and Wages in Focus
Yesterday was, again, a fantastic day of trading for equities, as the less hawkish than expected tone from the European Central Bank (ECB) and the Bank of England (BoE) meetings joined the optimistic vibes from the Federal Reserve (Fed) Chair Jerome Powell’s ‘disinflationary process’ mention a day before, and all that combined with Facebook’s best rally in almost a decade painted the market in the green.
The S&P500 gained around 1.50%. Nasdaq 100 jumped more than 3.5% and entered bull market as Meta jumped more than 23%.
But today will probably not be as fantastic as yesterday, as Apple, Amazon and Google announced earnings after the bell yesterday, and they all disappointed.
So it’s not surprising that the US futures are in the red this morning, and Nasdaq futures are leading losses.
Nasdaq, which freshly stepped into the bull market yesterday, may not stay there long, at least in the very short run.
The tech stocks, at least the largest ones, have had a mixed quarter. In summary, Tesla, Netflix and Facebook did well, while Microsoft, Apple, Amazon and Google disappointed.
Is this balance enough to keep Nasdaq in a positive trend? It might not be. And the Fed expectations alone, especially given that they are not necessarily based on the full picture, but only on the half of the picture may not suffice to keep this rally going. Because it looks like investors are looking at the three little pigs happily playing in their little houses, and no one sees the wolf, that’s hidden behind the tree.
Could the US jobs data cheer up investors?
Today, the again-important US jobs data will either further fuel the Fed doves, or bring investors back on earth.
The Fed still thinks that the US jobs market, especially the wages growth remains too robust to declare victory on inflation.
So, besides the NFP data and the unemployment rate – which will in all cases remain at multi–decade lows, the wages growth will likely be decisive for defining the market mood.
A sufficiently soft jobs report could temper the earnings-triggered weakness.
Two dovish 50bp hikes from ECB and BoE
We knew that the BoE wouldn’t sound aggressively hawkish, when it announced a 50bp hike yesterday. A rate hike was necessary to fight Britain’s double-digit inflation, but obviously, the weak economic fundamentals, the horrifying political and social picture and the tumbling housing markets due to soaring mortgage rates could convince even the most hawkish of the BoE hawks to soften her tone, and vote for a 50bp, instead of a 75bp hike.
Plus, the BoE abandoned the word ‘forcefully’ from its forward guidance, hence investors now bet that the BoE’s tightening cycle will end soon.
So, shorting the pound was a no brainer yesterday. Cable sank into the bearish consolidation zone after pulling out the major 38.2% Fibonacci support on the year-to-date rally. The pair could further extend losses to 1.2150, and to 1.2080 – which are the next important Fibonacci levels, but the selloff may not be dramatic, simply because the US dollar is under the pressure of the dovish Fed expectations… hap-py-ly!
In mainland Europe, the rate decision was a bit more surprising to me. The ECB also raised the rates by 50bp, as broadly expected, BUT Christine Lagarde sounded much more contained than she did back in December.
Back in December, she was throwing away that the ECB will hike by 50bp, then another 50bp, then another 50bp, then another… until inflation is down. But yesterday, Lagarde said that the ECB ‘intends’ to raise by another 50bp next meeting, and that they will see.
What happened to the other 50bp hikes?
Well, it apparently happened that Christine’s colleagues didn’t like her language much, and it felt like she had been warned to not give that kind of guidance.
Whatever it was, the colleagues’ pressure, or easing inflation, or even the softening Fed tone, Lagarde sounded much less aggressive yesterday.
The EURUSD fell after having traded above the 1.10 mark as Powell dared pronouncing the word ‘disinflation’ just a couple of hours before that.
After recording more than a 15% rally since September, the euro could take a pause and consolidate gains.
But I believe that the euro’s recovery hasn’t ended just yet, as we see the end of the tunnel for the Fed – as the Fed rates approach the 5% mark, while we don’t yet see the end of the tightening tunnel for the ECB.
USD/JPY Daily Outlook
Daily Pivots: (S1) 128.14; (P) 128.64; (R1) 129.18; More…
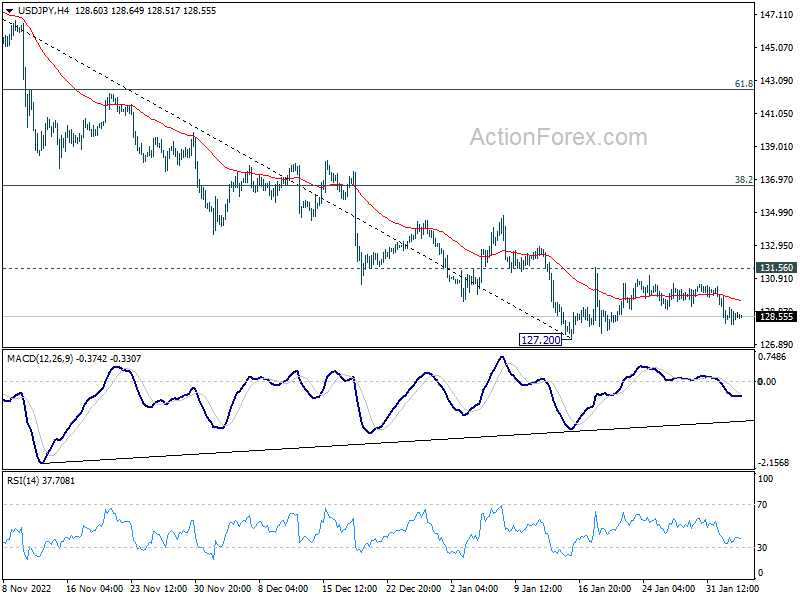
While USD/JPY weakens this week, downside is still contained above 127.20 support. Intraday bias remains neutral first. On the downside, break of 127.20 will resume the whole decline from 151.93 and target 121.43 fibonacci level. Nevertheless, on the upside, break of 131.56 resistance should confirm short term bottoming, and turn bias back to the upside for stronger rebound to 55 day EMA (now at 133.23) and possibly above.
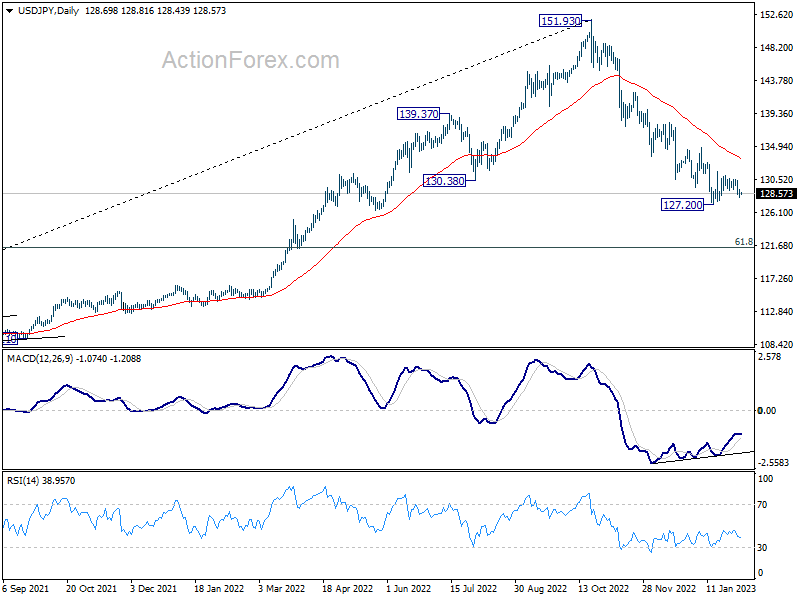
In the bigger picture, the break of 55 week EMA (now at 131.39) raises the chance of medium term bearish reversal, but that’s not confirmed yet. Strong support could be seen around 61.8% retracement of 102.58 to 151.93 at 121.43 and 38.2% retracement of 75.56 to 151.93 at 122.75 to bring rebound. But break of 131.56 resistance is needed to indicate bottoming first. Otherwise further fall will remain in favor.
Yen in Pole Position as US NFP Awaited
Yen is stealing the show in the week of heavy weight events, powering up broadly with help of broad based decline in US and European treasury yields. Swiss Franc is following together with Euro while Dollar is just mixed. On the other hand, Sterling is the worst perform despite BoE rate hike, followed by Aussie and Kiwi. It might look like a risk-off setting, but no, it's not, considering the strong rally in NASDAQ. Focuses will now turn to US non-farm payroll employment report and more wild rides could lie ahead.
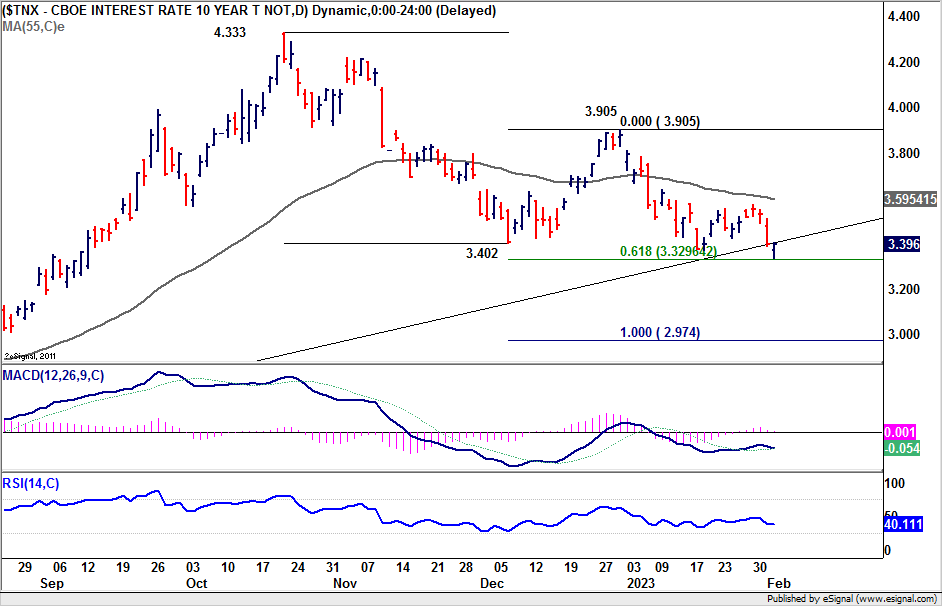
Technically, 10-year yield staged an impressive rebound overnight, closing nearly flat at 3.396 after diving to 3.334. 61.8% projection of 4.333 to 3.402 from 3.905 at 3.329 was nearly met already, and there is prospect of a turn around. Extended rebound from current level, followed by break of 55 day EMA (now at 3.595) later in the month, would confirm completion of the correction from 4.333. However, another dive through 3.329 could prompt downside acceleration to 100% projection at 2.974, which is slightly below 3% handle. We'd probably know which way it takes today, and that would also guide the direction of USD/JPY.
In Asia, Nikkei closed up 0.39%. Hong Kong HSI is down -1.40%. China Shanghai SSE is down -0.67%. Singapore Strait Times is up 0.52%. Japan 10-year JGB yield is down -0.0141 at 0.486. Overnight, DOW dropped -0.11%. S&P 500 rose 1.47%. NASDAQ rose 3.25%. 10-year yield dropped -0.001 to 3.396, after dipping to 3.334.
BoJ Kuroda expects wages to rise quite significantly
BoJ Governor Haruhiko Kuroda told the parliament he expected wages to rise "quite significantly", thanks to improvement in the economy and a tightening job market.
Nevertheless, he reiterated that “BoJ must maintain the ultra-easy policy to support the economy and create an environment for firms to hike wages.”
China PMI composite rose to 51.1, services a boom and manufacturing a drag
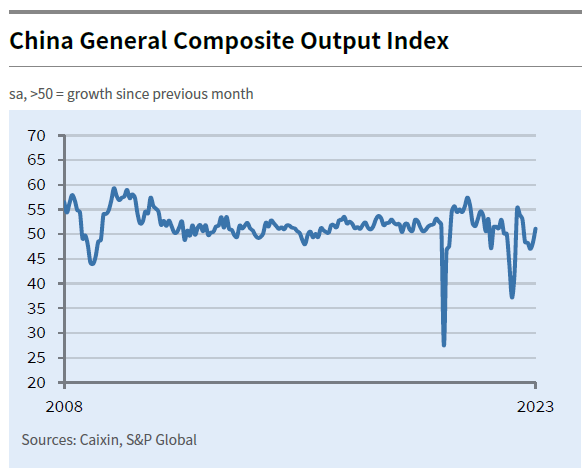
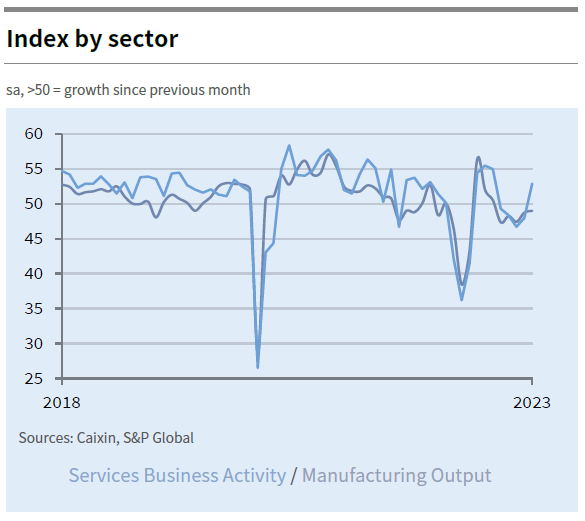
China Caixin PMI Services rose from 48.0 to 52.9 in January, first expansionary reading in five months. PMI Composite rose from 48.3 to 51.1, the first upturn in total business activity since August 2022.
Wang Zhe, Senior Economist at Caixin Insight Group said: “Services activity experienced a boom, as both supply and demand expanded, whereas the manufacturing sector became a drag. Employment remained relatively sluggish, with the manufacturing sector logging a larger contraction. Prices stayed stable. Optimism among businesses improved significantly."
NASDAQ enjoying best year start in decades as focus turns to NFP
Overall risk sentiment is on the positive side as market focus turn to non-farm payroll report today. The messages from Fed and BoE this week were clear that the tightening cycle is close to a peak. It's just a matter of 4.75-5.00% or 5.00-5.25% for Fed, and 4.25% or 4.50% for BoE. While ECB is still staying the course and at least two more hikes are on the card according to unnamed source, rate will peak below 4% handle.
Markets are expecting 193k NFP job growth in January, with unemployment rate ticked up from 3.5% to 3.6%. Average hourly earnings are expected to grow 0.3% mom. For investors, the ideal scenario is solid job growth, with gradual uptick in unemployment rate and modest wages growth. That scenario would keep Fed on track to pause in Q2.
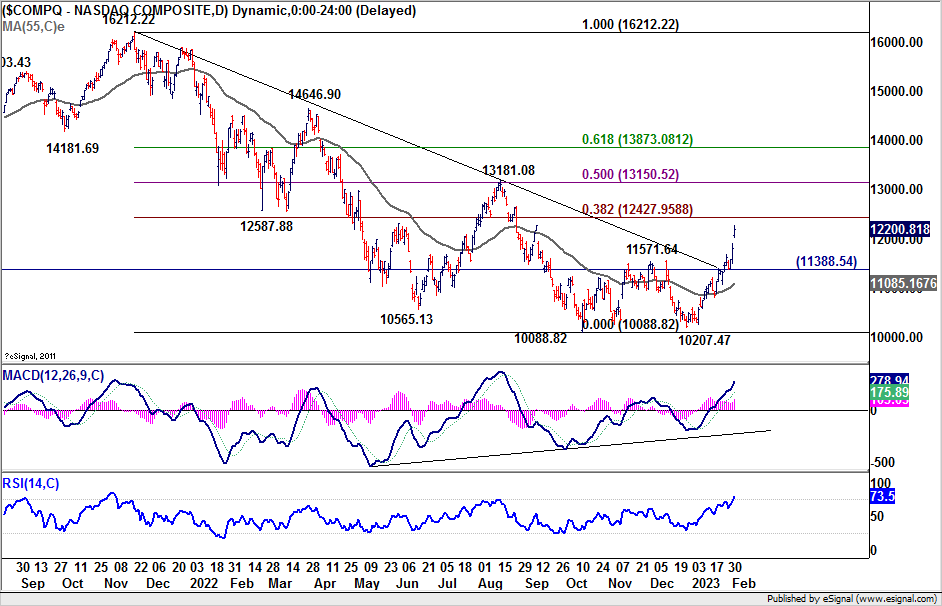
NASDAQ rally has been rather impressive, up 16% year-to-day, logging the best performance since 1975. Based on current momentum, 38.2% retracement of 16212.22 to 10088.82 at 12427.95 should be taken out with ease for the near term. The real test is on 13181.05 cluster resistance (50% retracement at 13150.52). Sustained break there will build up the case of bullish trend reversal. But in any case, further rally will be expected as long as 11388.54 support holds. Meanwhile, solid risk-on sentiment could continue to limit Dollar's rebound.
Elsewhere
China France industrial production, Eurozone PPI and PMI services, as well as UK PMI services will be released in European session. From the US, IFM services will also be featured next to NFP.
USD/JPY Daily Outlook
Daily Pivots: (S1) 128.14; (P) 128.64; (R1) 129.18; More…
While USD/JPY weakens this week, downside is still contained above 127.20 support. Intraday bias remains neutral first. On the downside, break of 127.20 will resume the whole decline from 151.93 and target 121.43 fibonacci level. Nevertheless, on the upside, break of 131.56 resistance should confirm short term bottoming, and turn bias back to the upside for stronger rebound to 55 day EMA (now at 133.23) and possibly above.
In the bigger picture, the break of 55 week EMA (now at 131.39) raises the chance of medium term bearish reversal, but that’s not confirmed yet. Strong support could be seen around 61.8% retracement of 102.58 to 151.93 at 121.43 and 38.2% retracement of 75.56 to 151.93 at 122.75 to bring rebound. But break of 131.56 resistance is needed to indicate bottoming first. Otherwise further fall will remain in favor.
Economic Indicators Update
| GMT | Ccy | Events | Actual | Forecast | Previous | Revised |
|---|---|---|---|---|---|---|
| 01:45 | CNY | Caixin Services PMI Jan | 52.9 | 51.6 | 48 | |
| 07:45 | EUR | France Industrial Output M/M Dec | 0.20% | 2.00% | ||
| 08:45 | EUR | Italy Services PMI Jan | 50.9 | 49.9 | ||
| 08:50 | EUR | France Services PMI Jan F | 49.2 | 49.2 | ||
| 08:55 | EUR | Germany Services PMI Jan F | 50.4 | 50.4 | ||
| 09:00 | EUR | Eurozone Services PMI Jan F | 50.7 | 50.7 | ||
| 09:30 | GBP | Services PMI Jan F | 48 | 48 | ||
| 10:00 | EUR | Eurozone PPI M/M Dec | -1.70% | -0.90% | ||
| 10:00 | EUR | Eurozone PPI Y/Y Dec | 30.20% | 27.10% | ||
| 13:30 | USD | Nonfarm Payrolls Jan | 193K | 223K | ||
| 13:30 | USD | Unemployment Rate Jan | 3.60% | 3.50% | ||
| 13:30 | USD | Average Hourly Earnings M/M Jan | 0.30% | 0.30% | ||
| 14:45 | USD | Services PMI Jan F | 46.6 | 46.6 | ||
| 15:00 | USD | ISM Services PMI Jan | 50.4 | 49.6 |
NASDAQ enjoying best year start in decades as focus turns to NFP
Overall risk sentiment is on the positive side as market focus turn to non-farm payroll report today. The messages from Fed and BoE this week were clear that the tightening cycle is close to a peak. It's just a matter of 4.75-5.00% or 5.00-5.25% for Fed, and 4.25% or 4.50% for BoE. While ECB is still staying the course and at least two more hikes are on the card according to unnamed source, rate will peak below 4% handle.
Markets are expecting 193k NFP job growth in January, with unemployment rate ticked up from 3.5% to 3.6%. Average hourly earnings are expected to grow 0.3% mom. For investors, the ideal scenario is solid job growth, with gradual uptick in unemployment rate and modest wages growth. That scenario would keep Fed on track to pause in Q2.
NASDAQ rally has been rather impressive, up 16% year-to-day, logging the best performance since 1975. Based on current momentum, 38.2% retracement of 16212.22 to 10088.82 at 12427.95 should be taken out with ease for the near term. The real test is on 13181.05 cluster resistance (50% retracement at 13150.52). Sustained break there will build up the case of bullish trend reversal. But in any case, further rally will be expected as long as 11388.54 support holds. Meanwhile, solid risk-on sentiment could continue to limit Dollar's rebound.
China PMI composite rose to 51.1, services a boom and manufacturing a drag
China Caixin PMI Services rose from 48.0 to 52.9 in January, first expansionary reading in five months. PMI Composite rose from 48.3 to 51.1, the first upturn in total business activity since August 2022.
Wang Zhe, Senior Economist at Caixin Insight Group said: “Services activity experienced a boom, as both supply and demand expanded, whereas the manufacturing sector became a drag. Employment remained relatively sluggish, with the manufacturing sector logging a larger contraction. Prices stayed stable. Optimism among businesses improved significantly."
BoJ Kuroda expects wages to rise quite significantly
BoJ Governor Haruhiko Kuroda told the parliament he expected wages to rise "quite significantly", thanks to improvement in the economy and a tightening job market.
Nevertheless, he reiterated that “BoJ must maintain the ultra-easy policy to support the economy and create an environment for firms to hike wages.”
Cliff Notes: As Global Inflation Risks Recede, Market Expectations Build
Key insights from the week that was.
This week, we received a set of downbeat updates on the consumer and housing in Australia. Meanwhile, a slew of rate hikes and updated policy guidance from across the US, Europe and the UK gave markets plenty to think about.
Beginning in Australia, the week began with a downside surprise for the consumer, December’s retail sales posting a sizeable 3.9% decline against the consensus estimate for a 0.2% fall. The decline was generally broad-based albeit with some seasonal volatility likely at play, with non-food retail, department stores and clothing all posting very weak reads. Having said that, December’s result more than reversed the upwardly revised gain of 1.7% in November, suggesting that an underlying down-trend in consumption is beginning to materialise in response to the rising interest rate burden. For a comprehensive update on the current state of the Australian consumer, see our January edition of the Red Book.
Developments on the housing front continued to point toward further weakness to come. CoreLogic’s home value index fell another 1.1% in January and, at -8.7%yr, the annual pace of decline has now exceeded that of the 2018-19 correction to be the weakest reading dating back to 1981. The current correction remains broadly-based and firmly entrenched, with all capital cities and major regional areas recording price declines and continued easing in turnover.
A similar theme was also present in December’s dwelling approvals release, with non-high rise approvals (a better gauge for underlying trends given the 90% spike in high rise approvals) posting a 2% decline in the month to be down 14.8% from its August peak. Given the extensive set of headwinds facing the construction sector and the broader housing market, further significant declines are expected in the period ahead, which will also feed through to demand for housing credit.
In a video update mid-week, Chief Economist Bill Evans outlined Westpac’s views on the outlook for Australian interest rates and the consequences for activity. In essence, our expectation for a 3.85% peak in the cash rate in May is reflective of robust wage pressures – a forecast 4.5%yr peak by end-2023 – and a slower retreat in services inflation. However, we do not expect this to result in a ‘classic’ recession as households are relatively well placed to weather these headwinds. Indeed, with a savings buffer of around $250 billion and a historically-tight labour market as supports, we anticipate a stalling in household consumption rather than an outright contraction in response to rising interest costs. If inflation recedes as we expect, there will be room for the RBA to deliver 100bps of rate cuts over 2024, easing the pressure on demand and facilitating a return to around-trend growth by end-2025.
Offshore, market participants were buoyed by the guidance given by key central banks this week. While the US FOMC raised by 25bps and the European Central Bank (ECB) and Bank of England (BoE) followed with 50bp hikes, the market took their data-dependent guidance on the outlook to mean the end of the tightening cycle is near.
After slowing the pace of hikes to 25bps at their January/February meeting, subtle but significant changes in communication highlighted the evolving balance of risks faced by the FOMC, with inflation having “eased somewhat” and the Committee now focused on the cumulative impact of policy versus the pace of meeting-by-meeting hikes. With annual headline inflation having slowed from 9%yr to 6%yr June to December 2022, and we might add the six-month annualised pace now back at the 2%yr target, the FOMC could have been more constructive on the outlook for inflation than they were. The reason they held back was made clear in the press conference, with Chair Powell highlighting that the deceleration to date has been concentrated in goods, with services inflation yet to ease.
Still, with market estimates of rent growth decelerating rapidly and wage gains slowing quicker than the FOMC anticipated, Chair Powell expressed growing confidence that disinflation will broaden in 2023. From the partial data and the trajectory of short-term momentum in service CPI components, this is our expectation too. Indeed, we remain of the view that the FOMC will on need to hike once more, taking fed funds to a peak of 4.875% at March. They may decide to continue to May; but, in either case, the US tightening cycle will conclude by June.
As expected, this week the ECB were decidedly more hawkish than the FOMC, with a 50bp hike delivered and a strong signal given that another 50bp increase will follow next month. The justification for doing so is that core inflation remains at peak levels in the Euro Area while both economic activity and the labour market continue to outperform, signalling a much-reduced chance of recession in 2023. It also has to be remembered that the ECB is a long way behind the FOMC, the current level of the ECB’s deposit rate being 2.50% versus US fed funds at 4.625%. Despite the ECB’s near-term hawkish resolve, the market still reacted favourably to the Governing Council’s guidance, taking “future policy rate decisions will continue to be data-dependent and follow a meeting-by-meeting approach” to signal that the ECB’s tightening cycle will also end by mid-year.
In the UK, the BoE’s 50bp hike to a bank rate of 4.00% with two dissenting opinions and a materially-improved outlook for inflation in 2023 (4.0%yr from 5.25%yr previously) has seen the market price an almost immediate end to the tightening cycle, with bank rate now forecast to peak circa 4.25% -- only +25bps from the current level. Arguably, the Committee’s expectation that inflation will be back below their 2.0%yr target in 2025 is providing the market with further confidence.
With each of these key central banks now more mindful of the outlook for activity and, while still risk aware, showing confidence over the outlook for inflation, the market is clearly now focused on the scale and timing of rate cuts. This is highlighted by the spread between 10 year yields and central bank policy rates. For the US, Euro Area and UK, the current market expectation for peak policy rates are approximately 4.875%, 3.25% and 4.25% whereas their 10 year yields are circa 3.40%, 2.10% (German Bund) and 3.00%. For risk assets, also critical is that these materially-lower term interest rates are paired with more favourable outlooks for growth than previously feared. Note that this week Euro Area GDP growth was reported to have remained positive in Q4; while, at February, the scale of the Bank of England’s recession forecast for 2023 and 2024 was materially reduced.
The US is the one jurisdiction in this group which has a deteriorating growth outlook, highlighted last week by the deceleration in domestic demand growth, and this week by weakness in the manufacturing sector (the ISM manufacturing survey pointing to a further decline in activity in January) and construction activity. We remain of the view that the US’ contraction will be shallow; but, given the much-improved outlook for the Euro Area and UK versus 2022’s expectations, this calls for further weakness in the US dollar to the end of 2024.
Another reason to expect continued weakness in the US dollar is that China and other developing markets are showing great promise at the start of 2023. Following December’s turmoil, this week a dramatic rebound in China’s official PMIs to near long-run average levels was reported. This signals that, not only has there been no lasting impact from the end of COVID-zero for manufacturing, but more importantly confidence amongst households has snapped back. In our view, Chinese consumers also have plenty of capacity to spend given accumulated savings and positive real income growth through 2022.
A final note on China. This week also saw authorities change their rules regarding tertiary education. To be recognised, students now need to undertake courses in person not online. As a result, in coming months Chinese students will need to quickly return to the countries in which their tertiary institutions are based, including Australia. As the visa and arrivals data allows, we will assess the implications.
Technical Outlook and Review
USD/JPY:
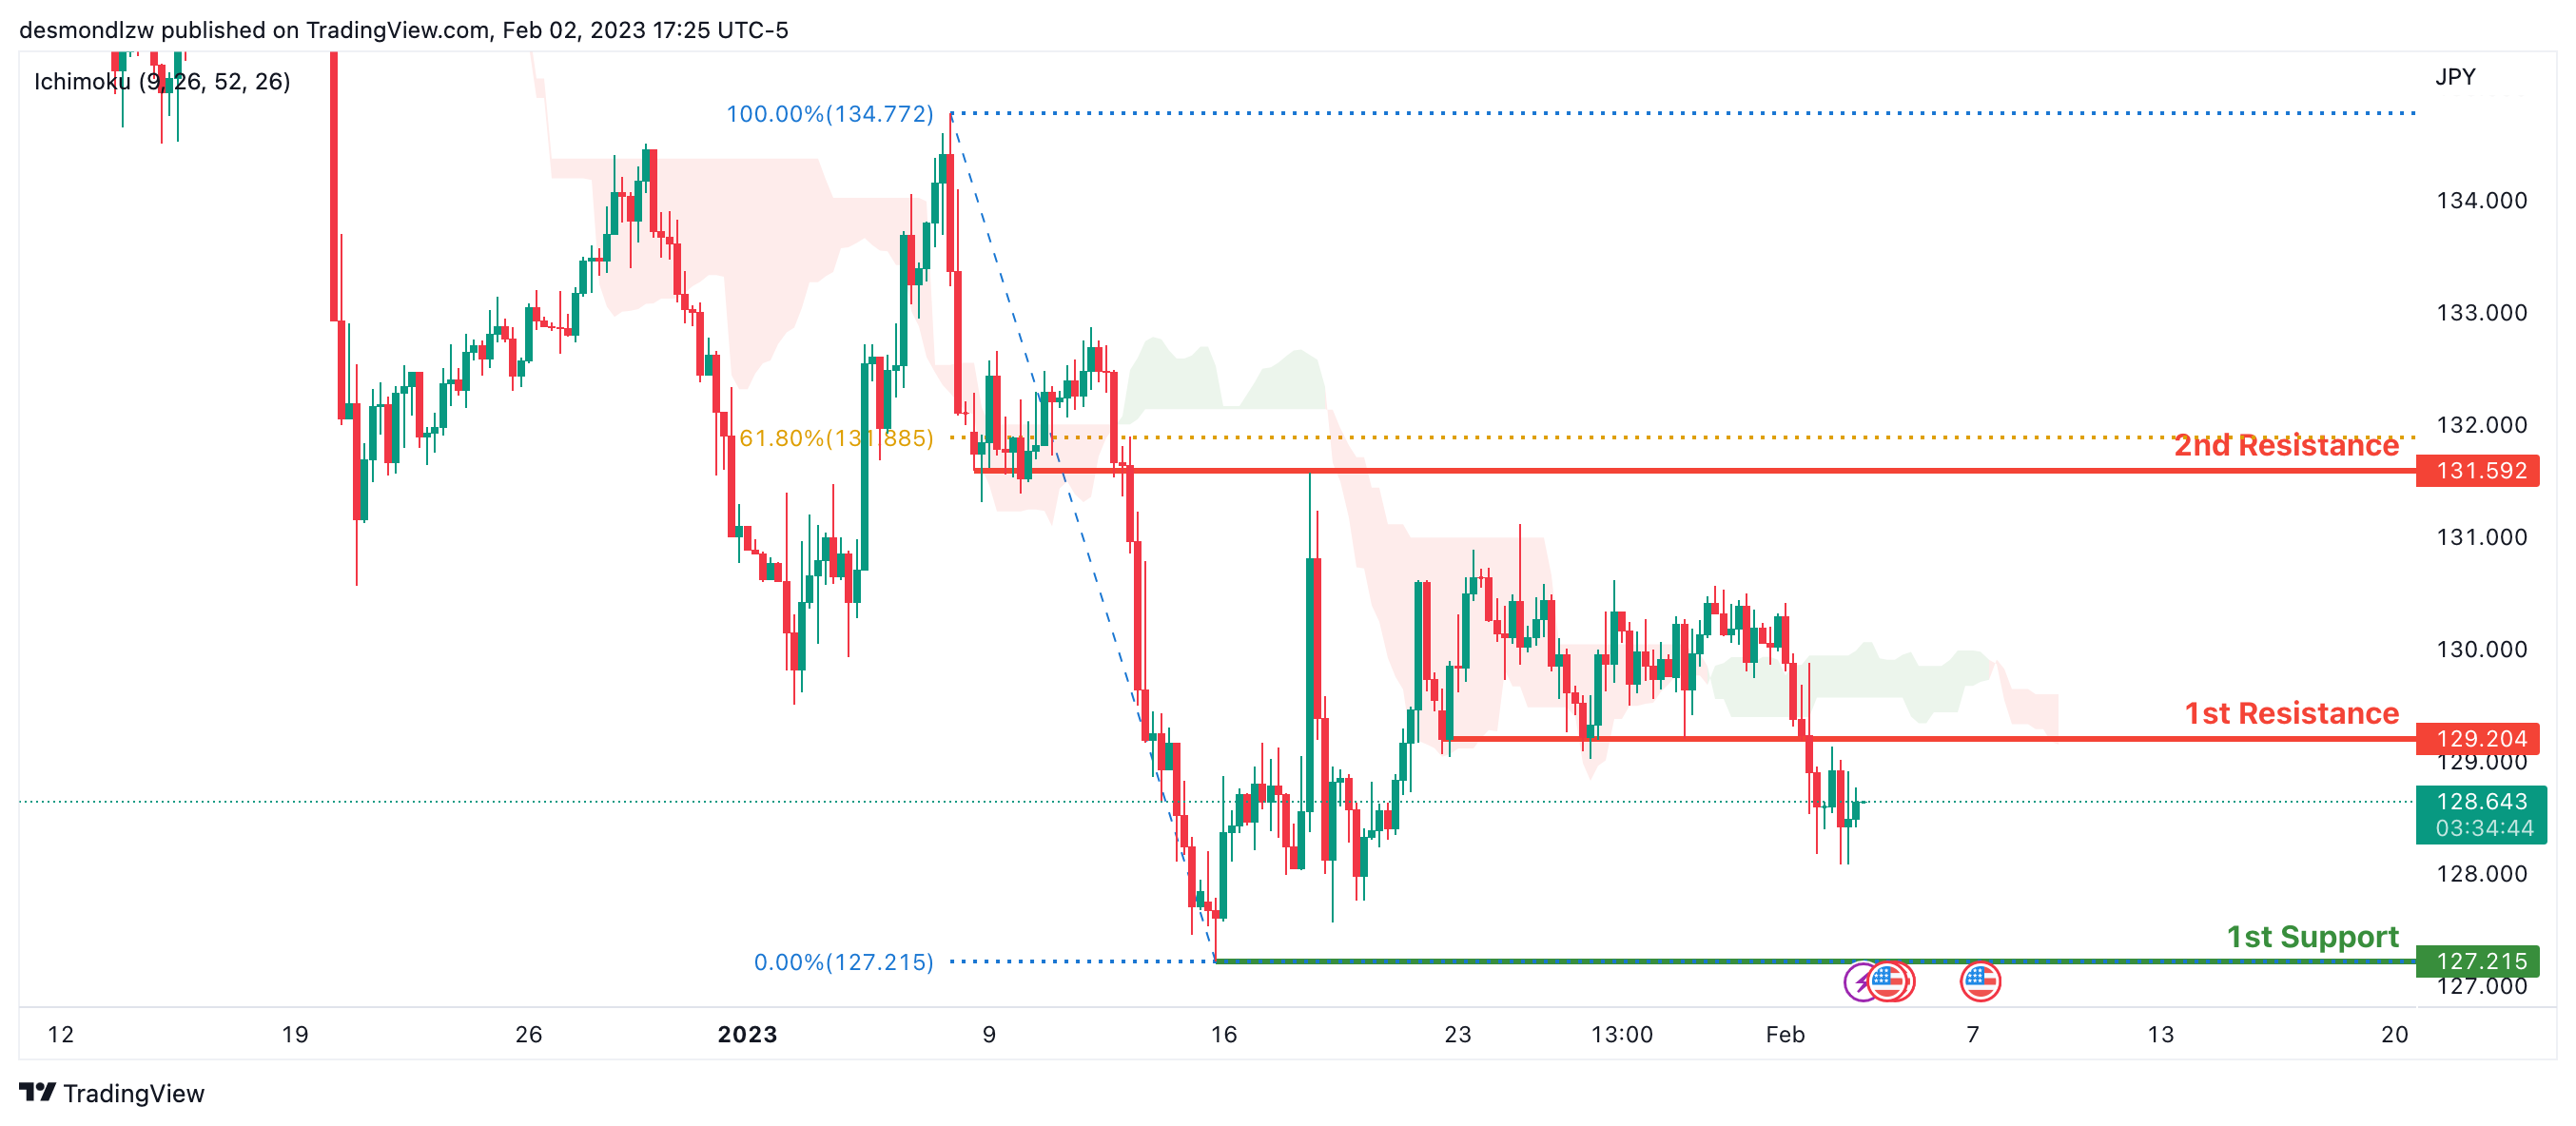
Looking at the H4 chart, my overall bias for USDJPY is bearish due to the current price crossing below the Ichimoku cloud, indicating a bearish market. If this bearish momentum continues, expect the price to possibly continue heading towards the 1st support at 127.215, where the previous swing low is. In an alternate scenario, price could possibly head back down to retest the 1st resistance at 129.204, where the overlap resistance is.
Areas of consideration:
- H4 time frame, 1st resistance at 129.204
- H4 time frame, 1st support at 127.215
DXY:
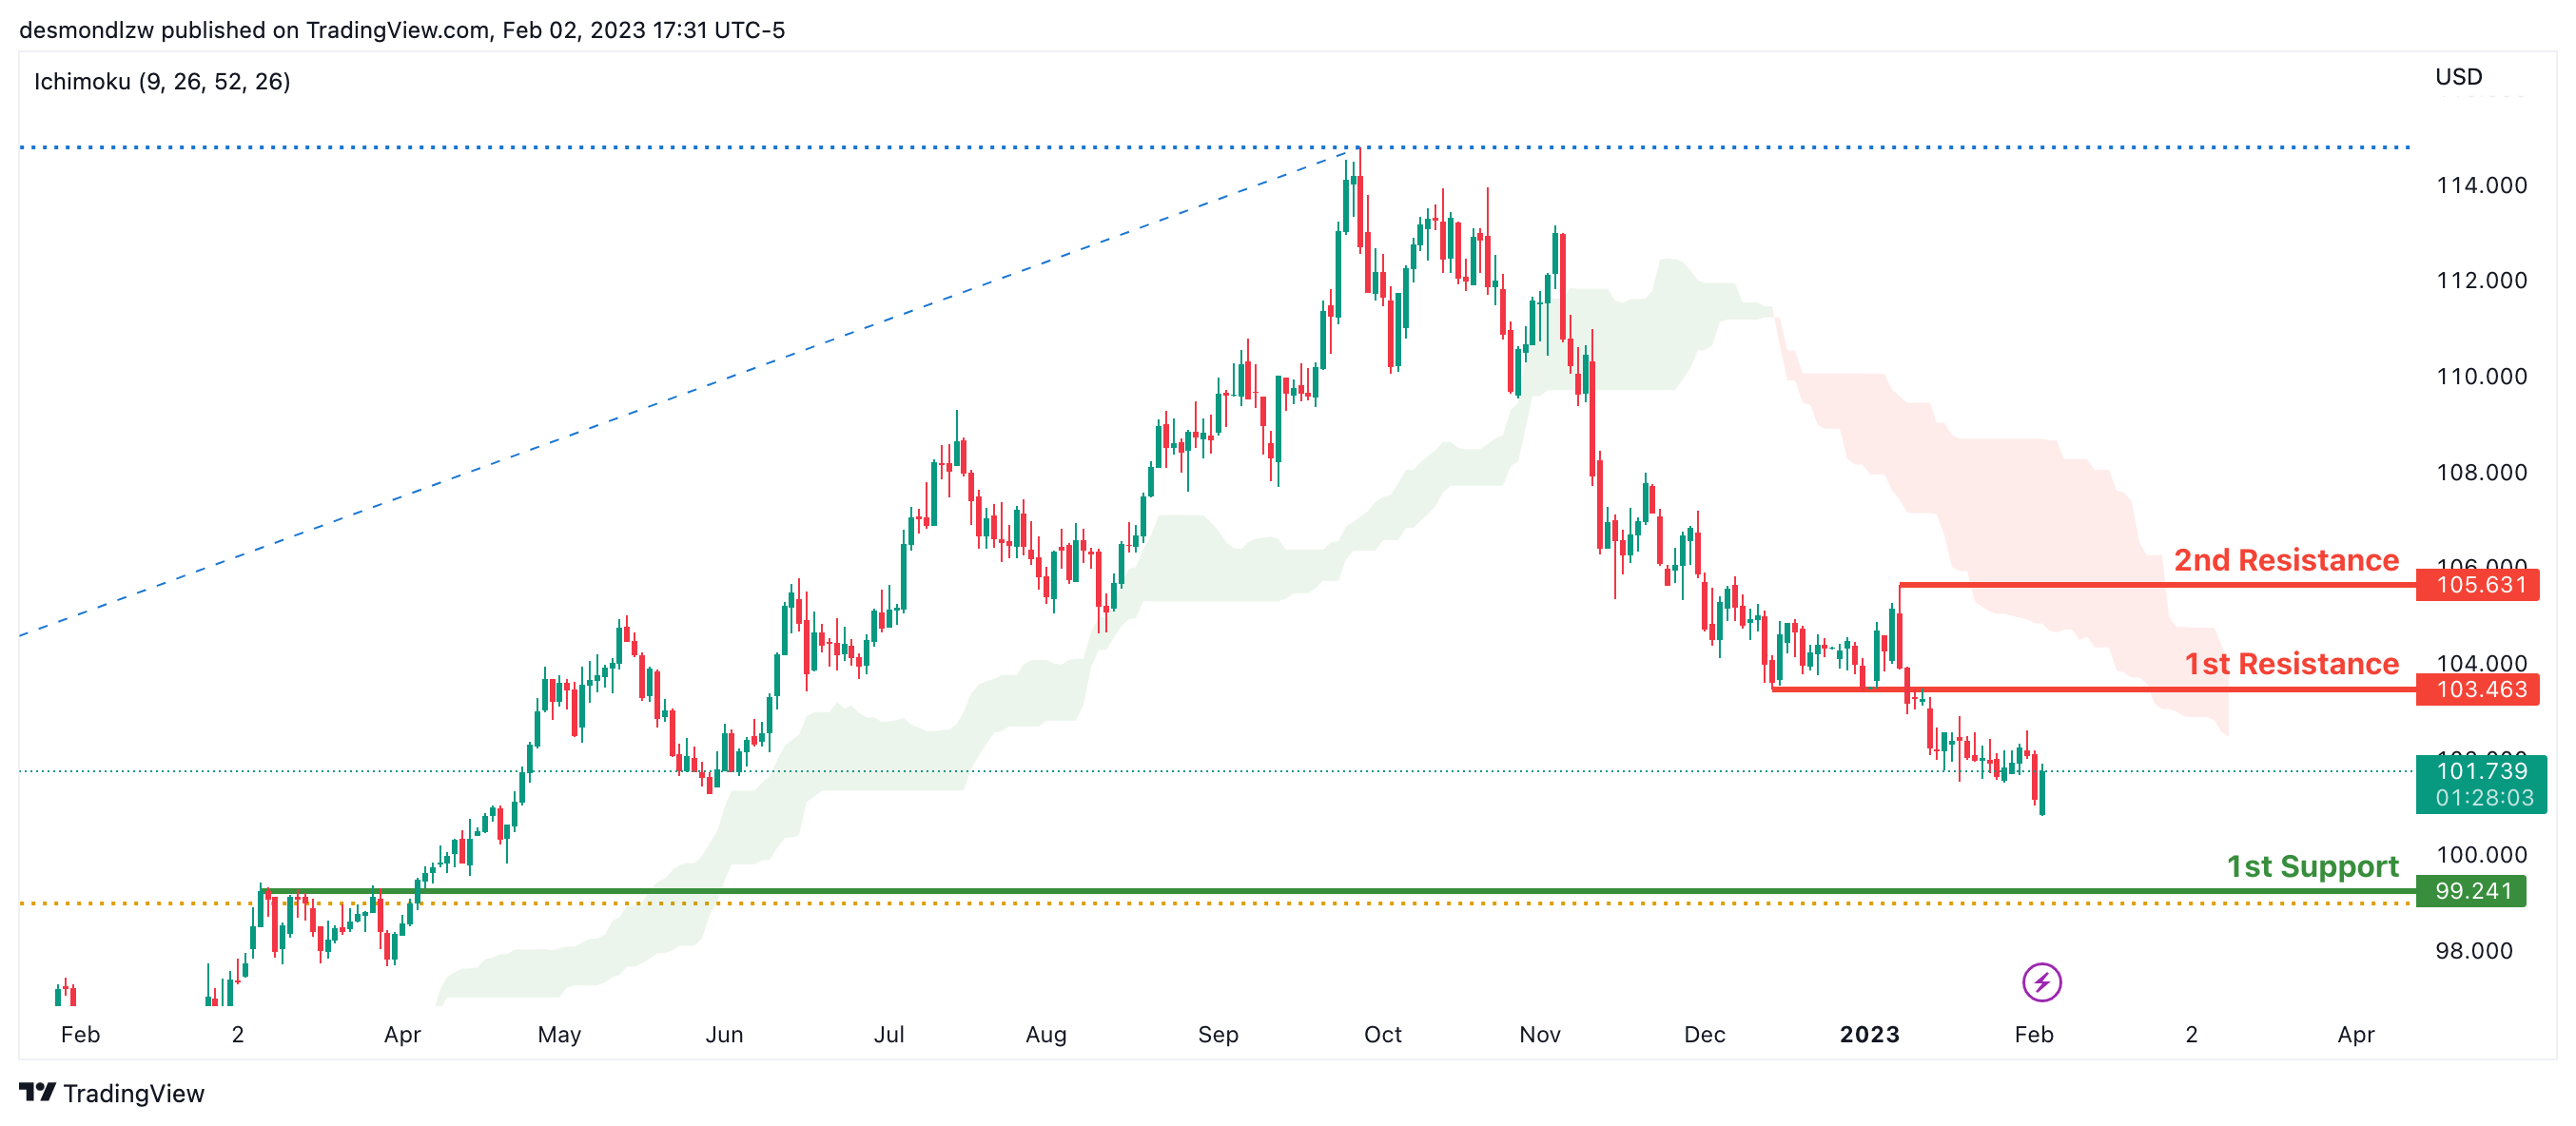
Looking at the Daily chart, my overall bias for DXY is bearish due to the current price crossing below the Ichimoku cloud, indicating a bearish market. If this bearish momentum continues, expect the price to possibly continue heading towards the 1st support at 99.241, where the 61.8% Fibonacci line and overlap support is. In an alternative scenario, price could head back up to retest the 1st resistance at 103.463, where the overlap resistance is.
Areas of consideration:
- H4 time frame, 1st resistance at 103.463
- H4 time frame, 1st support at 99.241
EUR/USD:
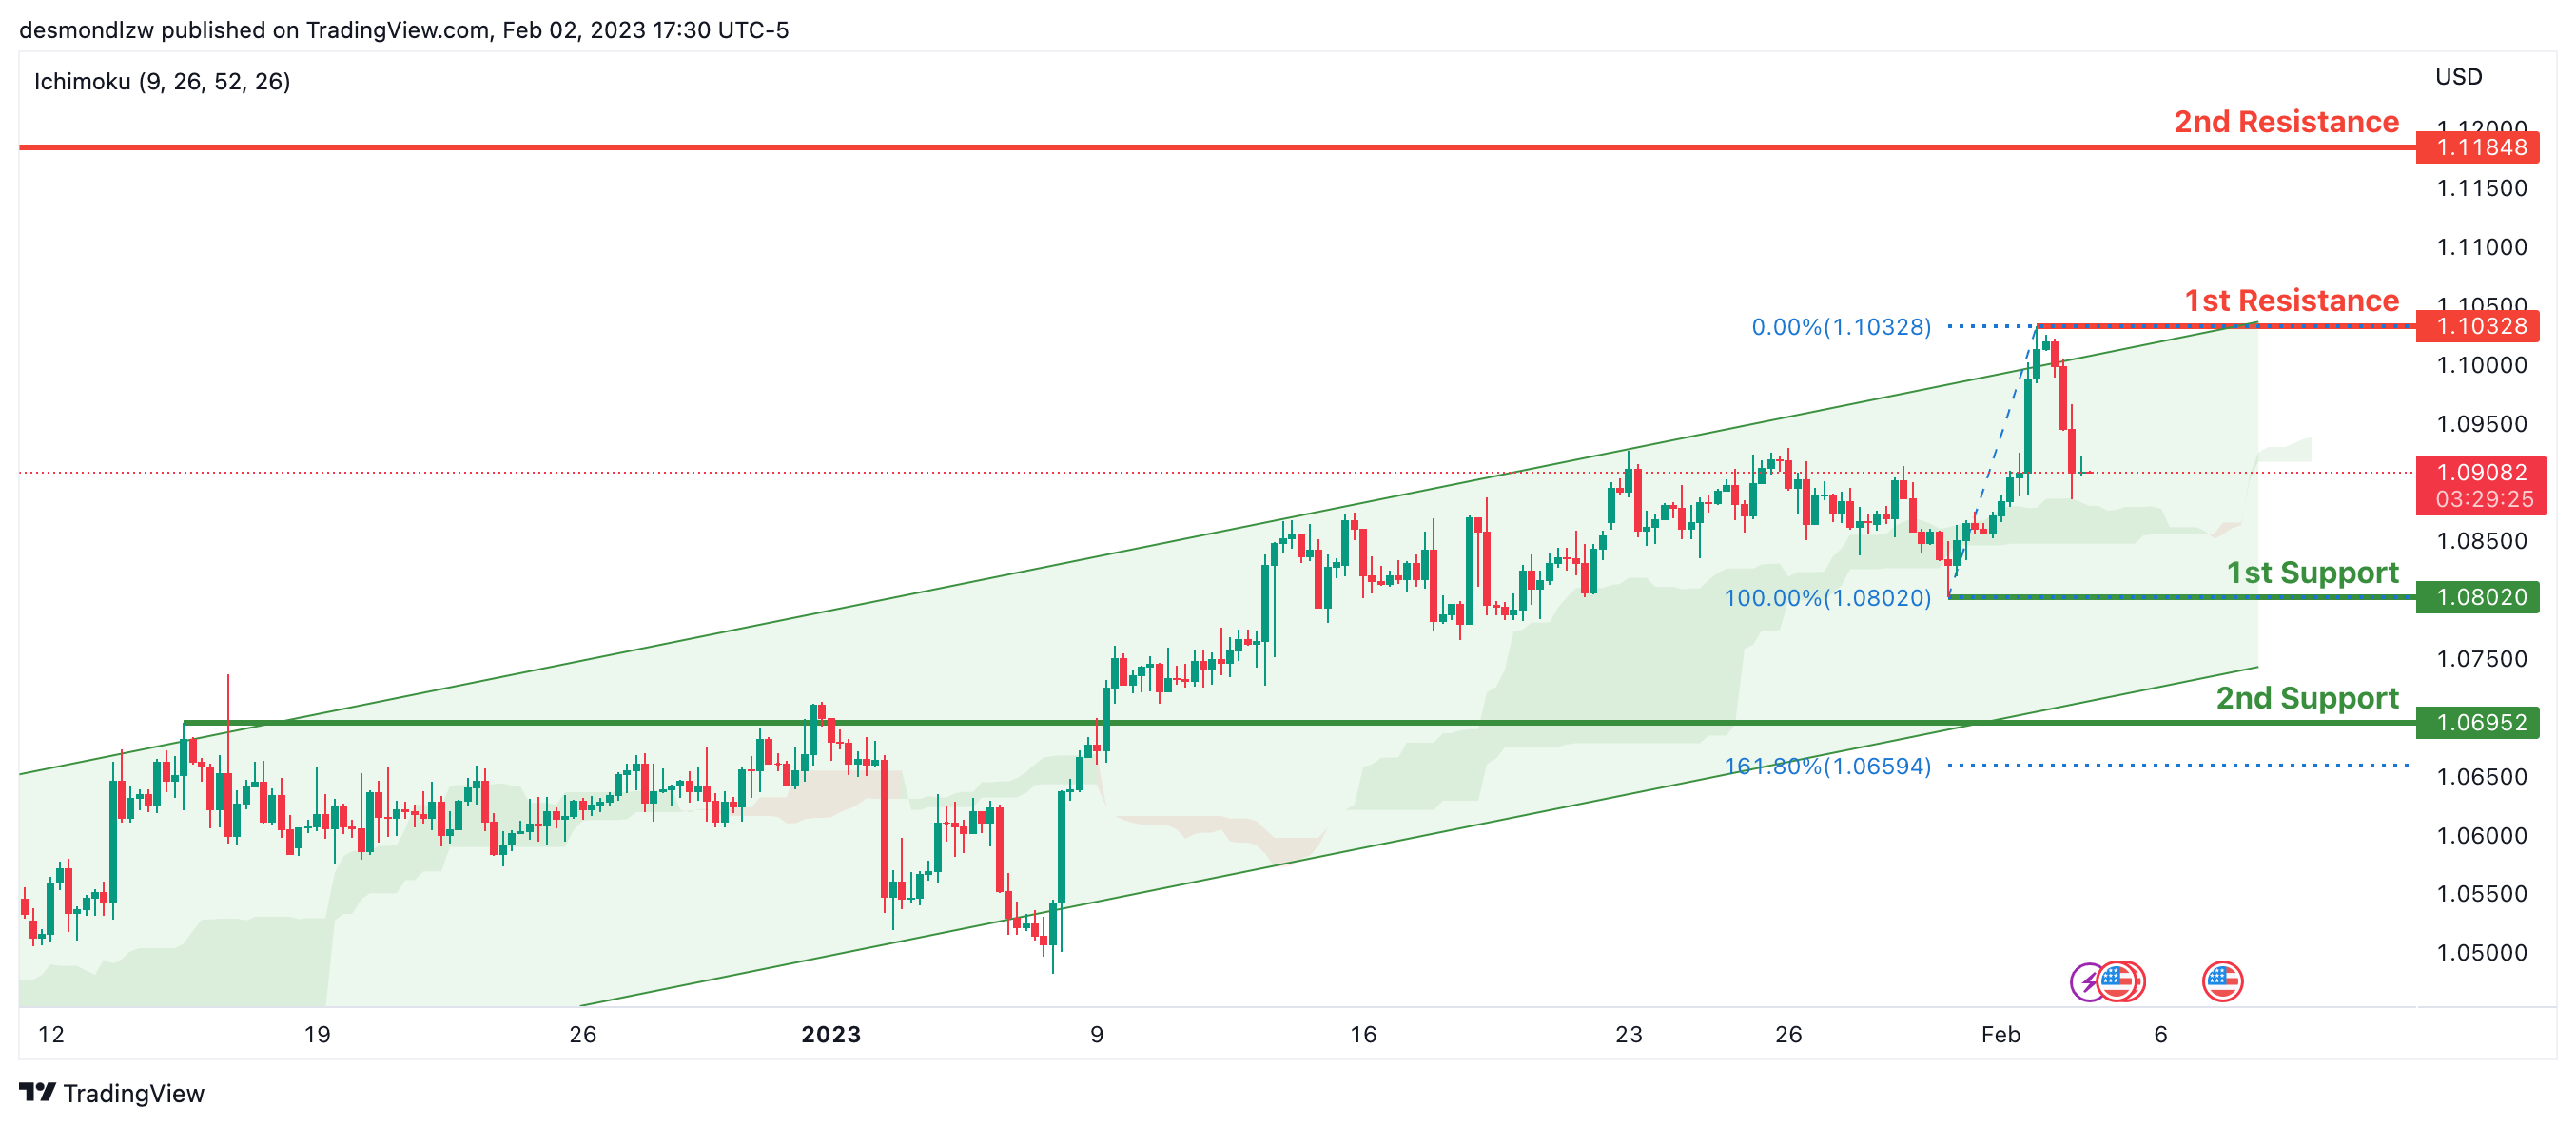
Looking at the H4 chart, my overall bias for EURUSD is bullish due to the current price crossing above the Ichimoku cloud, indicating a bullish market structure. To add confluence to this bias, price is also within an ascending channel. If this bullish momentum continues, expect the price to possibly continue heading towards the 1st resistance at 1.10328, where the recent swing high is. In an alternate scenario, price could possibly head back down to retest the 1st support level at 1.08020, where the recent low is.
Areas of consideration :
- H4 1st resistance at 1.10328
- H4 1st support at 1.08020
GBP/USD:
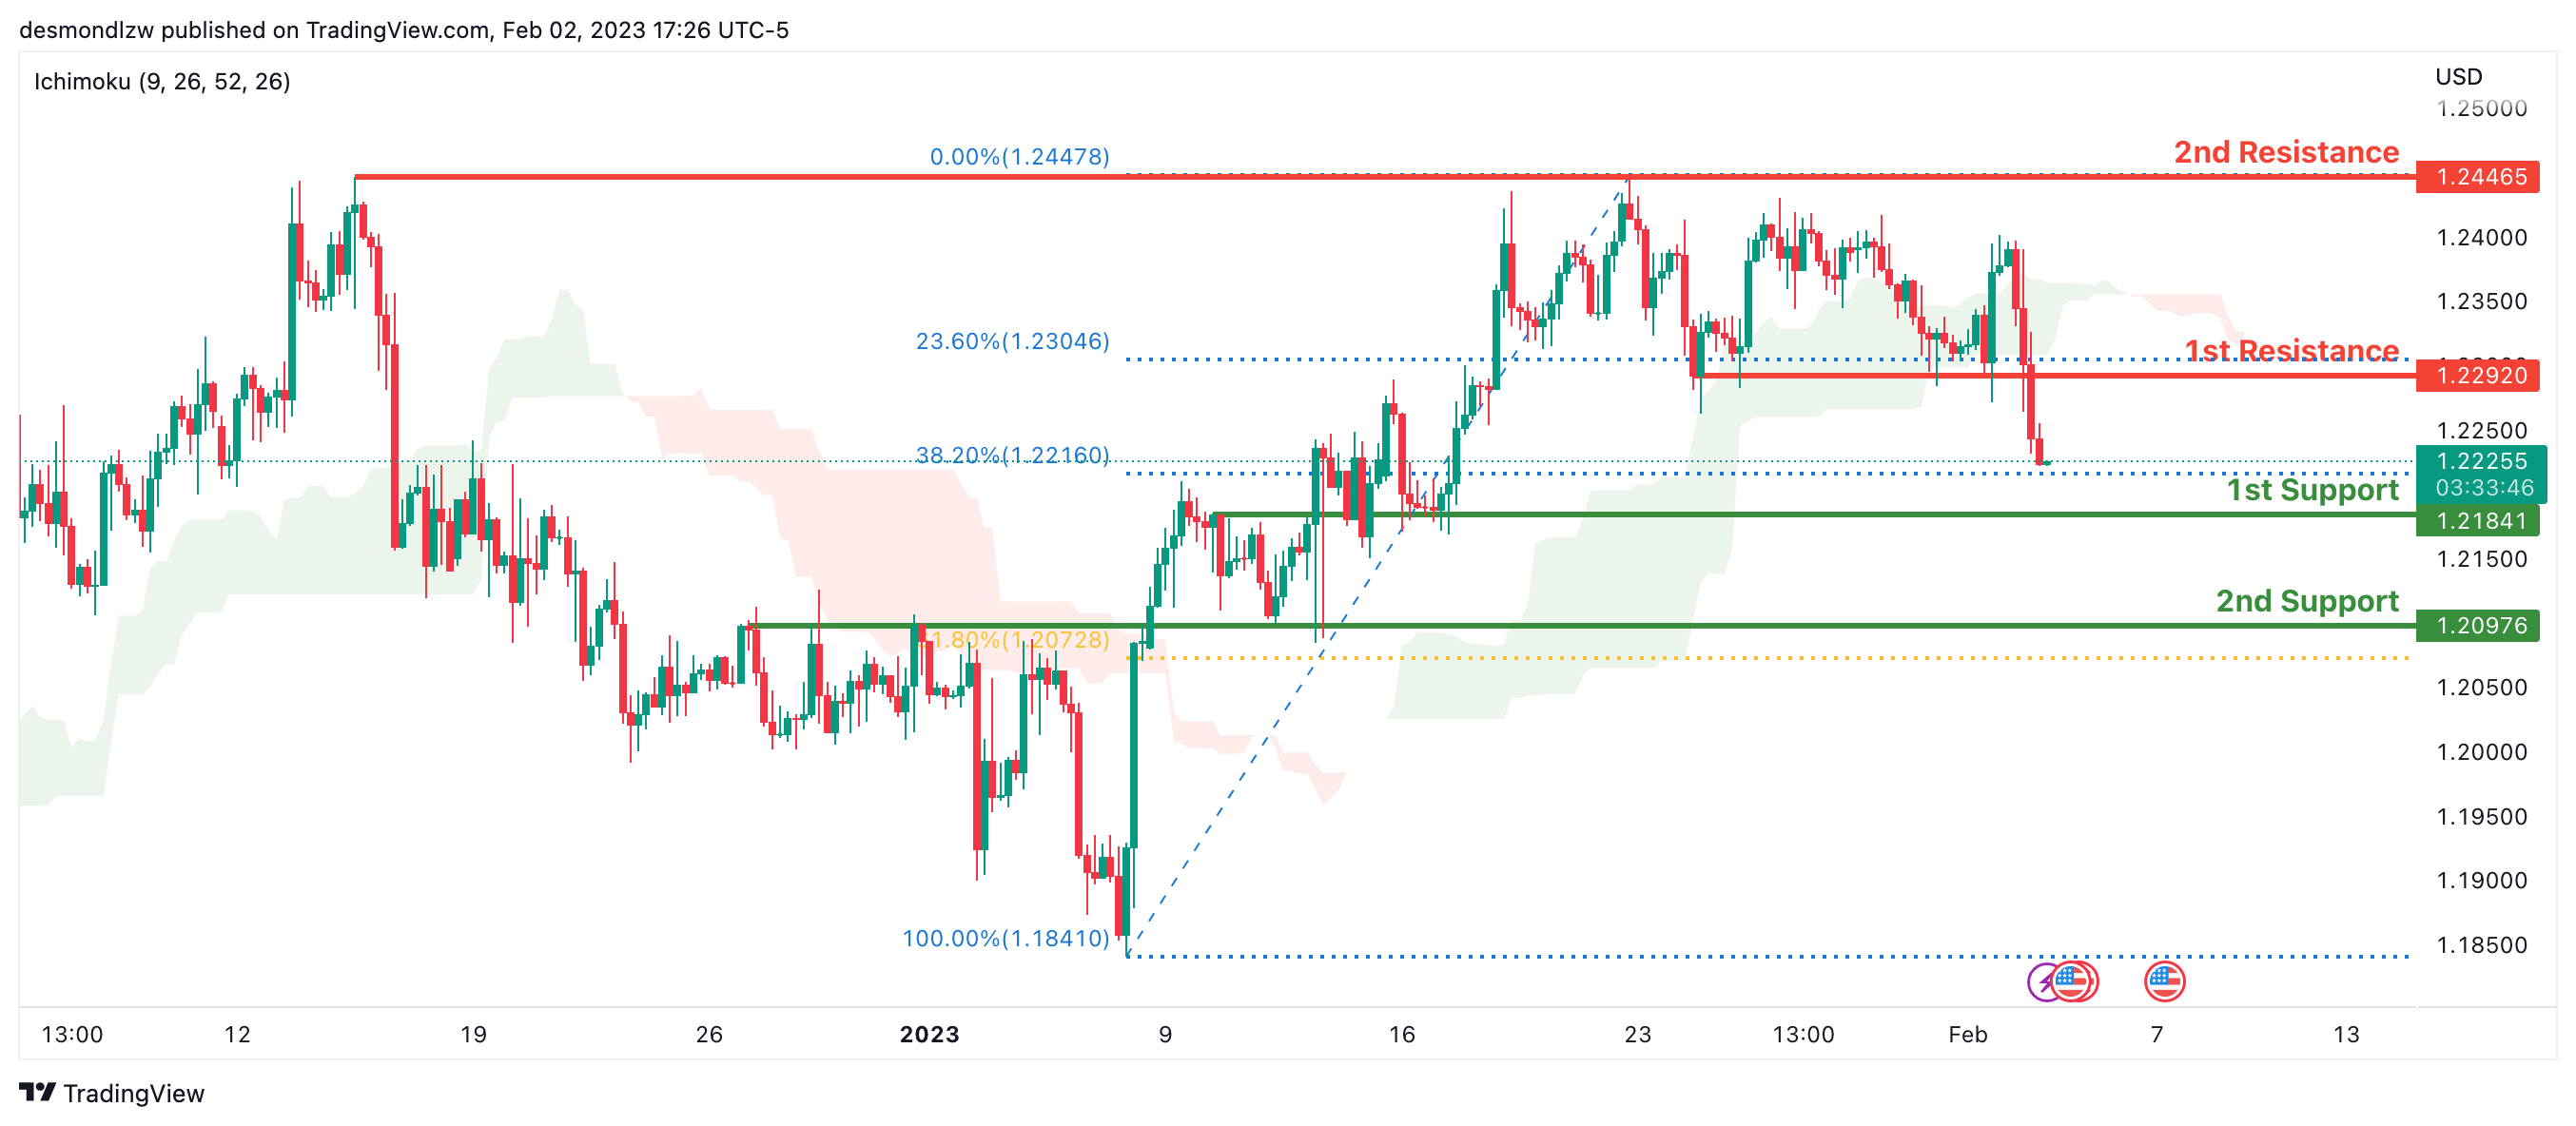
Looking at the H4 chart, my overall bias for GBPUSD is bearish due to the current price crossing below the Ichimoku cloud, indicating a bearish market. If this bearish momentum continues, expect the price to possibly continue to head towards the 1st support at 1.21841, where the 38.2% Fibonacci line is In an alternate scenario, price could head back up to retest the 1st resistance line at 1.22920, where the overlap resistance is.
Areas of consideration:
- H4 1st resistance at 1.22920
- H4 1st support at 1.21841
USD/CHF:
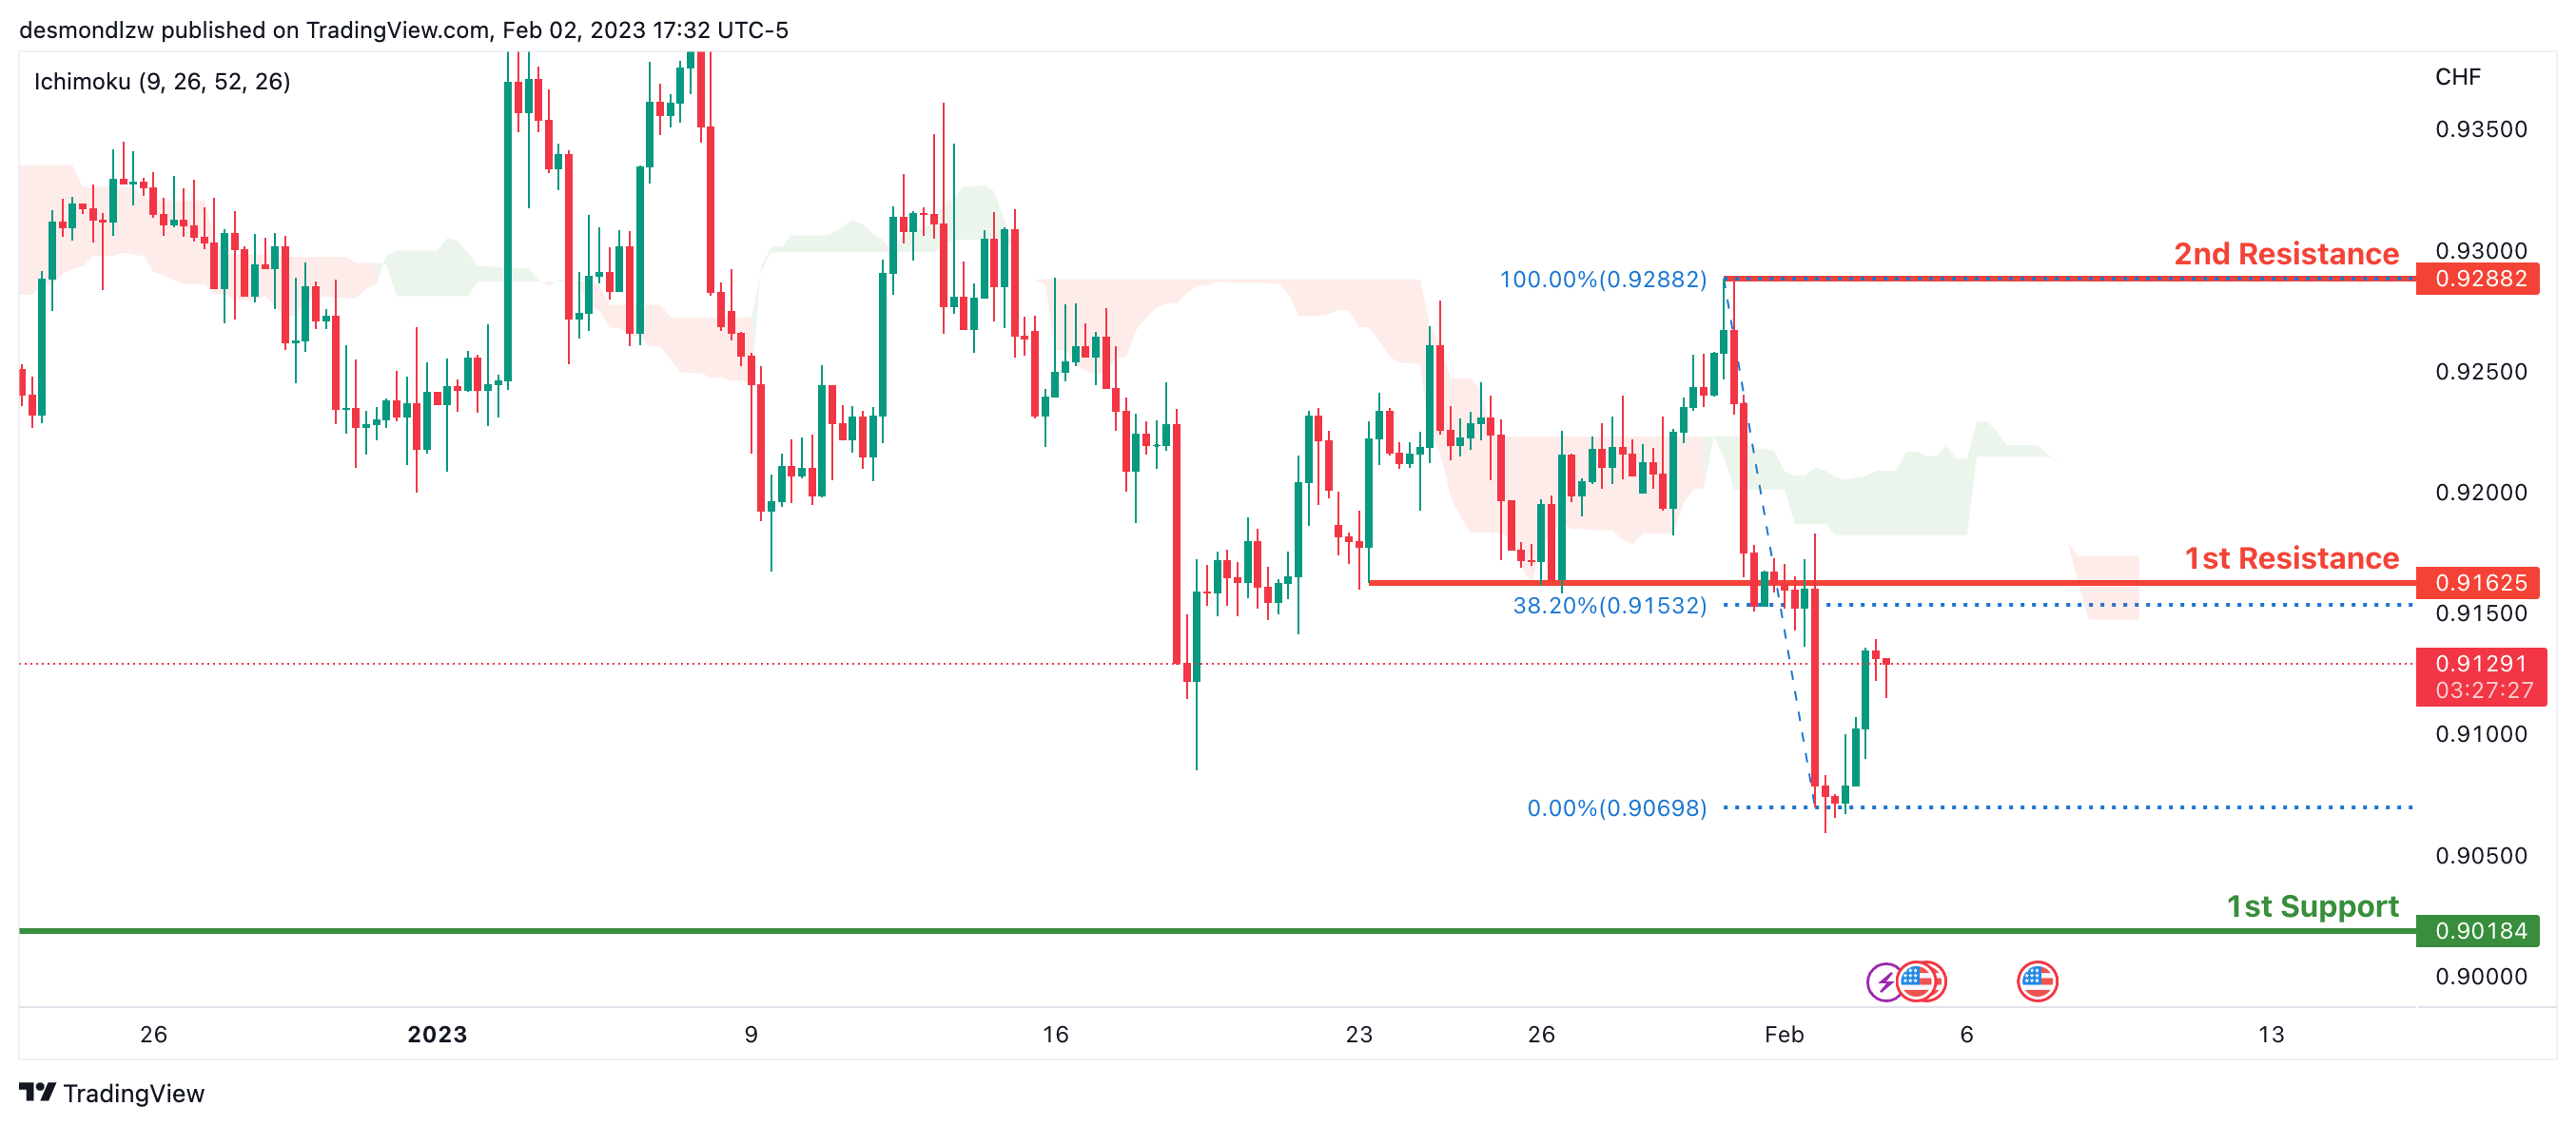
Looking at the H4 chart, my overall bias for USDCHF is bearish due to the current price being below the Ichimoku cloud, indicating a bearish market. If the current bearish trend continues, expect the price to possibly continue to head towards the 1st support at 0.90184, where the previous swing low is. In an alternative scenario, price could possibly head back up to retest the 1st resistance at 0.91625, where the 38.2% Fibonacci line is.
Areas of consideration
- H4 1st support at 0.90184
- H4 1st resistance at 0.91625
XAU/USD (GOLD):
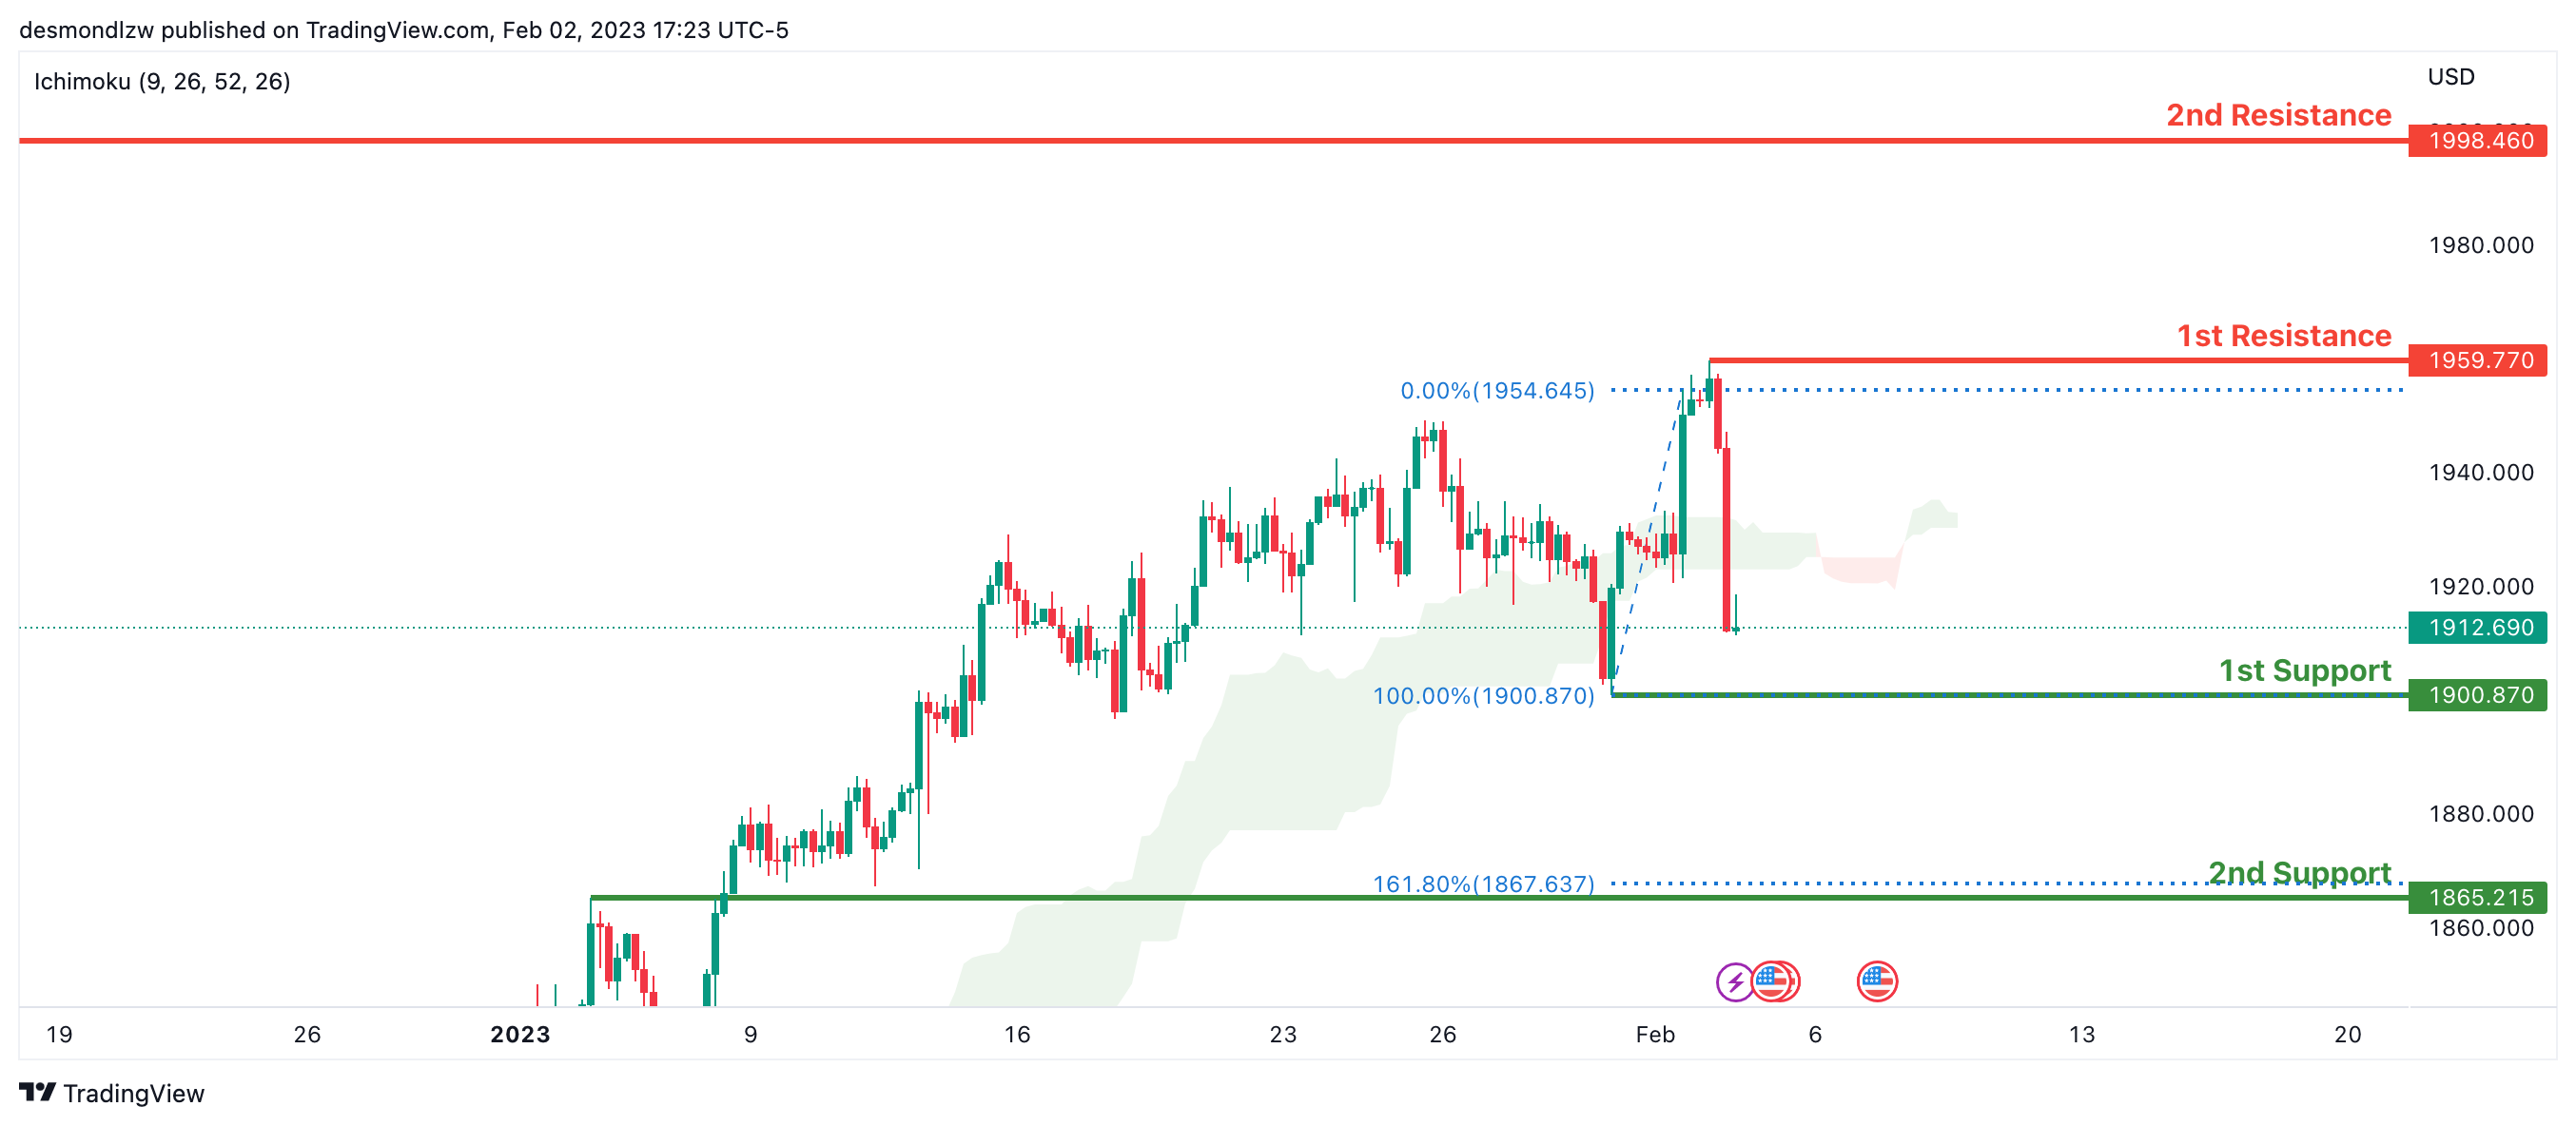
Looking at the H4 chart, my overall bias for XAUUSD is bearish due to the current price being below the Ichimoku cloud, indicating a bearish market. If this bearish momentum continues, expect the price to possibly continue heading towards the 1st support at 1900.870 where the recent low is. In an alternative scenario, price could possibly head back up to retest the 1st resistance at 1959.770, where the previous swing high is.
Areas of consideration:
- H4 time frame, 1st resistance at 1959.770
- H4 time frame, 1st support at 1900.870
AUD/USD:
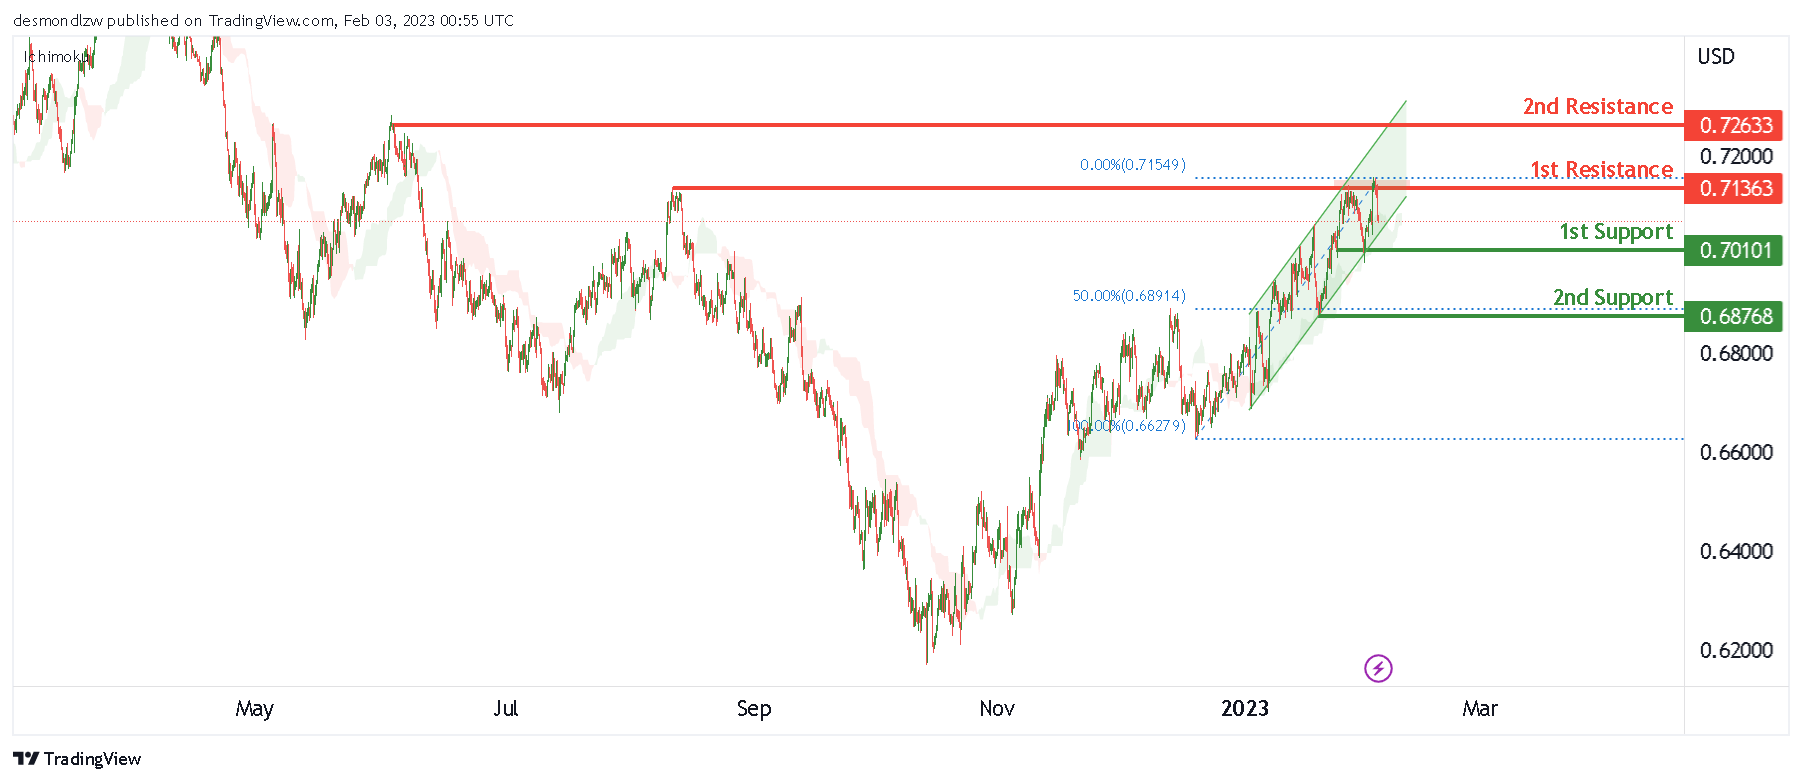
Looking at the H4 chart, my overall bias for AUDUSD is slightly bullish due to the current price being fluctuating within the ascending channel, even though the current price is within the Ichimoku cloud.
As the price tended to break through the 1st resistance level at 0.71363, but it did not. If the price breaks this significant level, the price will head towards the 2nd resistance level at 0.72633 which is the previous swing high.
In an alternate scenario, the price could possibly go back up towards the 1st support level at 0.70101which is the recent swing low, before heading down to the 2nd support at 0.68768 which is line with the 50% Fibonacci line.
Areas of consideration
- H4. 2nd resistance at 0.72633
- H4. 1st resistance at 0.71363,
- H4, 1st support at 0.70101
- H4, 2nd support at 0.68768
NZD/USD:
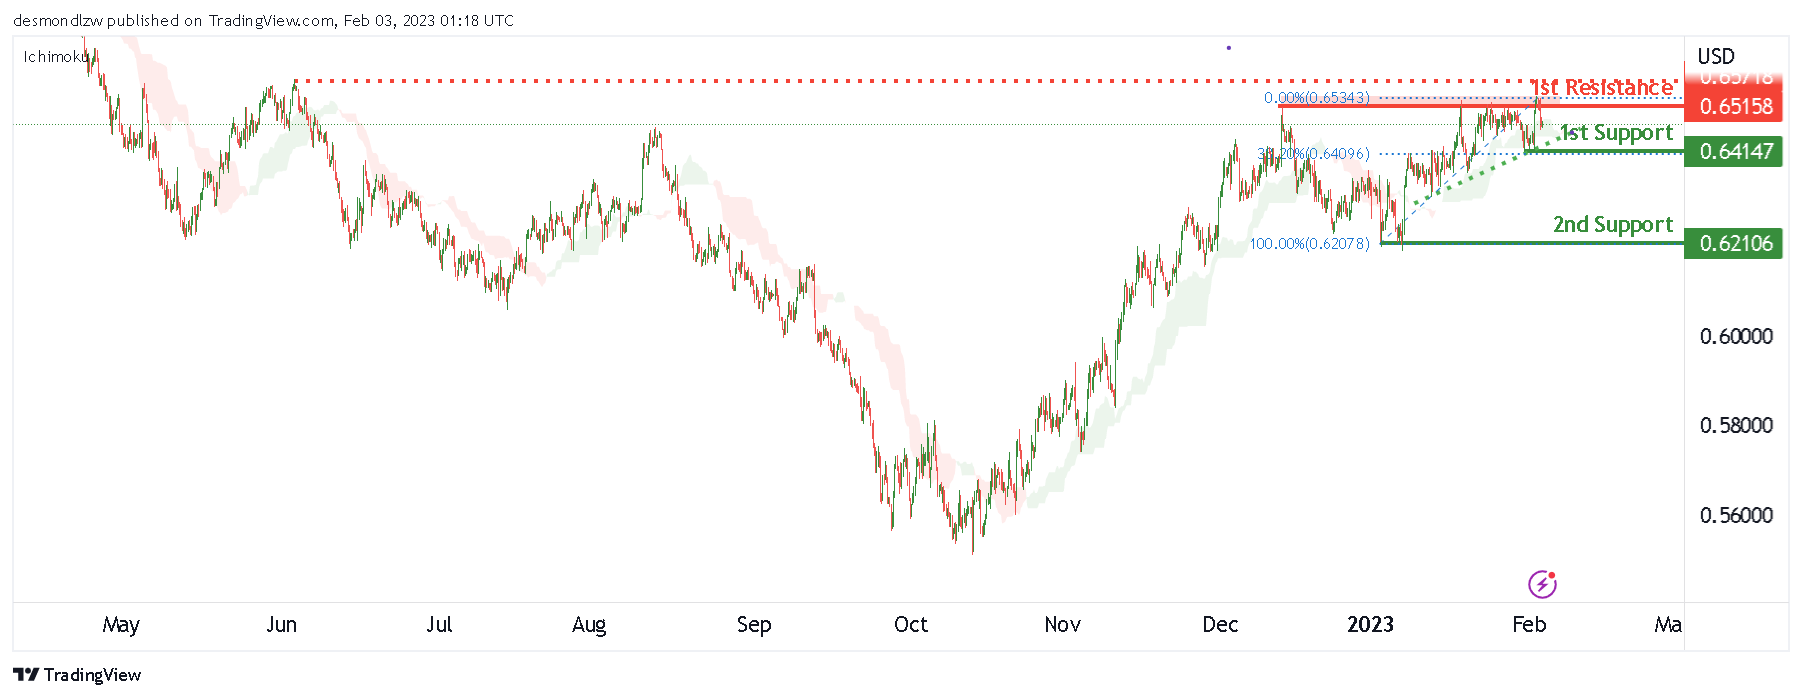
Looking at the H4 chart, my overall bias for NZDUSD is slightly bullish, there is an ascending trendline. Expecting the price to fluctuate within the trendline and 1st resistance at 0.65158, before heading toward the 2nd resistance level at 0.65576, the previous swing high.
In an alternate scenario, price could possibly head back toward the 1st support level at 0.64147 which is inline with the 38.2% Fibonacci retracement. Once it breaks 1st support level, the price is down to the 2nd support level at 0.62106
Areas of consideration:
- H4 time frame, 2nd resistance at 0.65576
- H4 time frame, 1st resistance at 0.65158
- H4 time frame, 1st support at 0.64147
- H4 time frame, 2nd support at 0.62106
USD/CAD:
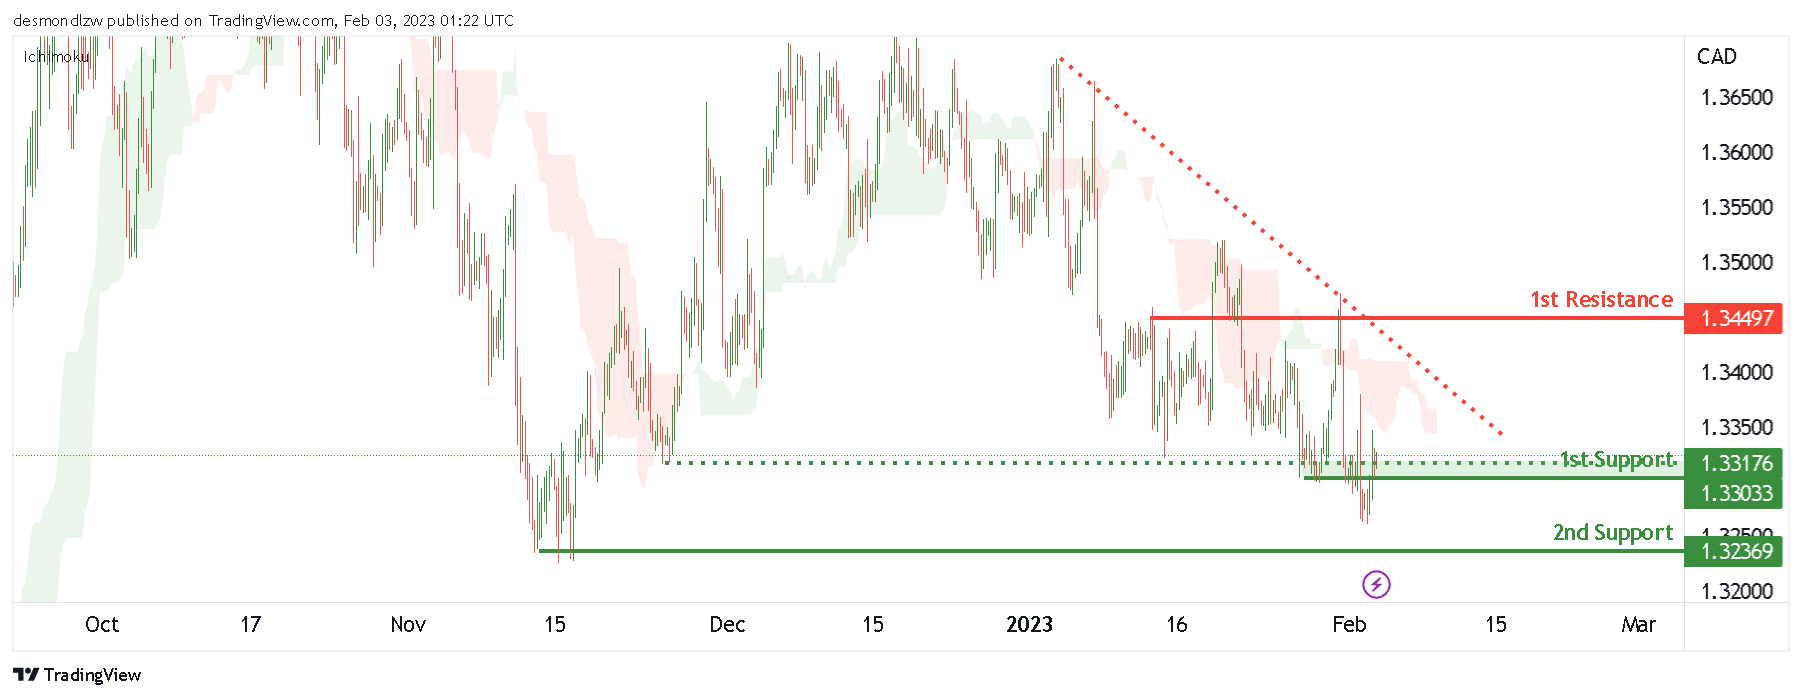
Looking at the H4 chart, my overall bias for USDCAD is bearish, as the current price is below the Ichimoku cloud, and the current price is fluctuating around the 1st support line at 1.33033. There is a descending trend line created. Expecting the price is heading down to the 2nd support level at 1.32369 which is the recent swing low.
In an alternative scenario, the price could possibly head up to the 1st resistance at 1.34497 which is the recent swing high.
Areas of consideration:
- H4 time frame, 1st resistance at 1.34497
- H4 time frame, 1st support at 1.33033
- H4 time frame, 2nd support at 1.32369
OIL:
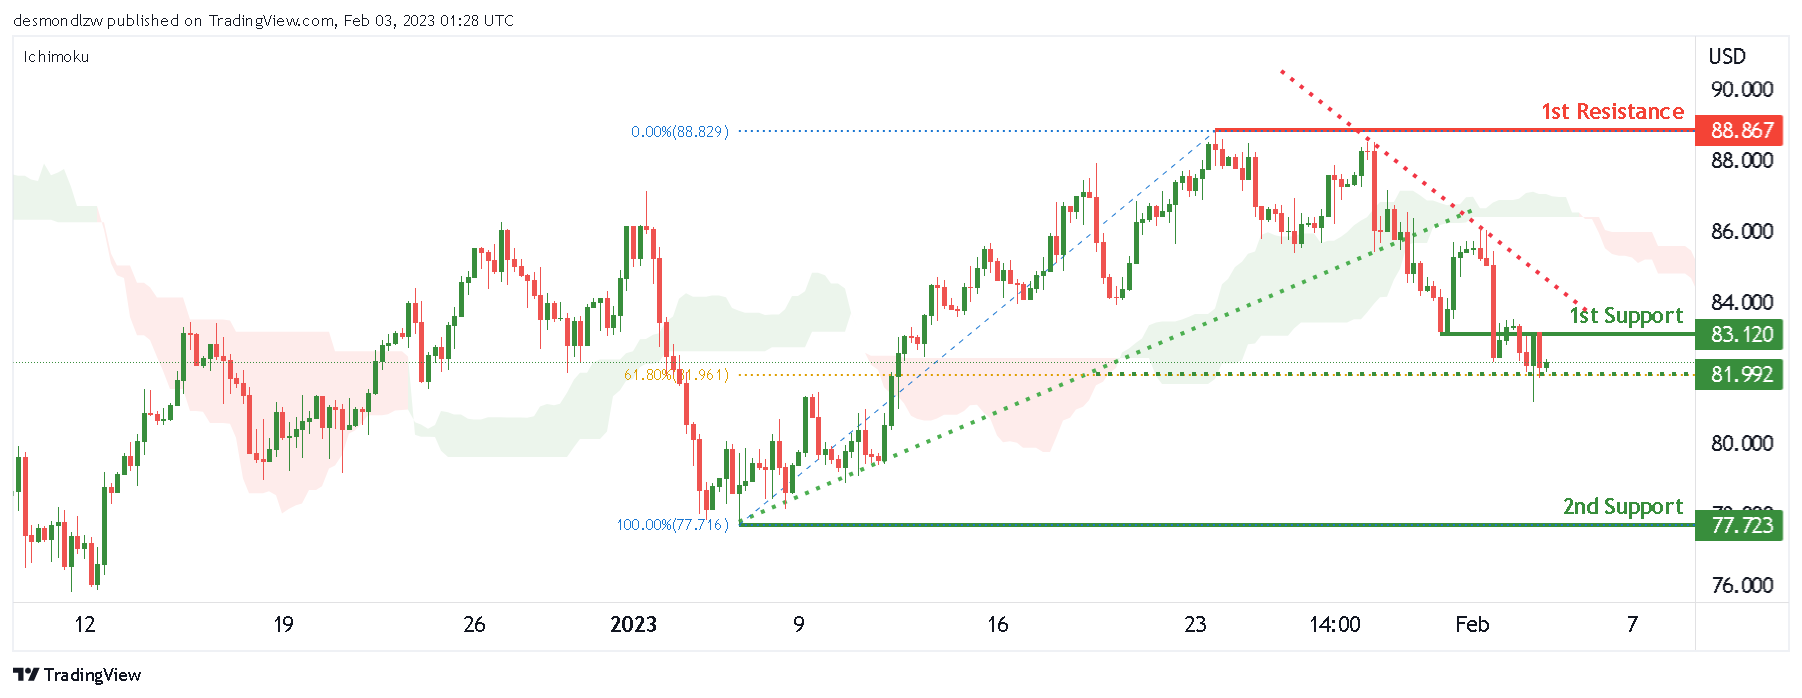
Looking at the H4 chart, my overall bias for BOC is slightly bearish.as the current price is below the Ichimoku cloud, and a descending trendline add confluence to my bias. Expecting the price to fluctuate around the 1st support level at 83.120, before it heads down to the intermediate support at 81.992 which is inline with the 61.8% Fibonacci retracement, and 2nd support at 77.723.
In an alternate scenario, the price could possibly head up towards the 1st resistance level at 88.829 which is the recent swing high.
Areas of consideration:
- H4 time frame, 1st resistance at 88.829
- H4 time frame,1st support at 83.120
- H4 time frame, intermediate support at 81.992
- H4 time frame, 2nd support at 77.723.
Dow Jones Industrial Average:
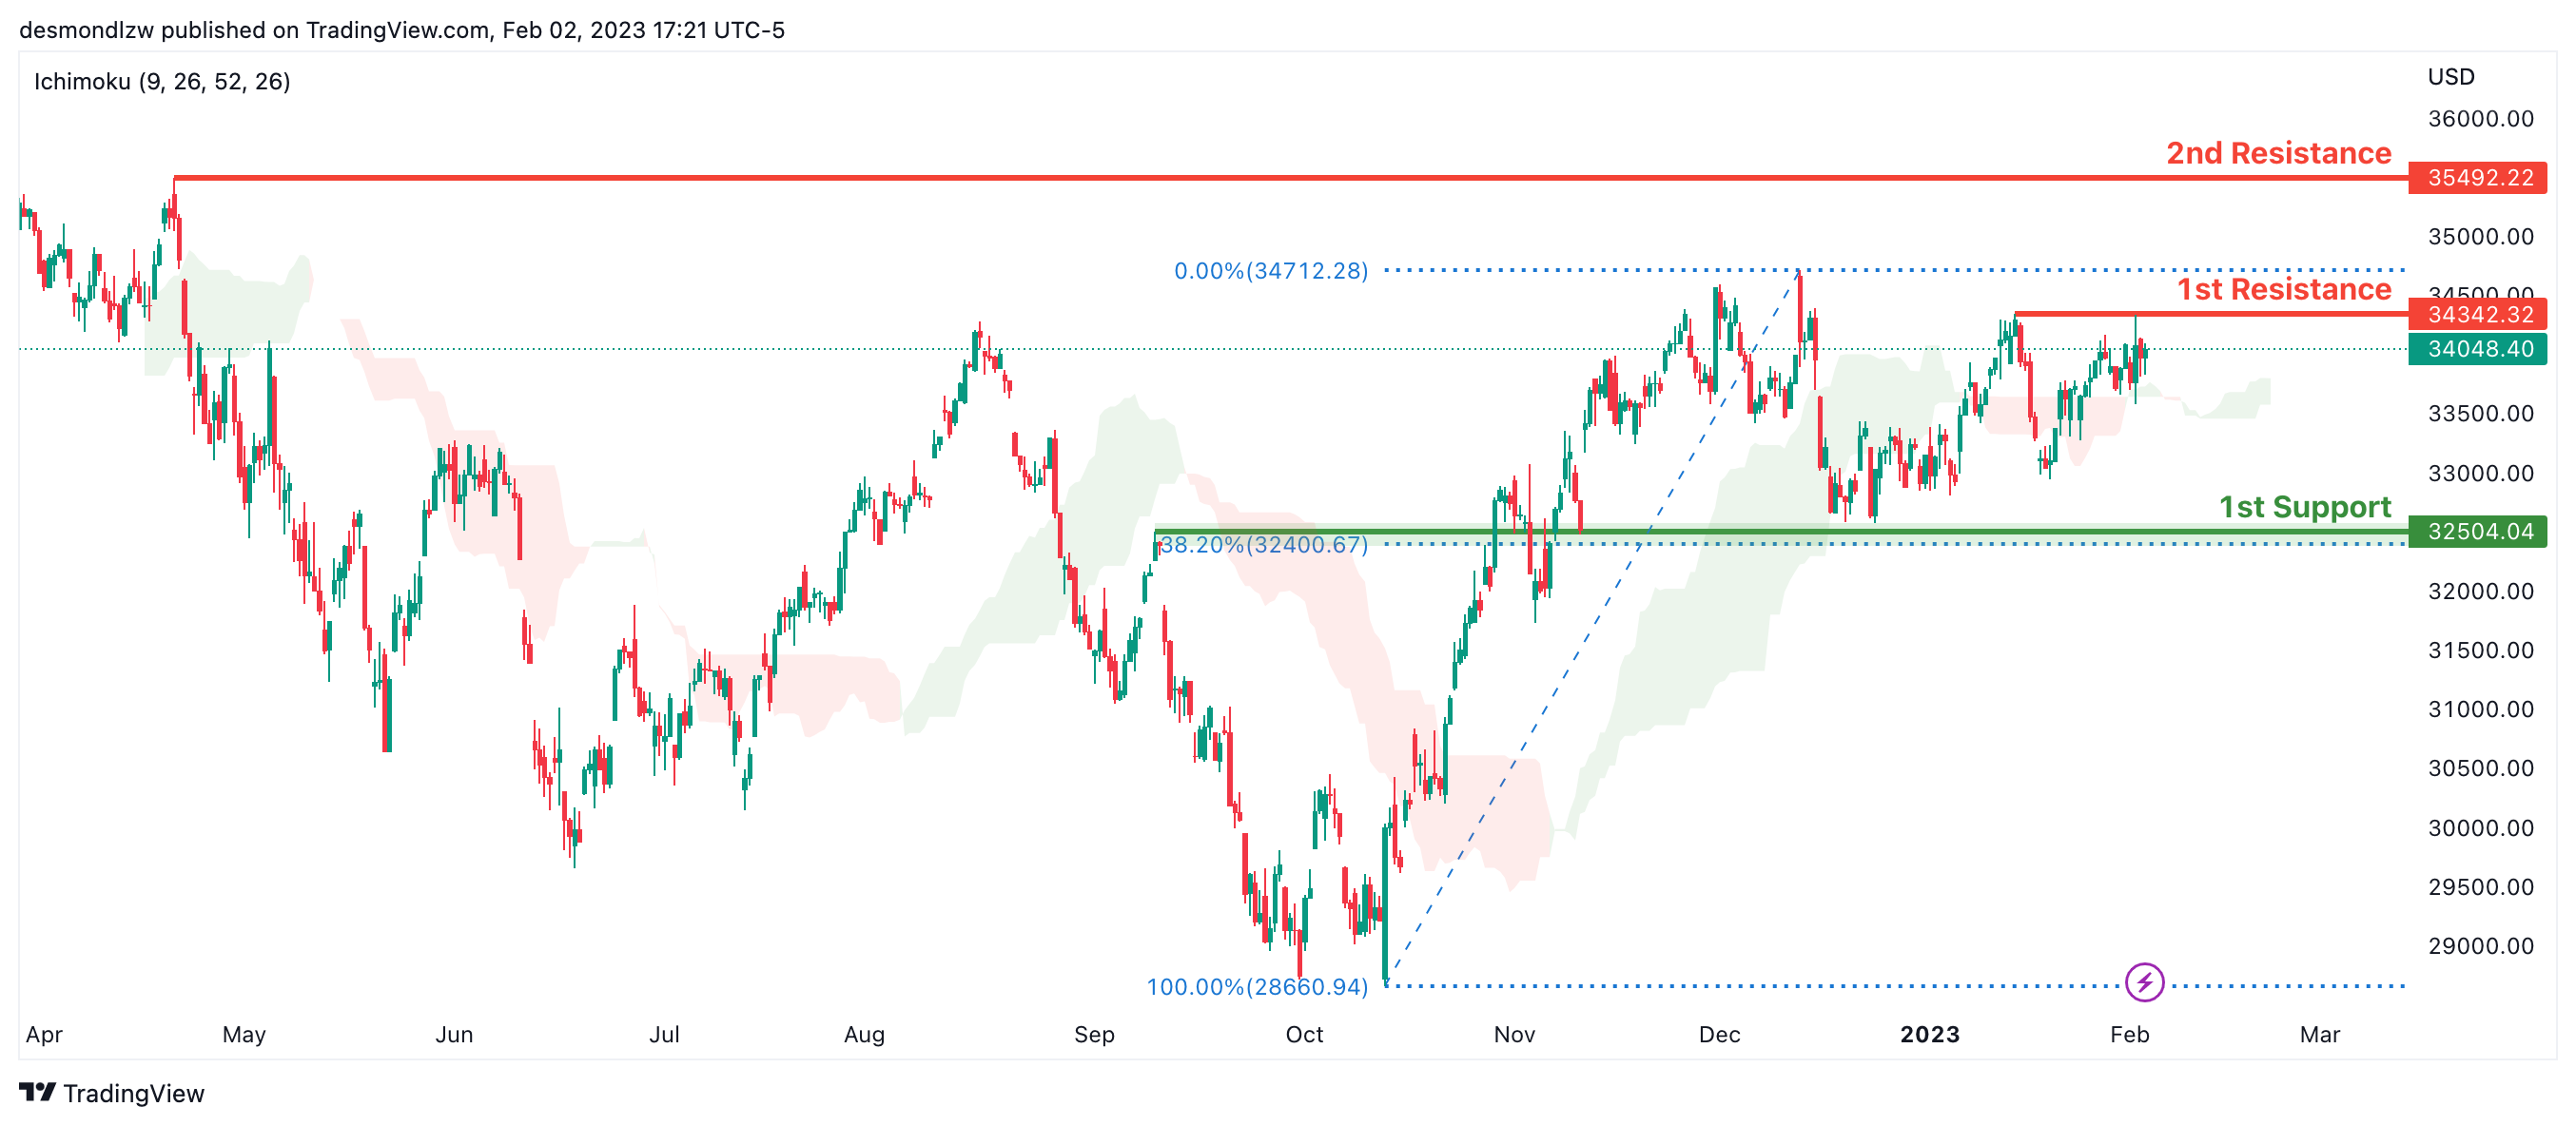
On the H4 chart, the overall bias for DJI is bullish. To add confluence to this, the price is crossing above the Ichimoku cloud which indicates a bullish market. If this bullish momentum continues, expect the price to possibly continue heading towards the 1st resistance line at 34342.32, where the recent swing high is. In an alternative scenario, price could possibly head back down towards the 1st support at 32581.97, slightly above where the 38.2% Fibonacci line is.
Areas of consideration:
- H4 time frame, 1st support at 32581.97
- H4 time frame, 1st Resistance at 34342.32
DAX:
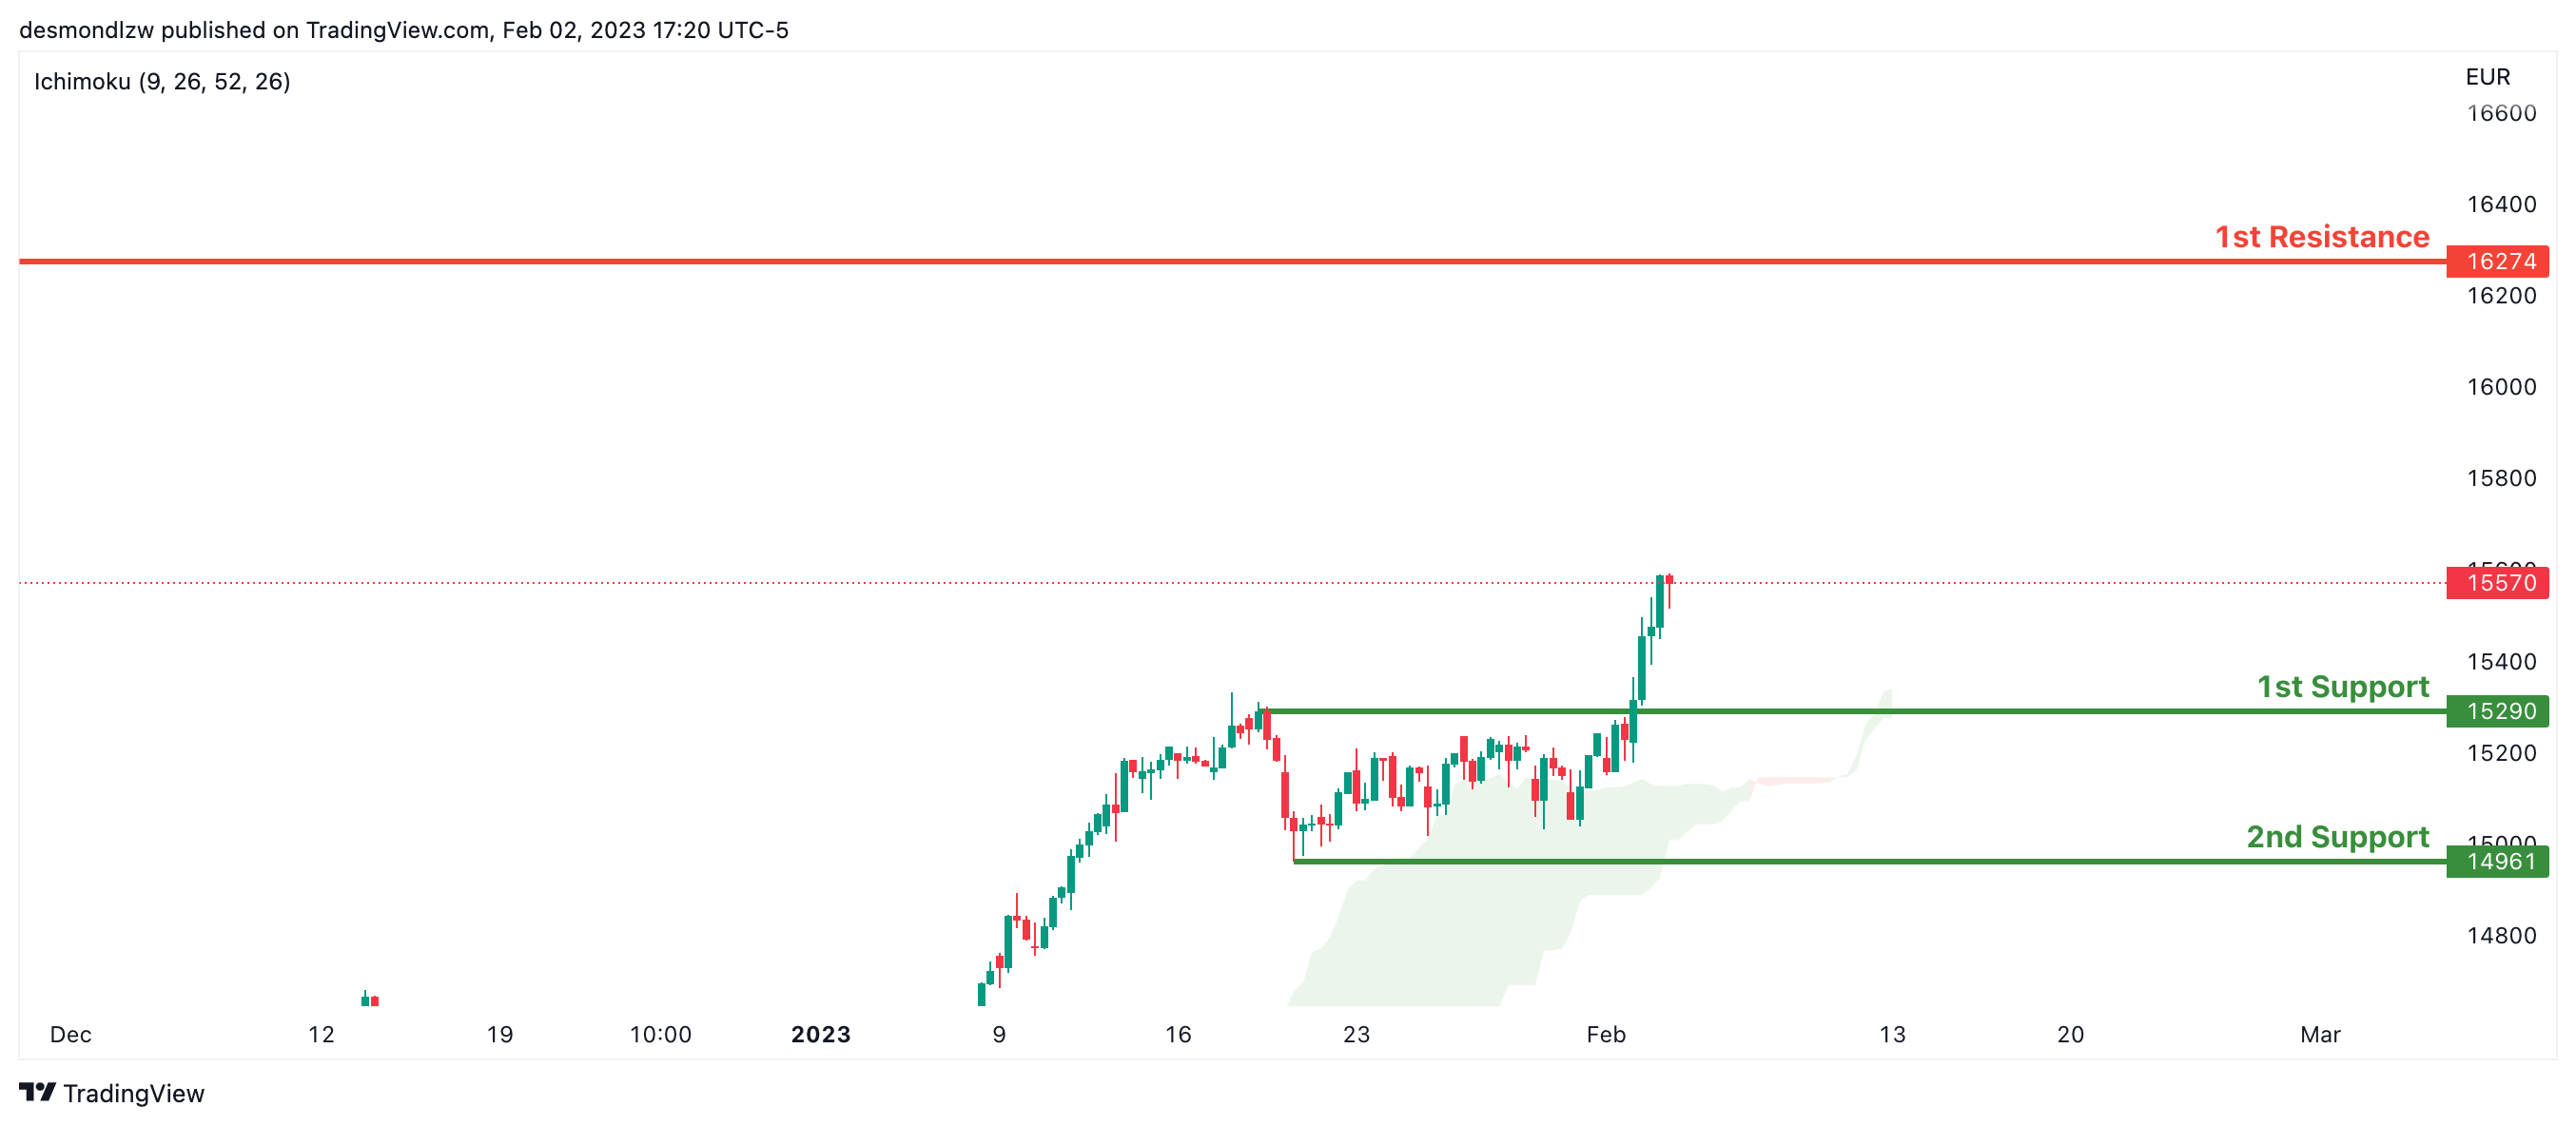
Looking at the H4 chart, my overall bias for DAX is bullish due to the current price crossing above the Ichimoku cloud, indicating a bullish market. If this bullish momentum continues, expect the price to possibly head towards the 1st resistance line at 16274, where the previous swing high is. In an alternative scenario, price could possibly head down to retest the 1st support at 15290, where the overlap support is.
Areas of consideration:
- H4 time frame, 1st resistance is at 16274
- H4 time frame, 1st support is at 15290
ETHUSD:
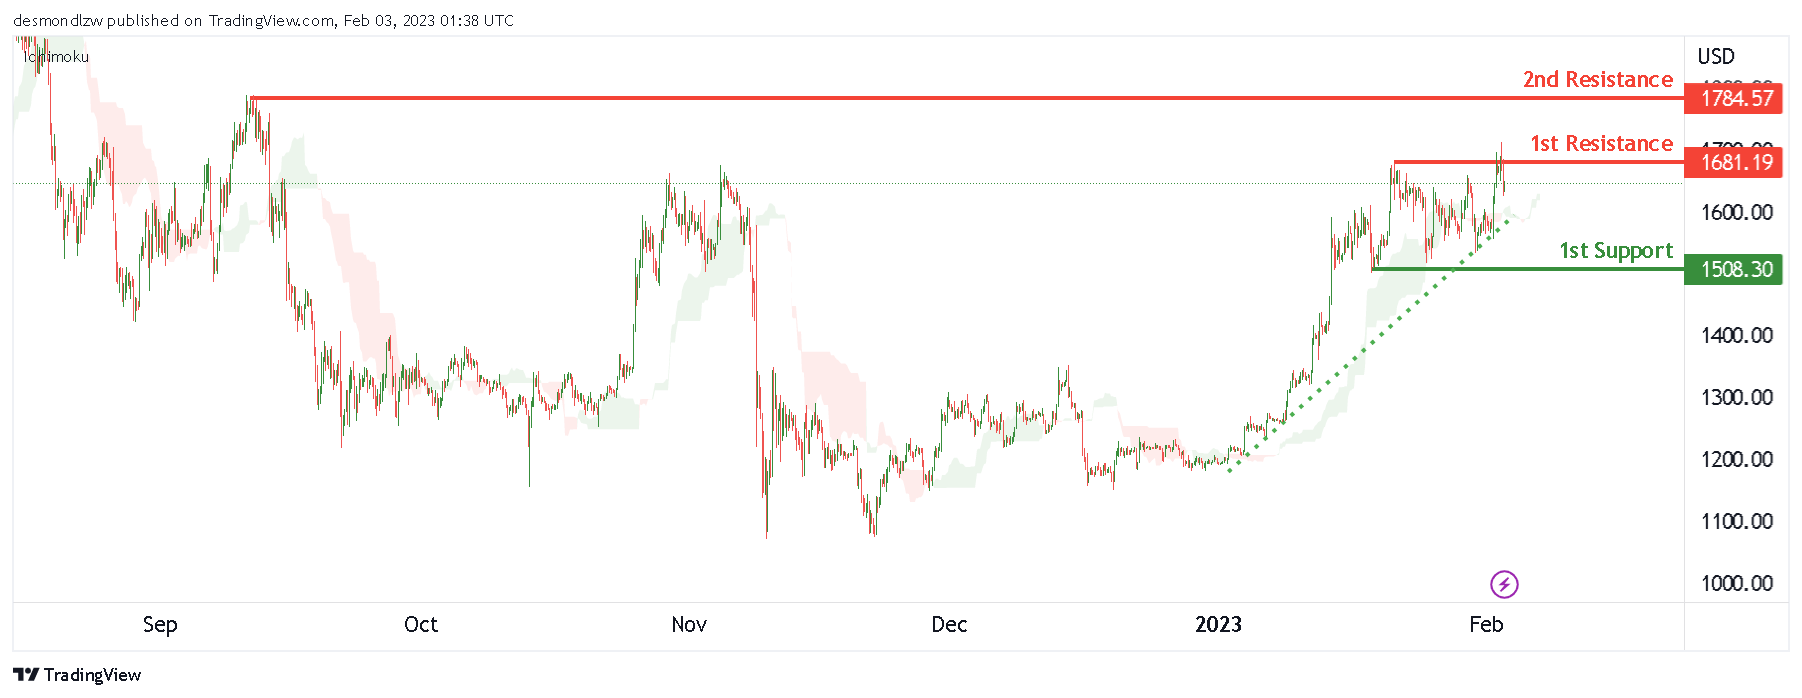
Looking at the H4 chart, my overall bias for ETHUSD is slightly bullish, the strong ascending trend line has been created. Expecting the price to break the 1st resistance line at 1681.19 which is the recent swing high, before it heads towards the 2nd resistance 1782.49.
In an alternate scenario, the price may go down to the 1st support at 1508.30 which is the recent swing low.
Areas of consideration:
- H4 time frame, 2nd resistance of 1782.49
- H4 time frame, 1st resistance of 1681.19
- H4 time frame, 1st support at 1508.30
BTCUSD:
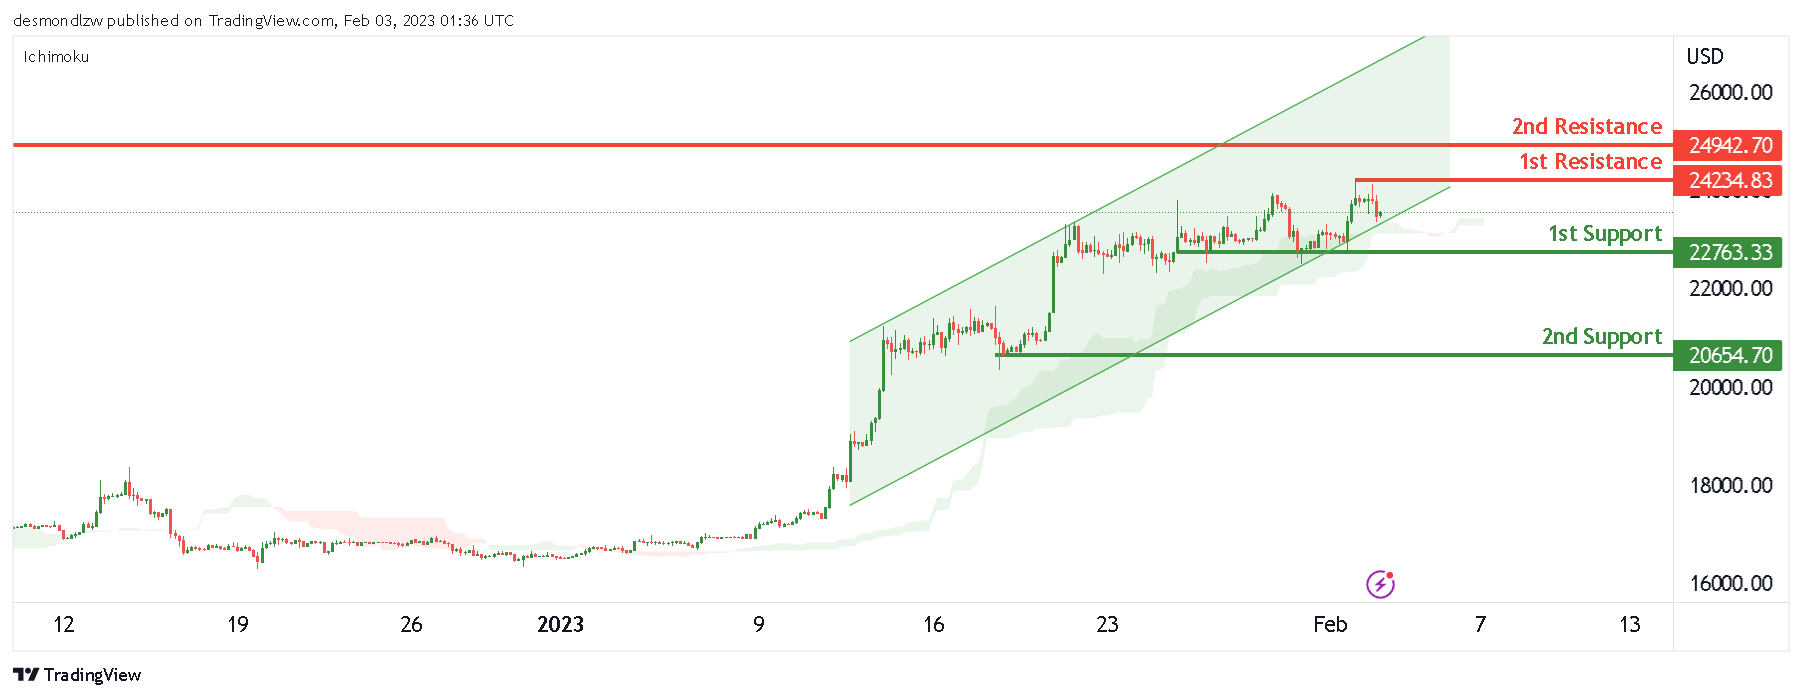
Looking at the H4 chart, my overall bias for BTCUSD is bullish. An ascending channel was created, expecting the price to break the 1st resistance line at 24234.83 which is the recent overlap resistance, before heading towards the 2nd resistance at 24942.70 which is the previous swing high.
In an alternative scenario, the price could possibly head down to the 1st support at 22763.33 which is the overlap support.
Areas of consideration:
- H4 time frame, 2nd resistance 24942.70
- H4 time frame, 1st resistance 24234.83
- H4 time frame, 1st support at 22763.33
S&P 500:
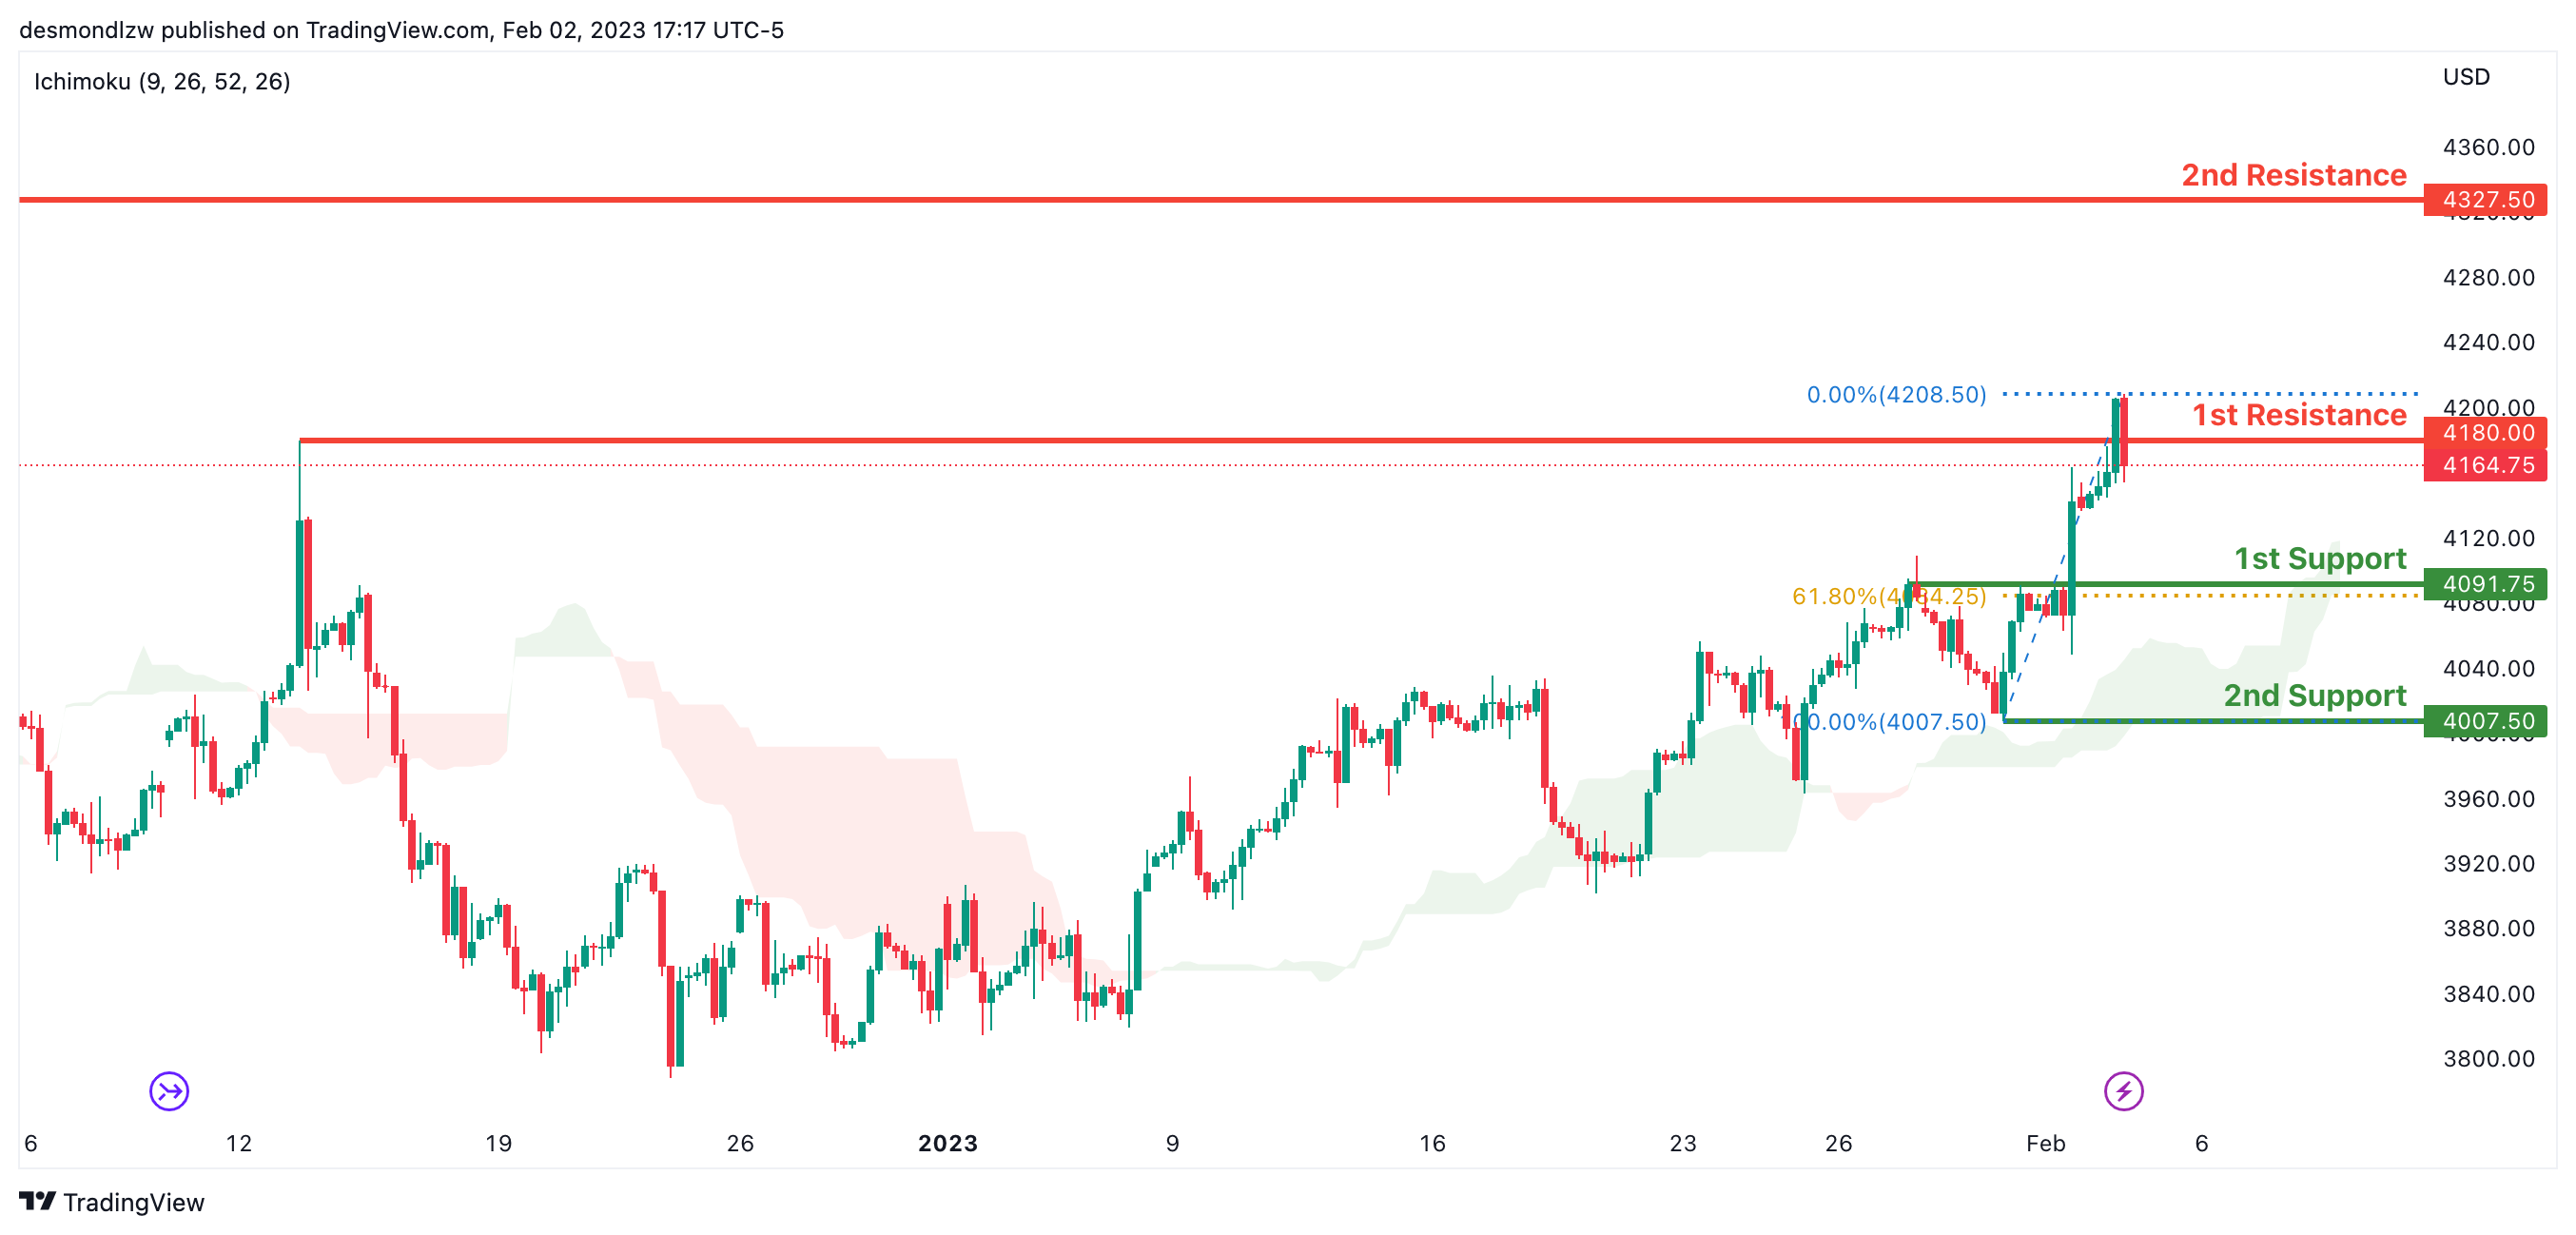
Looking at the H4 chart, my overall bias for S&P500 is bullish due to the current price being above the Ichimoku cloud, indicating a bullish market. If this bullish momentum continues, expect the price to possibly break the 1st resistance at 4180.00, where the previous swing high is., before heading towards the 2nd resistance at 4327.50 where the previous swing high is, In an alternative scenario, price could possibly head back down to retest the 1st support at 4091.75, where the 50% Fibonacci line is.
Areas of consideration:
- H4 time frame, 1st support at 4091.75
- H4 time frame, 1st resistance at 44180.00
- H4 time frame, 2nd resistance at 4327.50
USD/JPY Faces Selling Pressure Ahead of US NFP Release
Key Highlights
- USD/JPY is facing a strong resistance near the 130.00 zone.
- A crucial bearish trend line is forming with resistance near $129.80 on the 4-hours chart.
- Yesterday, gold price and crude oil price saw a strong bearish reaction.
- The US nonfarm payrolls could increase 185K in Jan 2023, down from 223K.
USD/JPY Technical Analysis
The US Dollar attempted an upside break above the 130.50 resistance against the Japanese Yen. However, USD/JPY failed to settle above 130.50 and started a fresh decline.
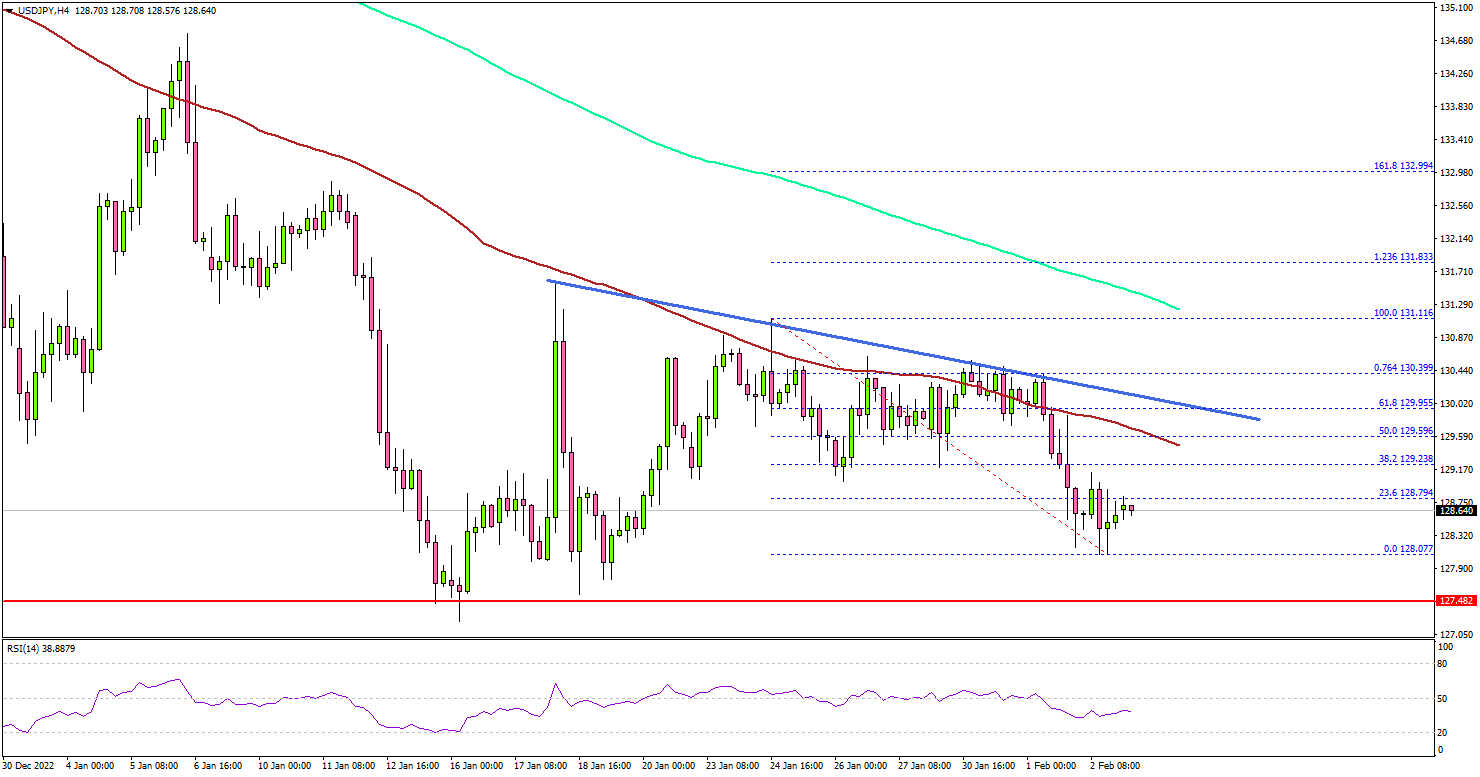
Looking at the 4-hours chart, the pair declined below the 130.00 and 129.20 support levels. There was also a close below the 130.00 level, the 100 simple moving average (red, 4-hours) and the 200 simple moving average (green, 4-hours).
It tested the 128.00 zone and started a consolidation phase. On the upside, the pair is facing resistance near 129.50 and the 100 simple moving average (red, 4-hours).
The first major resistance is near the 130.00 level. There is also a crucial bearish trend line forming with resistance near $129.80 on the same chart. A clear move above the 130.00 resistance might start a steady increase towards the 135.50 resistance zone.
Any more gains could open the doors for a move towards the 131.20 level. The next key hurdle is near 132.00, above which the pair could climb towards the 133.50 resistance zone.
On the downside, there is a key support at 128.00. The next major support sits near the 127.40 level. Any more losses might open the doors for a move towards the 126.00 support zone.
Looking at gold price, there was a strong bearish reaction after the bulls failed to keep the price above the $1,950 resistance zone.
Economic Releases
- Germany’s Services PMI for Jan 2023 - Forecast 50.4, versus 50.4 previous.
- Euro Zone Services PMI for Jan 2023 – Forecast 50.7, versus 50.7 previous.
- UK Services PMI for Jan 2023 – Forecast 48.0, versus 48.0 previous.
- US Services PMI for Jan 2023 – Forecast 50.3, versus 49.6 previous.
- US nonfarm payrolls for Jan 2023 – Forecast 185K, versus 223K previous.
- US Unemployment Rate for Jan 2023 - Forecast 3.6%, versus 3.5% previous.