Sample Category Title
EURUSD: Pullback Likely To Find Support In Elliott Wave Correction
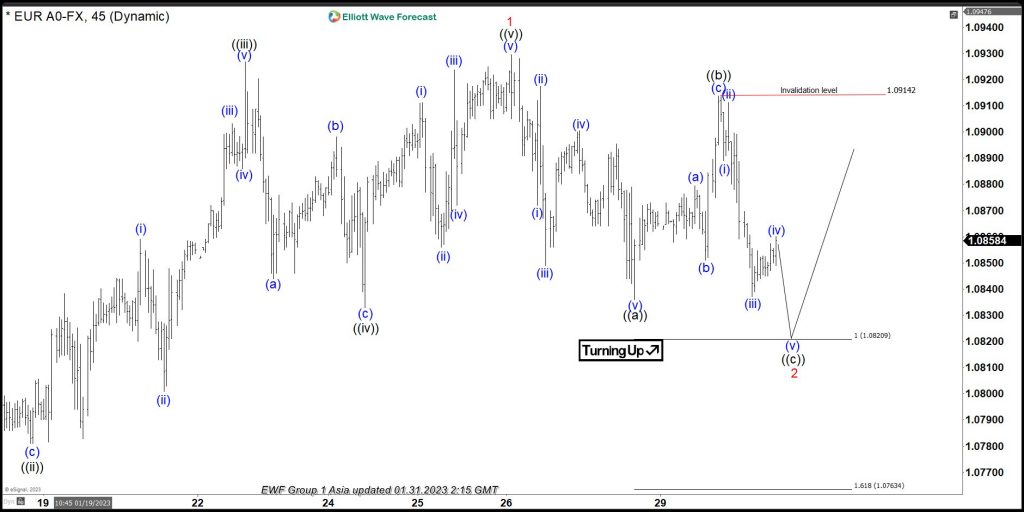
In short term Elliott wave sequence, EURUSD favors pullback in wave 2 started from 1/26/2023 high before upside resumes in wave 3. It is correcting in wave 2 in 3, 7 or 11 swings against the bullish sequence from 1/06/2023 low and expect to find support at extreme areas before turning higher. Since 1/06/2023 low, it placed ((i)) at 1.0868 high in wave 1. Below there, it placed ((ii)) at 1.0781 low as flat correction. It finished ((iii)) at 1.0927 high and ((iv)) at 1.0833 low. Finally, it ended ((v)) at 1.0929 high as wave 1 in diagonal structure in (C) leg on 1/26/2023. Below there, it favors pullback in wave 2 in proposed 3 swing correction.
Below wave 1 high, it started correcting lower in wave 2 in proposed zigzag sequence. It ended ((a)) at 1.0836 low as short term diagonal sequence. Inside ((a)) leg, it ended (i) at 1.0872 low and ((ii)) at 1.0917 high. Below there, it finished (iii) at 1.0849 low and (iv) at 1.0900 high. Finally, it ended (v) at 1.0836 low as ((a)) in wave 2 correction. It proposed ended ((b)) at 1.0914 high in 3 swings bounce, where (a) ended at 1.0879 high, (b) at 1.0851 low and (c) at 1.0914 high. Below ((b)) high, it favors lower in ((c)) leg, which confirms below ((a)) low. It placed (i) of ((c)) at 1.0889 low and (ii) at 1.0911 high. It finished extended wave (iii) at 1.0837 low and appears ended (iv) at 1.0860 high. Below there, it favors lower in (v) towards 1.0821 – 1.0763 area to finish ((c)) leg at extreme areas to end wave 2 correction. From extreme areas, it expect to resume higher either in wave 3 or at least can see 3 swing bounce as the part of double correction in wave 2.
EURUSD 45 minutes Elliott Wave Chart
GBP/USD Faces Key Breakout Resistance, Oil Price Dips
Key Highlights
- GBP/USD is facing a strong resistance near the 1.2450 zone.
- A key bullish trend line is forming with support near 1.2350 on the 4-hours chart.
- EUR/USD could correct lower if it stays below 1.0920 for a long time.
- Crude oil price corrected lower from the $82.40 resistance zone.
GBP/USD Technical Analysis
The British Pound seems to be facing a strong resistance near 1.2450 against the US Dollar. GBP/USD traded as high as 1.2447 before starting a consolidation phase.
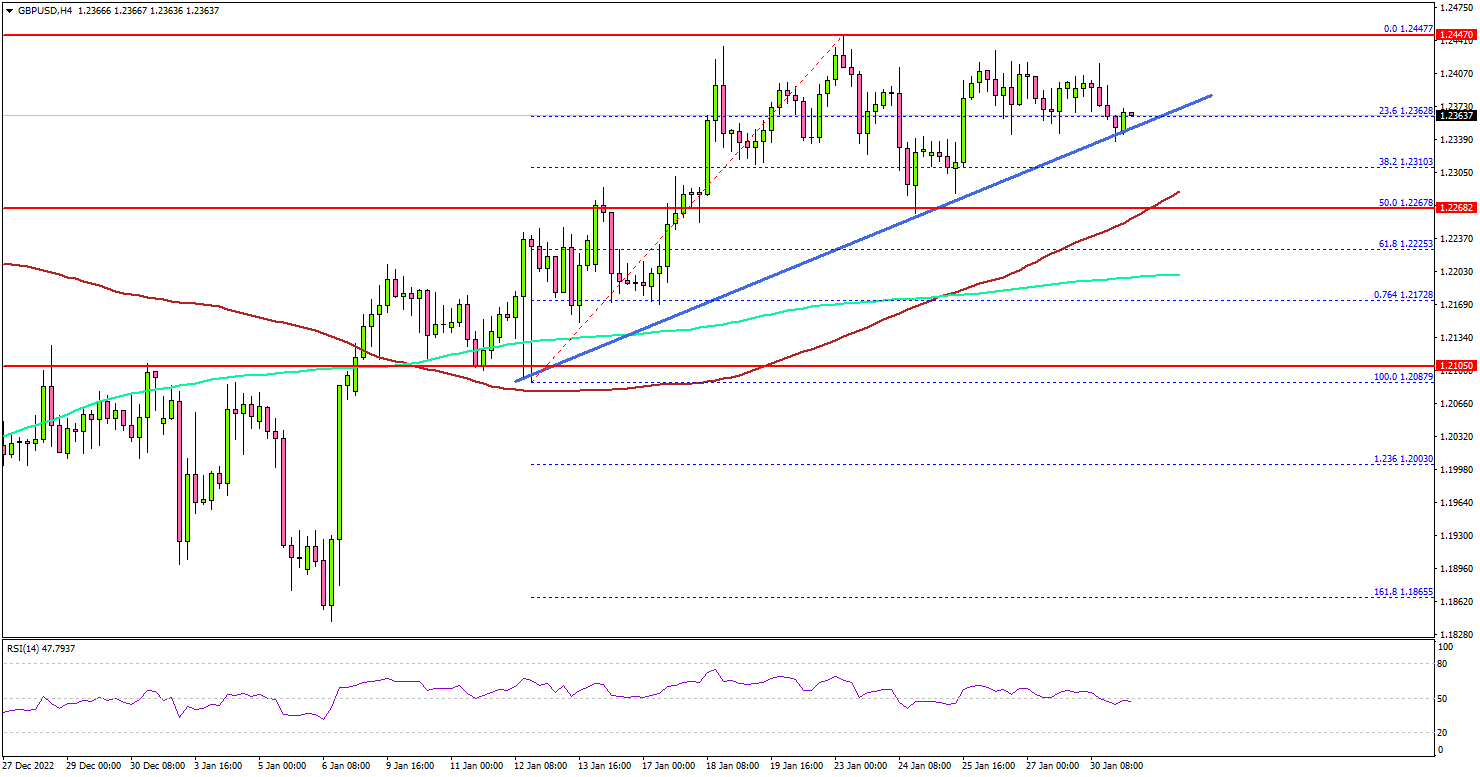
Looking at the 4-hours chart, the pair slowly moved lower from the 1.2447 high. However, the pair is trading well above the 100 simple moving average (red, 4-hours) and the 200 simple moving average (green, 4-hours).
There was a drop below the 38.2% Fib retracement level of the upward move from the 1.2087 swing low to 1.2447 high. The pair tested the 1.2270 support and remained well supported.
The bulls protected the 50% Fib retracement level of the upward move from the 1.2087 swing low to 1.2447 high. There is also a key bullish trend line forming with support near 1.2350 on the same chart.
If there is a downside break, the pair might test the 1.2270 support and the 100 simple moving average (red, 4-hours). The next major support sits near the 1.2200 level and the 200 simple moving average (green, 4-hours). Any more losses might open the doors for a move towards the 1.2080 support zone.
On the upside, the pair is facing resistance near 1.2420. The first major resistance is near the 1.2450 level. A clear move above the 1.2450 resistance might start a steady increase towards the 1.2550 resistance zone.
Any more gains could open the doors for a move towards the 1.2680 level. The next key hurdle is near 1.2720, above which the pair could climb towards the 1.2850 resistance zone.
Looking at EUR/USD, the pair is consolidating above the 1.0850 zone and there is a risk of a downside correction in the near term.
Economic Releases
- German CPI for Jan 2023 (Preliminary) (YoY) – Forecast +9.2%, versus +8.6% previous.
- German CPI for Jan 2023 (Preliminary) (MoM) – Forecast +1%, versus -0.8% previous.
- Euro Zone Gross Domestic Product Q4 2022 (Preliminary) (QoQ) - Forecast 0%, versus 0.3% previous.
- Euro Zone Gross Domestic Product Q4 2022 (Preliminary) (YoY) - Forecast 1.8%, versus 2.3% previous.
USDCHF Wave Analysis
- USDCHF reversed from long-term support level 0.9150
- Likely to rise to resistance level 0.9300
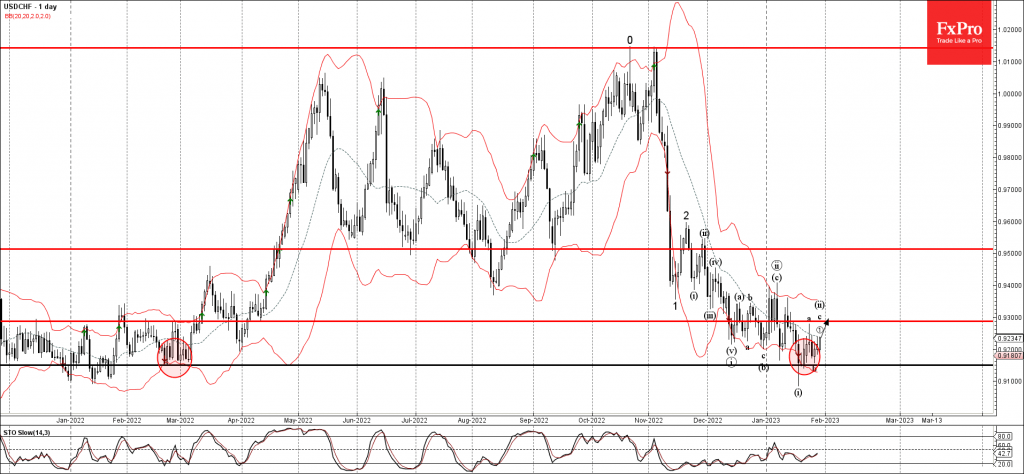
USDCHF currency pair previously reversed up from the long-term support level 0.9150 (which has been reversing the price from February of 2022, as can be seen below).
The upward reversal from the support level 0.9150 started the active minor impulse wave c.
Given the strengthening USD bullish pressure, USDCHF can be expected to rise further toward the next resistance level 0.9300 (which stopped the earlier minor wave a).
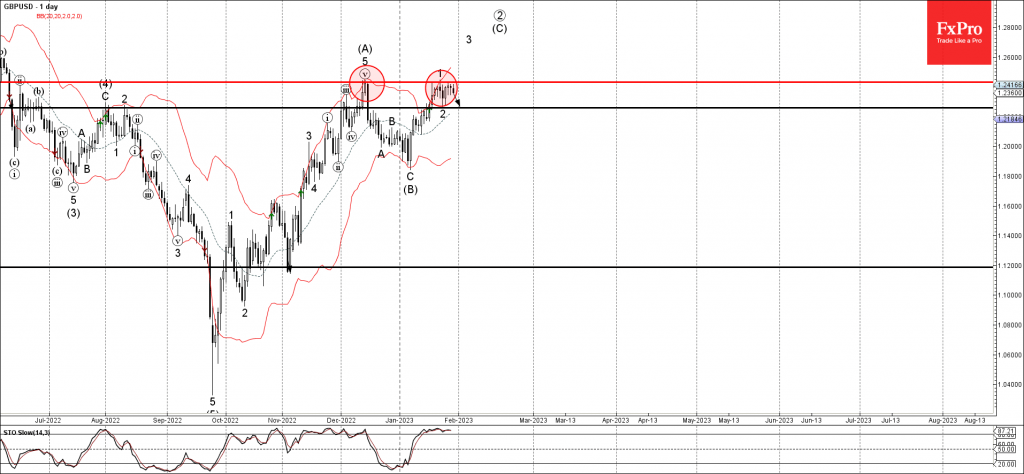
GBPUSD Wave Analysis
- GBPUSD reversed from resistance level 1.2430
- Likely to fall to support level 1.2260
GBPUSD currency pair earlier reversed down from the key resistance level 1.2430 (which stopped the previous intermediate impulse wave (A) at the start of December).
The downward reversal from the resistance level 1.2430 stopped the earlier short-term impulse wave 3 of the impulse wave (C) from January.
Given the overbought daily Stochastic, GBPUSD can be expected to fall further toward the next support level 1.2260 (low of the previous correction 2).
Dollar is Poised for a Run
This week has all the makings of being vital for the coming weeks and months, with the most important publications for the market in focus.
The week’s main event will undoubtedly be the Fed’s interest rate decision. More specifically, the comments on the decision and the press conference will follow, where investors and traders will look for answers on when the Fed will stop raising rates. In addition, the ECB and the Bank of England will present their rate decisions, setting the overall agenda for the major central banks. Typically, the other central banks are moving in the same direction, albeit with some deviations.
On the economic data front, the most important releases will be the eurozone inflation figures for January and the US employment figures, which have often set the tone in the past.
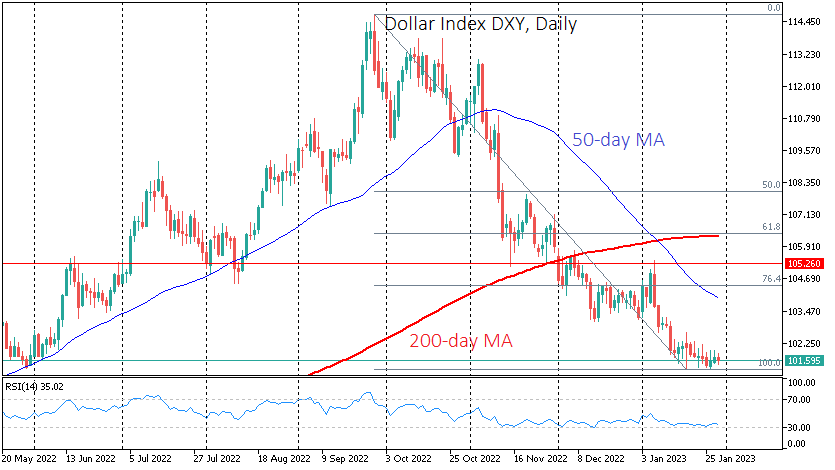
As is often the case, the market moved to key levels just before important events. The dollar index fell to 101.60. The local correction in May also ended near the same level. But more importantly, this is the multi-year “ceiling” area in the dollar from which the DXY turned lower in 2017 and 2020.
Earlier last year, the opportunity to rewrite multi-year highs was provided by the Fed’s decisive moves, which hiked three times by 75 points each, something not seen in over twenty years. It will probably take an equally fundamental change in Fed policy to change the market’s mode.
As we enter the fourth month of an active dollar sell-off, the market has accumulated fatigue with the trade. This is reflected in the sideways movement of the index over the past two weeks. The lull also sets the stage for a corrective pullback of 3-4%, allowing participants to take medium-term profits and rebalance portfolios.
The potential correction could take the Dollar Index to 104.5, the level at the start of the year and the 76.4% Fibonacci recovery line from the decline from the September high of 114.73 to the January low of 101.26.
However, there is reason to believe that the recovery in the Dollar Index will be more significant, taking it back to the 106.30 area, which is the 61.8% retracement level from that decline and the 200-day moving average.
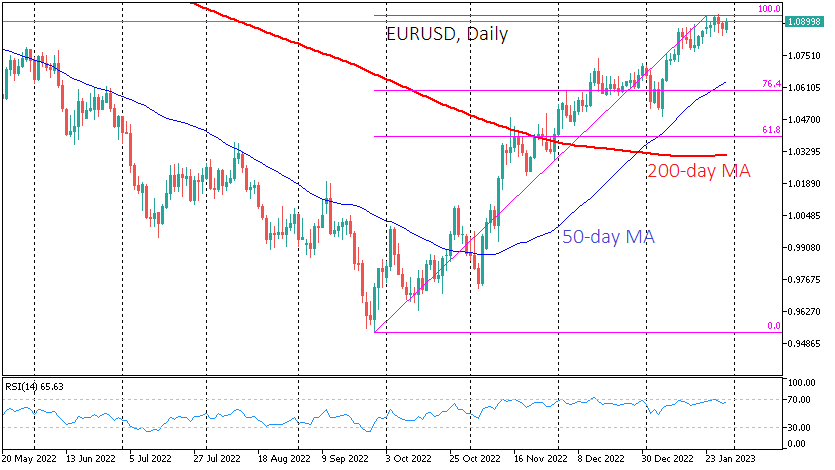
In terms of the major pairs, a potential dollar correction pullback would take EURUSD from the current 1.09 to 1.06 in a shallow correction and 1.04 if the Fed forces the market to revise its monetary policy expectations. The GBPUSD could then fall to 1.1900 and 1.1630, respectively. Gold, which the dollar has primarily driven over the last quarter, could fall to around $1870 in the event of a recovery in the dollar and as low as $1820 in a pessimistic scenario.
Sunset Market Commentary
Markets
Spanish inflation served as an eyeopener this morning (details below). Price growth unexpectedly accelerated to 5.8% in January, missing the consensus by a full percentage point. It’s a reminder that we, the ECB or anyone else shouldn’t take easing headline inflation for granted. Core inflation also shot up to 7.5%, highlighting the persistence of soaring prices. Yields on the European continent jumped immediately and maintained most of this gain for the remainder of the day. German rates add between 5.2 and 7.2 bps in an inversion deepener. US rates followed the European course by rallying 1.7-5.5 bps across the curve. ECB rate hike bets rose with money markets now closer in pricing a 3.5% terminal rather than 3.25%. European swap yields advance 5.3 to 6.8 bps, the belly underperforms. Germany, and therefore the eurozone (data due tomorrow), still risks being in a recession with GDP Q4 growth coming in at -0.2% q/q (1.1% y/y) instead of the expected stagnation. But that’s merely a technical and almost irrelevant discussion. Europe’s economic future looks brighter than a few months ago, and to that extent it doesn’t really matter whether the bloc is currently either experiencing or narrowly avoiding a very mild recession. Increased optimism is becoming more apparent in some (soft) indicators, such as the EC’s ESI published today. Economic sentiment continues to bottom out in January, rising to 99.9 (97.0 expected) and up from an upwardly revised 97.1. On a sector basis, optimists in the industry for the first time since September outnumbered the pessimists (1.3). The services sector series (10.7) is nearing the levels seen last summer.
The euro welcomed the additional interest rate support, but the fragile equity risk sentiment caps gains vs the likes of the dollar. EUR/USD went for the 1.09 big figure in a brisk move higher but pared gains afterwards. It is currently trading just south of that level. Since mid-January, EUR/USD is trending sideways. It’ll take the Fed and ECB to decide over its next directional move. That may also be the case for EUR/GPB (0.879). Sterling has been flipflopping around 0.88 in a two big figure range for all of 2023 so far. The Bank of England meets this Thursday. Moves in other currencies are fairly limited. The SEK underperforms peers following an unexpected growth contraction in Q4 (-0.6% q/q vs +0.2% consensus). EUR/SEK (11.28) rises towards the current 2023/multiyear highs. There are some spillovers to the Norwegian krone as well (EUR/NOK 10.81) with a 1.5% drop in oil prices weighing down on the currency too.
News & Views
Belgian inflation increased marginally in January (0.09% M/M) with the headline figure falling from 10.35% Y/Y to 8.05% Y/Y. The big drop is almost solely related to lower energy and natural gas prices which showed a sharp increase in January 2022 and on top a monthly decrease compared to December. Core inflation, which does not take into account price evolutions of energy products and unprocessed food, stands at 8.05% Y/Y in January, up from 7.34% Y/Y in December. Inflation for services has increased to 6.56% Y/Y up from 5.8% Y/Y. Inflation for rents has risen from 4.98% Y/Y to 5.93% Y/Y. Food inflation (including alcoholic beverages) now stands at 15.59% Y/Y compared to 14.53% Y/Y last month. Spanish inflation fell less than expected (-0.5% M/M vs -1.9% M/M) with the Y/Y-gauge unexpectedly ending a 5-month decline (5.8% Y/Y from 5.5% Y/Y). Spanish core inflation rose to a fresh record high of 7.5% Y/Y. Few details are published, but the statistics agency suggests that it was driven by fuel costs (end of subsidy) and by a smaller drop than usual in clothing prices.
The Financial Times reports that the EU is preparing to loosen the rules to support investment into new production facilities in green sectors (including via the creation of tax benefits) in response to the US’s $369bn Inflation Reduction Act. A temporary crisis and transition framework would allow greater aid for more mature technologies and renewable energies (beyond the EU’s current renewable energy laws) to include green hydrogen and biofuels. Brussels also intends to simplify and accelerate approvals for projects of common European interest and will set overall targets for green industrial capacity by 2030. It would also increase the threshold above which the Commission scrutinizes deals under its state aid “block exemption” regime, making it easier for governments to subsidize hydrogen, carbon capture, zero-emission vehicles and energy efficiency measures.
Dollar Index: Dollar in Defensive Mode Ahead of Key Central Bank Policy Meetings
The dollar index turned to red on Monday but remains within a narrow multi-day range, as traders stand aside, awaiting policy decisions from the US Federal Reserve, European Central Bank and the Bank of England.
The US policymakers are widely expected to further slow pace of policy tightening and hike interest rate by 25 basis points at the end of two-day policy meeting on Feb 1, while the other two central banks are likely to opt for 0.5% rate increase each, in the meetings on Thursday.
The dollar remains under strong pressure, holding in a steep fall for four straight months, deflated by dovish turn from Fed, as US inflation decreased in past few months and recent economic data showed that the US economy is performing well so far that boosted risk sentiment.
Analysts support the view of dollar’s further weakening, as the Fed is exiting its cycle of aggressive rate hikes (though the policymakers highlighted the need of further hikes and above initially estimated peak, due to expectations that inflation will remain elevated for some time), while the ECB and BOE are expected to keep hawkish stance, due to more difficult condition of their economies.
Diverging stances and converging interest rate values would add to demand for riskier assets and keep the dollar in defensive.
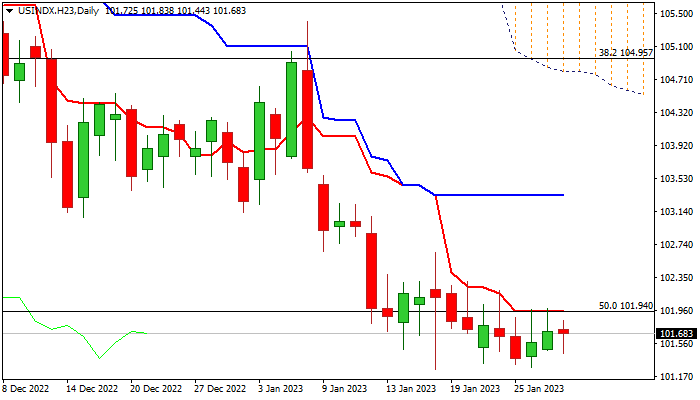
Technical picture remains firmly bearish on daily chart, with initial resistance provided by daily Tenkan-sen (101.94) which recently capped several attacks, followed by daily Kijun-sen (103.32), which should cap extended upticks and keep bears intact.
Res: 101.94; 102.64; 103.32; 104.05.
Sup: 100.52; 100.25; 100.00; 98.92.
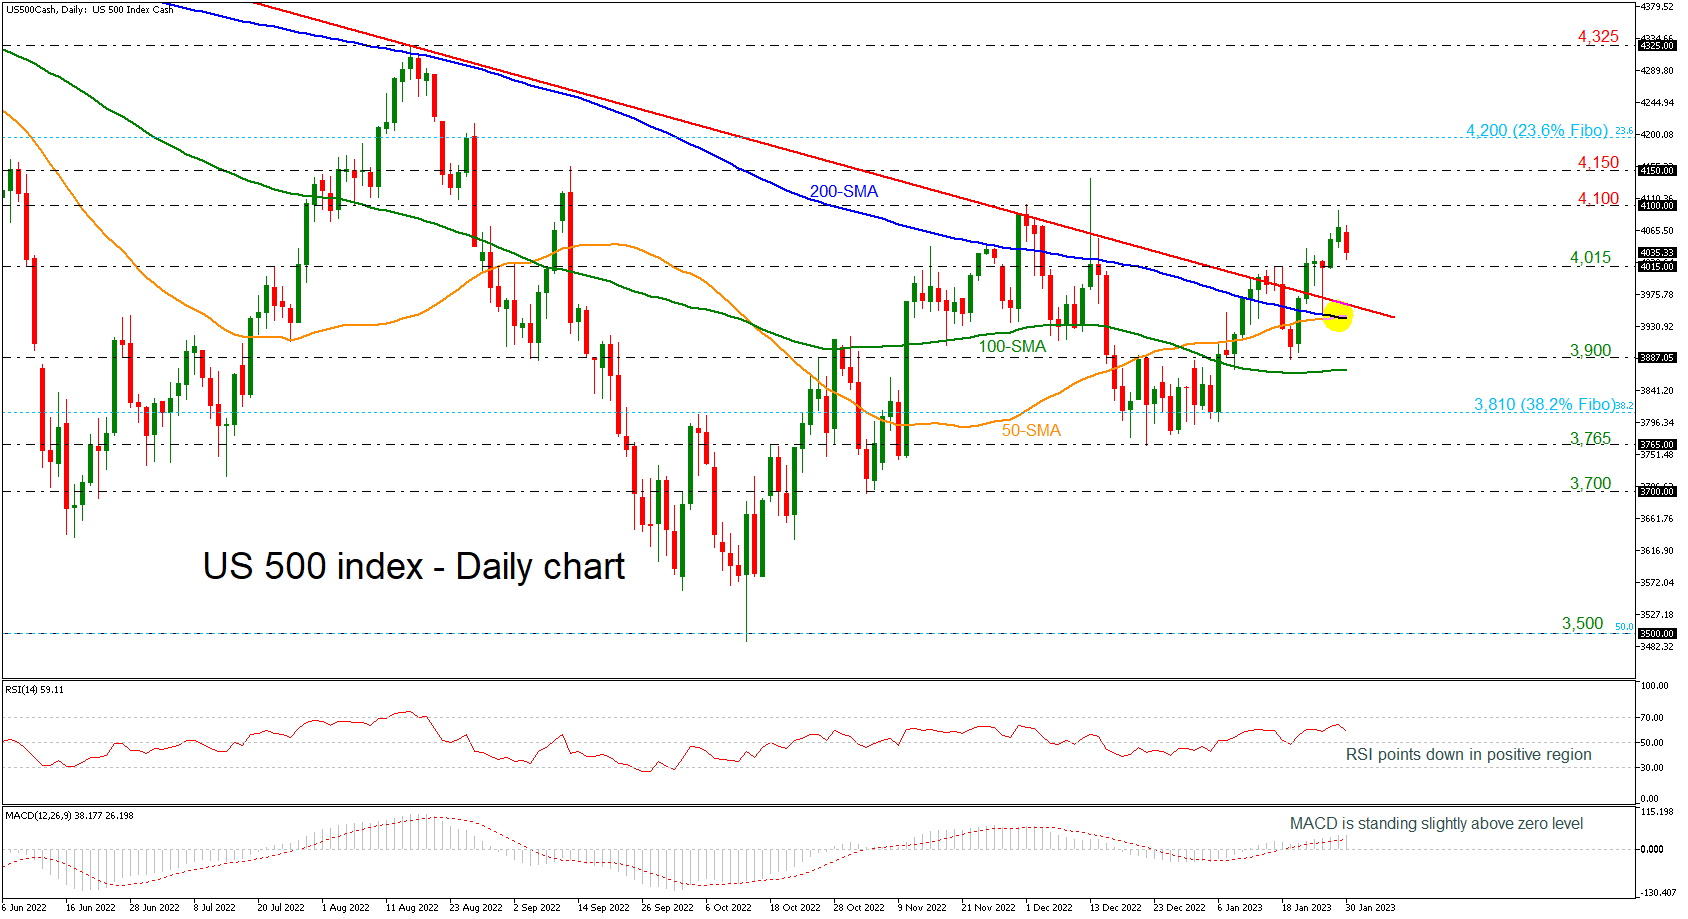
US 500 Stock: Will Golden Cross of SMAs Prove to be a Bullish Sign?
The US 500 stock index is retreating after the successful rally above the long-term downtrend line and the 4,000 round number. Also, the 50- and the 200-day simple moving averages (SMAs) posted a golden cross, but the momentum is weakening as both are moving sideways. The RSI is pointing down in the bullish region; however, the MACD is strengthening its momentum above its trigger and zero lines.
Should the pair manage to strengthen its positive momentum, the next resistance could come around 4,100. A break higher would shift the bias to a more bullish one and open the way towards the 4,150 level and the 23.6% Fibonacci retracement mark of the up leg from 2,180 to 4,810 at 4,200.
However, if prices are unable to break higher, the risk would shift back to the downside, with the 4,015 support and the descending trend line near 3,970 coming into focus. The next key support levels to watch lower down are the 50- and the 200-day SMAs at 3,940 and the 3,900 figure.
In the medium-term, the outlook shifted to positive since prices were above all the moving average lines but any moves beneath the downtrend line would change the bias back to bearish again.
Japanese Yen Remains Calm
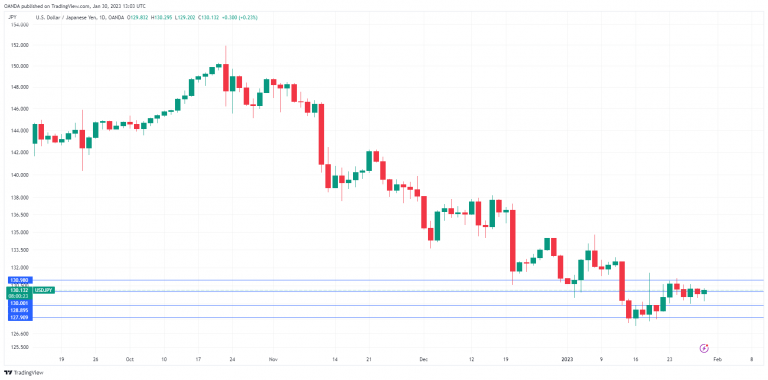
The Japanese yen had an uneventful week and edged higher on Monday. USD/JPY is trading at 130.06 in the European session, up 0.18%.
US PCE slows to 4.4%
Last week wrapped up with Core PCE slowing to 4.4% in December, down from 4.7% a month earlier. However, the month-over-month reading showed a gain of 0.3%, after three straight declines. This means that it’s still too early to assume that inflation has peaked, and the annualized reading indicates that inflation is more than double the Fed’s target of 2%. The takeaway from this is that the Fed will likely remain aggressive with its rate policy even though there are clear signs that the economy is slowing down.
The Fed holds its policy meeting on Tuesday and Wednesday, with a 25-bp increase a virtual certainty. The Fed is still hoping it can pull off a soft landing, thanks to slowing inflation and a better economic outlook – GDP expanded by 2.9%, stronger than the 2.6% forecast. The markets are of the view that the Fed will cut rates late in the year, but the Fed hasn’t given any such indication, and Fed Chair Powell has said that the markets are underestimating Fed policy. It will be interesting to see how the dollar reacts after the meeting.
In Japan, inflation indicators have hit 41-year highs, adding pressure on the BoJ to exit its stimulus programme. The BoJ insists that inflation will peak at 3% in March. but this view seems over-optimistic, given the trend we’re seeing from inflation data. BoJ Governor Kuroda has said he will maintain the Bank’s ultra-loose policy until wages increase, which would indicate that inflation is driven by domestic demand rather than cost-push factors. Kuroda winds up his term in April, and the burning question is whether the new governor will tighten policy, which would likely strengthen the yen.
USD/JPY Technical
- 129.46 is a weak support level. The next support line is 128.40
- There is resistance at 130.89 and 131.69