Sample Category Title
NQ_F: Forecasting Elliott Wave ((iii)) Higher In NASDAQ Futures
Hello Traders, in this blog we will see how we were able to forecast in advance the wave ((iii)) higher in NQ_F. Nasdaq has been one of the weakest Indices within 2022 and has been seeing a relief bounce rally as of recent. We will see below how here at Elliott Wave Forecast were able to forecast in advance the upcoming wave ((iii)) of C in NQ_F.
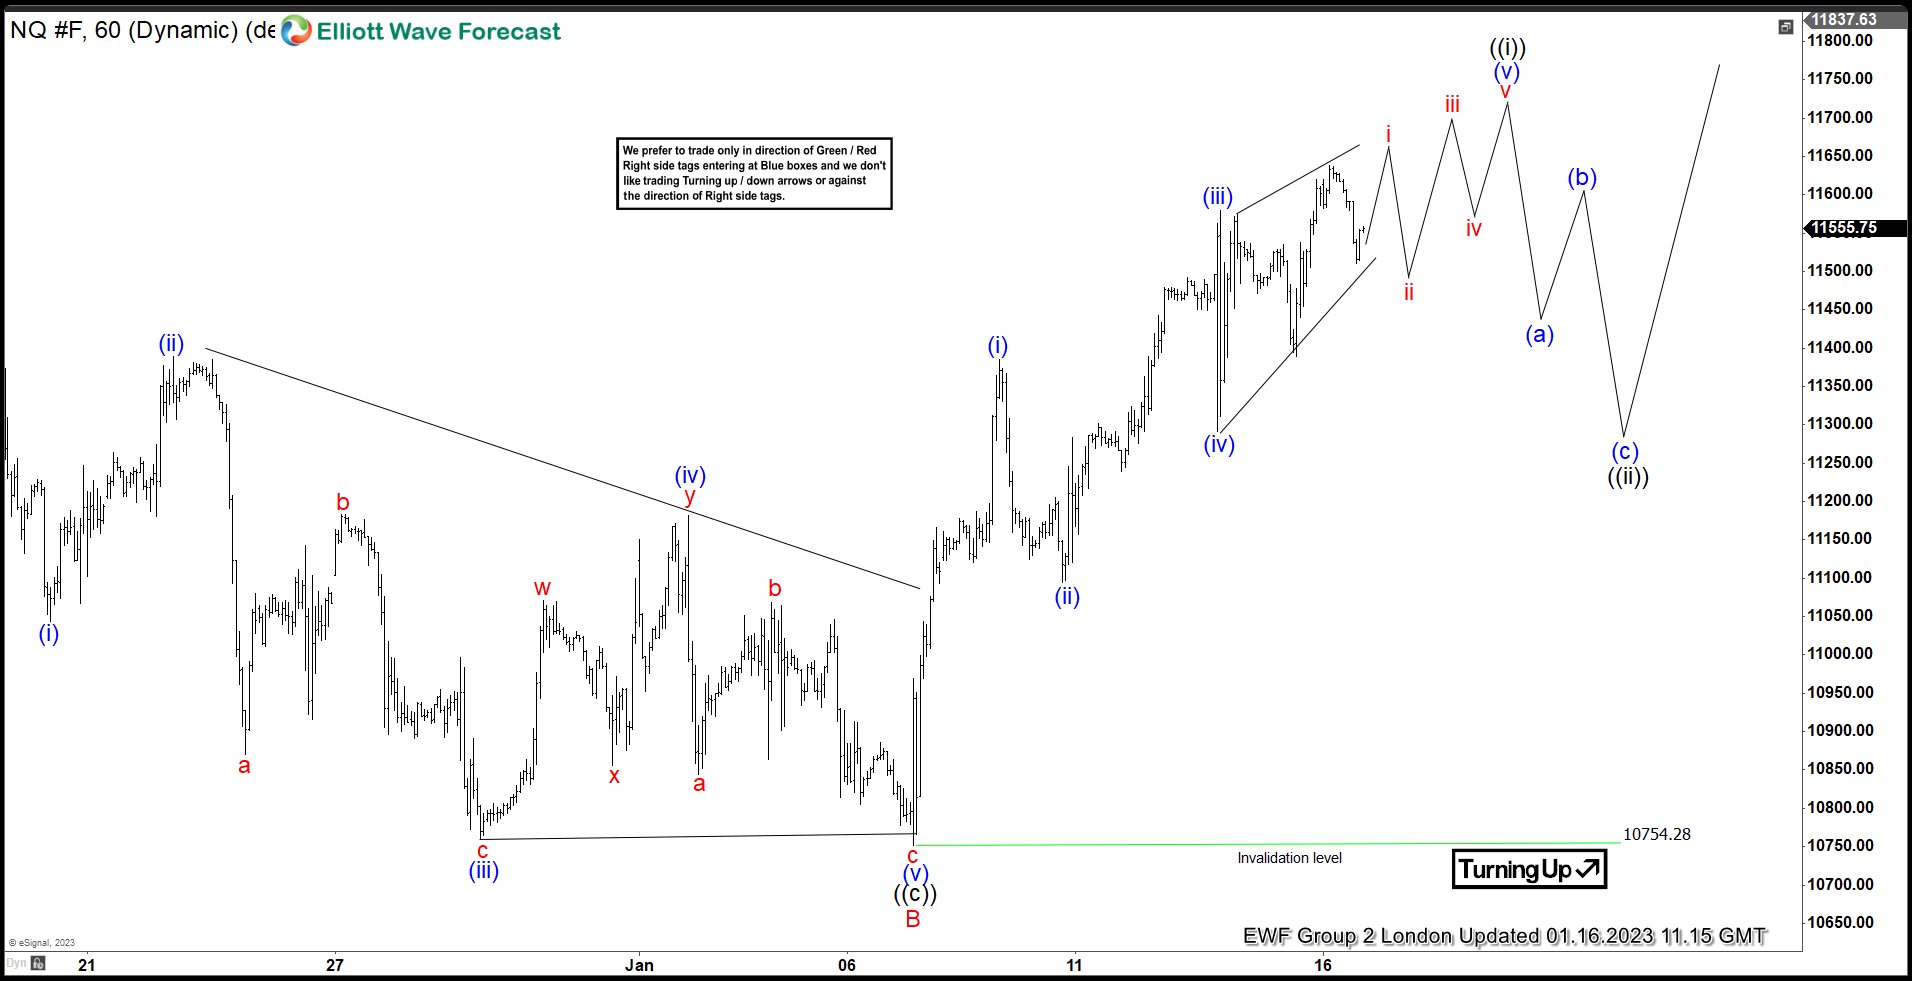
Let have a look on how we saw Nasdaq during 01.16.23. It had ended B leg at 10754.28 and since then has been showing 5 waves off these lows. Thus confirming C leg in progress. In the 1 hour cycle it is within wave i of (v) of ((i)).
NQ_F Short-term Elliott Wave Analysis 1.16.2023
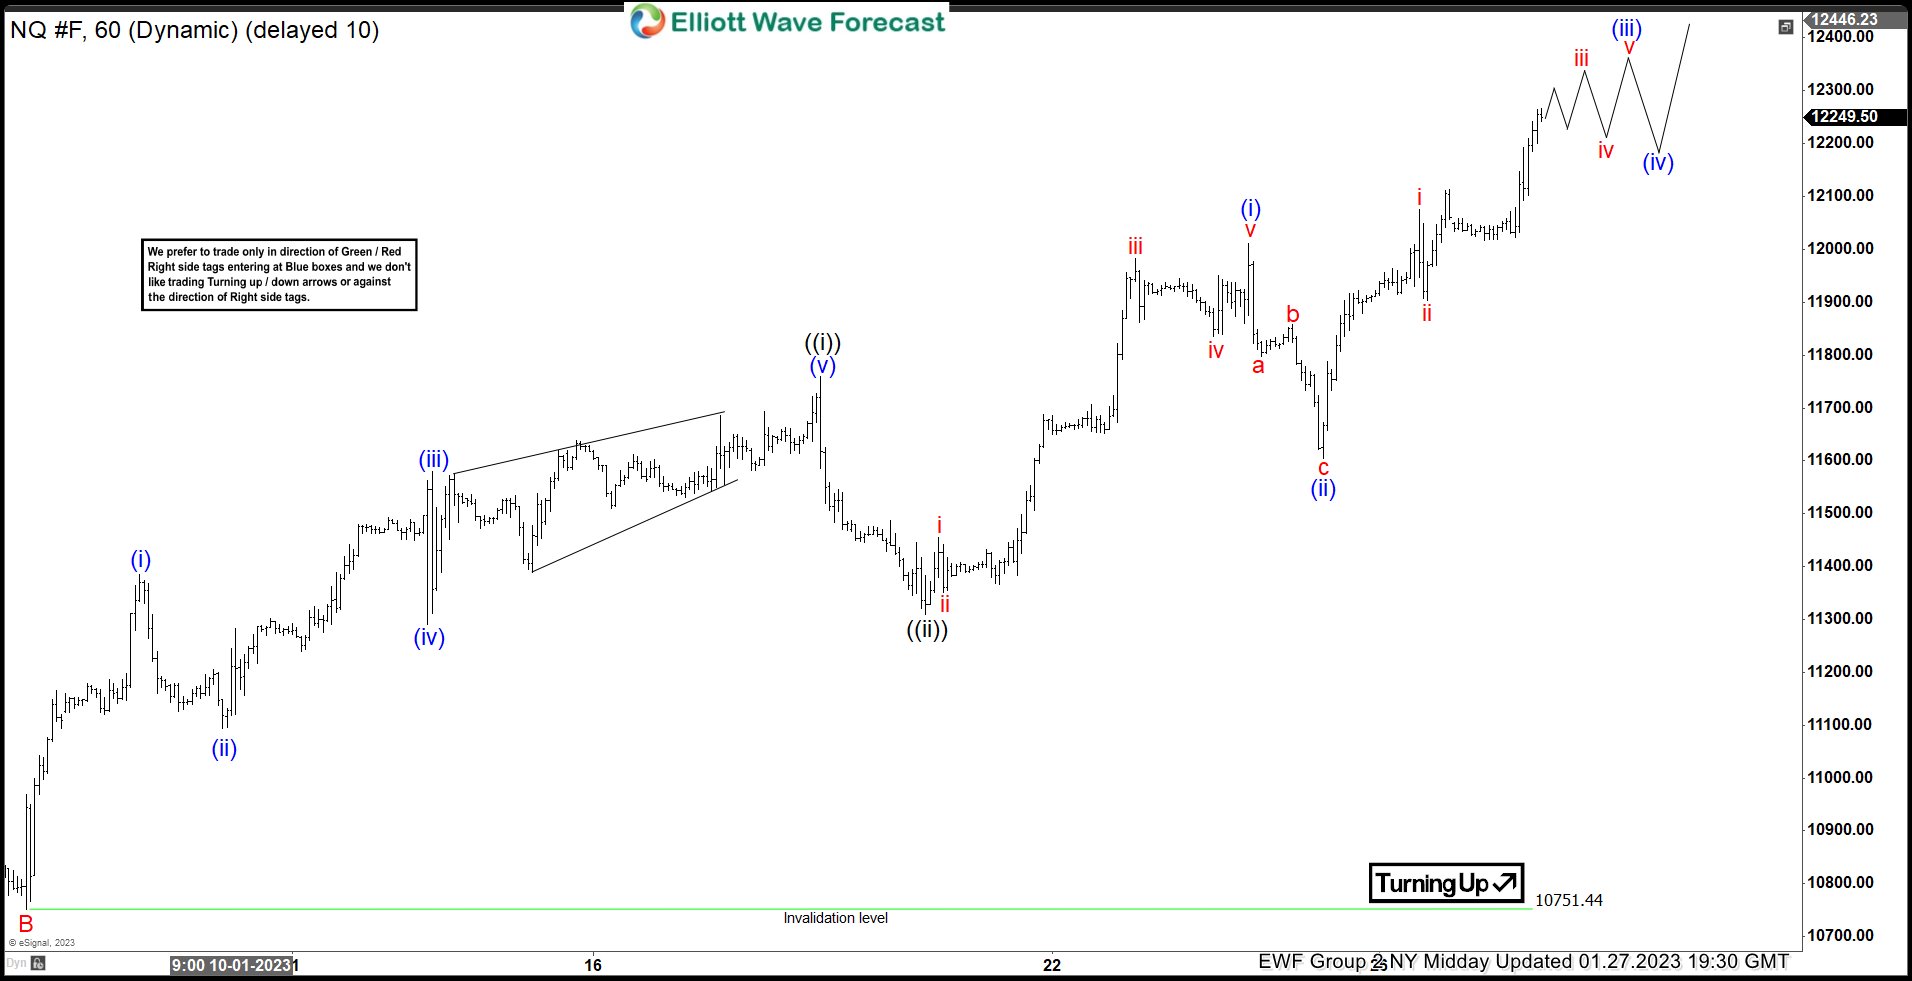
Now let’s check out our latest chart from 01.27.23. As seen it is within wave iii of (iii) of ((iii)). As we can see Nasdaq completed the pullback in wave ((ii)) and accelerated higher in wave ((iii)). With wave (i) and (ii) completed now it is trading within iii of (iii) of ((iii)). Near term, after it ends (iii) and pullback in (iv) it is expected higher in (v) of ((iii)).
NQ_F Short-term Elliott Wave Analysis 1.27.2023
Learn more about NQ_F in near term and longer term cycles by becoming a member. Here at Elliott Wave Forecast we provide analysis of 78 instruments in which you get 4 daily updates. Asian, London, New York and NY Midday. Once a day you get a 4 hour update and once a week Daily and Weekly charts update. In addition you get the chance to attend or watch the recording of our Analysis Session and Live Trading Room. Learn how to trade the right side and learn how we analyze and see the market.
Aussie Slides on Soft Retail Sales
It has been a rough start to the week for the Australian dollar. AUD/USD has dropped 0.68% on Tuesday and is down 1.36% on the week. In the European session, the Australian dollar is trading just above the 0.70 line.
Australia’s retail sales sink
Retail sales for December were dismal, with a reading of -3.9% m/m, compared to the consensus of -0.3%. This was down from the 1.7% gain in November and marks the third decline in four months. It was the first decline in 2022 and the Australian dollar has responded with sharp losses. The silver lining is that retail sales are traditionally weak in December and the strong November read was a sign that consumers did their Christmas shopping early in order to take advantage of Black Friday discounts.
The sharp drop in consumer spending is another sign that cost of living pressures are taking a toll on consumers. Strong consumer spending has enabled the Reserve Bank of Australia to continue raising rates in order to tame inflation. The RBA will not be pleased with the latest retail sales data but it still expected to go ahead next week with a modest 25-basis point increase. The cash rate is currently at 3.10% and the markets are estimating that the peak rate will rise to somewhere between 3.6%-3.85%. This means that more hikes are on the way after February, but the pace of the rates will be data-dependent, especially on inflation reports.
The Federal Reserve concludes its 2-day meeting on Wednesday, and a 25-bp increase is priced at close to 100%. This doesn’t preclude volatility in the currency markets, as a hawkish stance from the Fed, either in the rate statement or in comments from Jerome Powell, could provide a boost to the US dollar. The markets continue to talk about a rate cut late in the year due to the weakening US economy, but the markets could be in for a nasty surprise if the Fed reiterates that high rates are here to stay and there are no plans to cut rates.
AUD/USD Technical
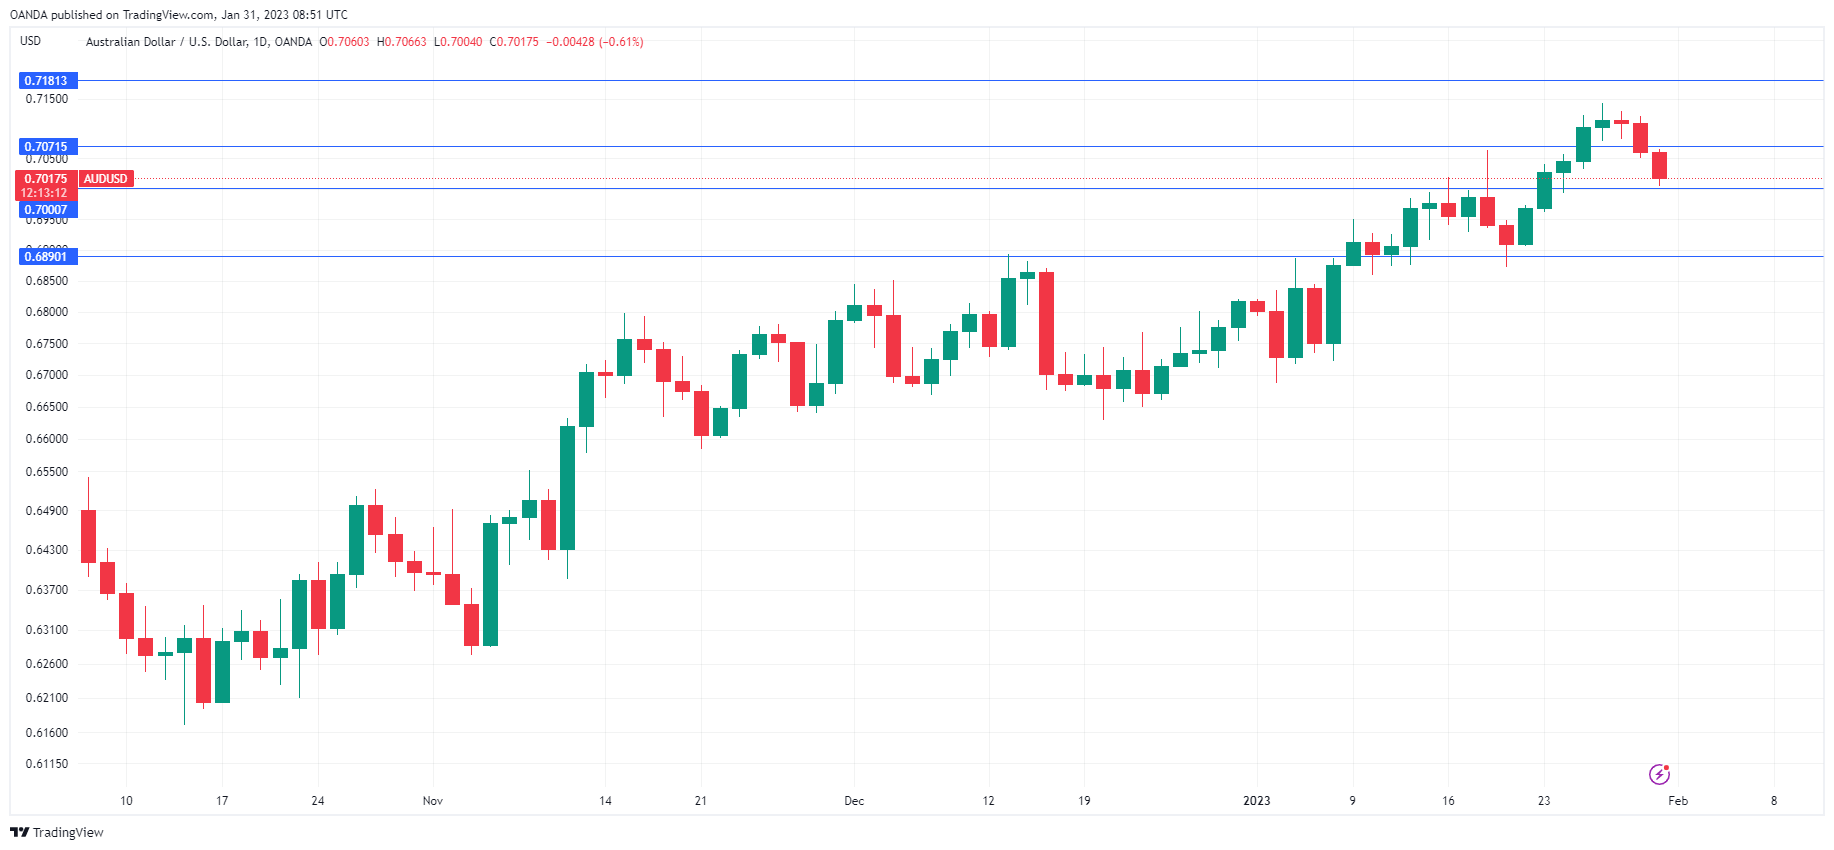
- AUD/USD is putting pressure on support at 0.7000. The next support line is 0.6890
- 0.7071 and 0.7181 are the next resistance lines
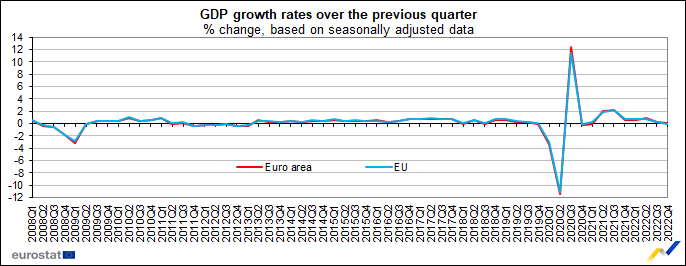
Eurozone GDP grew 0.1% qoq, 1.9% yoy in Q4,
Eurozone GDP grew 0.1% qoq in Q4, better than expectation of -0.2% qoq. Comparing to the same quarter a year ago, GDP rose 1.9% yoy. EU GDP was flat qoq in Q4, up 1.8% yoy. Annual growth in 2022 was 3.5% in Eurozone and 3.6% in EU.
Among the Member States for which data are available for the fourth quarter of 2022, Ireland (+3.5%) recorded the highest increase compared to the previous quarter, followed by Latvia (+0.3%), Spain and Portugal (both +0.2%). The highest declines were recorded in Lithuania (-1.7%) as well as in Austria (-0.7%) and Sweden (-0.6%).
The year-on-year growth rates were positive for all countries except for Sweden (-0.6%) and Lithuania (-0.4%).
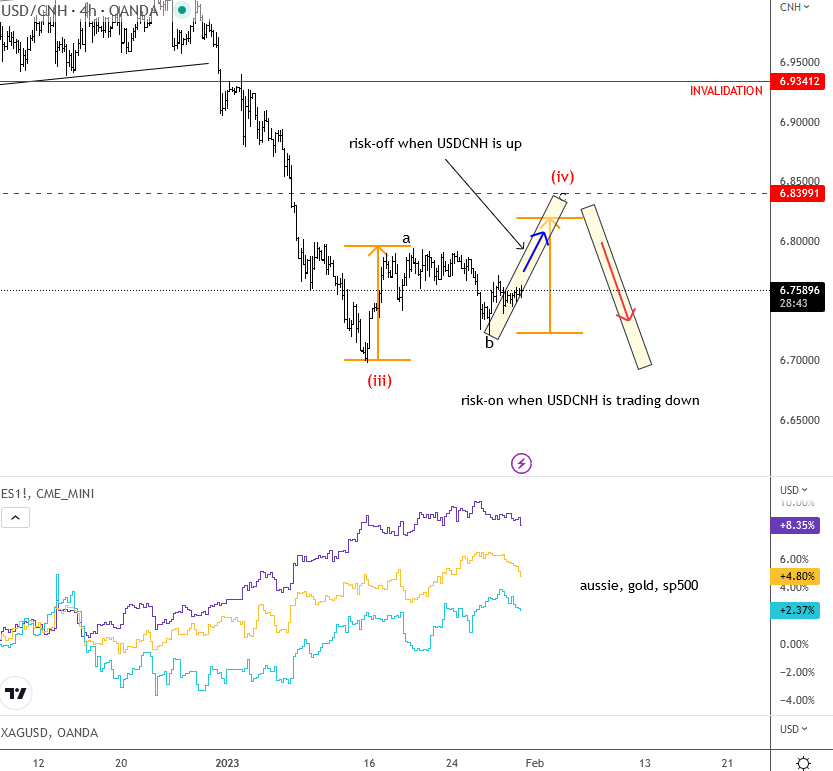
Deeper Corrective Recovery on USD/CNH Can Cause More Risk-off
USDCNH is usually a very good indicator for risk-on, risk-off flows because of China's link to the global economy. What we see on the pair below is an ongoing bearish trend that can resume after a wave four rally. Now, this wave 4 rally is still incomplete and can retest higher resistance, near 6.83. So for now there is room for some more risk-off and USD strength, while metals can see lower prices too untill wave c unfolds on USDCNH. However, risk-on can be mack when this wave four rally is finished.
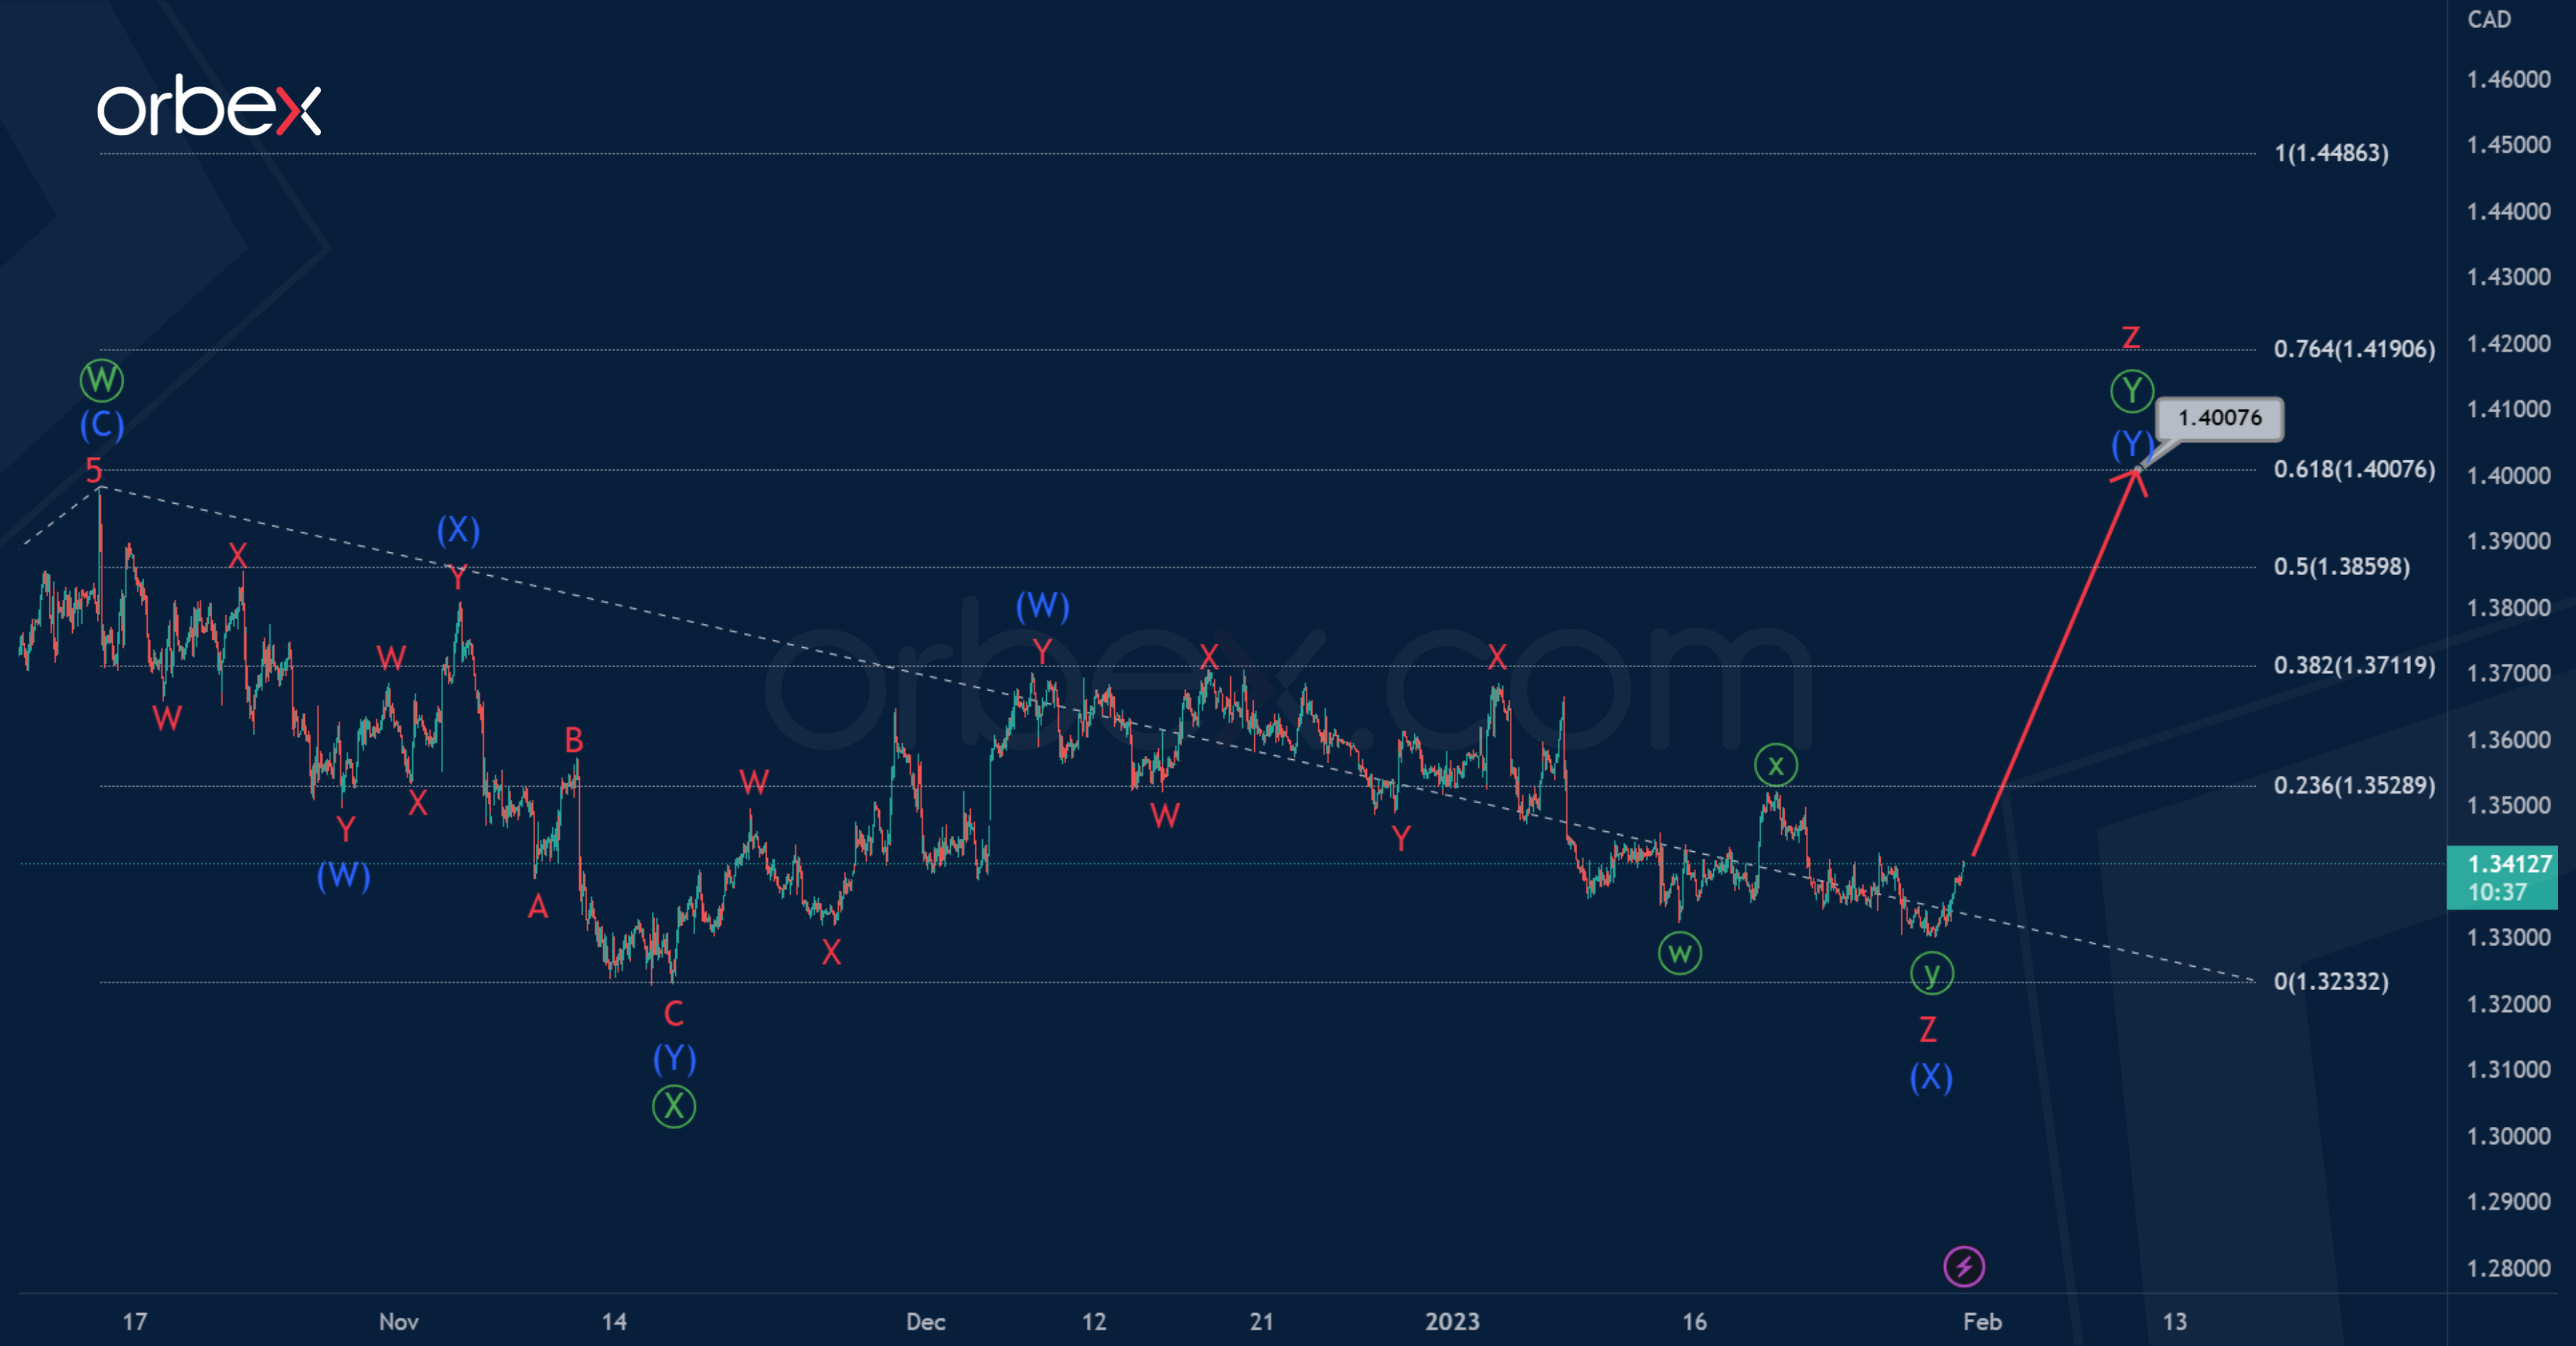
USD/CAD: Final Part of the Triple Zigzag Begins
Just like a few weeks ago, USDCAD is most likely forming a correction pattern – a triple zigzag consisting of cycle waves w-x-y-x-z.
The first four sub-waves w-x-y-x are fully completed, and the final actionary leg, the sub-wave z, is being built. Apparently, the wave z takes the form of a primary double zigzag Ⓦ–Ⓧ-Ⓨ, where the sub-waves Ⓦ-Ⓧ are formed.
At the moment, the market may build the last wave Ⓨ.
It can end in the form of a double zigzag (W)-(X)-(Y) near 1.400. At that level, it will be at 61.8% of zigzag wave Ⓦ.
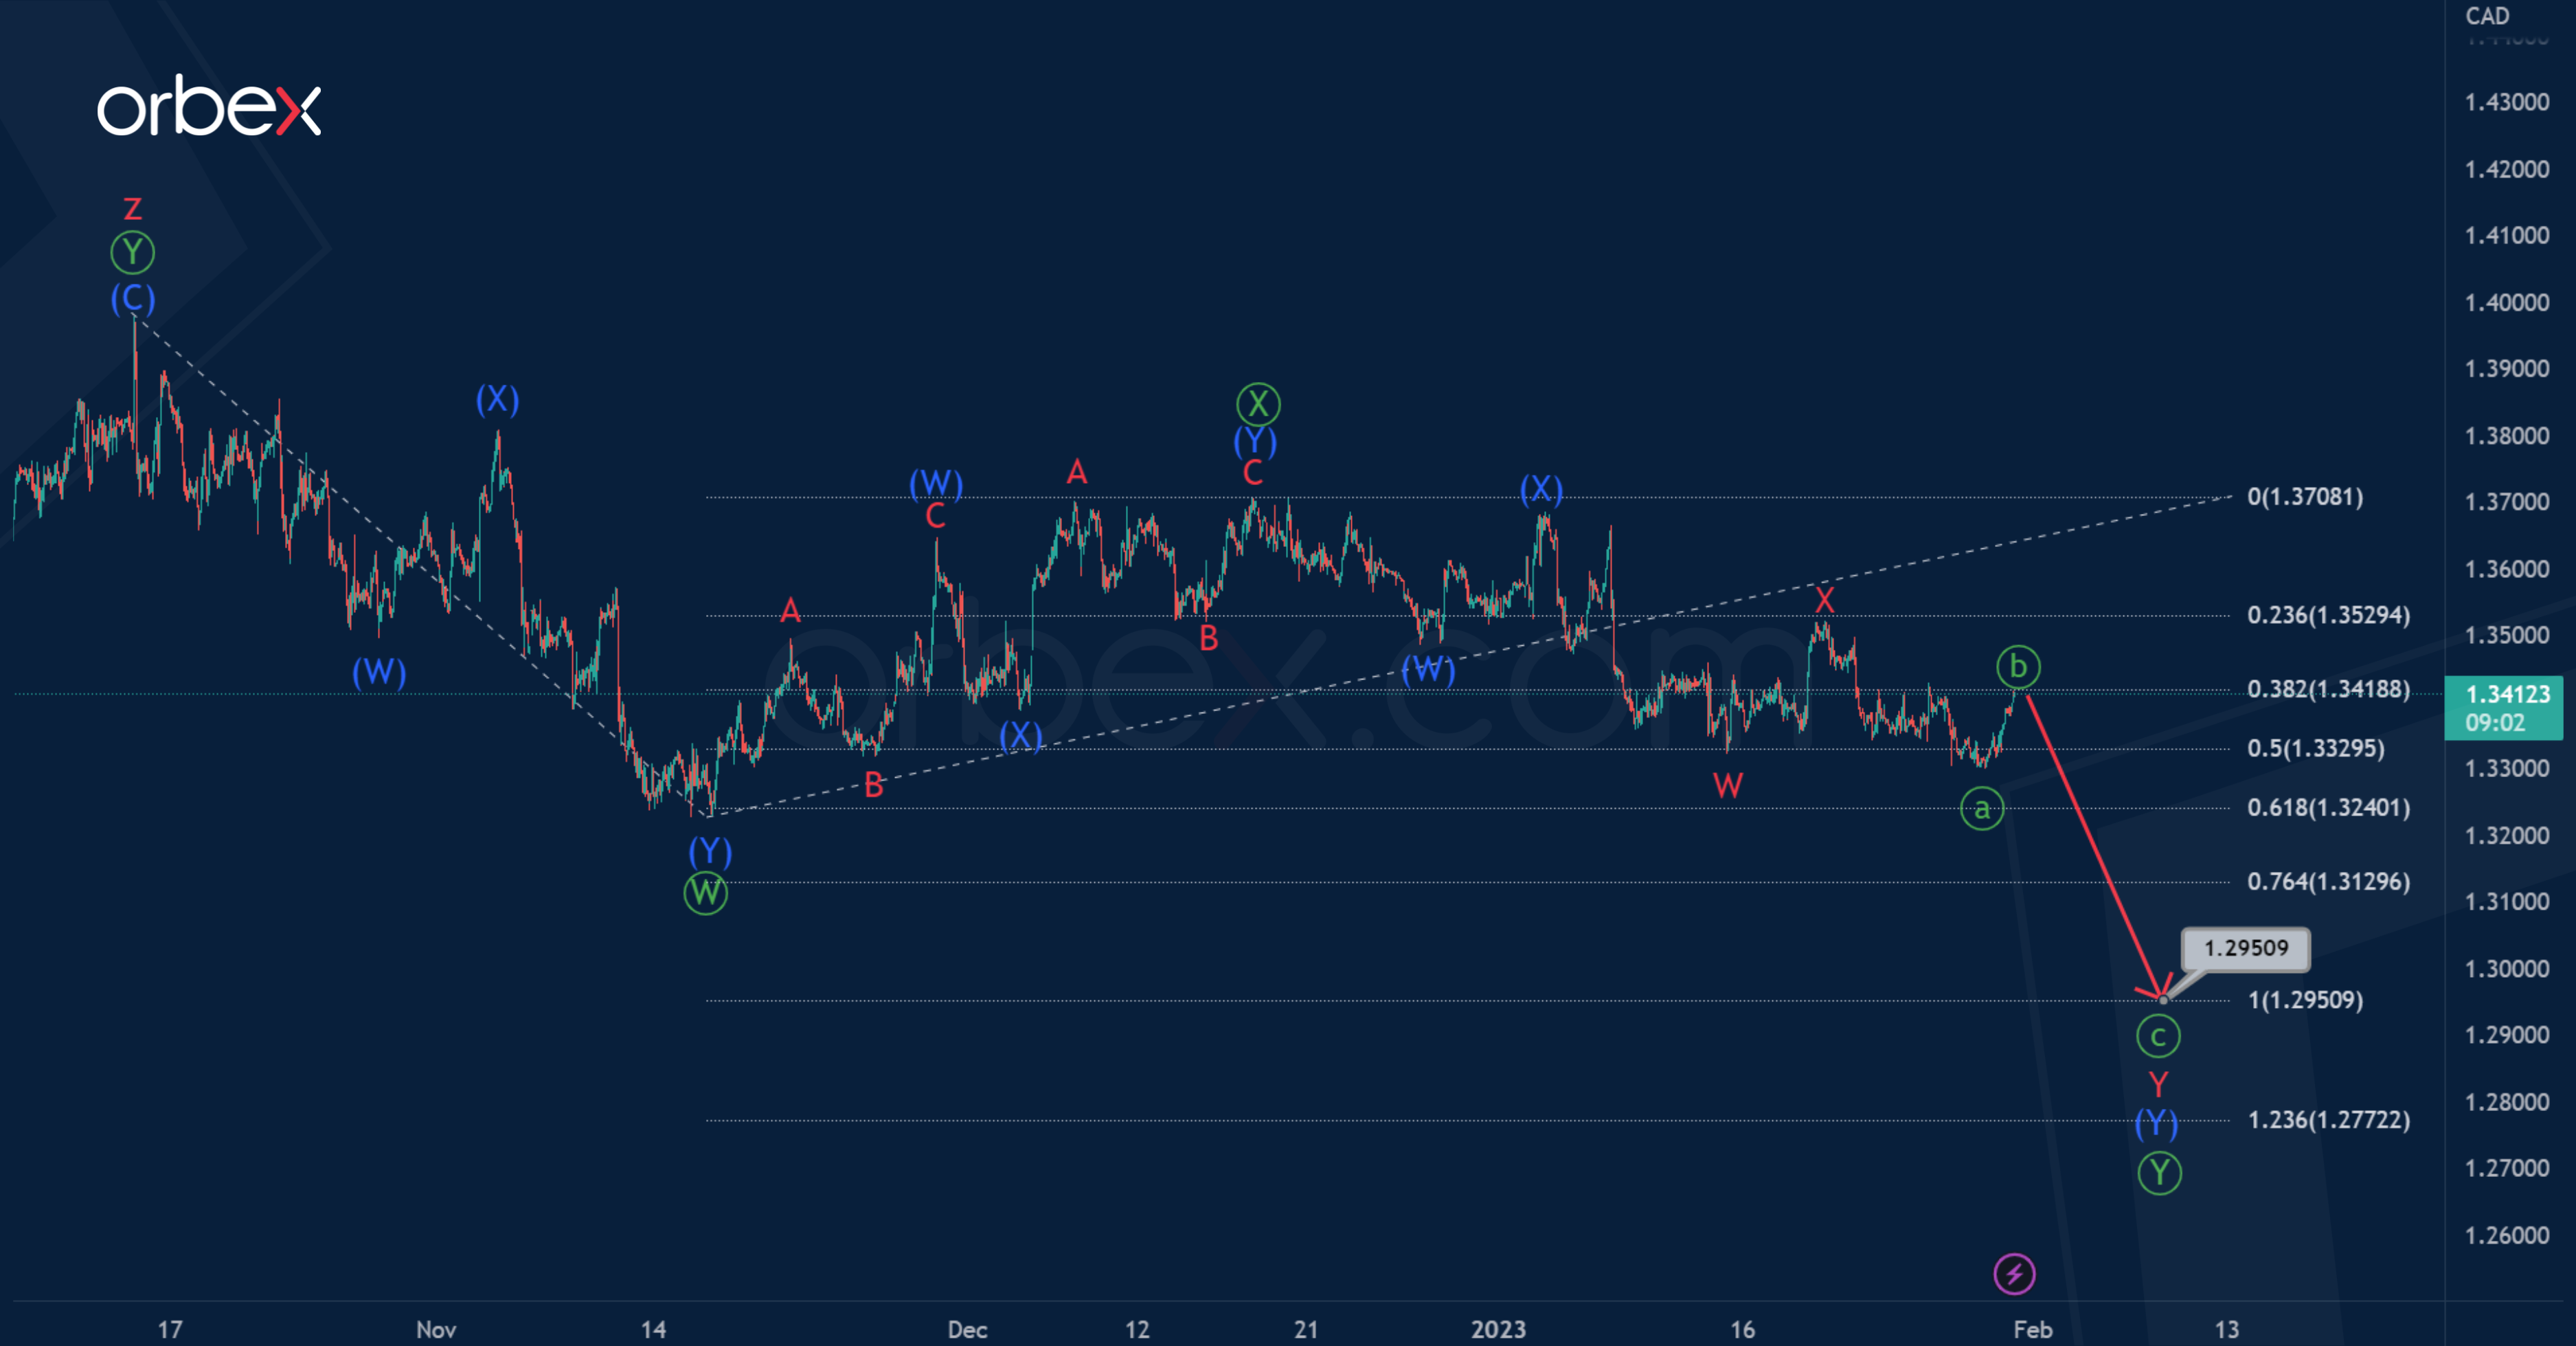
However, the formation of a cycle triple zigzag could be fully completed. Thus, let's consider the second scenario, where the initial part of a new bearish trend can now be built.
It is likely that there may be a construction of the primary double zigzag Ⓦ-Ⓧ-Ⓨ, which is the beginning in a larger correction pattern.
Primary waves Ⓦ-Ⓧ look fully completed.
In the near future, a continuation of the bearish primary wave Ⓨ is possible. It may take the form of a double zigzag (W)-(X)-(Y) and end near 1.295, where it will be equal to wave Ⓦ.
IMF expects inflation to fall in 2023/24, year head a turning point
In the new World Economic Outlook report, IMF said global inflation will fall in 2023 and 2024 amid supar economic growth.
Global growth is projected to fall from 3.4% in 2022 to 2.9% in 2023 (revised up by 0.2%), and then rise back to 3.1% in 2024. Global inflation is projected to fall from 8.8% in 2022 to 6.6% in 2023, and then 4.3% in 2024, staying above pre-pandmeic levels of about 3.5%.
"The year ahead will still be challenging... but it could well represent a turning point with growth bottoming out and inflation declining," IMF chief economist Pierre-Olivier Gourinchas told reporters.
"The fight against inflation is not yet won," Gourinchas warned. And it's "premature to put too much weight on that sort of benign scenario" where prices cool on their own.
GBP/JPY Daily Outlook
Daily Pivots: (S1) 160.41; (P) 160.91; (R1) 161.62; More…
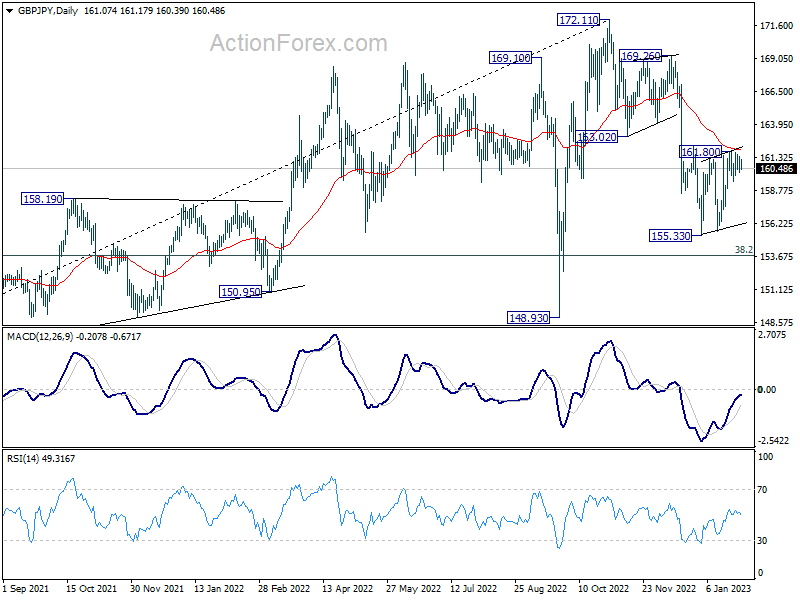
Range trading continues in GBP/JPY and intraday bias remains neutral. On the downside, break of 155.33 low will resume the fall form 172.11 to 153.70 fibonacci level next. Nevertheless, sustained trading above 55 day EMA (now at 161.89) will turn bias to the upside, for stronger rise back to 169.26/172.11 resistance zone.
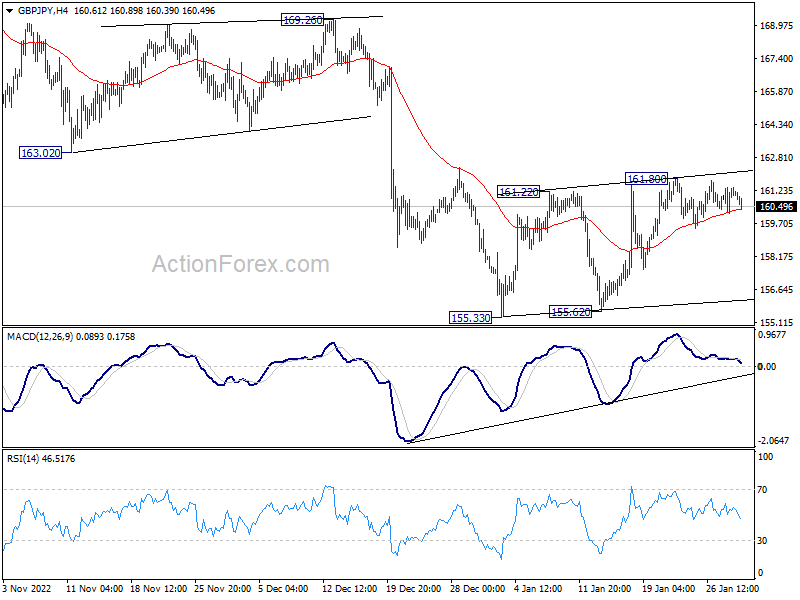
In the bigger picture, as long as 163.02 support turned resistance holds, decline from 172.11 medium term top is expected to continue to 38.2% retracement of 123.94 to 172.11 at 153.70. Sustained break there will raise the change of trend reversal and target 61.8% retracement at 142.34. Nevertheless, break of 163.02 support turned resistance will argue that the decline has completed, and retain medium term bullishness.
EUR/JPY Daily Outlook
Daily Pivots: (S1) 140.75; (P) 141.36; (R1) 142.17; More….
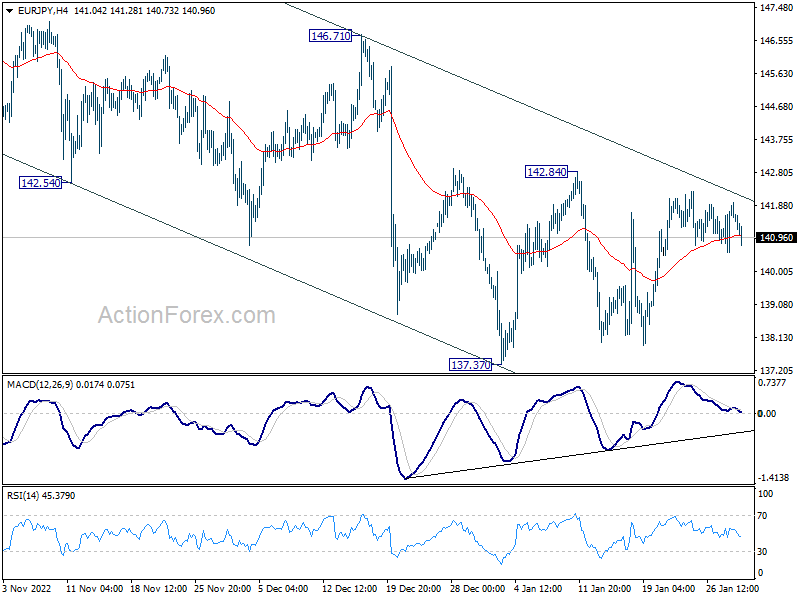
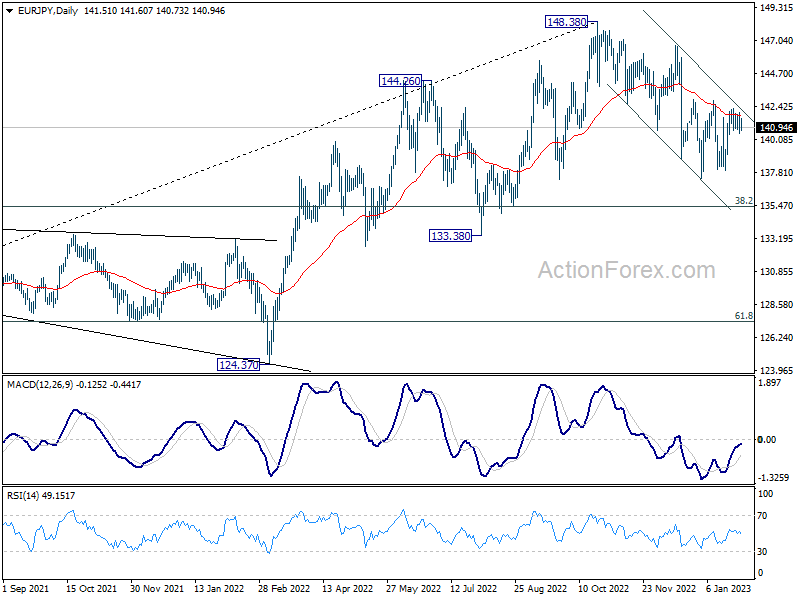
Intraday bias in EUR/JPY stays neutral as range trading continues. On the downside, break of 137.37 will resume the whole decline from 148.38 to 135.40 fibonacci level next. However, firm break of 142.84 will argue that the correction from 148.38 has completed, and bring stronger rise back to 146.71 resistance.
In the bigger picture, as long as 55 week EMA (now at 138.81) holds, larger up trend from 114.42 (2020 low) is still in progress for 149.76 long term resistance. However, firm break of 55 week EMA will bring deeper fall to 38.2% retracement of 114.42 to 148.38 at 135.40. Sustained break there will raise the chance of trend reversal, and target 61.8% retracement at 127.39.
EUR/GBP Daily Outlook
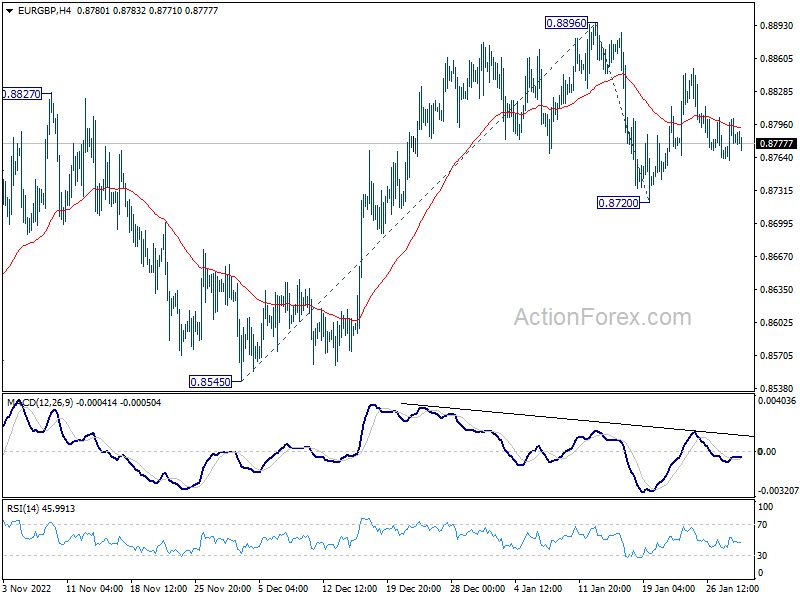
Daily Pivots: (S1) 0.8765; (P) 0.8784; (R1) 0.8805; More…
Range trading continues in EUR/GBP and intraday bias remains neutral at this point. On the upside, firm break of 0.8896 will resume the rise from 0.8545 and target 61.8% projection of 0.8545 to 0.8896 from 0.8720 at 0.8937. On the downside, break of 0.8720 will resume the fall from 0.8896 instead.
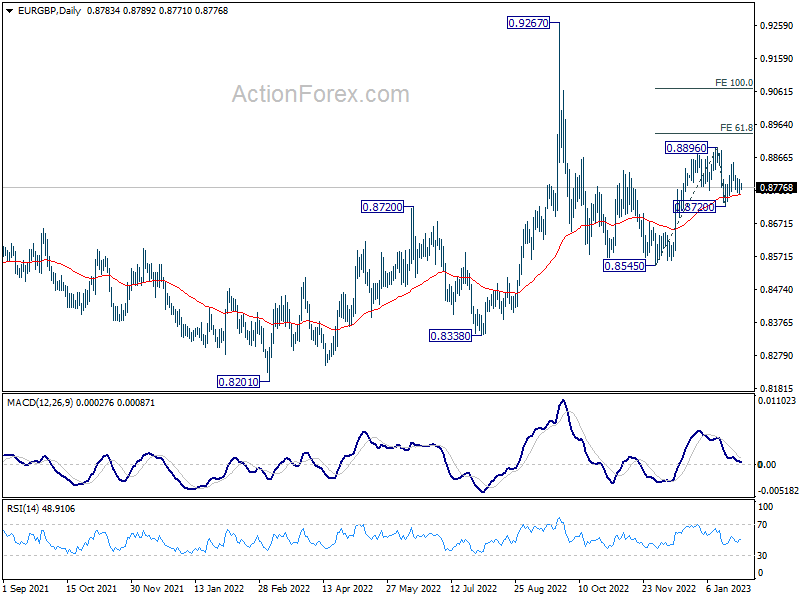
In the bigger picture, the notable support from 55 day EMA (now at 0.8752) retains near term bullishness. Break of 0.8896 should target 0.9267 (2022 high) and possibly above, to resume whole up trend from 0.8201 (2022 low). However, break of 0.8270 support and sustained trading below 55 day EMA will set the stage for 0.8545 and below.
EUR/AUD Daily Outlook
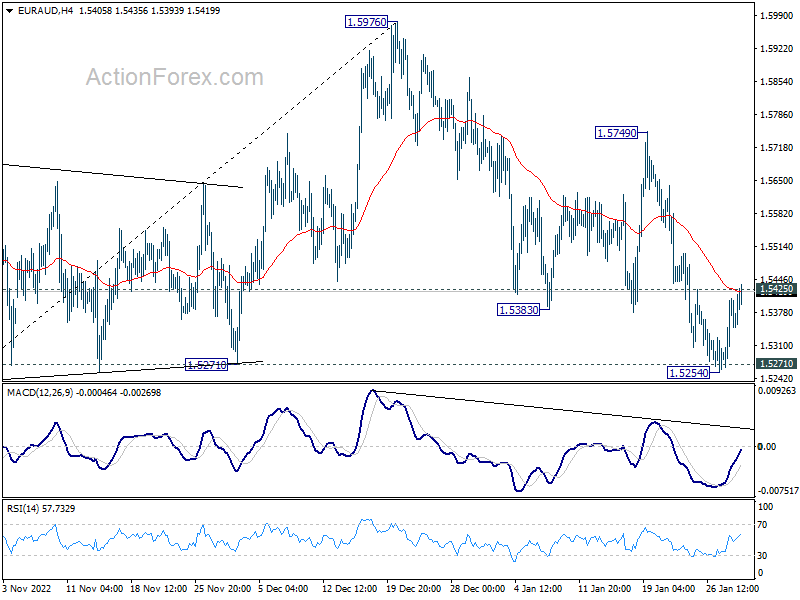
Daily Pivots: (S1) 1.5290; (P) 1.5349; (R1) 1.5431; More…
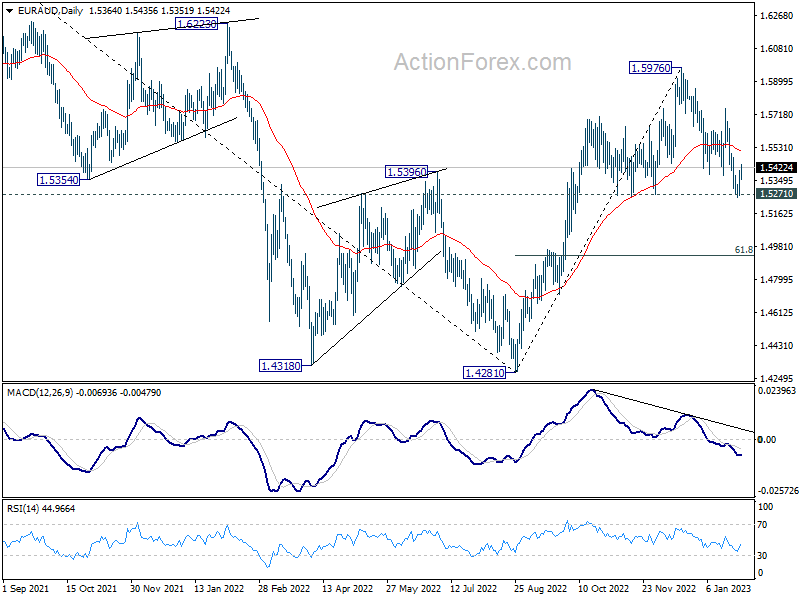
Immediate focus is now on 1.5425 minor resistance. Firm break there should confirm short term bottoming at 1.5254, after defending 1.5271 key support. Intraday bias will then be turned back to the upside for 55 day EMA (now at 1.5509) and above. On the downside, decisive break of 1.5271 will carry larger bearish implication and bring deeper fall to 61.8% retracement of 1.4281 to 1.5976 at 1.4928.
In the bigger picture, it's still early to confirm if rise from 1.4281 represents bullish trend reversal. But as long as 1.5271 support holds, such rally is in favor to continue. Break of 1.5976 will target 1.6434 key resistance next. On the other hand, firm break of 1.5271 will retain medium term bearishness instead.