Sample Category Title
USD/CHF Daily Outlook
Daily Pivots: (S1) 0.9112; (P) 0.9200; (R1) 0.9249; More…
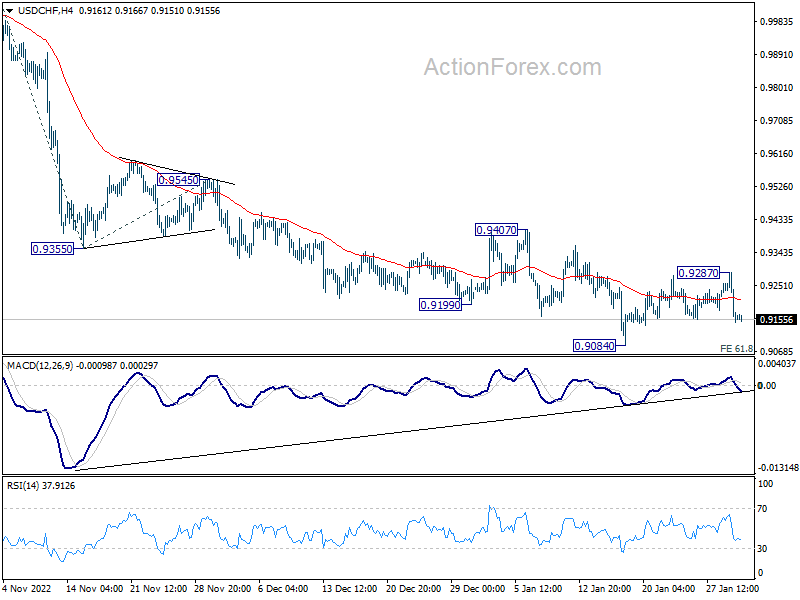
USD/CHF dropped notably after recovering to 0.9287, but stays above 0.9084 low. Intraday bias remains neutral for the moment. For now, outlook stays mildly bearish despite loss of downside momentum. On the downside, sustained break of 61.8% projection of 1.0146 to 0.9355 from 0.9545 at 0.9056 will pave the way to 100% projection at 0.8754, which is close to 0.8756 long term support. Nevertheless, on the upside, break of 0.9287 should confirm short term bottoming and turn bias back to the upside for 0.9407 resistance.
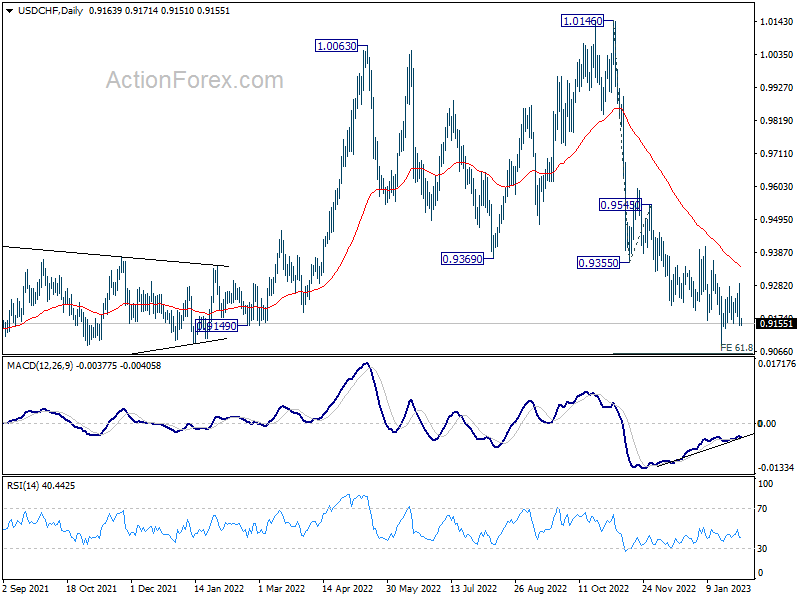
In the bigger picture, rise from 0.8756 (2021 low) has completed at 1.0146, well ahead of 1.0342 long term resistance (2016 high). Based on current downside momentum, fall from 1.0146 should be a medium term down trend itself. Next target is a test on 0.8756 low. Strong support should be seen there to bring rebound. Still, further decline will now be expected as long as 0.9407 resistance holds, in any case.
Sentiment Resilient, Dollar Mixed, Fed Hike Awaited
Dollar is trading in mixed manner as focuses turns to FOMC rate hike today. The recovery attempt in the greenback this week was rather disappointing. In particular, it has conceded much ground against commodity currencies and Swiss Franc. Overall, risk sentiment will likely continue to dictate the moves in the forex markets. Judging from the resilience in US stocks, risk is probably more on the downside for Dollar.
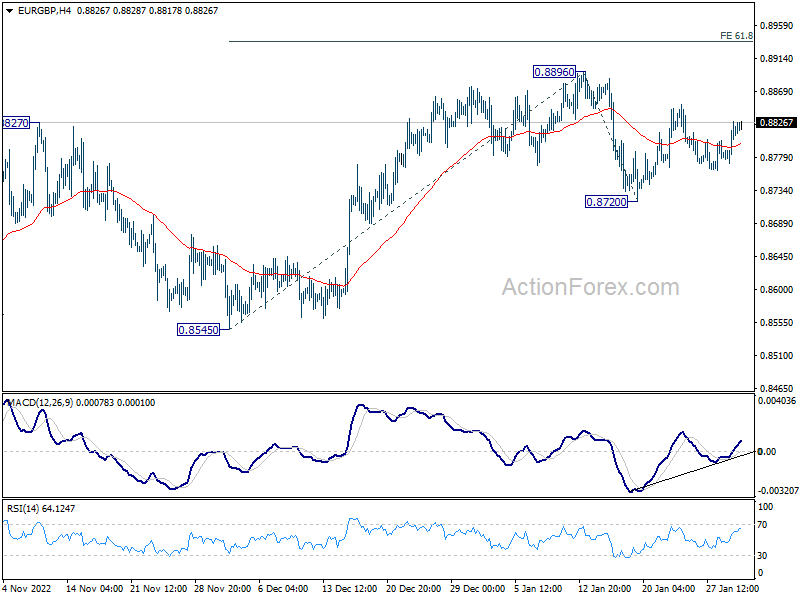
Technically, while much focuses will be on Dollar pairs today, some attention could be back on any moves in EUR/GBP ahead of tomorrow's ECB and BoE rate decisions. The cross is staying in consolidation pattern from 0.8896. For now, rise from 0.8545 is in favor to continue. Firm break of 0.8896 will target 61.8% projection of 0.8545 to 0.8896 from 0.8720 at 0.8937. Let's see if it will jump the gun.
In Asia, Nikkei rose 0.07%. Hong Kong HSI is up 0.71%. China Shanghai SSE is up 0.90%. Singapore Strait Times is up 0.23%. Japan 10-year JGB yield is down -0.0216 at 0.477.
Risk sentiment resilient ahead of FOMC rate hike, some previews
Fed is widely expected to continue to slow down its tightening pace today, and raise interest rate by 25bps to 4.50-4.75%. The accompanying statement should clearly indicate that the work is not done yet on fighting inflation. Such message should be echoed by Fed Chair Jerome Powell in the post-meeting press conference.
Fed fund futures are now pricing in another 25bps rate hike to 4.75-5.00% in March. But the main questions are, firstly, whether rate will peak above or below 5% level, and secondly, for how long it will stay there. No concrete answer would be provided at least until new economic projections to be published in March.
Here are some suggested readings on FOMC:
- Will the FOMC Surprise the Markets?
- Fed Expected to Hike, But Then What?
- Fed Meeting Preview: The Magic Show of Interest Rates, Inflation, and Growth
- Is the U.S. Fed Nearing the End of its Record Hiking Cycle?
- Will the Fed Add a Hawkish Flavor to a Smaller Hike?
- Fed Preview: What It Takes for the Fed to Cut Rates
- January Flashlight for the FOMC Blackout Period
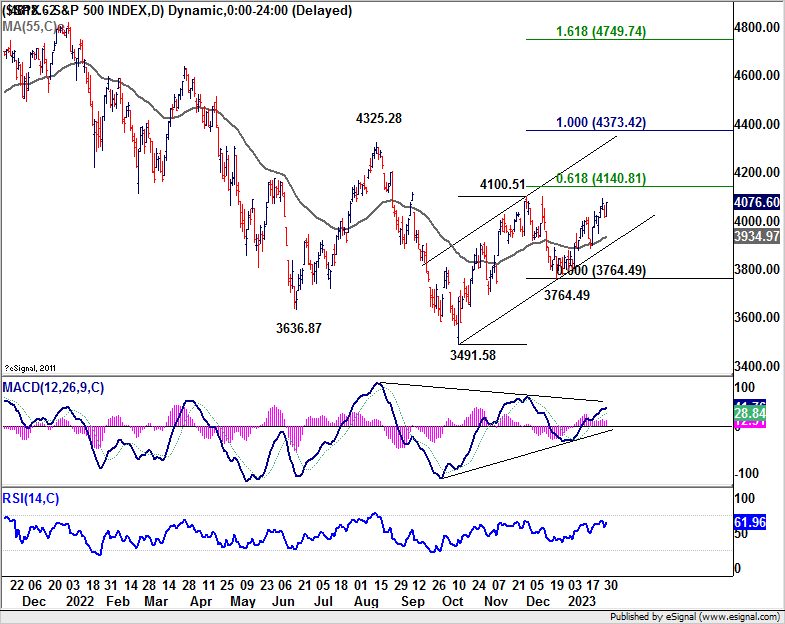
Overall risk sentiment has been resilient going into FOMC announcement. For now, further rise is in favor in S&P 500 as long as 55 day EMA (now at 3934.97) holds. Decisive break of 41.00.51 resistance will confirm resumption of whole rebound from 3491.58 low. Further break of 61.8% projection of 3491.58 to 4100.51 from 3764.49 could prompt upside acceleration to 100% projection of 3491.58 to 4100.51 from 3764.49 at 4373.42, even as a bear market rally. If that happens, risk-on sentiment would continue to cap any rebound attempt of Dollar.
China Caixin PMI manufacturing ticked up to 49.2, optimism improving
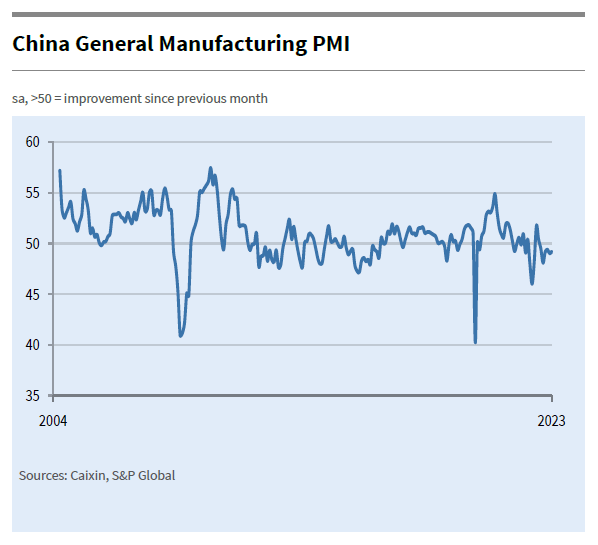
China Caixin PMI Manufacturing ticked up from 49.0 to 49.2 in January. Caixin noted there were softer falls in output and new orders. Supply chain pressures eased. Confidence around the outlook hit the highest level since April 2021.
Wang Zhe, Senior Economist at Caixin Insight Group said: “Overall, the pandemic continued to take a toll on the economy in January. Supply and demand weakened, overseas demand was sluggish, employment declined, and logistics hadn’t fully recovered, while the quantity of purchases shrank, inventories dropped, and manufacturers faced growing pressure on profitability. But optimism in the sector continued to improve as businesses expected a post-Covid economic recovery.”
Japan PMI manufacturing finalized at 48.9 in Jan, but some positive signals
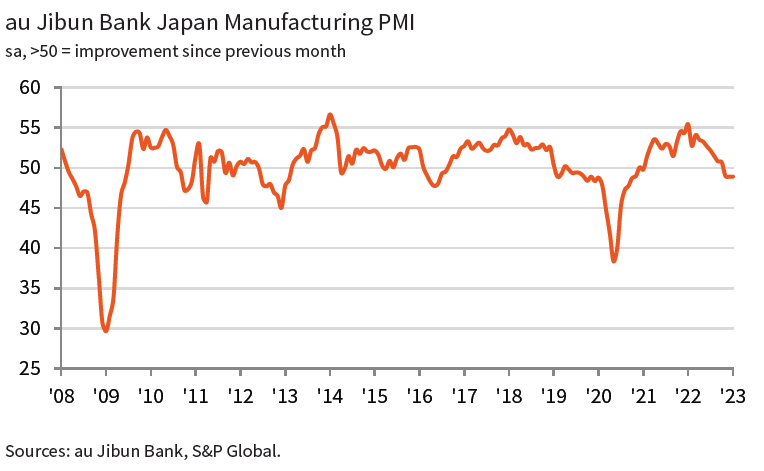
Japan PMI Manufacturing was finalized at 48.9 in January, unchanged from January’s 48.9. S&P Global also noted that reductions in output and new orders were slowest since last October. Supply chain disruptions were least widespread for nearly two years. Prices charged inflation cooled to its lowest for 16 months.
Tim Moore, Economics Director at S&P Global Market Intelligence, said: “Subdued global economic conditions continued to hold back customer demand across the Japanese manufacturing sector in January, but there were a number of positive signals from the latest PMI survey. The rates of decline for output and new orders were the smallest since last October, whilst marginal employment growth was maintained as manufacturers sought to boost capacity in line with long-term investment plans.”
NZ employment rose 0.2% in Q4, unemployment rate rose to 3.4%
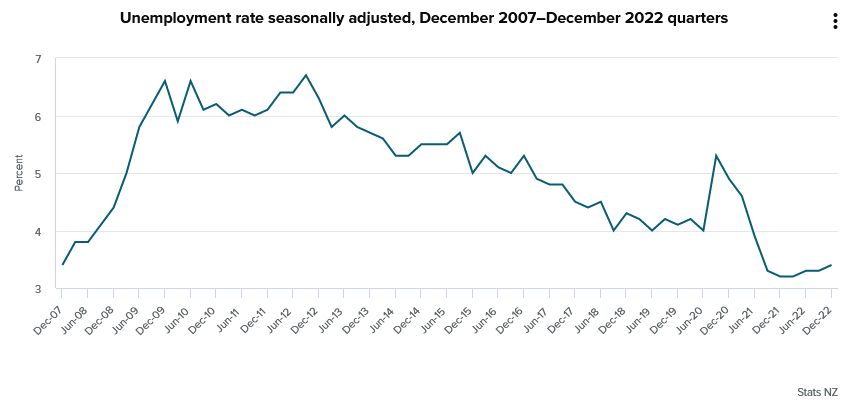
New Zealand employment rose 0.2% in Q4, below expectation of 0.3%. Employment rate was unchanged at 69.3%. Unemployment rate rose from 3.3% to 3.4%, above expectation of 3.3%. Participation rate was unchanged at 71.7%. Labor cost index rose 1.1% qoq, below expectation of 1.3% qoq.
“The unemployment rate, as measured by the Household Labour Force Survey (HLFS), has remained at or near historic lows since the September 2021 quarter,” work and wellbeing statistics senior manager Becky Collett said.
USD/CHF Daily Outlook
Daily Pivots: (S1) 0.9112; (P) 0.9200; (R1) 0.9249; More…
USD/CHF dropped notably after recovering to 0.9287, but stays above 0.9084 low. Intraday bias remains neutral for the moment. For now, outlook stays mildly bearish despite loss of downside momentum. On the downside, sustained break of 61.8% projection of 1.0146 to 0.9355 from 0.9545 at 0.9056 will pave the way to 100% projection at 0.8754, which is close to 0.8756 long term support. Nevertheless, on the upside, break of 0.9287 should confirm short term bottoming and turn bias back to the upside for 0.9407 resistance.
In the bigger picture, rise from 0.8756 (2021 low) has completed at 1.0146, well ahead of 1.0342 long term resistance (2016 high). Based on current downside momentum, fall from 1.0146 should be a medium term down trend itself. Next target is a test on 0.8756 low. Strong support should be seen there to bring rebound. Still, further decline will now be expected as long as 0.9407 resistance holds, in any case.
Economic Indicators Update
| GMT | Ccy | Events | Actual | Forecast | Previous | Revised |
|---|---|---|---|---|---|---|
| 21:45 | NZD | Employment Change Q4 | 0.20% | 0.30% | 1.30% | |
| 21:45 | NZD | Unemployment Rate Q4 | 3.40% | 3.30% | 3.30% | |
| 21:45 | NZD | Labour Cost Index Q/Q Q4 | 1.10% | 1.30% | 1.10% | |
| 00:30 | JPY | Manufacturing PMI Jan F | 48.9 | 48.9 | 48.9 | |
| 01:45 | CNY | Caixin Manufacturing PMI Jan | 49.2 | 49.2 | 49 | |
| 08:30 | CHF | Manufacturing PMI Jan | 54.3 | 54.1 | ||
| 08:45 | EUR | Italy Manufacturing PMI Jan | 49.6 | 48.5 | ||
| 08:50 | EUR | France Manufacturing PMI Jan F | 50.8 | 50.8 | ||
| 08:55 | EUR | Germany Manufacturing PMI Jan F | 47 | 47 | ||
| 09:00 | EUR | Eurozone Manufacturing PMI Jan F | 48.8 | 48.8 | ||
| 09:30 | GBP | Manufacturing PMI Jan F | 46.7 | 46.7 | ||
| 10:00 | EUR | Eurozone CPI Y/Y Jan P | 9.00% | 9.20% | ||
| 10:00 | EUR | Eurozone CPI Core Y/Y Jan P | 5.10% | 5.20% | ||
| 13:15 | USD | ADP Employment Change Jan | 168K | 235K | ||
| 14:30 | CAD | Manufacturing PMI Jan | 49.2 | |||
| 14:45 | USD | Manufacturing PMI Jan F | 46.8 | 46.8 | ||
| 15:00 | USD | ISM Manufacturing PMI Jan | 48.7 | 48.4 | ||
| 15:00 | USD | ISM Manufacturing Prices Paid Jan | 41.9 | 39.4 | ||
| 15:00 | USD | ISM Manufacturing Employment Index Jan | 51.4 | |||
| 15:00 | USD | Construction Spending M/M Dec | 0.00% | 0.20% | ||
| 15:30 | USD | Crude Oil Inventories | 0.5M | |||
| 19:00 | USD | Fed Rate Decision | 4.75% | 4.50% | ||
| 19:30 | USD | FOMC Press Conference |
Risk sentiment resilient ahead of FOMC rate hike, some previews
Fed is widely expected to continue to slow down its tightening pace today, and raise interest rate by 25bps to 4.50-4.75%. The accompanying statement should clearly indicate that the work is not done yet on fighting inflation. Such message should be echoed by Fed Chair Jerome Powell in the post-meeting press conference.
Fed fund futures are now pricing in another 25bps rate hike to 4.75-5.00% in March. But the main questions are, firstly, whether rate will peak above or below 5% level, and secondly, for how long it will stay there. No concrete answer would be provided at least until new economic projections to be published in March.
Here are some suggested readings on FOMC:
- Will the FOMC Surprise the Markets?
- Fed Expected to Hike, But Then What?
- Fed Meeting Preview: The Magic Show of Interest Rates, Inflation, and Growth
- Is the U.S. Fed Nearing the End of its Record Hiking Cycle?
- Will the Fed Add a Hawkish Flavor to a Smaller Hike?
- Fed Preview: What It Takes for the Fed to Cut Rates
- January Flashlight for the FOMC Blackout Period
Overall risk sentiment has been resilient going into FOMC announcement. For now, further rise is in favor in S&P 500 as long as 55 day EMA (now at 3934.97) holds. Decisive break of 41.00.51 resistance will confirm resumption of whole rebound from 3491.58 low. Further break of 61.8% projection of 3491.58 to 4100.51 from 3764.49 could prompt upside acceleration to 100% projection of 3491.58 to 4100.51 from 3764.49 at 4373.42, even as a bear market rally. If that happens, risk-on sentiment would continue to cap any rebound attempt of Dollar.
China Caixin PMI manufacturing ticked up to 49.2, optimism improving
China Caixin PMI Manufacturing ticked up from 49.0 to 49.2 in January. Caixin noted there were softer falls in output and new orders. Supply chain pressures eased. Confidence around the outlook hit the highest level since April 2021.
Wang Zhe, Senior Economist at Caixin Insight Group said: “Overall, the pandemic continued to take a toll on the economy in January. Supply and demand weakened, overseas demand was sluggish, employment declined, and logistics hadn’t fully recovered, while the quantity of purchases shrank, inventories dropped, and manufacturers faced growing pressure on profitability. But optimism in the sector continued to improve as businesses expected a post-Covid economic recovery."
Japan PMI manufacturing finalized at 48.9 in Jan, but some positive signals
Japan PMI Manufacturing was finalized at 48.9 in January, unchanged from January's 48.9. S&P Global also noted that reductions in output and new orders were slowest since last October. Supply chain disruptions were least widespread for nearly two years. Prices charged inflation cooled to its lowest for 16 months.
Tim Moore, Economics Director at S&P Global Market Intelligence, said: “Subdued global economic conditions continued to hold back customer demand across the Japanese manufacturing sector in January, but there were a number of positive signals from the latest PMI survey. The rates of decline for output and new orders were the smallest since last October, whilst marginal employment growth was maintained as manufacturers sought to boost capacity in line with long-term investment plans."
NZ employment rose 0.2% in Q4, unemployment rate rose to 3.4%
New Zealand employment rose 0.2% in Q4, below expectation of 0.3%. Employment rate was unchanged at 69.3%. Unemployment rate rose from 3.3% to 3.4%, above expectation of 3.3%. Participation rate was unchanged at 71.7%. Labor cost index rose 1.1% qoq, below expectation of 1.3% qoq.
“The unemployment rate, as measured by the Household Labour Force Survey (HLFS), has remained at or near historic lows since the September 2021 quarter,” work and wellbeing statistics senior manager Becky Collett said.
Technical Outlook and Review
USD/JPY:
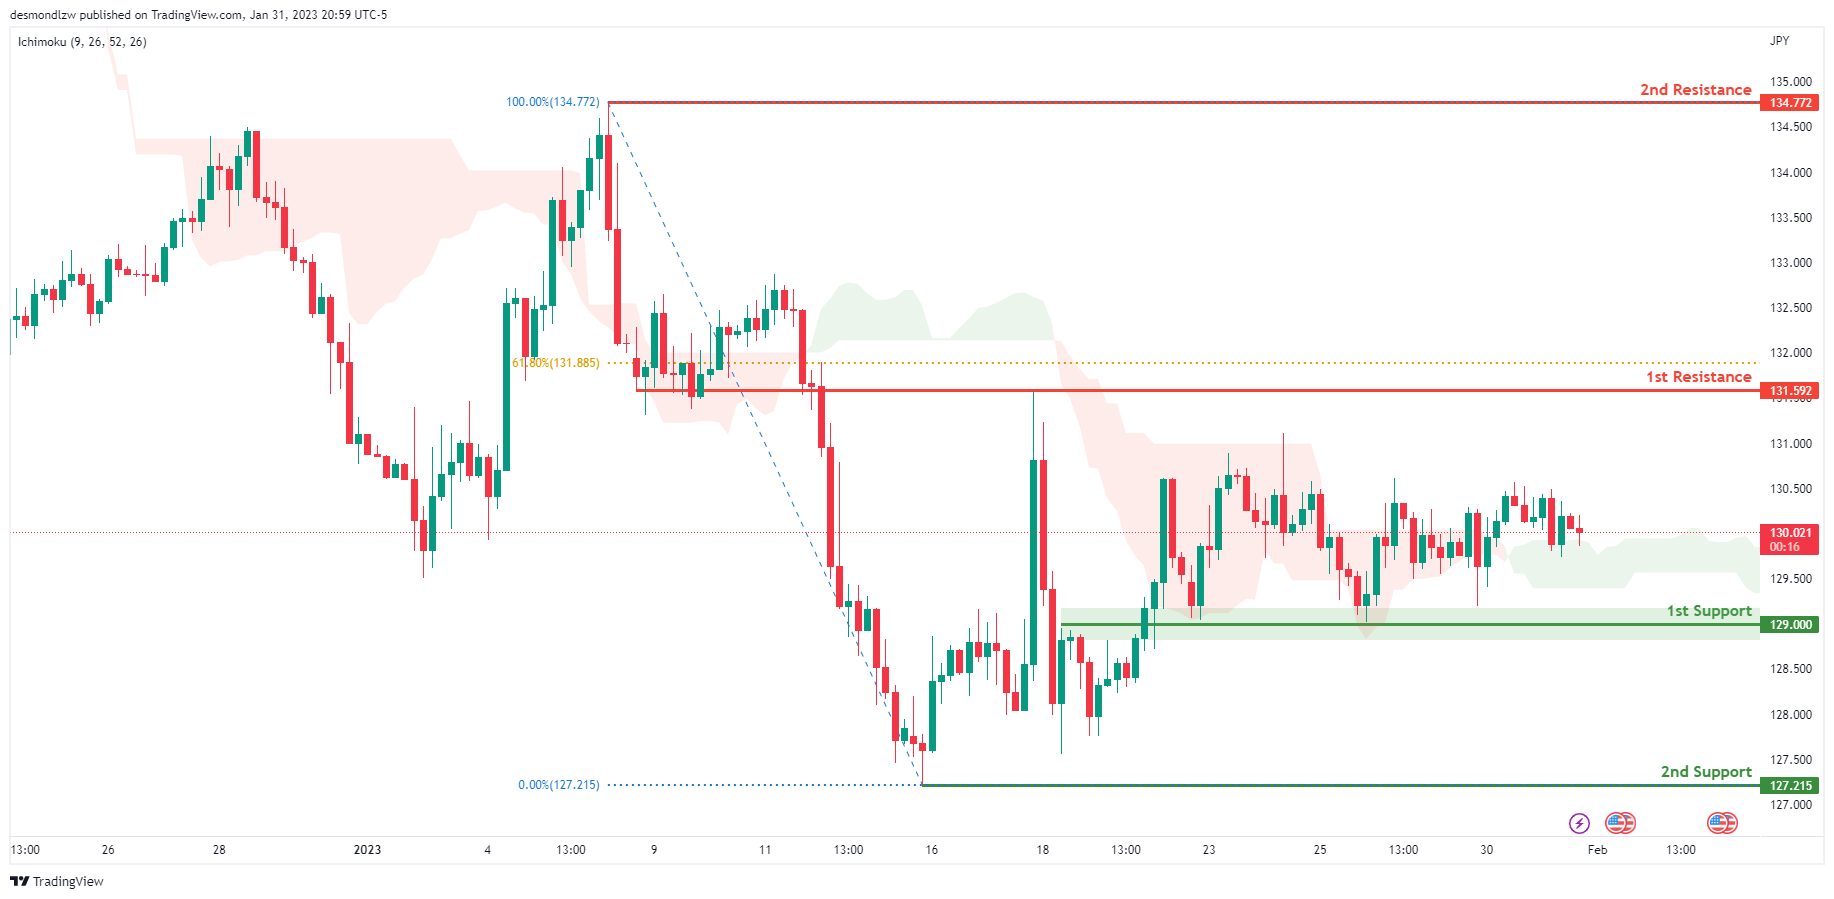
Looking at the H4 chart, my overall bias for USDJPY is bullish due to the current price crossing above the Ichimoku cloud, indicating a bullish market. If this bullish momentum continues, expect the price to possibly continue heading towards the 1st resistance level at 131.592, where the 61.8% Fibonacci line is. In an alternate scenario, price could possibly head back down to retest the 1st support at 129.000, where the overlap support is.
Areas of consideration:
- H4 time frame, 1st resistance at 131.592
- H4 time frame, 1st support at 129.000
DXY:
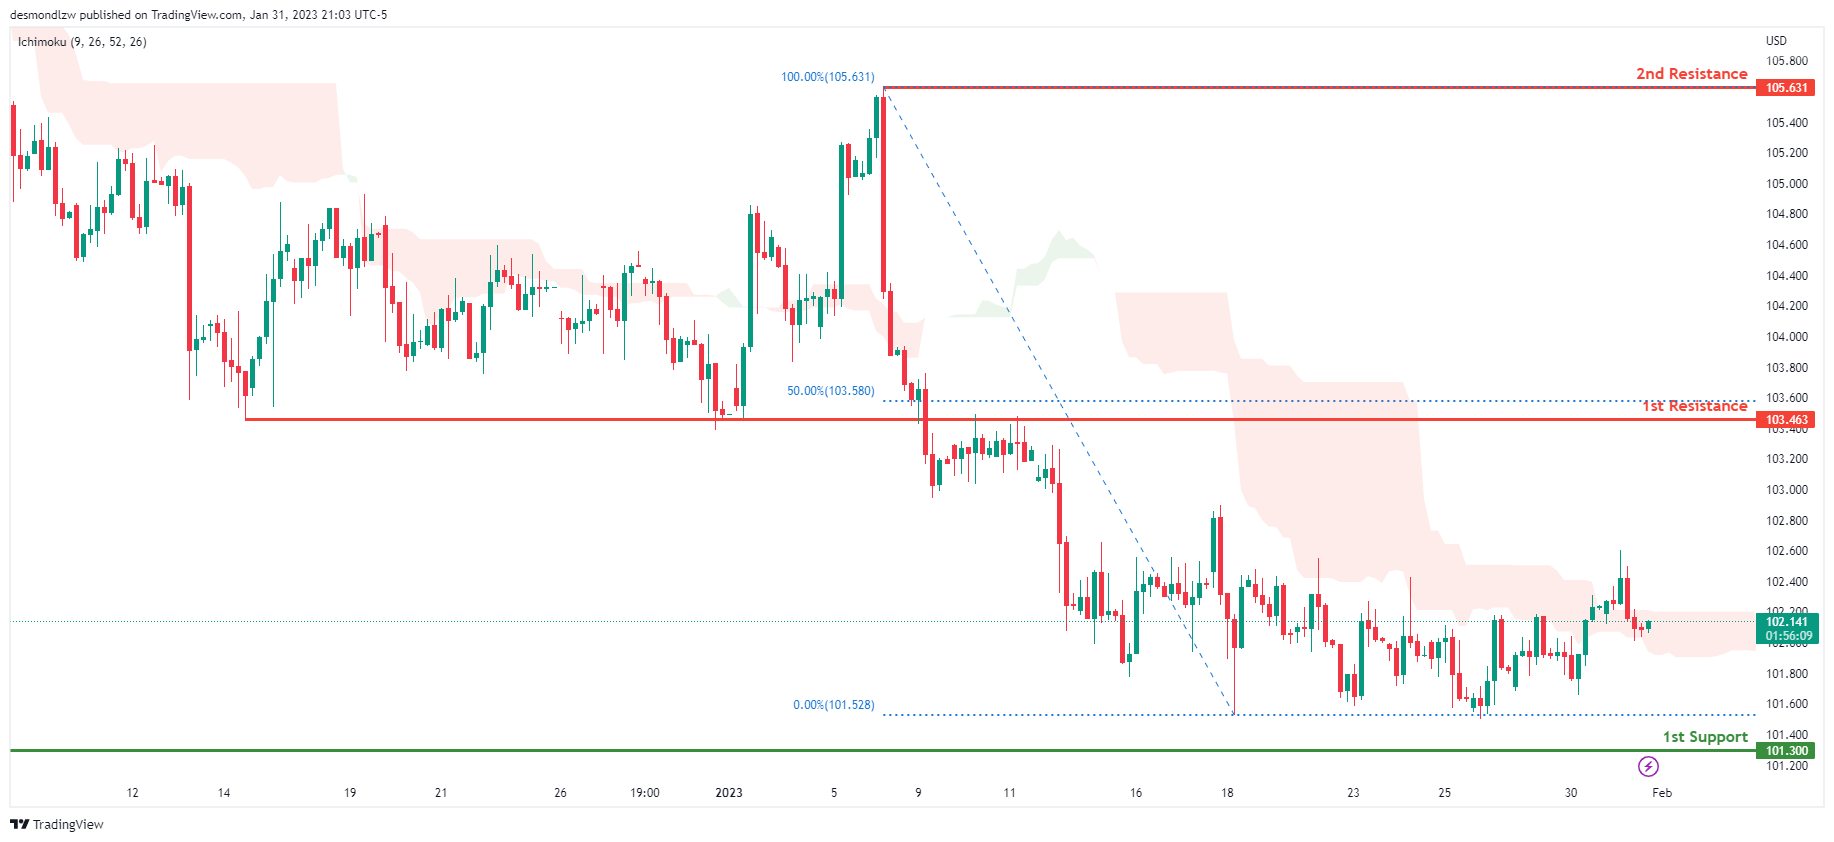
Looking at the H4 chart, my overall bias for DXY is bearish due to the current price crossing below the Ichimoku cloud, indicating a bearish market. If this bearish momentum continues, expect the price to possibly continue heading towards the 1st support at 101.300, where the previous swing low is. In an alternative scenario, price could head back up to retest the 1st resistance at 103.463, where the overlap resistance and 50% Fibonacci line is.
Areas of consideration:
- H4 time frame, 1st resistance at 103.463
- H4 time frame, 1st support at 101.300
EUR/USD:
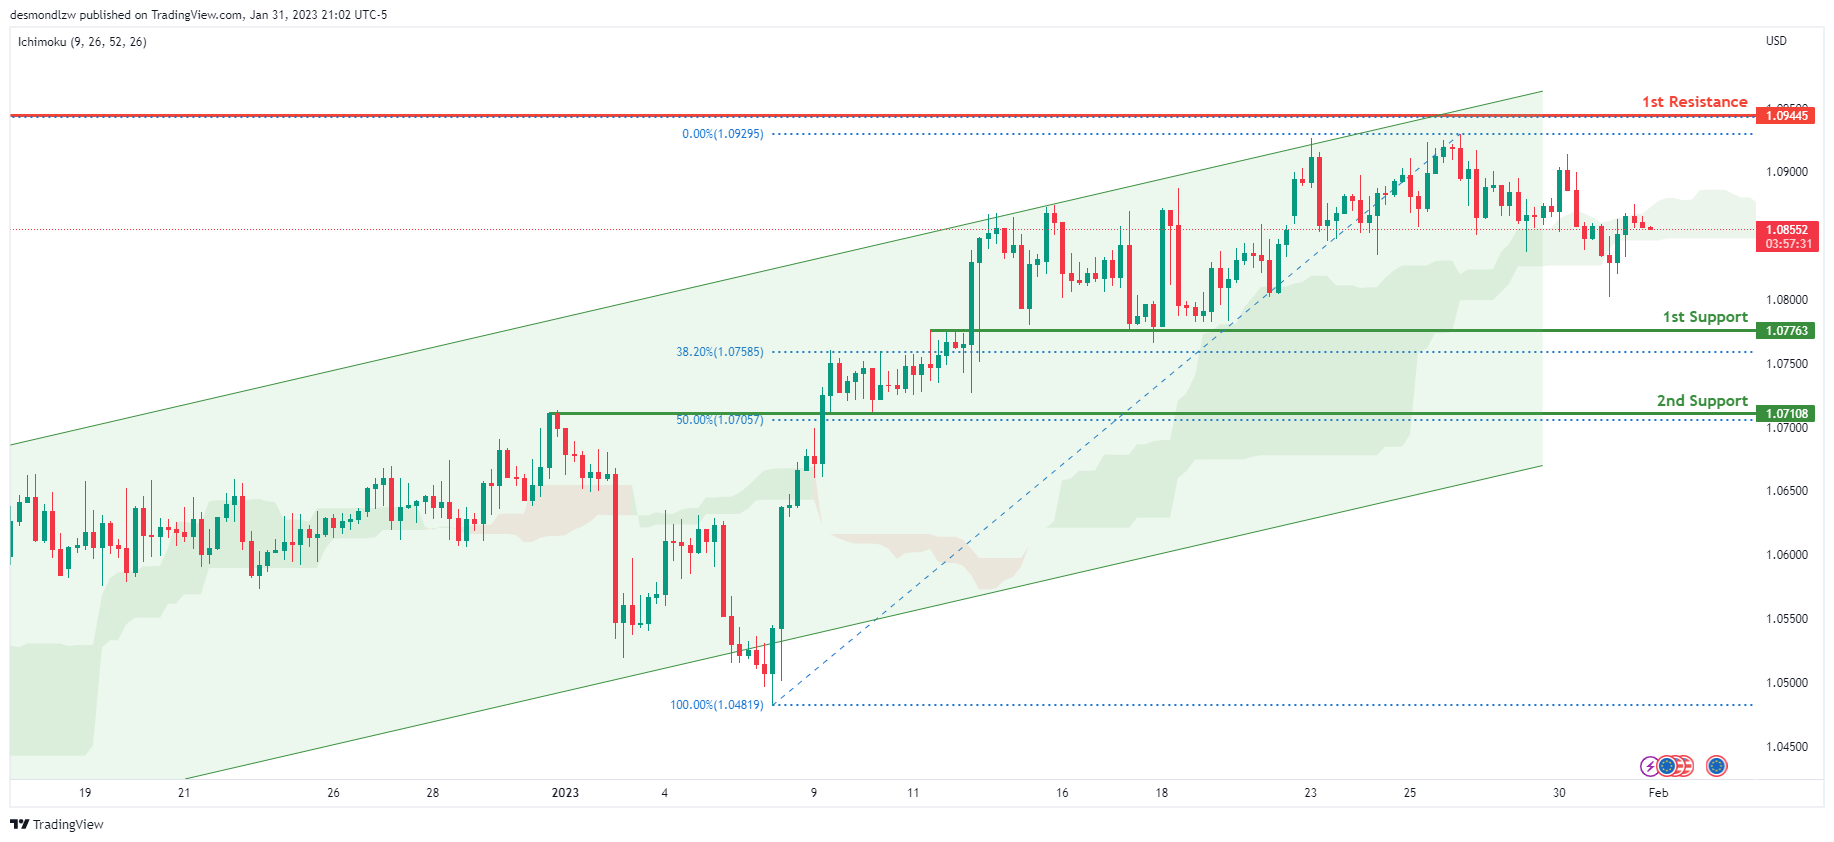
Looking at the H4 chart, my overall bias for EURUSD is bullish due to the current price crossing above the Ichimoku cloud, indicating a bullish market structure. To add confluence to this bias, price is also within an ascending channel. If this bullish momentum continues, expect the price to possibly continue heading towards the 1st resistance at 1.09445, where the 50% Fibonacci line is. In an alternate scenario, price could possibly head back down to retest the 1st support level at 1.07763, where the 38.2% Fibonacci line is.
Areas of consideration :
- H4 1st resistance at 1.09445
- H4 1st support at 1.07763
GBP/USD:
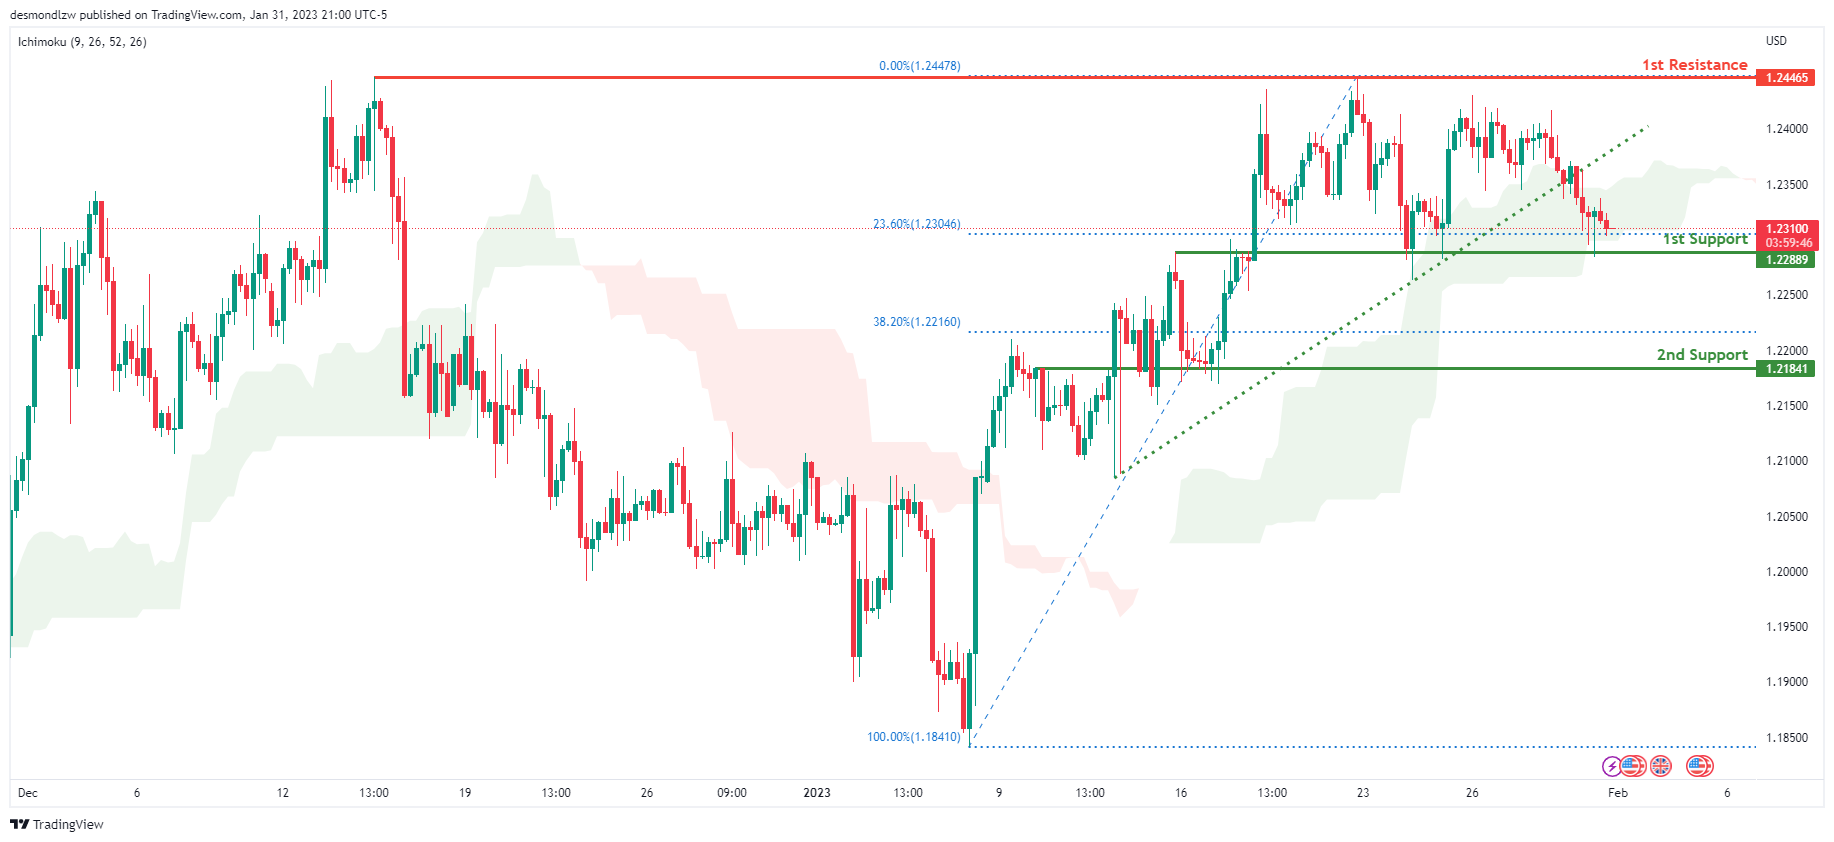
Looking at the H4 chart, my overall bias for GBPUSD is bearish due to the current price crossing below the Ichimoku cloud, indicating a bearish market. To add confluence to this bias, price has also broken the ascending trend line. If this bearish momentum continues, expect price to possibly break the 1st support at 1.22889, where the 23.6% Fibonacci line is, before heading towards the 2nd support at 1.21841, where the overlap support and 38.2% Fibonacci line is. In an alternate scenario, price could continue to head back up towards the 1st resistance line at 1.24465, where the previous swing high is.
Areas of consideration:
- H4 1st resistance at 1.24465
- H4 1st support at 1.22889
- H4 2nd support at 1.21841
USD/CHF:
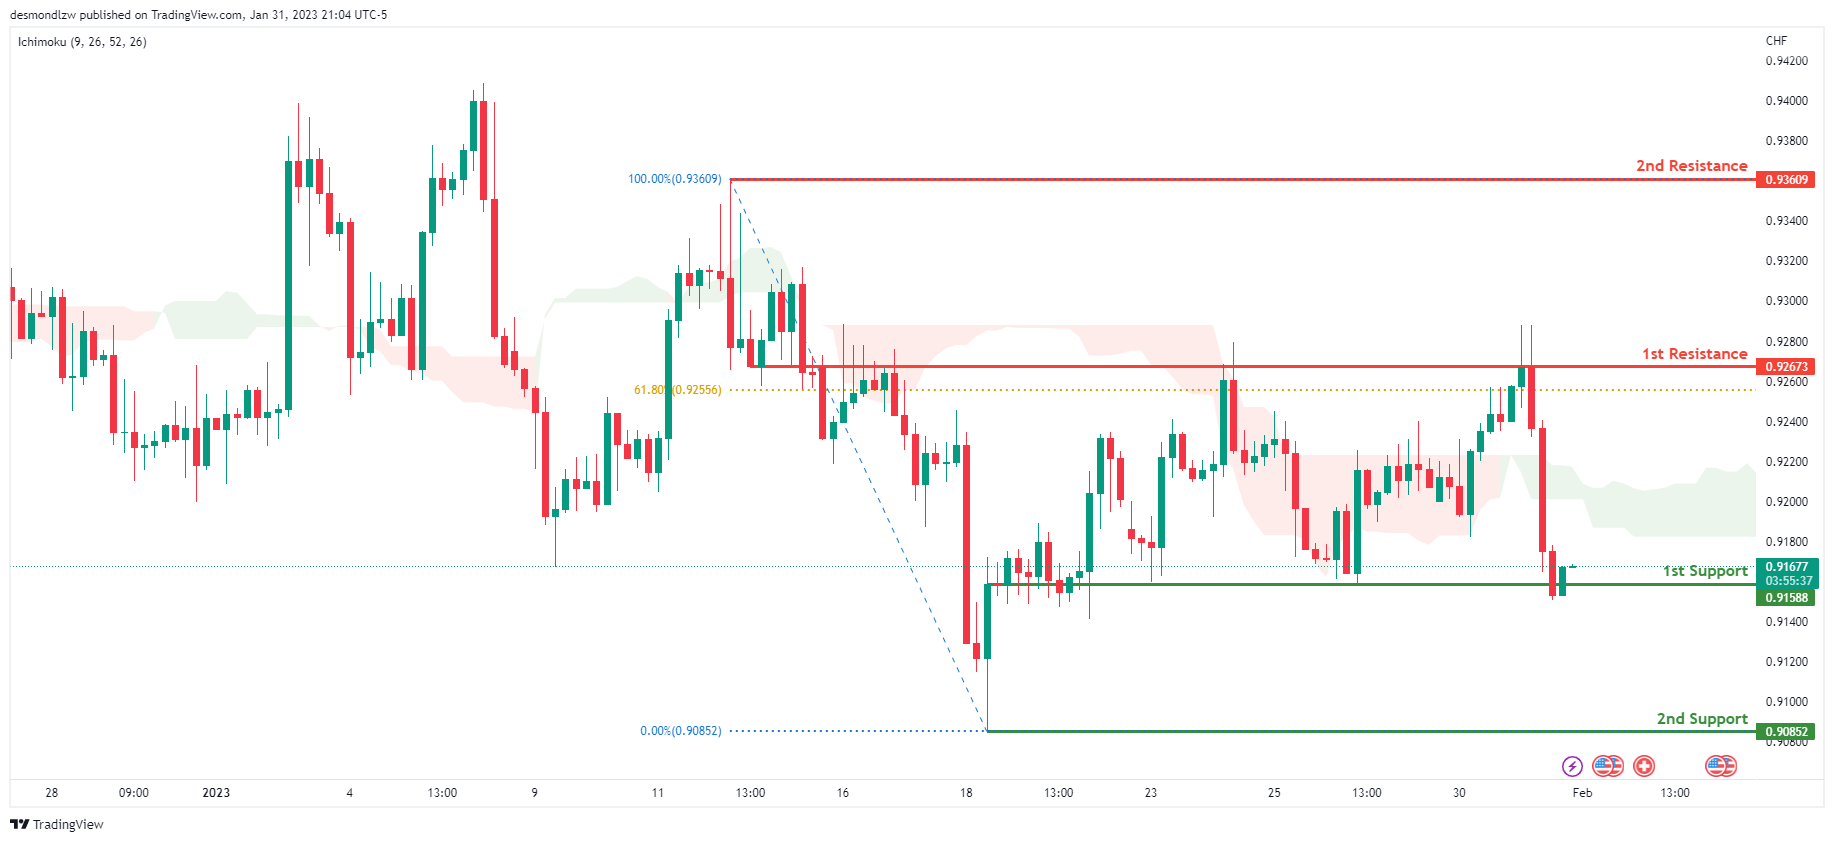
Looking at the H4 chart, my overall bias for USDCHF is bullish due to the current price crossing above the Ichimoku cloud, indicating a bullish market. If the current bullish trend continues, expect the price to possibly head back up to retest the 1st resistance at 0.92673, where the 61.8% Fibonacci line is. In an alternative scenario, price could possibly continue to head towards the 1st support at 0.91588, which is the overlap support.
Areas of consideration
- H4 1st support at 0.91588
- H4 1st resistance at 0.92673
XAU/USD (GOLD):
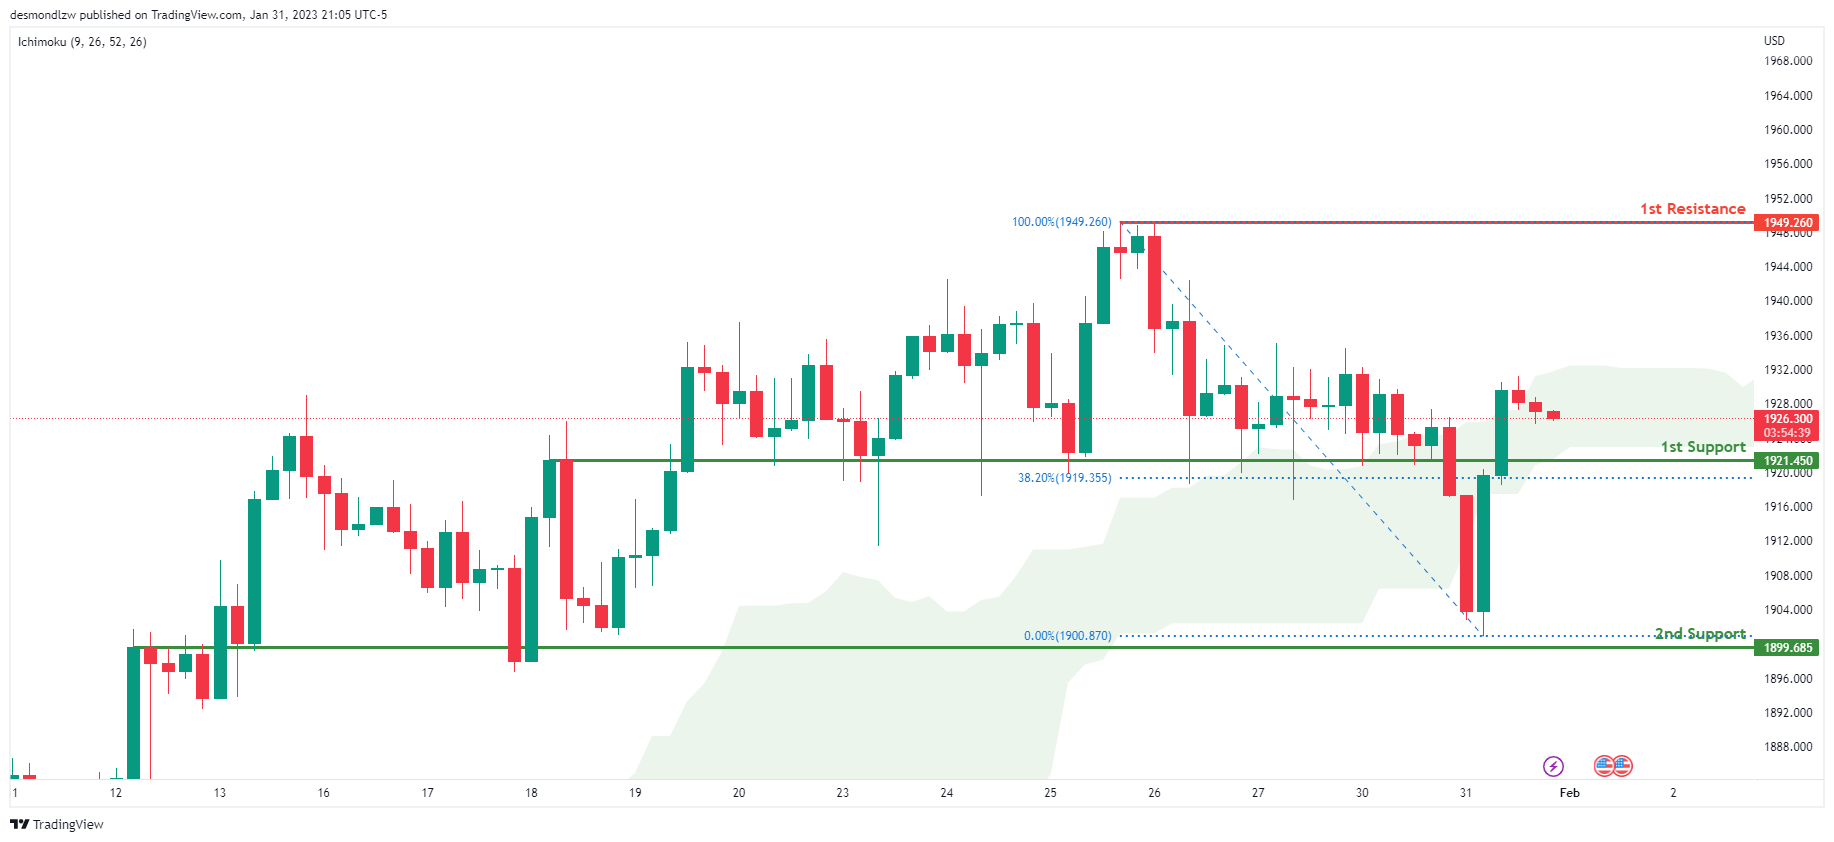
Looking at the H4 chart, my overall bias for XAUUSD is bullish due to the current price crossing above the Ichimoku cloud, indicating a bullish market. If this bullish momentum continues, expect the price to possibly continue heading towards the 1st resistance at 1949.260, where the recent swing high is. In an alternative scenario, price could possibly head back down to break the 1st support at 1921.450 where the 38.2% Fibonacci line is, before heading towards the 2nd support at 1899.685, where the overlap support and recent low is.
Areas of consideration:
- H4 time frame, 1st resistance at 1949.260
- H4 time frame, 1st support at 1921.450
- H4 time frame, 2nd support at 1899.685
AUD/USD:
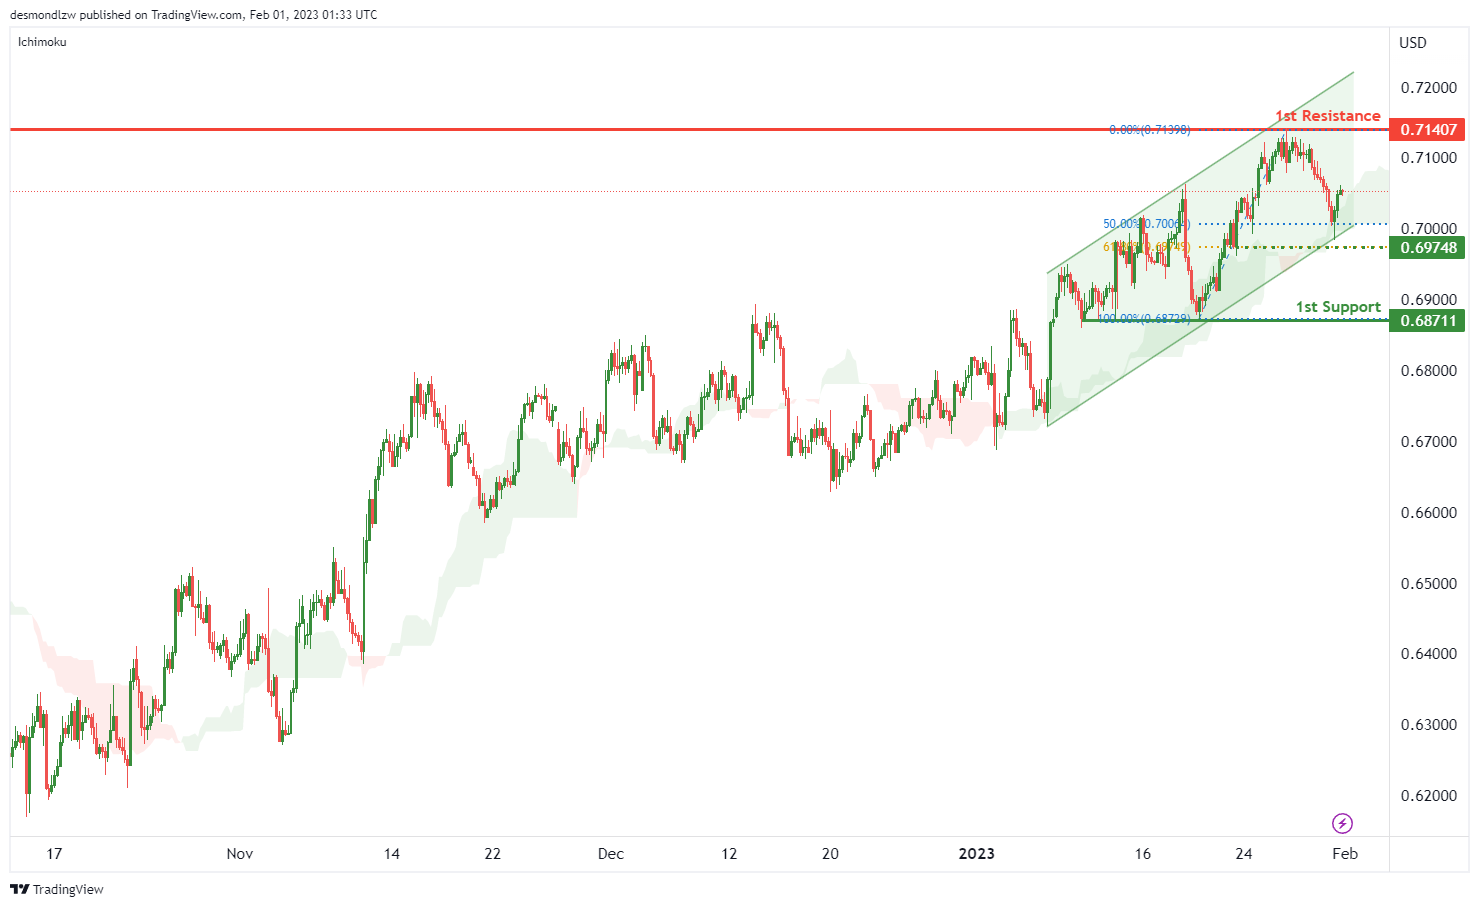
Looking at the H4 chart, my overall bias for AUDUSD is bullish due to the current price being above the Ichimoku cloud. There is an ascending trend line which adds confluence to my bias.
If this price momentum continues, expect price to heading towards the 1st resistance level at 0.71407.
In an alternate scenario, the price could possibly go back up towards the intermediate support level at 0.69748 which is at 61.8% Fibonacci line. The 1st support is at 0.698711 which is the recnet swing low.
Areas of consideration
- H4. 1st resistance at 0.71407
- H4, intermediate support at 0.69748
- H4, 1st support at 0.698711
NZD/USD:
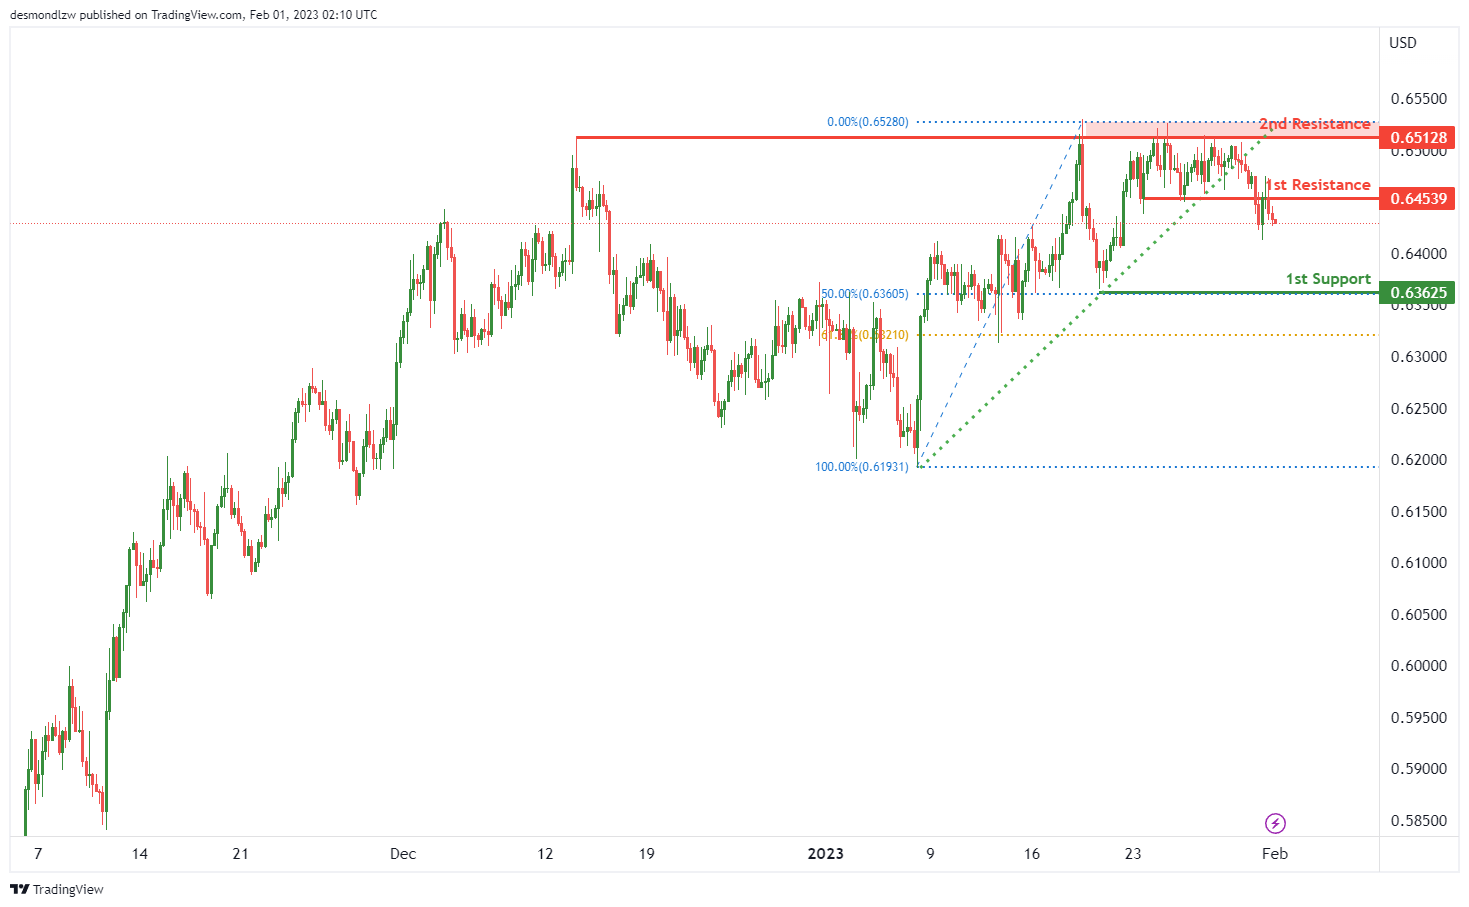
Looking at the H4 chart, my overall bias for NZDUSD is bearish. As the current ascending trendline has been broken, the price is heading towards the 1st support at 0.63625 which is in line with 50% Fibonacci retracement.
In an alternate scenario, price could possibly head back toward the 1st resistance level at 0.64539. Once the it breaks the 1st resistance level, the price is rise to the 2nd resistance zone at 0.65128.
Areas of consideration:
- H4 time frame, 2nd resistance at 0.65128
- H4 time frame, 1st resistance at 0.64539
- H4 time frame, 1st support at 0.63625
USD/CAD:
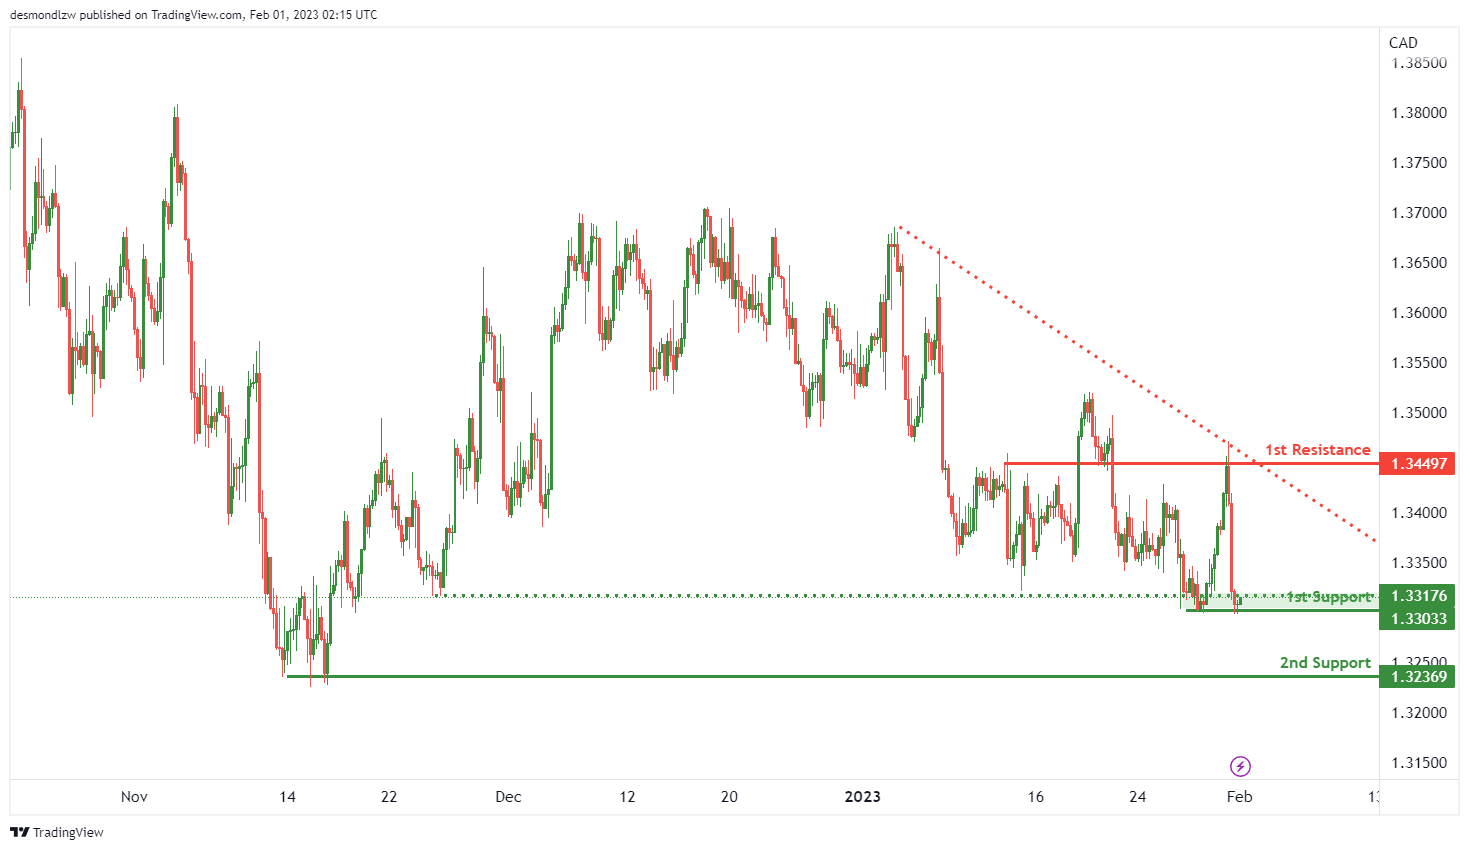
Looking at the H4 chart, my overall bias for USDCAD is bearish, as the current price is trying to break through the 1st support line at 1.33033. There is a descending trend line created. Once the 1st support line was broke, the 2nd support line is at 1.32369 which is the previous swing low.
In an alternative scenario, the price could possibly head up to the 1st resistance at 1.34497 which is the recent swing high.
Areas of consideration:
- H4 time frame, 1st resistance at 1.34497
- H4 time frame, 1st support at 1.33033
- H4 time frame, 2nd support at 1.32369
OIL:
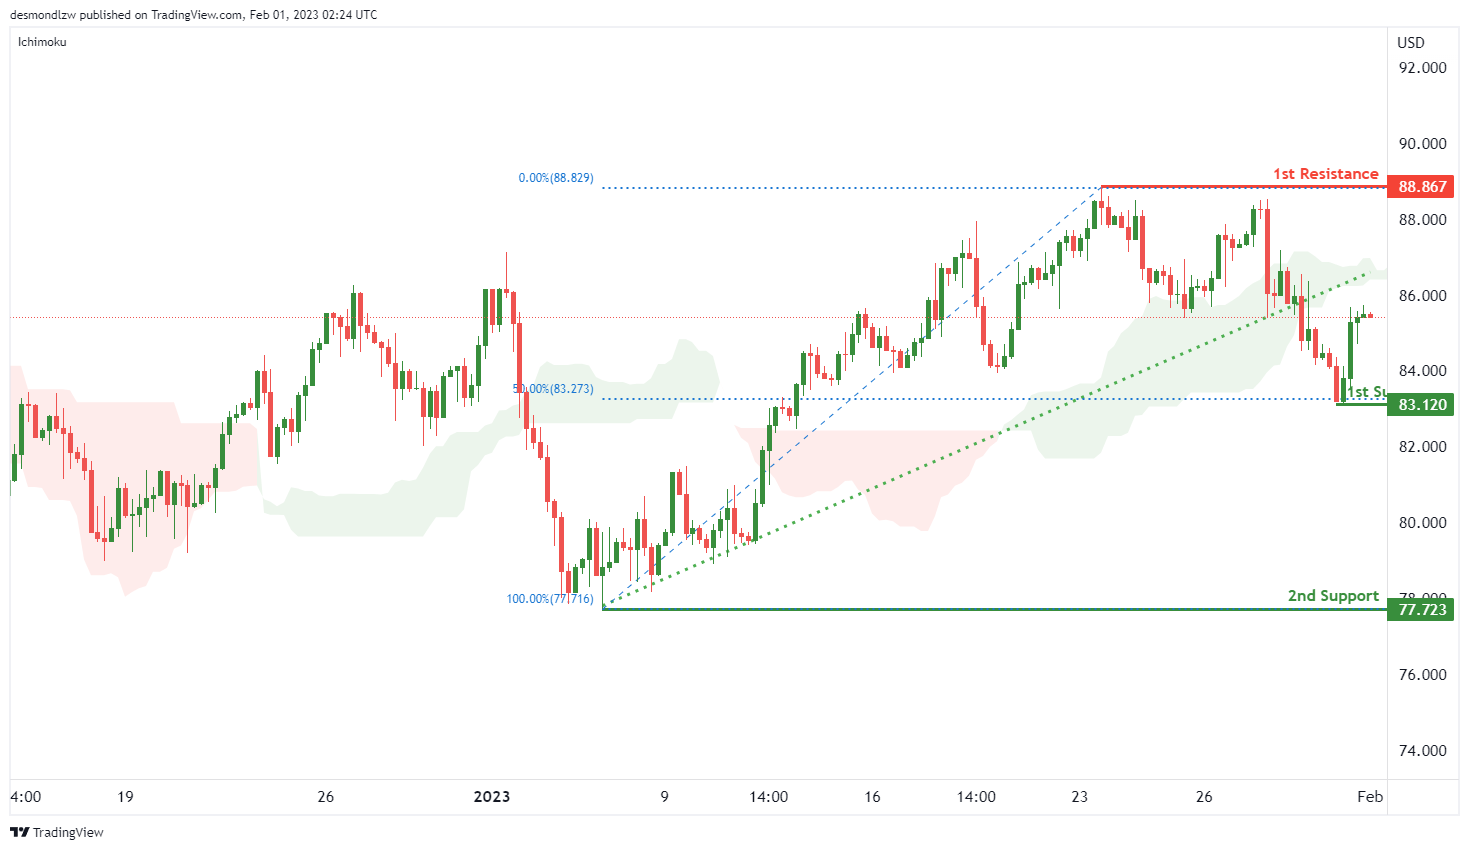
Looking at the H4 chart, my overall bias for BOC is slightly bearish. As the price seems to be breaking the rising trendline and now is below the Ichimoku cloud. The price may head down toward the 1st support at 83.120 which is the recent swing low and 50% Fibonacci line, before it heading to the 2nd support is at 77.716.
In an alternate scenario, the price could possibly head up towards the 1st resistance level at 88.829 which is the recent swing high
Areas of consideration:
- H4 time frame, 1st resistance at 88.829
- H4 time frame,1st support at 83.120 ,
- H4 time frame, 2nd support at 77.716.
Dow Jones Industrial Average:
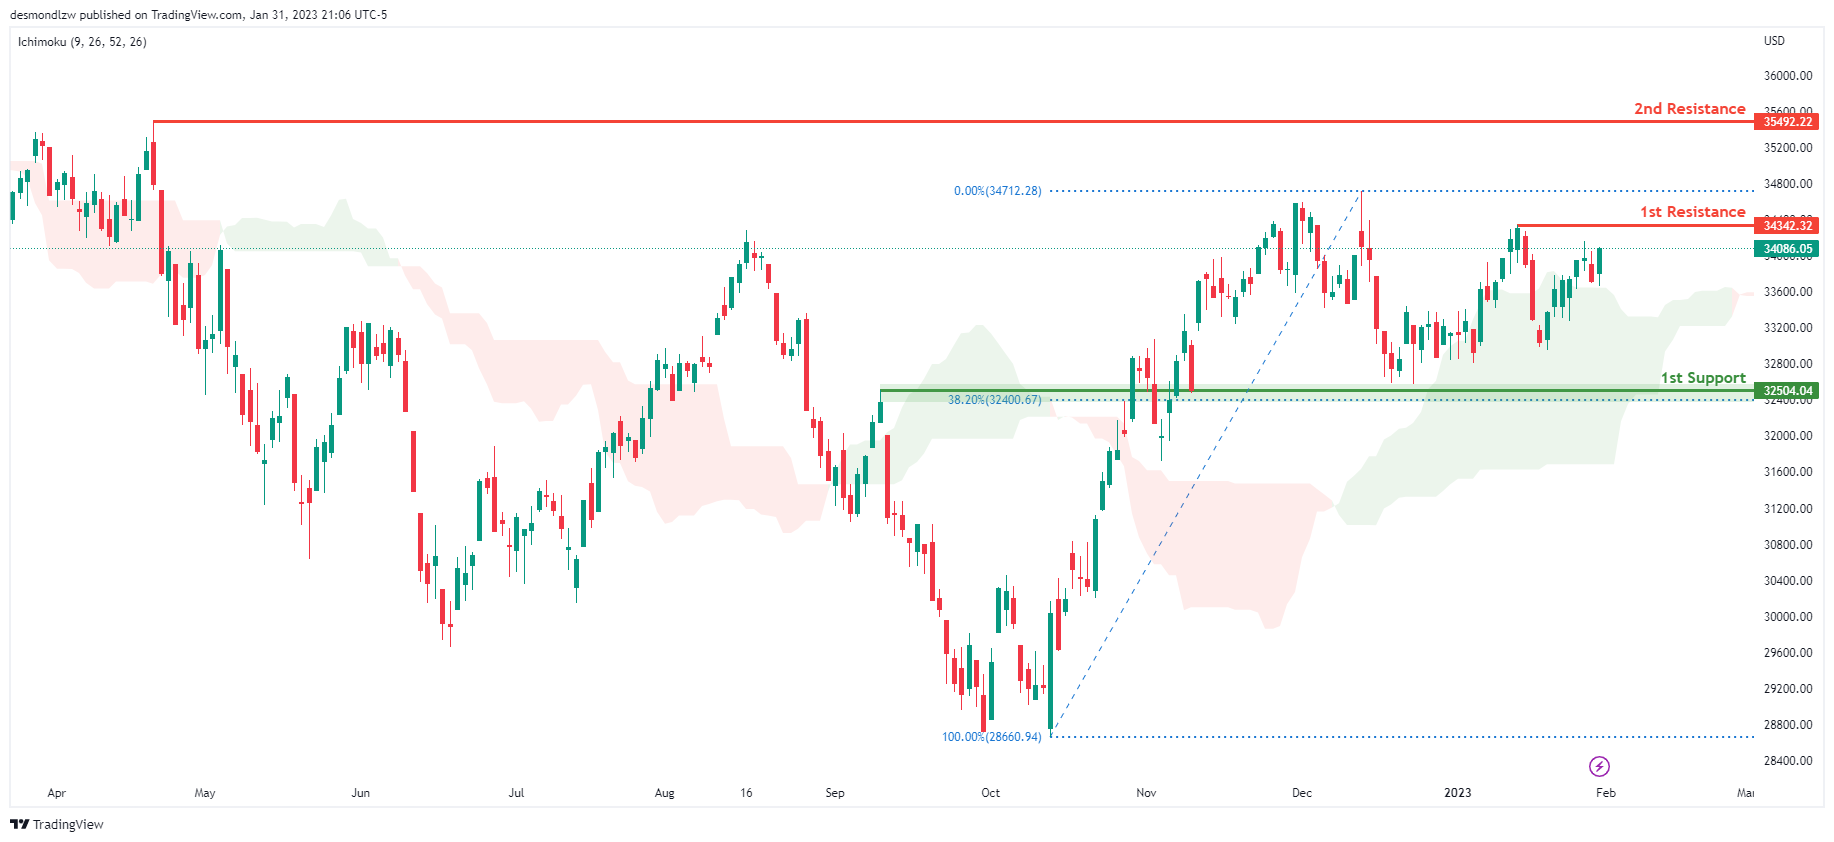
On the Daily chart, the overall bias for DJI is bullish. To add confluence to this, the price is crossing above the Ichimoku cloud which indicates a bullish market. If this bullish momentum continues, expect the price to possibly continue heading towards the 1st resistance line at 34342.32, where the recent swing high is. In an alternative scenario, price could possibly head back down towards the 1st support at 32581.97, slightly above where the 38.2% Fibonacci line is.
Areas of consideration:
- H4 time frame, 1st support at 32581.97
- H4 time frame, 1st Resistance at 34342.32
DAX:
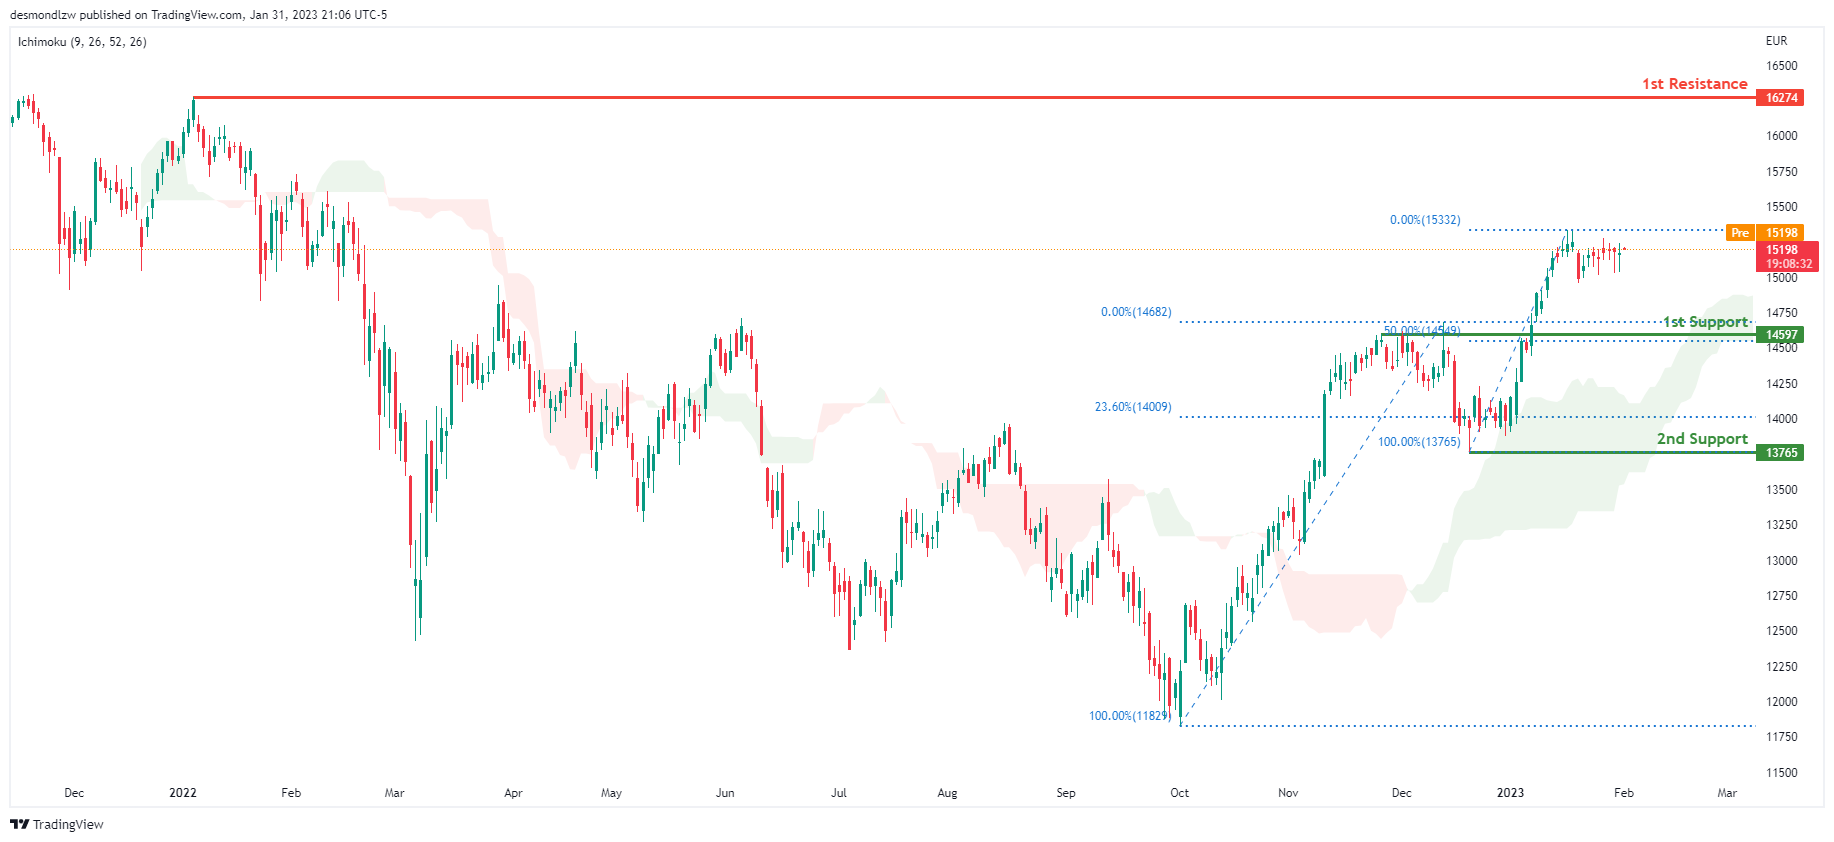
Looking at the Daily chart, my overall bias for DAX is bullish due to the current price crossing above the Ichimoku cloud, indicating a bullish market. If this bullish momentum continues, expect the price to possibly head towards the 1st resistance line at 16274, where the previous swing high is. In an alternative scenario, price could possibly head down to retest the 1st support at 14597, where the 50% Fibonacci line is.
Areas of consideration:
- H4 time frame, 1st resistance is at 16274
- H4 time frame, 1st support is at 14597
ETHUSD:
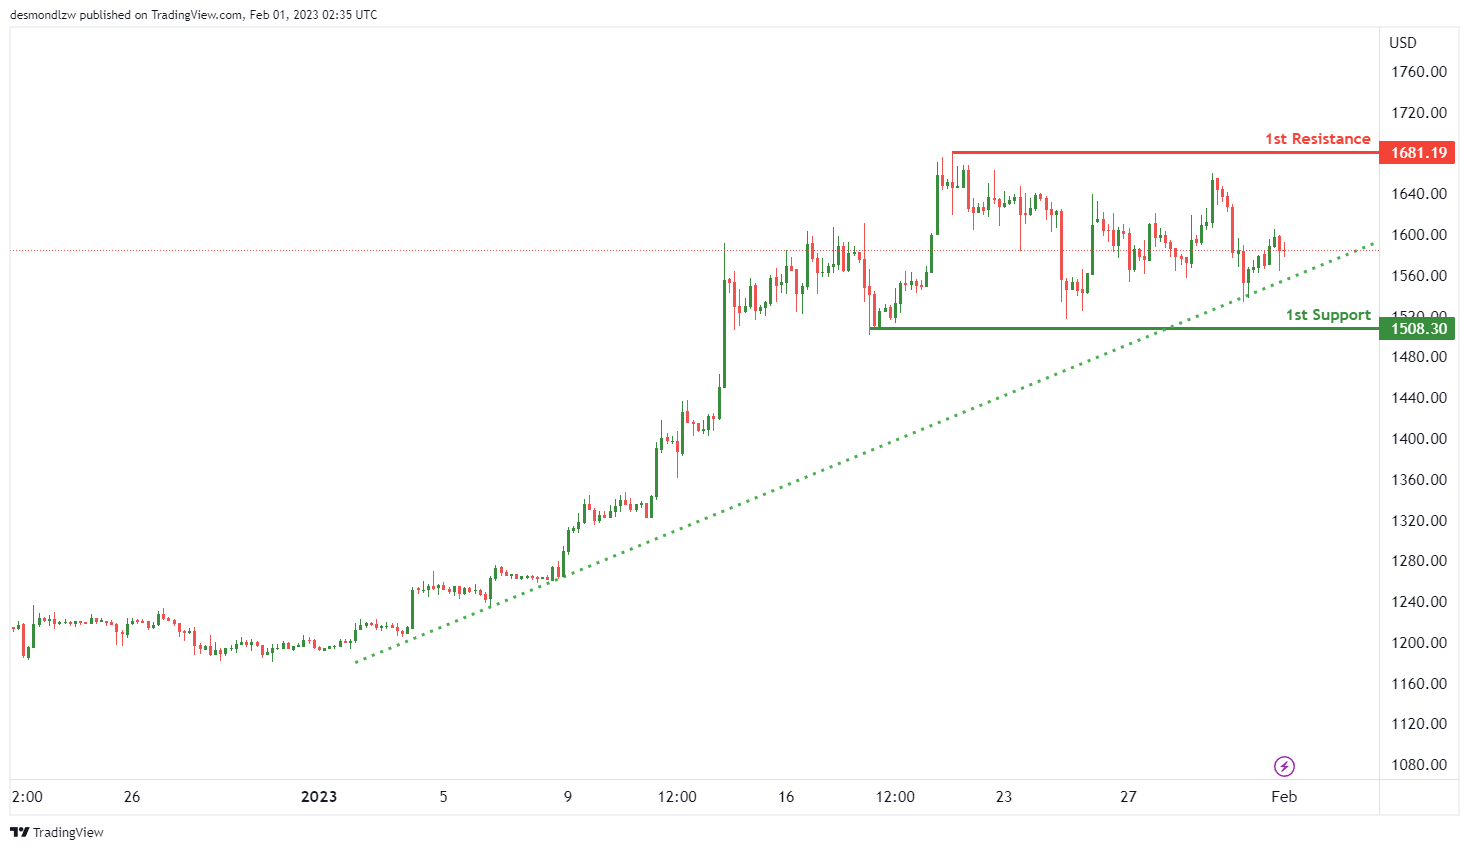
Looking at the H4 chart, my overall bias for ETHUSD is slightly bullish, the strong ascending trend line has been created. Expecting the price head towards the 1st resistance line at 1681.19 which is the recent swing high.
In an alternate scenario, the price may go down to the 1st support at 1508.30 which is the recent swing low.
Areas of consideration:
- H4 time frame, 1st resistance of 1681.19
- H4 time frame, 1st support at 1508.30
BTCUSD:
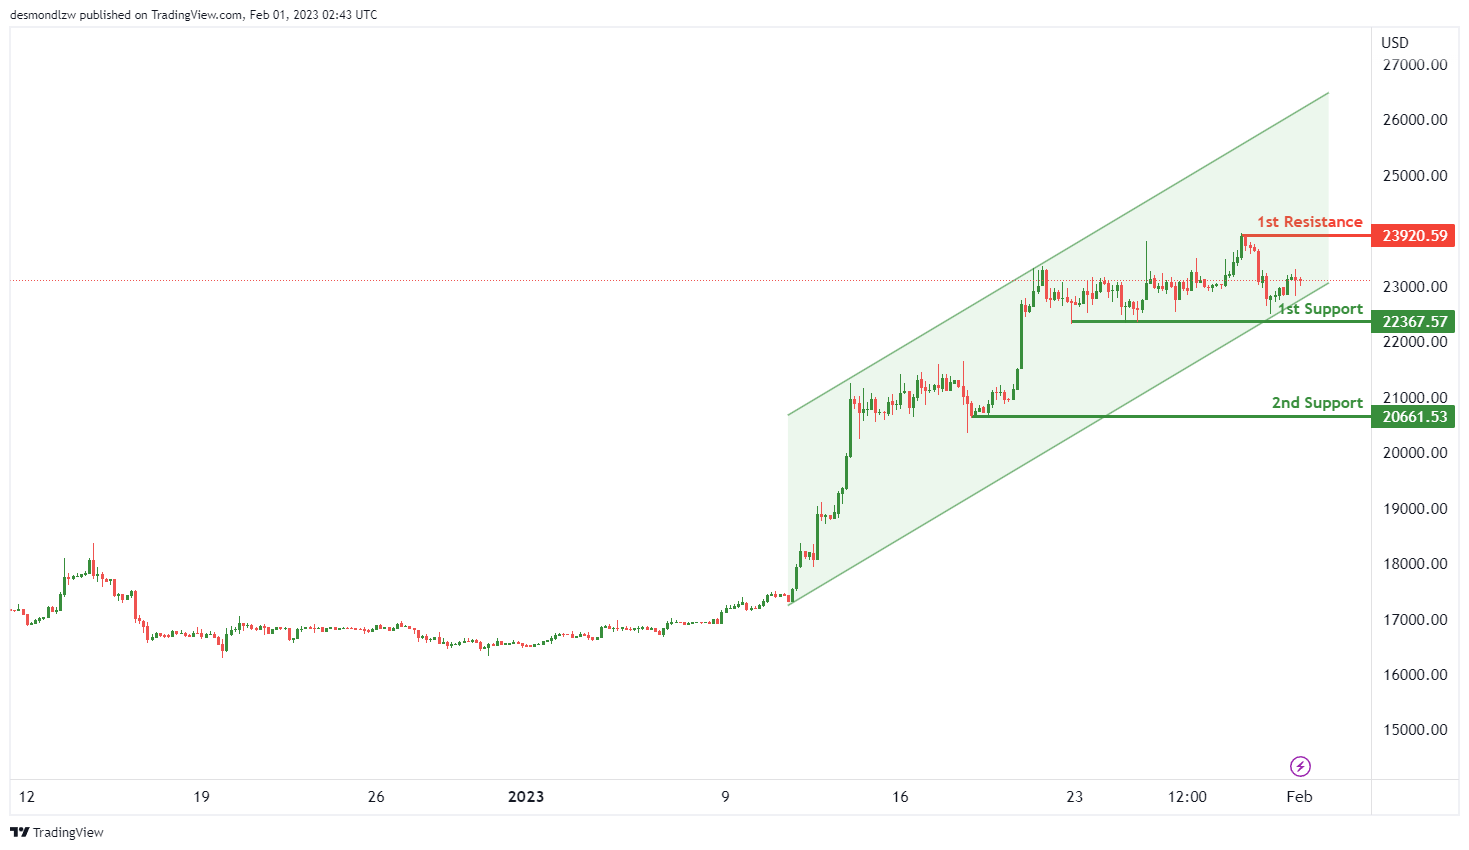
Looking at the H4 chart, my overall bias for BTCUSD is bullish. There is an ascending channel was created, expecting the price head towards the 1st resistance line at 23920.59 whoch is the recent swing high.
In an alternative scenario, the price could possibly head down to the 1st support at 22367.57 before it head towards the 2ns support at 20661.53 which is the previous swing low.
Areas of consideration:
- H4 time frame, 1st resistance 23920.59
- H4 time frame, 1st support at 22367.57
- H4 time frame, 2nd support a 20661.53
S&P 500:
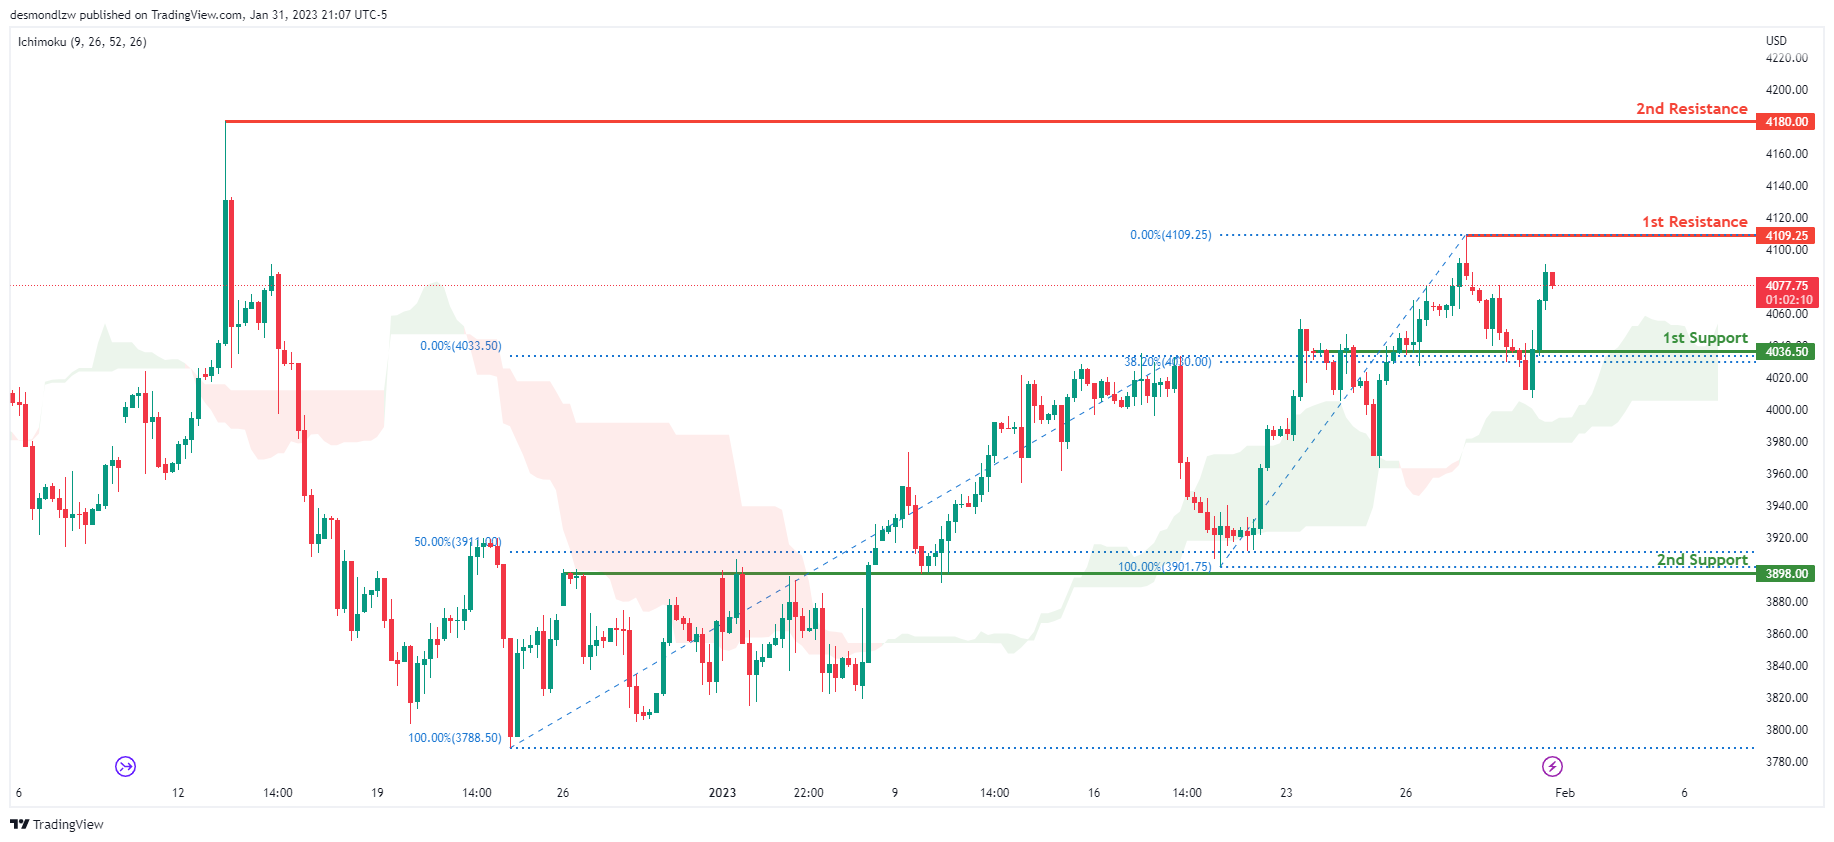
Looking at the H4 chart, my overall bias for S&P500 is bullish due to the current price being above the Ichimoku cloud, indicating a bullish market. If this bullish momentum continues, expect the price to possibly break the 1st resistance at 4109.25, where the recent high is, before heading towards the 2nd resistance at 4180.00, where the previous swing high is. In an alternative scenario, price could possibly head back down to retest the 1st support at 4036.50, where the 38.2% Fibonacci line is.
Areas of consideration:
- H4 time frame, 1st support at 4036.50
- H4 time frame, 1st resistance at 4109.25
- H4 time frame, 1st resistance at 4180.00
Gold Price Could Surge If It Clears This Hurdle
Key Highlights
- Gold price started a fresh increase above the $1,910 resistance.
- A major bearish trend line is forming with resistance near $1,925 on the 4-hours chart.
- EUR/USD and GBP/USD slowly moved lower.
- The US ISM Manufacturing Index could decline from 48.4 to 48.0 in Jan 2023.
Gold Price Technical Analysis
Gold price found support near $1,900 against the US Dollar. The price started a steady increase above the $1,905 and $1,910 levels.
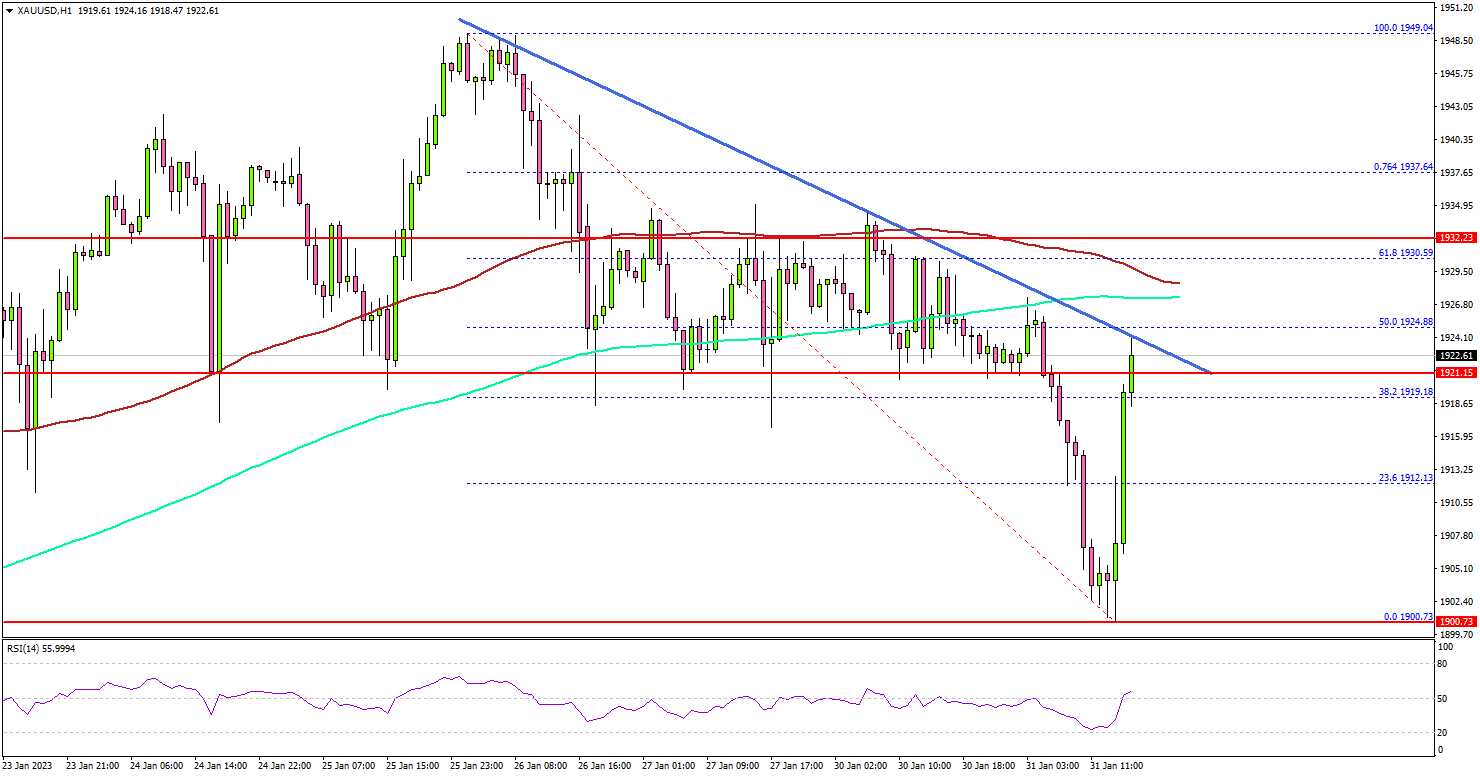
The 4-hours chart of XAU/USD indicates that the price gained pace above the $1,912 resistance zone. There was a clear move above the 38.2% Fib retracement level of the downward move from the $1,949 swing high to $1,900 low.
It is now facing a strong resistance near $1,925. There is also a major bearish trend line forming with resistance near $1,925 on the same chart.
The main resistance is near the $1,930 zone, the 100 simple moving average (red, 4-hours), and the 200 simple moving average (green, 4-hours). A close above the $1,930 level might send the price further higher.
The next major resistance is near the $1,938 level. Any more gains might send the price towards the $1,950 resistance level, above which gold price might visit the $2,000 resistance.
On the downside, an initial support is near the $1,912 level. The next major support is near the $1,905 level. The main support is near $1,900, below which gold price might struggle to stay above the $1,880 zone. In the stated case, gold price could slide towards the $1,850 support.
Looking at EUR/USD, the pair corrected lower below the 1.0850 level and there is a risk of more downsides in the short-term.
Economic Releases to Watch Today
- Germany’s Manufacturing PMI for Jan 2023 - Forecast 47, versus 47 previous.
- Euro Zone Manufacturing PMI for Jan 2023 – Forecast 48.8, versus 48.8 previous.
- UK Manufacturing PMI for Jan 2023 – Forecast 46.7, versus 46.7 previous.
- Euro Zone CPI for Jan 2023 (YoY) (Prelim) - Forecast +9%, versus +9.2% previous.
- Euro Zone Core CPI for Jan 2023 (YoY) (Prelim) - Forecast +5.1%, versus +5.2% previous.
- US Manufacturing PMI for Jan 2023 – Forecast 46.8, versus 46.8 previous.
- US ISM Manufacturing Index for Jan 2023 – Forecast 48.0, versus 48.4 previous.
GOLD ($XAUUSD) Forecasting The Path & Buying The Dips
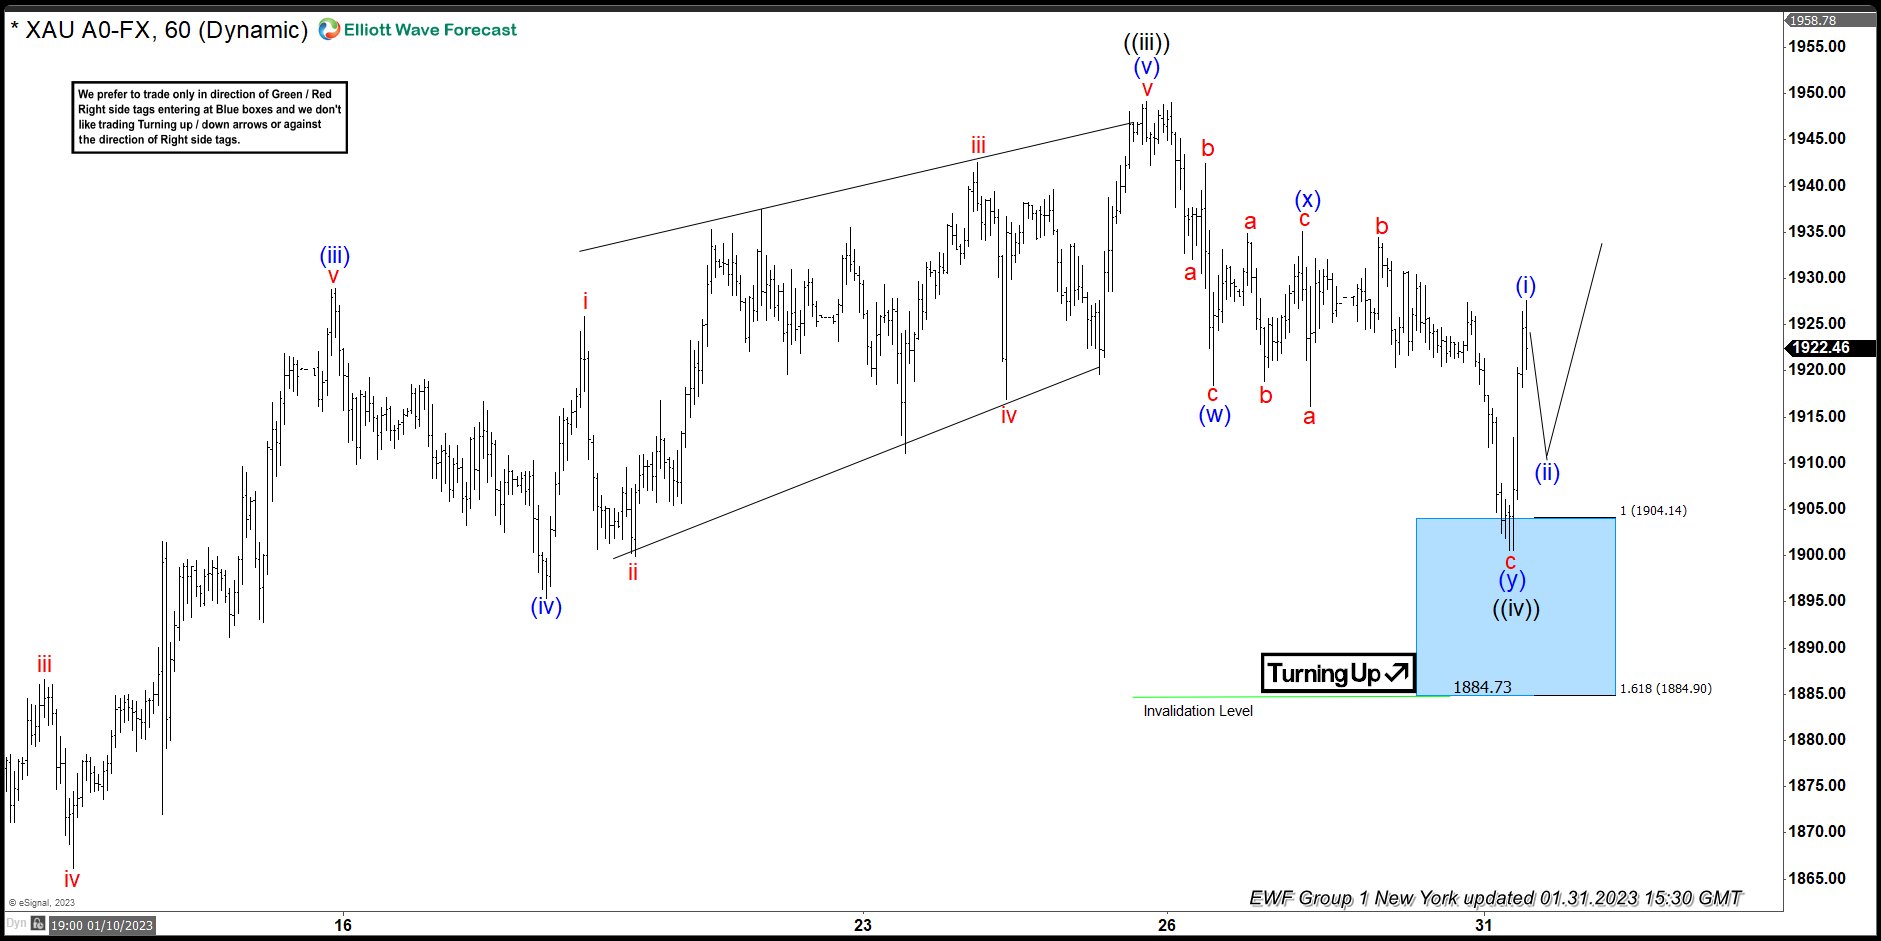
In this article we’re going to take a quick look at the Elliott Wave charts of GOLD, published in members area of the website. As our members know, we have been favoring the long side in the commodity since the September of 2022. We recommended members to avoid selling , while keep favoring the long side. Recently we got 3 waves pull back that has reached our buying zone. In the further text we are going to explain the Elliott Wave Forecast and trading strategy.
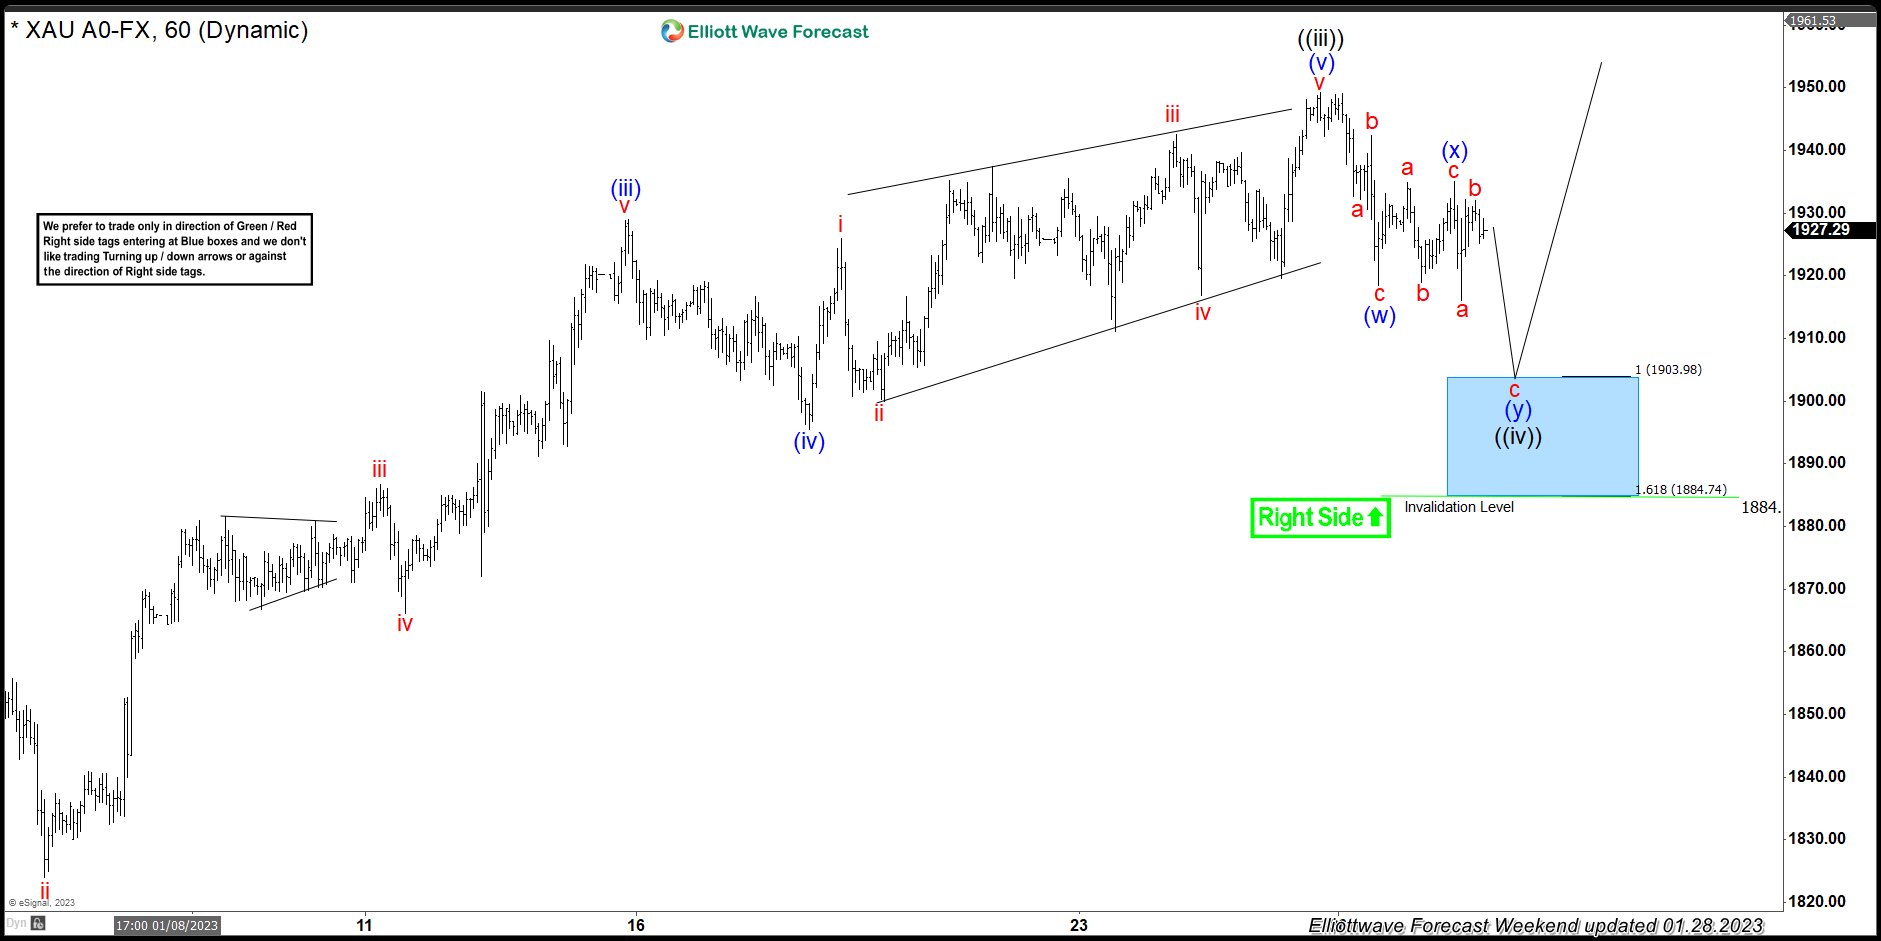
GOLD Elliott Wave 1 Hour Chart 1.28.2023
Current view suggests cycle from the 1726.4 low is still in progress as 5 waves structure. Currently, GOLD is doing wave ((iv)) pull back . The price structure of the pull back looks incomplete, it shows lower low sequences. So far we can count only 5 swings down from the peak. If we assume 6th swing is completed, we could be doing now last push down – 7th swing toward marked zone. Consequently we expect to get more short term weakness toward 1903.98-1884.74 area which would be our next buying zone. We don’t recommend selling the commodity against the main bullish trend. Strategy is waiting for the price to reach blue box- equal legs zone, before entering the long trades again. Once bounce reaches 50 Fibs against the (x) blue high , we will make long position risk free ( put SL at BE) and take partial profits. Invalidation for the long trades is break of 1.618 fib ext : 1884.7
Quick reminder:
Our charts are easy to trade and understand:
Red bearish stamp+ blue box = Selling Setup
Green bullish stamp+ blue box = Buying Setup
Charts with Black stamps are not tradable. 🚫
GOLD Elliott Wave 1 Hour Chart 1.31.2023
GOLD made 7th swing down and reached buying zone at 1903.98-1884.74 ( blue box) as expected. The commodity found buyers at the Blue Box zone and we are getting good reaction from there. The price reached and exceeded 50 fibs against the (x) blue connector. So, members who took the long trade are enjoying profits now in a risk free positions. We would like to see break above ((iii)) black peak to confirm next leg up is in progress.
Keep in mind that market is dynamic and presented view could have changed in the mean time. You can check most recent charts in the membership area of the site. Best instruments to trade are those having incomplete bullish or bearish swings sequences. We put them in Sequence Report and best among them are shown in the Live Trading Room.