Sample Category Title
EUR/USD Mid-Day Outlook
Daily Pivots: (S1) 1.0823; (P) 1.0868; (R1) 1.0898; More…
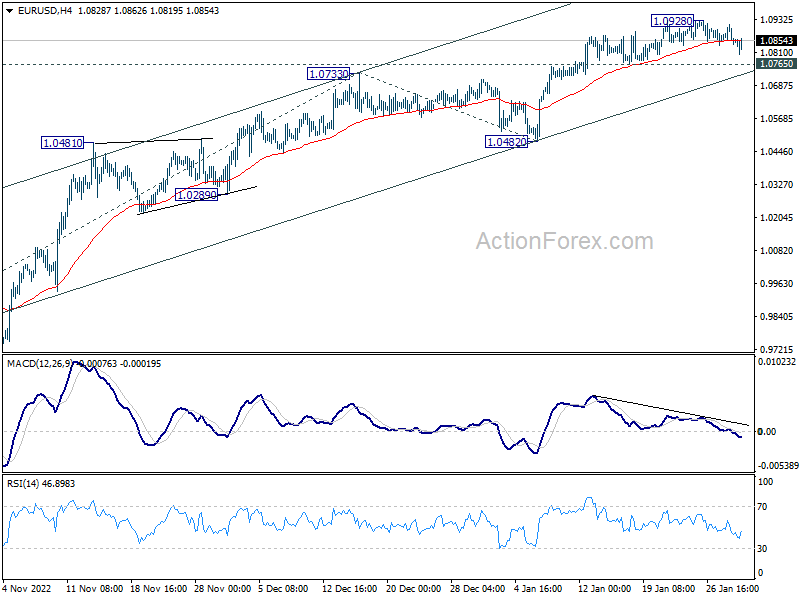
EUR/USD continues to gyrate lower but stays above 1.0765 support, comfortably so far. Intraday bias remains neutral for the moment. With 1.0765 support intact, further rally remains in favor. On the upside, break of 1.0928 will resume larger rise to 61.8% projection of 0.9630 to 1.0733 from 1.0482 at 1.1164 next. On the downside, though, break of 1.0765 support should now confirm short term topping, and turn bias back to the downside for 55 day EMA (now at 1.0601).
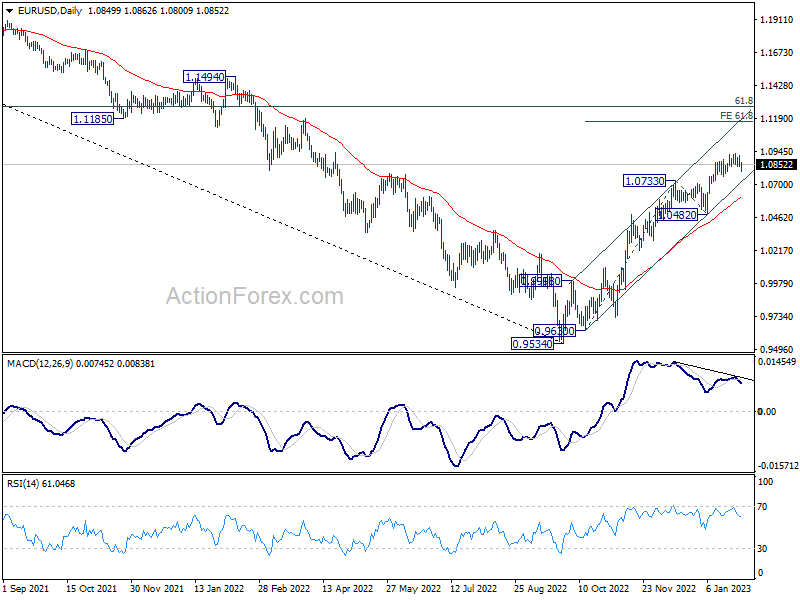
In the bigger picture, current development suggests that the rally from 0.9534 low (2022 low) is a medium term up trend rather than a correction. Further rise is in favor to 61.8% retracement of 1.2348 (2021 high) to 0.9534 at 1.1273 next. This will remain the favored case as long as 1.0482 support holds.
Dollar Recovering But Could It Last? Euro Mixed after GDP
Dollar attempted to extend recovery today but once again lacked follow through momentum. The greenback is mildly supported by slight risk aversion, but lags behind Yen and Swiss Franc. For now, Australian Dollar remains the worst for the day on poor retail sales data, followed by Canadian and New Zealand Dollar. Euro and Sterling are mixed despite better than expected Eurozone GDP. Moves in the financially will likely lacks firepower until tomorrow's FOMC rate decision and statement.
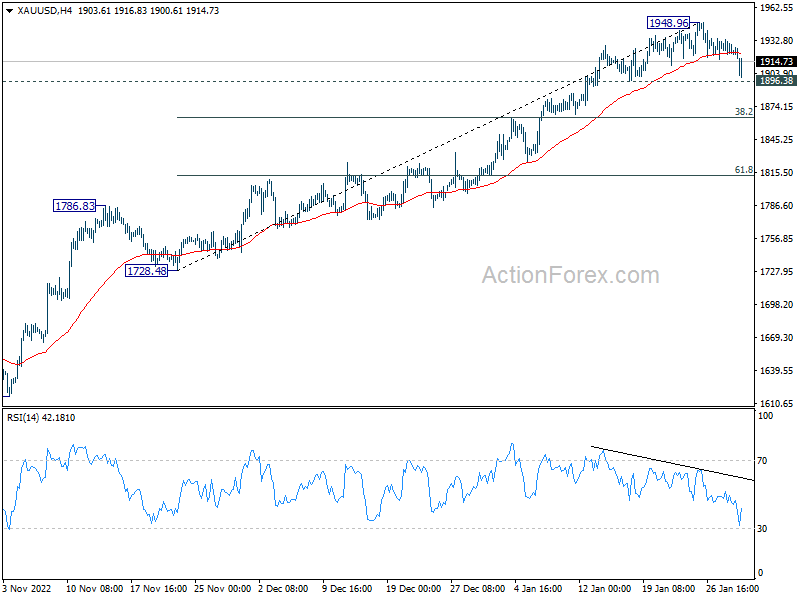
Technically, deeper pull back should be due in Gold considering the extended loss of upside momentum, as seen in 4 hour MACD. Firm break of 1896.38 minor support should confirm short term topping, and bring deeper pull back to 38.2% retracement of 1728.48 to 1948.96 at 1864.73, Ideally, if that happens, it should be accompanied by a stronger rebound in Dollar.
In Europe, at the time of writing, FTSE is down -0.53%. DAX is down -0.32%. CAC is down -0.21%. Germany 10-year yield is down -0.0044 at 2.275. Earlier in Asia, Nikkei dropped -0.39%. Hong Kong HSI dropped -1.03%. China Shanghai SSE dropped -0.42%. Singapore Strait Times dropped -0.37%. Japan 10-year JGB yield rose 0.0178 to 0.499.
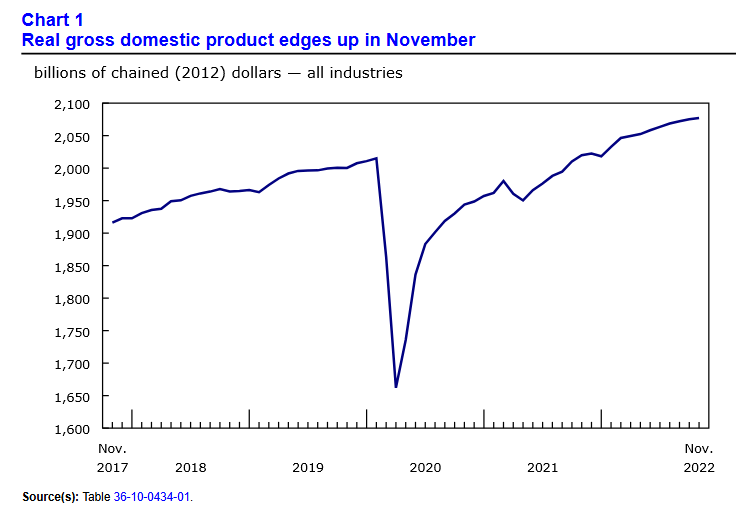
Canada GDP rose 0.1% mom in Nov, to be essentially flat in Dec
Canada GDP grew 0.1% mom in November, matched expectations. Services-producing industries expanded 0.2% mom while goods-producing industries contracted -0.1% mom. 14 of 20 industrial sectors increased in the month.
Advance information indicates that real GDP was essentially unchanged in December. Also for Q4, GDO growth should be 0.4% qoq, 3.8% yoy.
Also released, US employment cost index rose 1.0% in Q4, below expectation of 1.2%. Wages and salaries rose 1.0%. Benefit costs rose 0.8%.
Eurozone GDP grew 0.1% qoq, 1.9% yoy in Q4,
Eurozone GDP grew 0.1% qoq in Q4, better than expectation of -0.2% qoq. Comparing to the same quarter a year ago, GDP rose 1.9% yoy. EU GDP was flat qoq in Q4, up 1.8% yoy. Annual growth in 2022 was 3.5% in Eurozone and 3.6% in EU.
Among the Member States for which data are available for the fourth quarter of 2022, Ireland (+3.5%) recorded the highest increase compared to the previous quarter, followed by Latvia (+0.3%), Spain and Portugal (both +0.2%). The highest declines were recorded in Lithuania (-1.7%) as well as in Austria (-0.7%) and Sweden (-0.6%).
The year-on-year growth rates were positive for all countries except for Sweden (-0.6%) and Lithuania (-0.4%).
France GDP grew 0.1% qoq in Q4, up 2.6% in 2022
France GDP grew 0.1% qoq in Q4, better than expectation of 0.0% qoq. On average over the year 2022, GDP increased by 2.6% (after +6.8% in 2021 and -7.9% in 2020).
This annual growth figure was essentially the result of the rebound in activity in the second and third quarters of 2021, as the health crisis receded. Quarter-on-quarter growth was significantly less dynamic over the year 2022. The growth overhang for 2023 stands at +0.3% at the end of the fourth quarter of 2022.
China official PMI manufacturing rose to 50.1, non-manufacturing up to 54.4
China official PMI Manufacturing rose from 47.0 to 50.1 in December, slightly below expectation of 50.2. PMI Non-Manufacturing jumped from 41.6 to 54.4, above expectation of 51.0. Both indexes were also back in expansion region.
Senior NBS statistician Zhao Qinghe noted that economic activity returned to expansion amid an improvement in the business operation climate and the situation.
“Meanwhile, many companies in the manufacturing and services sectors still reported a lack of market demand is the major concern for their businesses. The foundation of economic recovery still needs to be further consolidated,” he added.
Japan industrial production declined -0.1% mom in Dec, but expected to rebound
Japan industrial production declined -0.1% mom in December, much better than expectation of -0.8% mom. The Ministry of Economy, Trade and Industry retained the assessment from the previous month that industrial production is "weakening." 10 of the 15 industries surveyed, reported decline in output, four reported increase, and one remained unchanged.
Based on a poll of manufacturers, the ministry expects output to remain flat in January, and then grow 4.1% in February. A ministry official said, "we still need to keep a close eye on the influence of a potential spread in coronavirus infections, material shortages and high prices."
Also released, retail sales rose 3.8% yoy in December, above expectation of 3.1% yoy. Unemployment rate was unchanged at 2.5%. housing starts dropped -1.7% yoy. Consumer confidence rose from 30.3 to 31.0 in January.
Australia retail sales turnover down sharply by -3.9% mom in Dec
Australia retail sales turnover dropped sharply by -3.9% mom to AUD 34.47m in December, much worse than expectation of -0.3% mom. That's the first contraction after 11 straight months of growth. Still, sales turnover remained elevated at its sixth highest level on record, and was up 7.5% yoy for the year.
Ben Dorber, ABS head of retail statistics, said: “The large fall in December suggests that retail spending is slowing due to high cost-of-living pressures... The latest Consumer Price Index showed that prices continued to rise strongly in the December quarter. To see the effect of consumer prices on recent turnover growth, it will be important to look at quarterly retail sales volumes which we will release next week."
EUR/USD Mid-Day Outlook
Daily Pivots: (S1) 1.0823; (P) 1.0868; (R1) 1.0898; More…
EUR/USD continues to gyrate lower but stays above 1.0765 support, comfortably so far. Intraday bias remains neutral for the moment. With 1.0765 support intact, further rally remains in favor. On the upside, break of 1.0928 will resume larger rise to 61.8% projection of 0.9630 to 1.0733 from 1.0482 at 1.1164 next. On the downside, though, break of 1.0765 support should now confirm short term topping, and turn bias back to the downside for 55 day EMA (now at 1.0601).
In the bigger picture, current development suggests that the rally from 0.9534 low (2022 low) is a medium term up trend rather than a correction. Further rise is in favor to 61.8% retracement of 1.2348 (2021 high) to 0.9534 at 1.1273 next. This will remain the favored case as long as 1.0482 support holds.
Economic Indicators Update
| GMT | Ccy | Events | Actual | Forecast | Previous | Revised |
|---|---|---|---|---|---|---|
| 23:30 | JPY | Unemployment Rate Dec | 2.50% | 2.50% | 2.50% | |
| 23:50 | JPY | Industrial Production M/M Dec P | -0.10% | -0.80% | 0.20% | |
| 23:50 | JPY | Retail Trade Y/Y Dec | 3.80% | 3.10% | 2.50% | |
| 00:30 | AUD | Private Sector Credit M/M Dec | 0.30% | 0.50% | 0.50% | |
| 00:30 | AUD | Retail Sales M/M Dec | -3.90% | -0.30% | 1.40% | 1.70% |
| 01:00 | CNY | Manufacturing PMI Dec | 50.1 | 50.2 | 47 | |
| 01:00 | CNY | Non-Manufacturing PMI Dec | 54.4 | 51 | 41.6 | |
| 05:00 | JPY | Consumer Confidence Jan | 31 | 30.5 | 30.3 | |
| 05:00 | JPY | Housing Starts Y/Y Dec | -1.70% | 0.50% | -1.40% | |
| 06:30 | EUR | France Consumer Spending M/M Dec | -1.30% | 0.20% | 0.50% | |
| 06:30 | EUR | France GDP Q/Q Q4 P | 0.10% | 0.00% | 0.20% | |
| 07:30 | CHF | Real Retail Sales Y/Y Dec | -2.80% | 2.60% | -1.30% | -1.40% |
| 08:55 | EUR | Germany Unemployment Change Dec | -22K | 5K | -13K | |
| 08:55 | EUR | Germany Unemployment Rate Dec | 5.50% | 5.50% | 5.50% | |
| 09:30 | GBP | Mortgage Approvals Dec | 36K | 44K | 46K | |
| 09:30 | GBP | M4 Money Supply M/M Dec | -0.80% | -0.30% | -1.60% | |
| 10:00 | EUR | Italy GDP Q/Q Q4 P | -0.10% | -0.20% | 0.50% | |
| 10:00 | EUR | Eurozone GDP Q/Q Q4 P | 0.10% | -0.10% | 0.30% | |
| 13:30 | CAD | GDP M/M Nov | 0.10% | 0.10% | 0.10% | |
| 13:30 | USD | Employment Cost Index Q4 | 1.00% | 1.20% | 1.20% | |
| 14:00 | USD | S&P/CS Composite-20 HPI Y/Y Nov | 6.80% | 8.60% | ||
| 14:00 | USD | Housing Price Index M/M Nov | -0.40% | 0.00% | ||
| 14:45 | USD | Chicago PMI Jan | 45.4 | 44.9 | ||
| 15:00 | USD | Consumer Confidence Jan | 109.2 | 108.3 |
Canada GDP rose 0.1% mom in Nov, to be essentially flat in Dec
Canada GDP grew 0.1% mom in November, matched expectations. Services-producing industries expanded 0.2% mom while goods-producing industries contracted -0.1% mom. 14 of 20 industrial sectors increased in the month.
Advance information indicates that real GDP was essentially unchanged in December. Also for Q4, GDP growth should be 0.4% qoq, 3.8% yoy.
Will the FOMC Surprise the Markets?
Information is not investment advice
The Backstory
The first FOMC meeting comes after a buildup of anticipation from traders and investors alike, as the markets await what posture the Fed will take regarding the interest rates; would there be a hike or a cut in interest rates? Recall that the Federal Open Market Committee had previously ended the year 2022 with a 50bps hike, and an indication from Powell, the committee chairman, that the Fed could consider raising interest rates by 75bps in the course of the year 2023.
How does this affect the Forex market?
The interest rates provide insights into the strength of the US Dollar, which helps traders and investors manage their expectations from the currency. Increased rates often lead to increased strength for the Dollar.
What do the charts have to say?
In light of the fundamental breakdown above, we will draw our conclusions from the outlook of price on the charts using price action.
US Dollar - Daily Timeframe
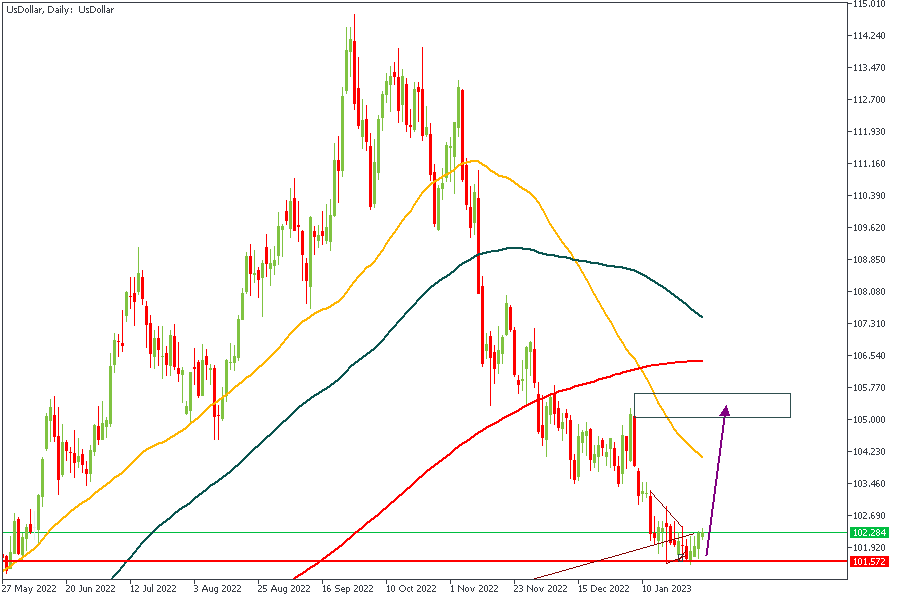
The US Dollar on the Daily timeframe has made an initial reaction off the Daily Pivot as predicted in my previous articles. The reaction seems to have even broken above a miniature trendline resistance, giving us further confidence in the possibility of a bullish price action toward the 50-Day Moving Average as the very least target.
Analyst’s Expectations:
- Direction: Bullish
- Target: 104
- Invalidation: 101.7
EURUSD - Daily Timeframe
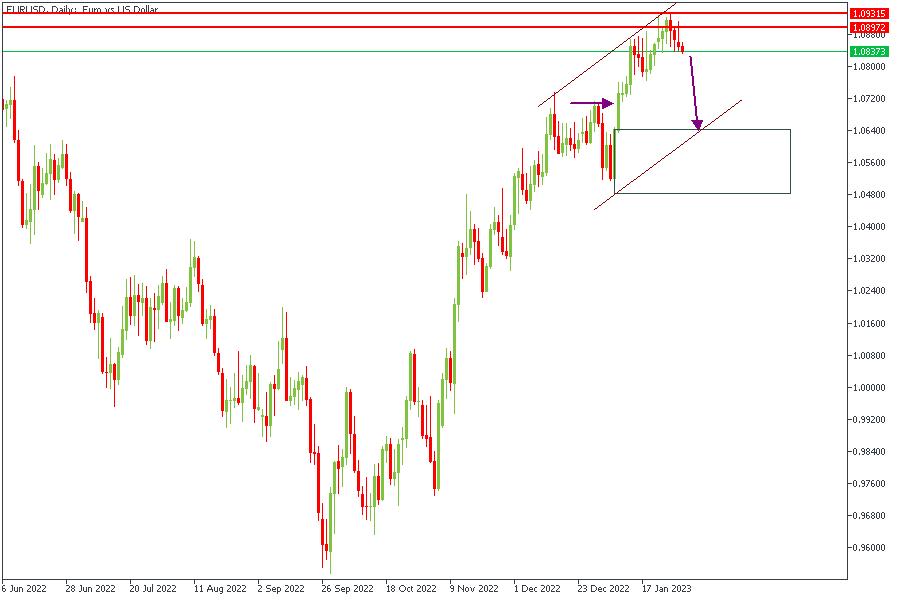
EURUSD has already begun the reaction from the daily pivot and the trendline resistance. As far as I can see, however, price seems to be heading towards the demand zone as marked since it was the "order block" right before price broke the previous high with a bullish FVG (Fair Value Gap).
Analysts’ Expectation:
- Direction: Bearish
- Target: 1.06500
- Invalidation: 1.09201
GBPUSD- Daily Timeframe
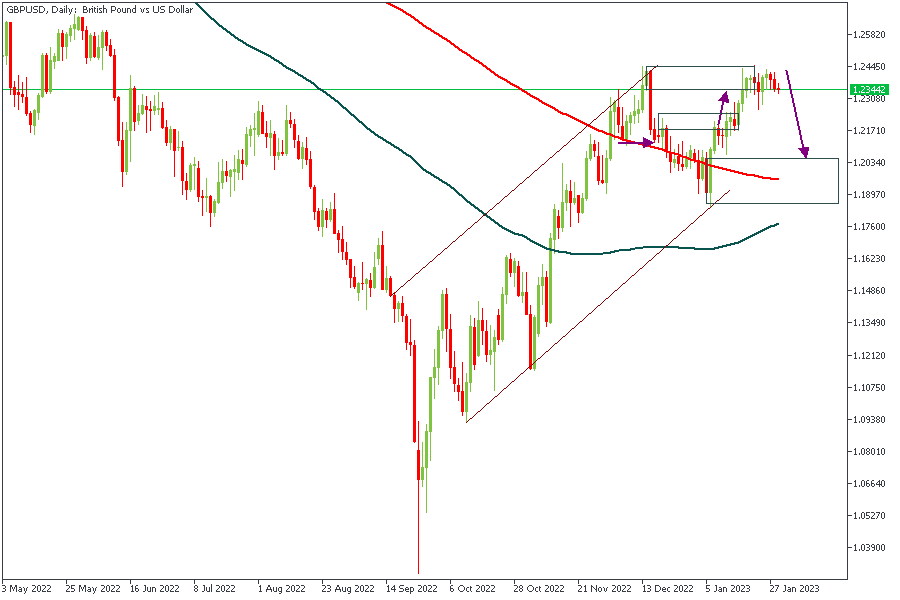
The chart above shows the price action on the daily timeframe of the GBPUSD pair, and similar to what we saw on the EURUSD daily chart, price here is also reacting from an area of resistance. The major clause here, however, is that the reaction is a tad more sluggish than I would have loved to see. The 200-Day moving average could be the next target in view as I expect price to seek out a strong area of support in order to continue its bullish march.
Analyst’s Expectations:
- Direction: Bearish
- Target: 1.20624
- Invalidation: 1.24539
XAUUSD - Daily Timeframe
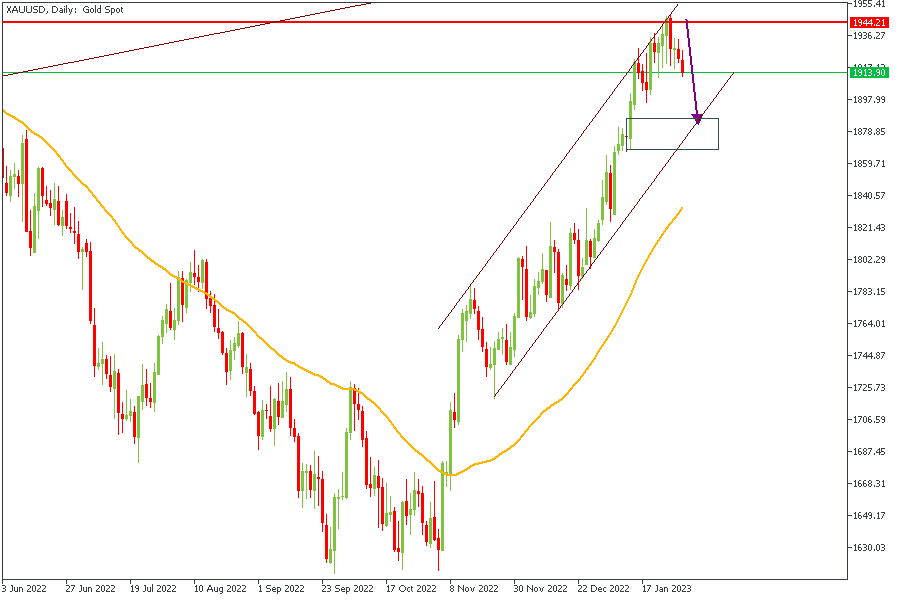
From the Daily pivot zone, XAUUSD has played out a 300-pip bearish reaction. The point of the reaction aligned perfectly with the trendline resistance of the rising channel, indicating the likelihood that price bounces off the trendline support of the same channel to continue its bullish rally... possibly.
Analyst’s Expectations:
- Direction: Bearish
- Target: 1887.8
- Invalidation: 1945
APPLE - Daily Timeframe
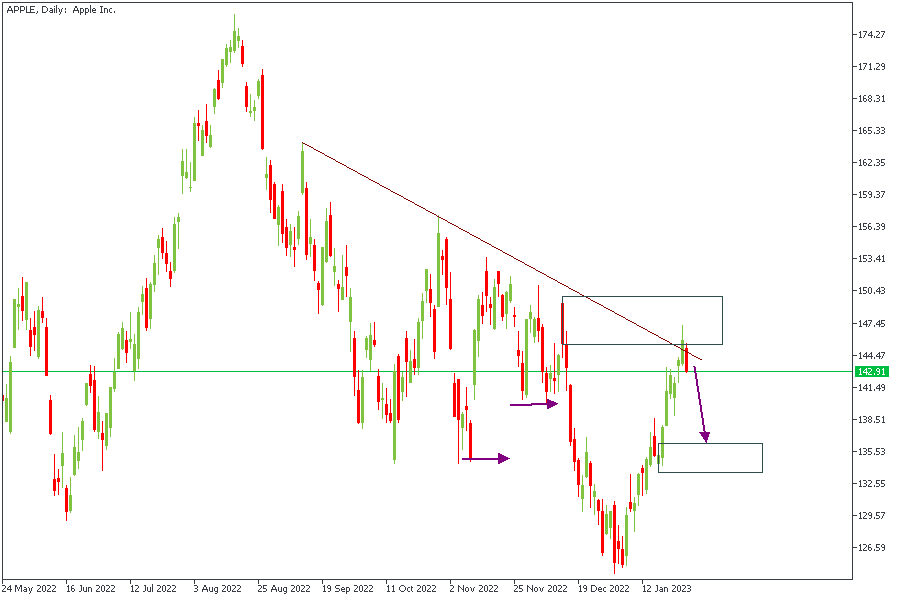
After the bearish break of structure, APPLE stock returned to the rally-base-drop supply zone that prompted the break of structure in the first place. On returning to the supply zone for a retest, price encountered the trendline resistance and was kicked down from that area of confluence. This leads me to expect a brief continuation of that bearish movement to the demand zone I marked below as the primary target.
Analyst’s Expectations:
- Direction: Bearish
- Target: $137
- Invalidation: $148
Important
The trading of CFDs comes at a risk. Thus, to succeed, you have to manage risks properly. To avoid costly mistakes while you look to trade these opportunities, be sure to do your due diligence and manage your risk appropriately.
Packed Week of Risk Events to Inject Life into Markets
The next few days promise to be wild and incredibly eventful for financial markets thanks to a string of central bank decisions, earnings from tech titans, and key economic data releases.
There was already a strong sense of tension in the air as investors digested a barrage of corporate earnings and key reports ahead of the Federal Reserve, Bank of England, and European Central Bank meetings. This unease and overall caution have sapped appetite for risk, sending European shares lower this morning. Given how investors are likely to remain guarded towards riskier assets, US stocks may trade lower later today. In the currency space, the dollar hit its highest level in a week amid the risk-off sentiment while gold slipped bear to $1900 thanks to a stabilising dollar. Oil benchmarks were also under pressure due to the prospect of more rate hikes.
It is safe to say that the events of this week could set the tone for the new trading month of February. Given how markets are expecting the FOMC, BoE, and ECB to make a move, the focus is likely to be on what they say rather than the actions they take. On the earnings front, Apple, Alphabet, and Meta Platforms will be under the spotlight this week with all eyes on their results and growth outlook, especially after the mass layoffs recently announced in US-based tech companies.
What to expect from the Fed?
The Fed is widely expected to raise interest rates by 25 basis points when its meeting ends on Wednesday.
Given how the Fed is widely expected to make such a move, much focus will be directed toward the statement and Fed Chair Powell’s press conference. Powell is expected to strike a hawkish tone which is in contrast to market expectations over the Fed cutting rates near the end of 2023. This means the disconnect between the Fed and markets may add more spice to the pending meeting, as investors seek fresh clues on what to expect from the central bank this year. Dollar bulls could receive further support if Fed hawks dominate the scene. However, if markets fail to buy the hawkish rhetoric and signal for continued rate hikes, this could drag the dollar lower.
ECB Hawks to reign supreme?
Given how inflation remains at uncomfortable levels in Europe, ECB hawks are set to take the lead on Thursday. Markets widely expect the ECB to hike interest rates by 50 basis points with a firmly hawkish Largarde reinforcing expectations for further rate hikes down the road. Before the policy meeting, investors will be presented with the latest January flash inflation figures. If inflation remains at lofty levels, this may fortify expectations around the ECB hiking rates for longer to tame price pressures.
Looking at the technical picture, EURUSD remains under pressure on the daily charts with resistance found around 1.0900. A stronger dollar seems to be fueling the downside with the next level of interest around 1.0770. A potential breakout opportunity could be on the horizon for the currency pair with the outcome of both the Fed and the ECB meetings influencing the near-term outlook.
Currency spotlight: GBPUSD
A hawkish Bank of England could inject sterling bulls with renewed confidence this week. The BoE is expected to raise interest rates by 50 basis points in the face of high inflation. Although the annual rate fell to 10.5% in December, it is still more than five times the bank’s 2% target. Given how a rate rise is widely expected, all eyes will be on the updated growth and inflation forecasts which could offer fresh clues on the pace of policy tightening. Whatever the outcome of the BoE meeting, it could translate to increased pound volatility.
Talking technicals, GBPUSD remains under pressure on the daily charts with prices approaching the 1.2300 level. A breakdown below this point could encourage a decline toward 1.2170 and 1.2120, respectively.
Fed Expected to Hike, But Then What?
The overwhelming consensus is that the Fed will hike by another 25bps at the conclusion of its meeting tomorrow. With such strong agreement among traders and economists, it's unlikely the rate decision itself will move the markets. That is, unless the Fed shocks everyone, including its own members, by not raising by a quarter percentage point.
Therefore, the key driver for markets afterward is likely to be a somewhat more murky factor, which is future expectations. More specifically, there is likely to be a lot of focus on what Powell says following the meeting. And different interpretations of the meanings of certain phrases could produce some choppiness in the market. However, there are some general themes we can point to:
Aligning the expectations
The basic theory that the Fed operates under is that inflation is driven by people's expectations of inflation. That means inflation will rise if people think it will, and vice versa. In order to get inflation down, according to this theory, the Fed needs to keep signaling that it will be aggressive in fighting inflation.
Even as rates have gone up substantially and are butting against where most people see the top rate will be, the theory implies that the Fed needs to keep implying that actions will be taken to keep inflation down. At least until core inflation comes into line with targets. And, for the moment that is far off. Many people have pointed to how the inflation rate has been coming down quite quickly. But the headline inflation number is normally more volatile. As far as the Fed is concerned, the core rate is more important, and that has shown to be a lot more "sticky". As in, sticking high above the target rate, meaning the Fed needs to keep up the pressure to get it down.
The markets vs the Fed
The Fed has broadly communicated that it expects to raise rates to about 5.25% and keep them there for the rest of the year. If it were to raise rates by a quarter point tomorrow, that means one more rate hike (probably in March) and then a long pause. That assumes the US will avoid a recession (even though the Fed acknowledges a certain amount of economic pain).
The market, on the other hand, is expecting the Fed to reverse course relatively quickly, expecting that a recession will take hold at some point this year. That is keeping longer-term interest rates from going up, which means that higher rate hikes aren't translating into as much strength for the dollar as they could have. If the market becomes more convinced the Fed will stick to the higher rates for a long time, then the dollar could get some support.
The environment matters for the currency
But the dollar trades in relation to a basket of currencies, with the biggest components being the Euro and the Pound. Both of those central banks are expected to hike by 50bps on Thursday. Meaning that any strength to the dollar from a rate hike, or even expectations that the Fed could keep hiking beyond current expectations, might be overtaken by what happens in Europe the day after.
All things considered, the general move is for higher interest rates, which typically slows monetary circulation. Which in turn makes a recession more likely. If people keep piling into treasuries as a hedge against a recession, the dollar could continue to weaken, despite rate hikes.
Nasdaq 100 Wave Analysis
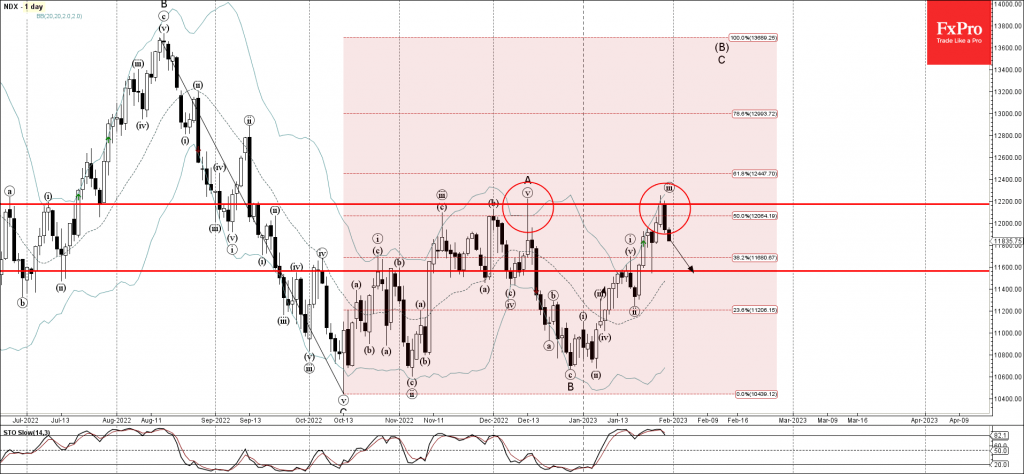
- Nasdaq 100 reversed from pivotal resistance level 12200.00
- Likely to fall to support level 11600.00
Nasdaq 100 index recently reversed from the pivotal resistance level 12200.00 (previous monthly high from December), intersecting with the upper daily Bollinger Band and the 50% Fibonacci correction of the downward impulse from August.
The downward reversal from the resistance level 12200.00 created the daily Japanese candlesticks reversal pattern Bearish Engulfing.
Nasdaq 100 index can be expected to fall further toward the next support level 11600.00 (low of the previous daily Hammer from last week).
NZDUSD Wave Analysis
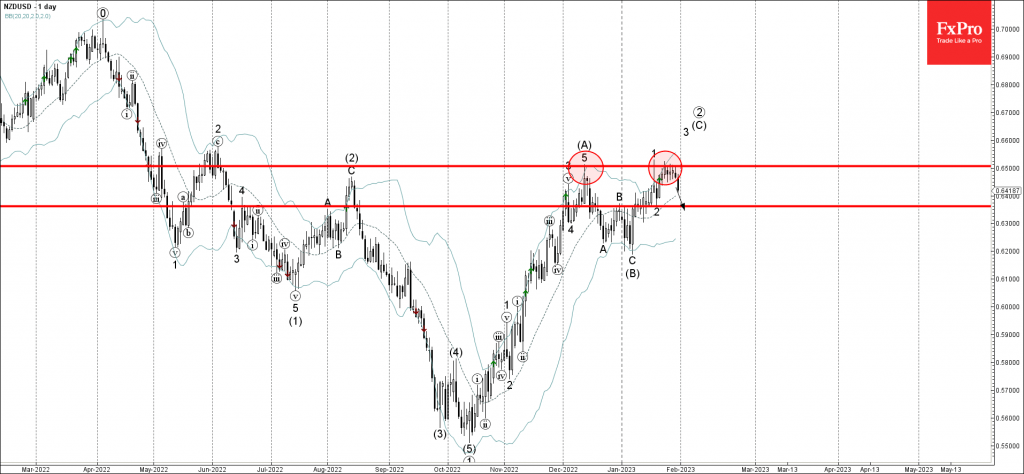
- NZDUSD reversed from resistance level 0.6500
- Likely to fall to support level 0.6360
NZDUSD currency pair recently reversed down from the resistance level 0.6500 (the previous monthly high from last month, which stopped the previous wave (A)).
The resistance level 0.6500 was further strengthened by the upper daily Bollinger Band.
NZDUSD can be expected to fall further toward the next support level 0.6360 (low of the previous short-term correction 2).
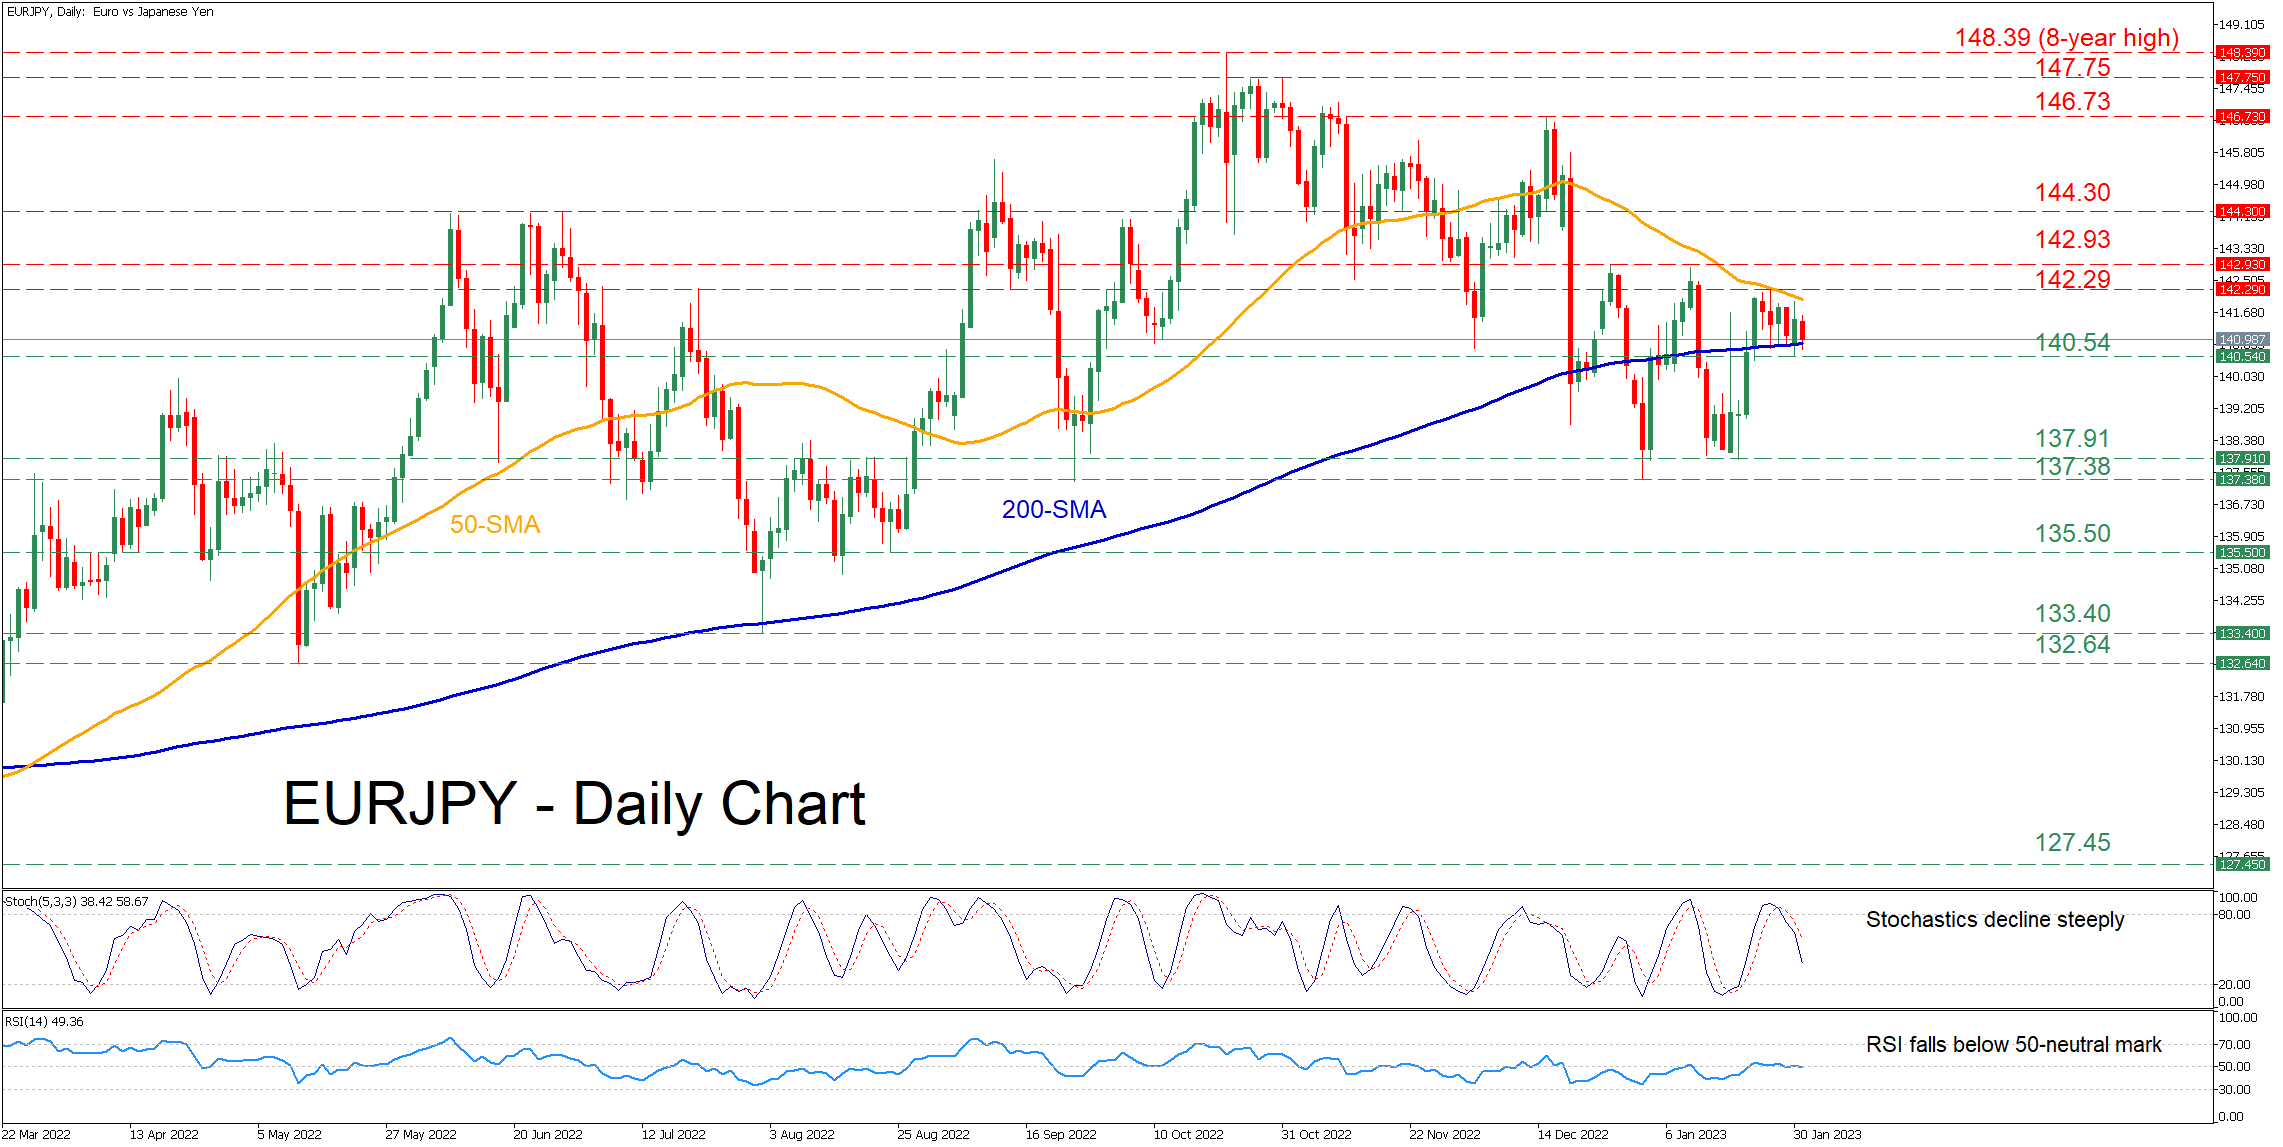
EURJPY Consolidates in Tight Range Between SMAs
EURJPY has been experiencing a downtrend since mid-October when the price peaked at the eight-year high of 148.39. In the short-term, the pair has been moving without a clear direction, currently trading sideways between the 50- and 200-day simple moving averages (SMAs).
The momentum indicators currently suggest that bearish forces are intensifying. Specifically, the stochastic oscillator is descending after posting a bearish cross within the 80-overbought zone, while the RSI crossed below its 50-neutral mark.
If sellers manage to push the price below the 200-day SMA, initial support could be met at the recent low of 140.54. Diving beneath that region, the price could descend towards 137.91 before the 2023 low of 137.38 comes under examination. Violating that zone, the price may then test the 135.50 hurdle.
On the flipside, should the pair break above its sideways pattern, the recent resistance of 142.29 may curb any upside moves. Conquering this barricade, the bulls could aim for 142.93 before the June resistance of 144.30 comes under examination. Even higher, the December high of 146.73 could prove to be a tough obstacle for the price to overcome.
In brief, EURJPY appears unable to escape its tight range, but near-term risks remain tilted to the downside. Hence, a close below the 200-day SMA could spark a significant decline.
JP225 Cash Index at Key Support Area
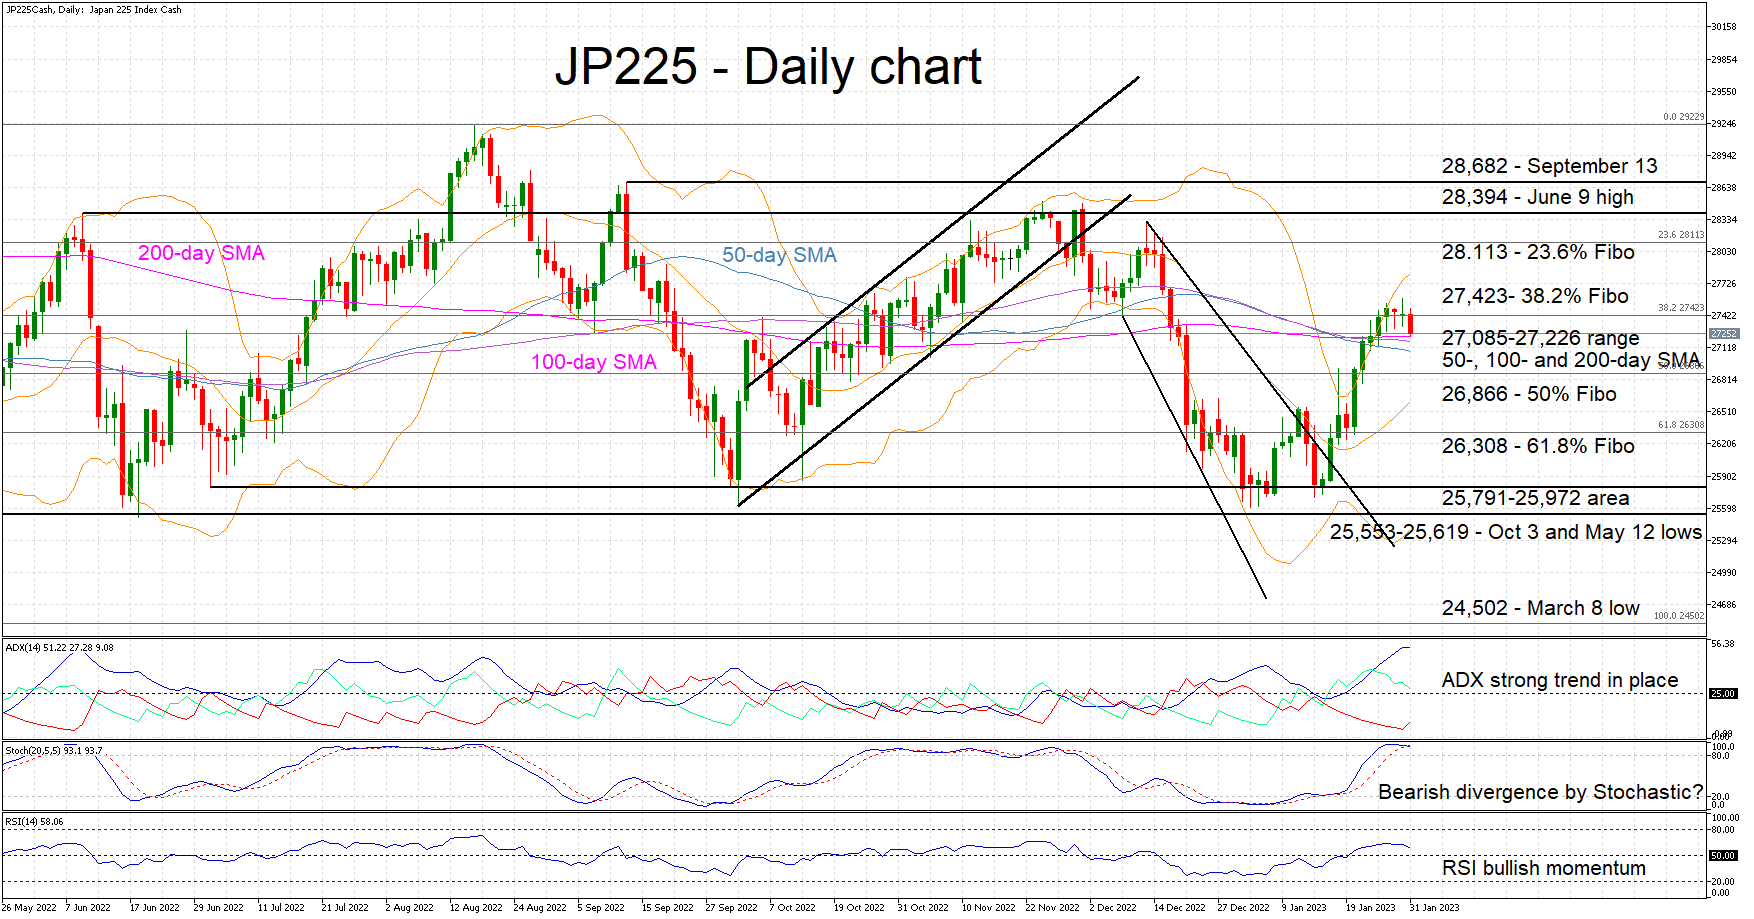
The JP225 cash index is currently testing the 27,085-27,226 area populated by the 50-, 100- and 200-day simple moving averages (SMAs). Today's dip comes after a strong move recorded since the eve of 2023, that was assisted by the descending broadening wedge that formed in the December 13 – January 17 period.
The momentum indicators appear to be sending a mildly bullish signal, but cracks are forming. The RSI is dipping towards 50 and the Average Directional Movement Index (ADX) signals the presence of a strong bullish trend in the market. Similarly, the stochastic oscillator is at the overbought (OB) territory, making a new higher high. However, this high is not reflected in the JP225 price action thus increasing the chances for a bearish divergence. If we add the convergence of the SMAs, then there is an increasing probability for a sizeable move in the JP225 index.
If the bulls manage to retake the market reins and clear the 38.2% Fibonacci retracement level of the March 8 – August 17 uptrend of 27,423, their first target would be the 23.6% Fibonacci retracement of 28,113. Higher, the twin highs of 28,394 and 28,682 could prove tougher to clear.
Should the bears manage to break the trifecta of SMAs, they could face strong support at the 50% and 61.8% Fibonacci retracement at 26,866 and 26,308 respectively. Even lower, the busier 25,791-25,972 area could be targeted.
To sum up, the JP225 cash index is in consolidation mode after a strong move higher. A break below the 27,085-27,226 area could prove decisive for short-term momentum.