Sample Category Title
EUR/USD Dropping from the Upper End of Last Week’s Trading Range
Markets
Spanish (headline) inflation unexpectedly ended a 5-month run of decline (5.8% Y/Y from 5.7% Y/Y) while core inflation accelerated to a new high (7.5% Y/Y from 7% Y/Y). Belgian fell from 10.35% Y/Y to 8.05% Y/Y with lower energy and natural gas prices the sole driver. All underlying inflation gauges (core, services, food,…) continued their uptrend. Both releases set the tone for EMU numbers due on Wednesday and for the ECB meeting on Thursday. French CPI figures will be released, but don’t look for the German ones. They are postponed because of base year changes. Anyway, German Bunds sold off on the inflation outcome, underperforming US Treasuries. German yields rose by 4.9 bps (30-yr) to 10 bps (2-yr). 10-yr yield spreads vs Germany widened by up to 3 bps. US yields added 3.1 bps to 5.1 bps with the belly of the curve underperforming the wings. Towards the end of the US session, the US Treasury updated its quarterly borrowing estimates. They raised the estimate for federal borrowing for the current quarter by a whopping $353bn compared with late October, to $932bn. A lower cash balance at the start of the year, combined with projections for lower tax receipts and bigger spending explain the update. The Treasury kept its cash-balance estimate for the end of March unchanged at $500bn ($570bn currently). For Q2, the Treasury pencils in $278bn of net borrowing. All estimates assume that Congress will raise or suspend the federal debt limit. On Wednesday, the Treasury will announce plans for refunding of longer-term securities. Risk sentiment proved fragile already in European trading and deteriorated during US dealings. Main indices lost 0.75% (Dow) to 2% (Nasdaq). The dollar reacted to the change in mood with EUR/USD dropping from the upper end of last week’s trading range (1.0920) towards the lower end (1.0840). Interestingly: core bonds held near the intraday lows even if oil prices slid as well.
The IMF this morning updated its growth forecasts. Compared with October, it now expects global growth to reach 3.2% by the end of the year (compared to end 2022; up from 2.7%). The chief economist said that 2023 could well present a turning point with economic conditions improving. It marks a stark contrast with previous IMF warnings that a third of the world would enter a recession. Falling energy prices and the opening up of the Chinese economy are the main drivers. On a country level, only the UK is set for contraction this year. The IMF suggested upward risks to inflation which would keep monetary policy tighter than currently discounted by markets. Today’s beheaded eco calendar still contains French CPI data, Q4 EMU GDP numbers, US Chicago PMI and consumer confidence. We expect yesterday’s trading dynamics to remain at play.
News and views
Australian retail turnover surprisingly dropped 3.9% M/M in December, coming after a 1.7% rise in November. It was the first negative reading after 11 consecutive rises. Retail turnover remains elevated overall as it holds at the sixth highest level in the series and was 7.5% higher through the year. Changes in seasonal patterns around Black Friday played a role in monthly dynamics. Even so, the fall suggests retail spending is slowing due to high cost-of-living pressures. Department stores had the largest fall (-14.3%), followed by clothing, footwear and personal accessory retailing (-13.1%), household goods retailing (-7.8%) and other retailing (-4.6%). Food retailing was the only industry to record a rise (+0.3%). Given the impact of technical issues (seasonal adjustment), RBA policy won’t be derailed, especially after higher than expected inflation (7.8% Y/Y) reported earlier this month. The Australian 2-y yield declines only -1 bp. AUD/USD eases to 0.704, but this mainly mirrors a global USD rebound.
Chinese activity rebounded sharply in January as the economy reopened after lifting Covid restrictions. The overall composite PMI returned north of the 50 boom-or bust level, from 42;6 to 52.9. The index was in contraction territory during the three previous months. Activity in the manufacturing sector improved as expected, from 47.0 to 50.1. The non-manufacturing sector (including services and construction) showed an impressive rebound up from 41.6 to 54.4. The recovery was mainly driven by domestic demand. Also expectations for business activity jumped sharply, both for manufacturing and non-manufacturing. Export orders/external demand remains in contraction territory. The yuan this morning trades little changed against a broadly strong dollar (currency USD/CNY 6.75).
Fed, and Earnings
Stock investors kicked off the week on a cautious note, as the Federal Reserve (Fed) is expected to kill joy when it announced its latest decision tomorrow, and earnings announcements may not save the day.
Some profit taking
US equities kicked off the week on a negative note, as many investors preferred booking profits before the deluge of earnings announcements and the Fed decision.
And they are certainly not wrong to be scared, because the Fed expectations became increasingly dovish in January, as investors saw the easing inflation figures combined with softening economic activity.
The S&P500 gave back 1.30% on Monday. The index is still above the 2022 bearish trend and above the 200-DMA, but we can’t rely on Jerome Powell to keep the party going; only stronger-than-expected earnings, and ideally sufficiently good profit guidance from companies could do it – and spitting out a good guidance won’t be a piece of cake for a good amount of them.
Crude Oil down despite strong China PMI, encouraging IMF growth forecast
US crude fell 2% yesterday and slipped below the 50-DMA this morning.
Interestingly, however, the latest news on the macro front is not bad, at all. The Chinese reopening is now well reflected through the first set of economic data. Released today, both the manufacturing and services PMI jumped into the expansion zone.
And the cherry on top, the IMF raised its growth forecast for this year by 0.2% to 2.9% citing the resilience of US spending and the Chinese reopening.
This is the kind of news that the energy markets normally cheer. But not this time, apparently.
Won’t call victory over inflation
The US dollar is gaining some positive momentum into the Fed meeting, as investors know that the Fed won’t declare victory over inflation despite the falling inflation, and position accordingly.
Why? Because the trend could reverse suddenly.
The Spanish inflation came as a punch to the Europeans’ face yesterday as it advanced to 5.8% in January instead of falling to 4.7% as expected. French and German readings could reveal similar surprises.
And nothing guarantees that the same U-turn won’t happen in the US. Gasoline prices surged 12.5% over the past month on the back of winter storms and a rising global demand – partly thanks to the ban on Russian oil and the Chinese reopening, and food price inflation remains high.
So, the Fed will certainly hike by 25bp, but there is little chance it will announce the end of the tightening.
And Jerome Powell will certainly try to calm down market joy – given that the actual market environment suggests that the financial conditions in the US have become as loose as last February, before the Fed started tightening its purse’s strings.
And the more the market fights the Fed, the more aggressive the Fed should become to achieve what they need to achieve.
In summary, the Fed will likely reveal that there will be at least one more rate hike, or two more rate hikes to go before pause.
And that simply ‘s’ could make all the difference.
Focus on Inflation
Market movers today
After the upside surprise in Spanish inflation figures yesterday, the focus turns towards the preliminary inflation data from France today. Please note, that the release of German CPI, which was also originally scheduled for today, has been postponed until next week due to technical problems.
We will also get the euro area flash GDP data for Q4 today, we are looking for 0.2% q/q contraction in line with the German figures yesterday.
In the afternoon, US employment cost index will be released for Q4, while Chicago PMI and Conference Board's consumer confidence indicator will be released for January. We expect the January figures to paint a slightly less negative picture in line with the PMIs released earlier.
Overnight, the Chinese Caixin Manufacturing PMI is also due for release.
The 60 second overview
Inflation is back in focus after the higher than expected Spanish inflation data yesterday. Today, we will get French inflation data while the German inflation data has been postponed due to a technical factor. The response to the higher Spanish inflation data was a sell-off in the European bond market as well as equity markets.
This morning we have seen the sell-off in Asian equity markets as the equity market prepares for tighter monetary policy from both the Federal Reserve and the ECB. Given the Spanish inflation data the risk is that the terminal rate expectations for ECB will be raised from 3.5% to e.g, 4% despite the weak growth data we have seen from both Spain last week and from Germany yesterday.
FI: European yields and interest rates rose yesterday on the back of higher than expected Spanish inflation data. Today, we will get French inflation data, but the German data has been postponed due to technical issues. The higher inflation data confirms the 50bp hike from ECB on Thursday and adds to the expectations for a higher terminal rate than 4%.
FX: High-frequency return correlation shows that repricing of relative monetary policy has been a key driver in many G10 crosses recently, emphasising the importance of this week's central bank decisions. SEK and NOK are underperforming EUR and USD, where EUR/SEK challenges critical levels around 11.30 and EUR/NOK equally critical levels around 10.83. EUR/USD at lower end of the range around 1.0840.
Credit: Credit spreads were marginally softer yesterday, with iTraxx Main widening 2bp to 80bp and Xover some 10bp wider to 416bp. Meanwhile issuance in the primary market continued as issuers seemed eager to get deals done before this week's central bank meetings. The deals that came to the market included a four-tranche EUR deal by IBM and also in FIG space there was decent activity with three senior bonds placed as well as one Tier 2.
Nordic macro
The Riksdag Committee on Finance will hold an open hearing on financial stability in the Swedish economy in the light of high inflation and higher interest rates with the Financial Stability Council, including Riksbank Governor Erik Thedéen and Minister for Financial Markets Niklas Wyman. This constitutes Thedéen's first publicly accessible 'outing' as new Riksbank governor, and it is widely anticipated. With more than 7 days left until the Riksbank's policy meeting (8 Feb), he still has the opportunity to answer questions on monetary policy, so this at least has the potential to be quite interesting from a market perspective.
Today's Norges Bank announcement on the fiscal FX transactions for February mark a point of heightened uncertainty and volatility - both for NOK FX spot but not least for the FX swap market where ois basis could move considerably upon announcement. On the one hand, last week's revision to NB's structural liquidity projections revealed a NOK 30bn larger oil tax payment than expected (drainage of liquidity). This would in isolation suggest a need for NB to increase its daily NOK selling pace by roughly 150M for the year.
On the other hand, natural gas price futures for 2023 are almost 30% lower compared to one month ago which would suggest considerably lower petroleum revenues later in 2023 and hence a smaller NOK selling need (oil futures are marginally higher). Ultimately, it boils down to how proactive the Ministry of Finance is. Will they only take into account "realised" tax payments or will they to an increasing extent proactively incorporate lower energy prices? Today could prove an important bellwether as to the revised reaction function.
An unchanged amount would trigger the lowest market reaction followed by the scenario where the NOK FX sales amount is lifted modestly. By far the biggest market reaction would come in the scenario where NB announced a lower NOK FX sales need as this could trigger both a rise in NOK FX spot and not least a move higher in short-end NOK FRA/Nowa spreads.
AUD/USD Daily Outlook
Daily Pivots: (S1) 0.7034; (P) 0.7077; (R1) 0.7103; More…
AUD/USD's break of 0.7061 minor support suggests short term topping at 0.7141, ahead of 61.8% projection of 0.6169 to 0.6892 from 0.6721 at 0.7168. Intraday bias is back on the downside for 0.6871 support, for further to 55 day EMA (now at 0.6832). On the upside, firm break of 0.7141 will resume the rally from 0.6169 to 0.7304 fibonacci level.
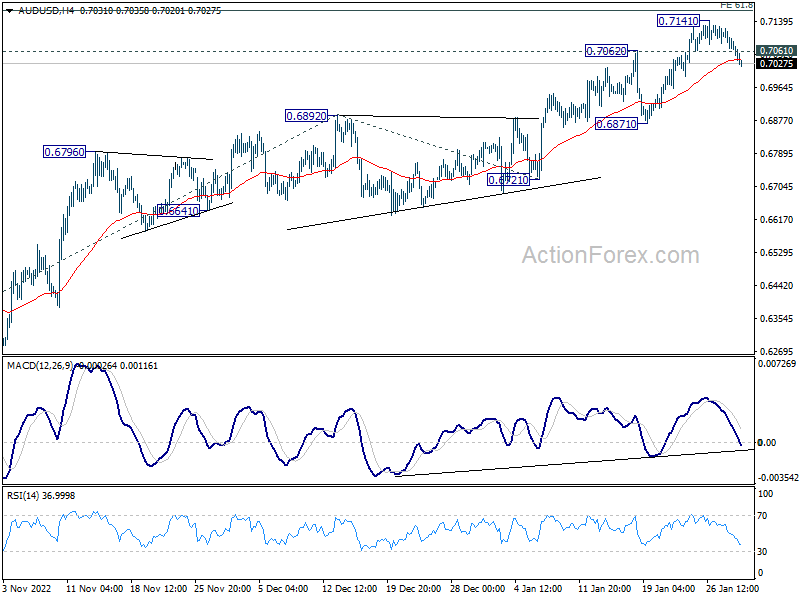
In the bigger picture, corrective decline from 0.8006 (2021 high) should have completed with three waves down to 0.6169 (2022 low). Further rally should be seen to 61.8% retracement of 0.8006 to 0.6169 at 0.7304. Sustained break there will pave the way to retest 0.8006. This will now remain the favored case as long as 0.6721 support holds.
Markets Stay Cautious Shrugging Positive China Data, Dollar and Yen Recover
Yen and Dollar are both in recovery mode in Asian session, as investor continued to turn cautious ahead of the three central bank meetings of Fed, BoE and ECB later in the week. Asian markets shrugged of better than expected PMI data from China, which indicated a return to expansion in both manufacturing and non-manufacturing activities. Aussie was weighed down further by surprisingly deep contraction in retail sales. For now, commodity currencies are the worst performers while European majors are mixed.
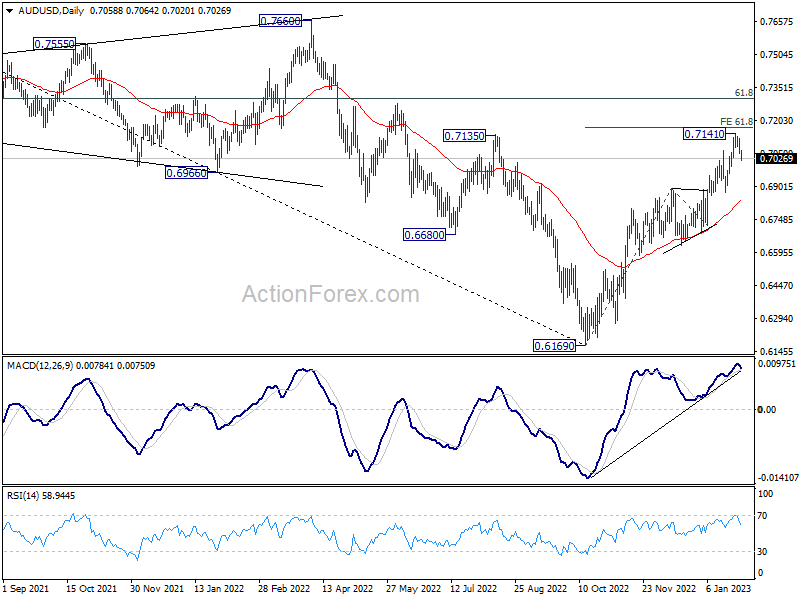
Technically, as the greenback is trying to recovery, focuses will be on some resistance levels for indication of short term bottoming, and a more sustainable rebound. The levels include 1.0765 minor support in EUR/USD, 1.2252 support in GBP/USD, and 131.56 resistance in USD/JPY. These levels need to be taken out in tandem to confirm the underlying buying momentum of Dollar.
In Asia, Nikkei closed down -0.39%. Hong Kong HSI is down -1.63%. China Shanghai SSE is down -0.42%. Singapore Strait Times is down -0.62%. Japan 10-year JGB yield is up 0.013 at 0.494, marching back to BoJ's 0.5% cap. Overnight, DOW dropped -0.77%. S&P 500 dropped -1.30%. NASDAQ dropped -1.96%. 10-year yield 0.033 to 3.551.
France GDP grew 0.1% qoq in Q4, up 2.6% in 2022
France GDP grew 0.1% qoq in Q4, better than expectation of 0.0% qoq. On average over the year 2022, GDP increased by 2.6% (after +6.8% in 2021 and -7.9% in 2020).
This annual growth figure was essentially the result of the rebound in activity in the second and third quarters of 2021, as the health crisis receded. Quarter-on-quarter growth was significantly less dynamic over the year 2022. The growth overhang for 2023 stands at +0.3% at the end of the fourth quarter of 2022.
China official PMI manufacturing rose to 50.1, non-manufacturing up to 54.4
China official PMI Manufacturing rose from 47.0 to 50.1 in December, slightly below expectation of 50.2. PMI Non-Manufacturing jumped from 41.6 to 54.4, above expectation of 51.0. Both indexes were also back in expansion region.
Senior NBS statistician Zhao Qinghe noted that economic activity returned to expansion amid an improvement in the business operation climate and the situation.
“Meanwhile, many companies in the manufacturing and services sectors still reported a lack of market demand is the major concern for their businesses. The foundation of economic recovery still needs to be further consolidated,” he added.
Japan industrial production declined -0.1% mom in Dec, but expected to rebound
Japan industrial production declined -0.1% mom in December, much better than expectation of -0.8% mom. The Ministry of Economy, Trade and Industry retained the assessment from the previous month that industrial production is "weakening." 10 of the 15 industries surveyed, reported decline in output, four reported increase, and one remained unchanged.
Based on a poll of manufacturers, the ministry expects output to remain flat in January, and then grow 4.1% in February. A ministry official said, "we still need to keep a close eye on the influence of a potential spread in coronavirus infections, material shortages and high prices."
Also released, retail sales rose 3.8% yoy in December, above expectation of 3.1% yoy. Unemployment rate was unchanged at 2.5%. housing starts dropped -1.7% yoy. Consumer confidence rose from 30.3 to 31.0 in January.
Australia retail sales turnover down sharply by -3.9% mom in Dec
Australia retail sales turnover dropped sharply by -3.9% mom to AUD 34.47m in December, much worse than expectation of -0.3% mom. That's the first contraction after 11 straight months of growth. Still, sales turnover remained elevated at its sixth highest level on record, and was up 7.5% yoy for the year.
Ben Dorber, ABS head of retail statistics, said: “The large fall in December suggests that retail spending is slowing due to high cost-of-living pressures... The latest Consumer Price Index showed that prices continued to rise strongly in the December quarter. To see the effect of consumer prices on recent turnover growth, it will be important to look at quarterly retail sales volumes which we will release next week."
Looking ahead
Eurozone GDP and Germany CPI flash are the main features in European session. Later in the day, Canada GDP will be released. US will also publish employment cost index, house price indexes, Chicago PMI and consumer confidence.
AUD/USD Daily Outlook
Daily Pivots: (S1) 0.7034; (P) 0.7077; (R1) 0.7103; More…
AUD/USD's break of 0.7061 minor support suggests short term topping at 0.7141, ahead of 61.8% projection of 0.6169 to 0.6892 from 0.6721 at 0.7168. Intraday bias is back on the downside for 0.6871 support, for further to 55 day EMA (now at 0.6832). On the upside, firm break of 0.7141 will resume the rally from 0.6169 to 0.7304 fibonacci level.
In the bigger picture, corrective decline from 0.8006 (2021 high) should have completed with three waves down to 0.6169 (2022 low). Further rally should be seen to 61.8% retracement of 0.8006 to 0.6169 at 0.7304. Sustained break there will pave the way to retest 0.8006. This will now remain the favored case as long as 0.6721 support holds.
Economic Indicators Update
| GMT | Ccy | Events | Actual | Forecast | Previous | Revised |
|---|---|---|---|---|---|---|
| 23:30 | JPY | Unemployment Rate Dec | 2.50% | 2.50% | 2.50% | |
| 23:50 | JPY | Industrial Production M/M Dec P | -0.10% | -0.80% | 0.20% | |
| 23:50 | JPY | Retail Trade Y/Y Dec | 3.80% | 3.10% | 2.50% | |
| 00:30 | AUD | Private Sector Credit M/M Dec | 0.30% | 0.50% | 0.50% | |
| 00:30 | AUD | Retail Sales M/M Dec | -3.90% | -0.30% | 1.40% | 1.70% |
| 01:00 | CNY | Manufacturing PMI Dec | 50.1 | 50.2 | 47 | |
| 01:00 | CNY | Non-Manufacturing PMI Dec | 54.4 | 51 | 41.6 | |
| 05:00 | JPY | Consumer Confidence Jan | 31 | 30.5 | 30.3 | |
| 05:00 | JPY | Housing Starts Y/Y Dec | -1.70% | 0.50% | -1.40% | |
| 06:30 | EUR | France Consumer Spending M/M Dec | -1.30% | 0.20% | 0.50% | |
| 06:30 | EUR | France GDP Q/Q Q4 P | 0.10% | 0.00% | 0.20% | |
| 07:30 | CHF | Real Retail Sales Y/Y Dec | 2.60% | -1.30% | ||
| 08:55 | EUR | Germany Unemployment Change Dec | 5K | -13K | ||
| 08:55 | EUR | Germany Unemployment Rate Dec | 5.50% | 5.50% | ||
| 09:30 | GBP | Mortgage Approvals Dec | 44K | 46K | ||
| 09:30 | GBP | M4 Money Supply M/M Dec | -0.30% | -1.60% | ||
| 10:00 | EUR | Italy GDP Q/Q Q4 P | -0.20% | 0.50% | ||
| 10:00 | EUR | Eurozone GDP Q/Q Q4 P | -0.10% | 0.30% | ||
| 13:00 | EUR | Germany CPI M/M Jan P | -0.30% | -0.80% | ||
| 13:00 | EUR | Germany CPI Y/Y Jan P | 8.80% | 8.60% | ||
| 13:30 | CAD | GDP M/M Nov | 0.20% | 0.10% | ||
| 13:30 | USD | Employment Cost Index Q4 | 1.20% | 1.20% | ||
| 14:00 | USD | S&P/CS Composite-20 HPI Y/Y Nov | 6.80% | 8.60% | ||
| 14:00 | USD | Housing Price Index M/M Nov | -0.40% | 0.00% | ||
| 14:45 | USD | Chicago PMI Jan | 45.4 | 44.9 | ||
| 15:00 | USD | Consumer Confidence Jan | 109.2 | 108.3 |
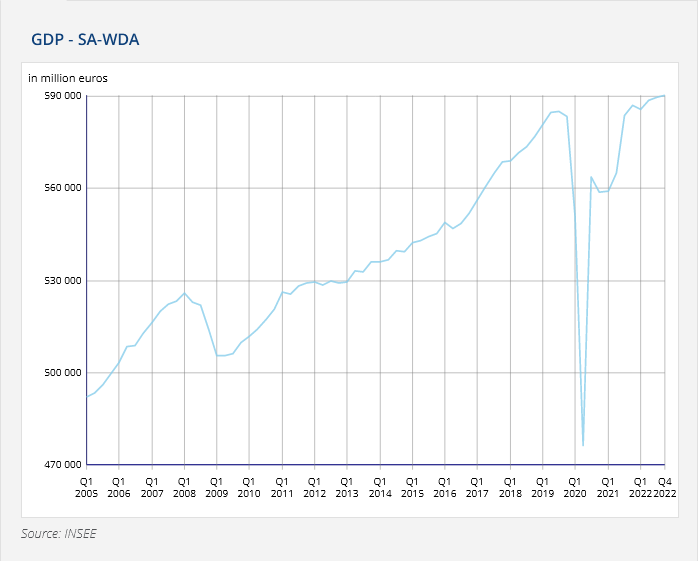
France GDP grew 0.1% qoq in Q4, up 2.6% in 2022
France GDP grew 0.1% qoq in Q4, better than expectation of 0.0% qoq. On average over the year 2022, GDP increased by 2.6% (after +6.8% in 2021 and -7.9% in 2020).
This annual growth figure was essentially the result of the rebound in activity in the second and third quarters of 2021, as the health crisis receded. Quarter-on-quarter growth was significantly less dynamic over the year 2022. The growth overhang for 2023 stands at +0.3% at the end of the fourth quarter of 2022.
China official PMI manufacturing rose to 50.1, non-manufacturing up to 54.4
China official PMI Manufacturing rose from 47.0 to 50.1 in December, slightly below expectation of 50.2. PMI Non-Manufacturing jumped from 41.6 to 54.4, above expectation of 51.0. Both indexes were also back in expansion region.
Senior NBS statistician Zhao Qinghe noted that economic activity returned to expansion amid an improvement in the business operation climate and the situation.
“Meanwhile, many companies in the manufacturing and services sectors still reported a lack of market demand is the major concern for their businesses. The foundation of economic recovery still needs to be further consolidated,” he added.
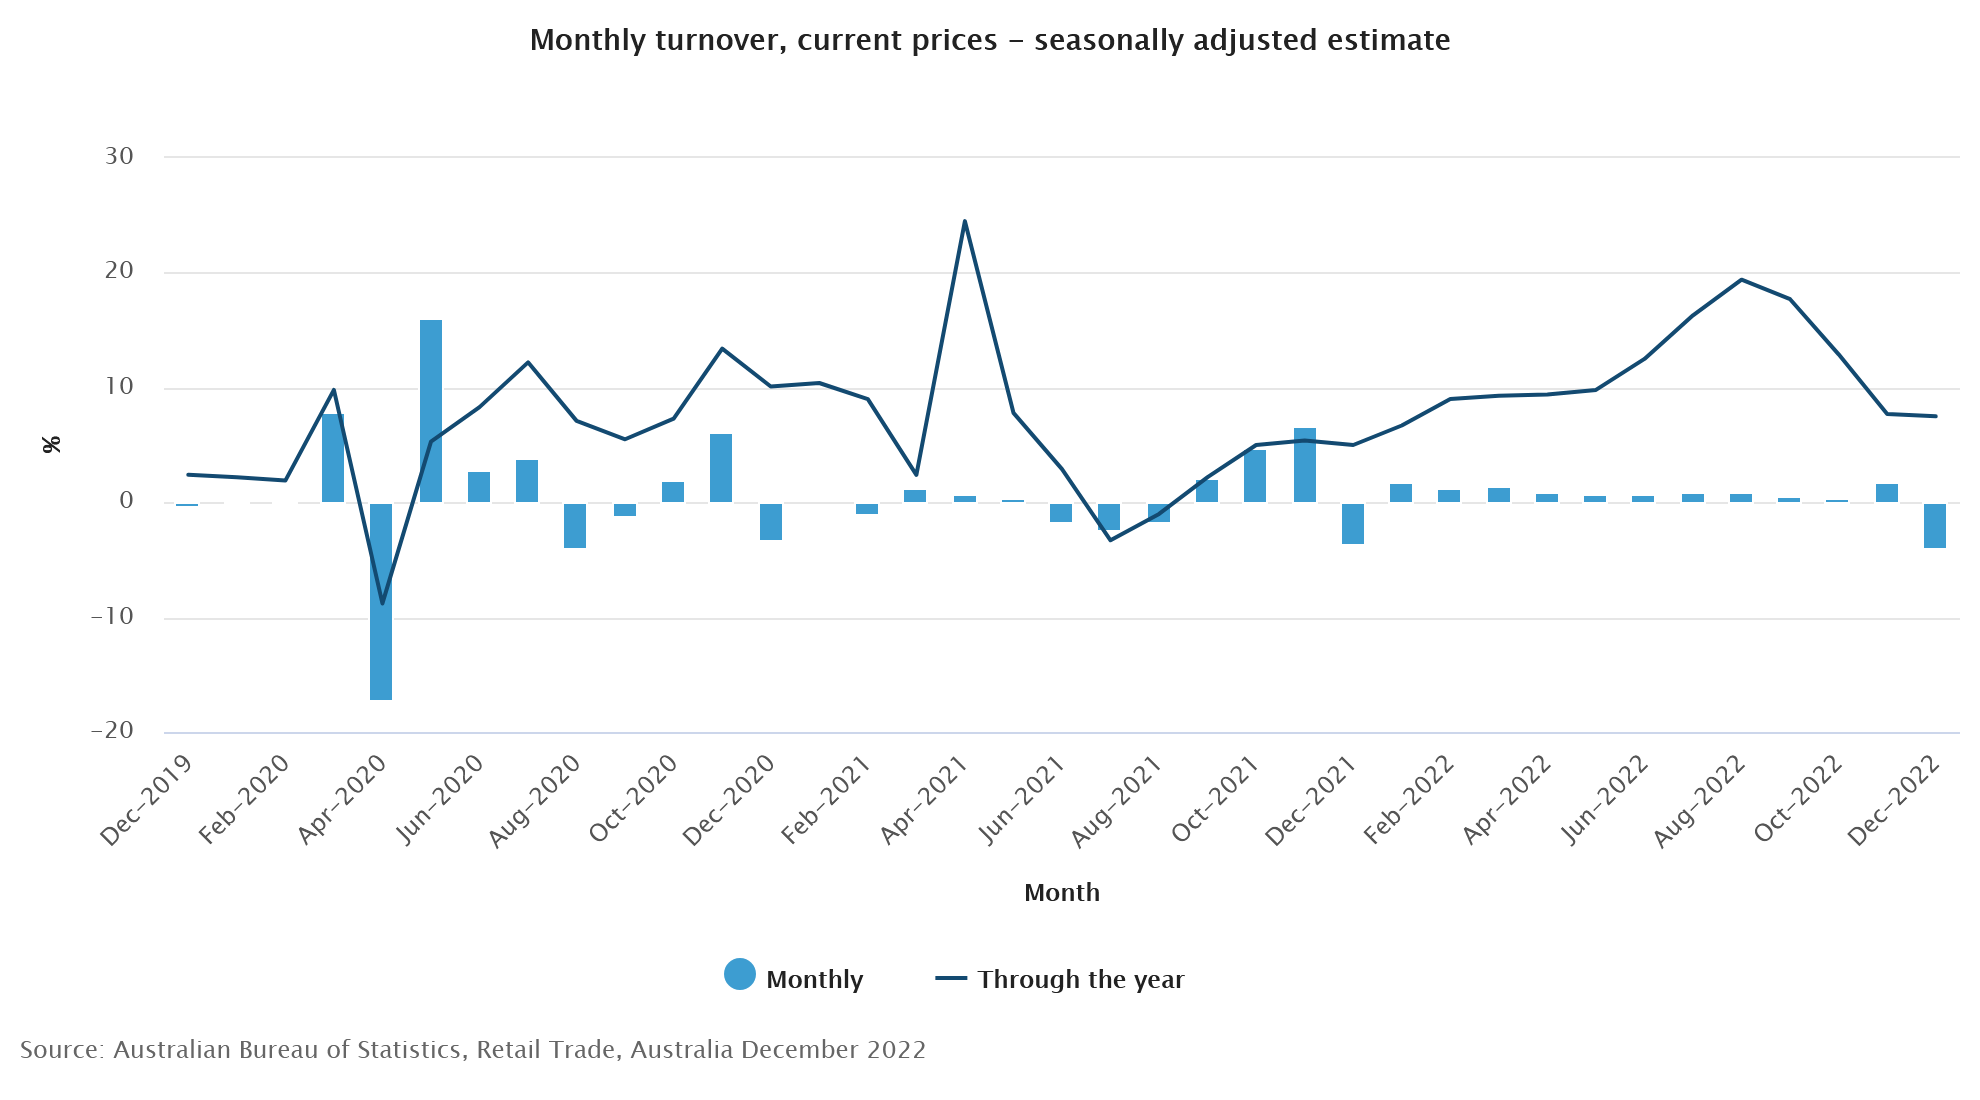
Australia retail sales turnover down sharply by -3.9% mom in Dec
Australia retail sales turnover dropped sharply by -3.9% mom to AUD 34.47m in December, much worse than expectation of -0.3% mom. That's the first contraction after 11 straight months of growth. Still, sales turnover remained elevated at its sixth highest level on record, and was up 7.5% yoy for the year.
Ben Dorber, ABS head of retail statistics, said: “The large fall in December suggests that retail spending is slowing due to high cost-of-living pressures... The latest Consumer Price Index showed that prices continued to rise strongly in the December quarter. To see the effect of consumer prices on recent turnover growth, it will be important to look at quarterly retail sales volumes which we will release next week."
Japan industrial production declined -0.1% mom in Dec, but expected to rebound
Japan industrial production declined -0.1% mom in December, much better than expectation of -0.8% mom. The Ministry of Economy, Trade and Industry retained the assessment from the previous month that industrial production is "weakening." 10 of the 15 industries surveyed, reported decline in output, four reported increase, and one remained unchanged.
Based on a poll of manufacturers, the ministry expects output to remain flat in January, and then grow 4.1% in February. A ministry official said, "we still need to keep a close eye on the influence of a potential spread in coronavirus infections, material shortages and high prices."
Also released, retail sales rose 3.8% yoy in December, above expectation of 3.1% yoy. Unemployment rate was unchanged at 2.5%. housing starts dropped -1.7% yoy. COnsumer confidence rose from 30.3 to 31.0 in January.
Technical Outlook and Review
USD/JPY:
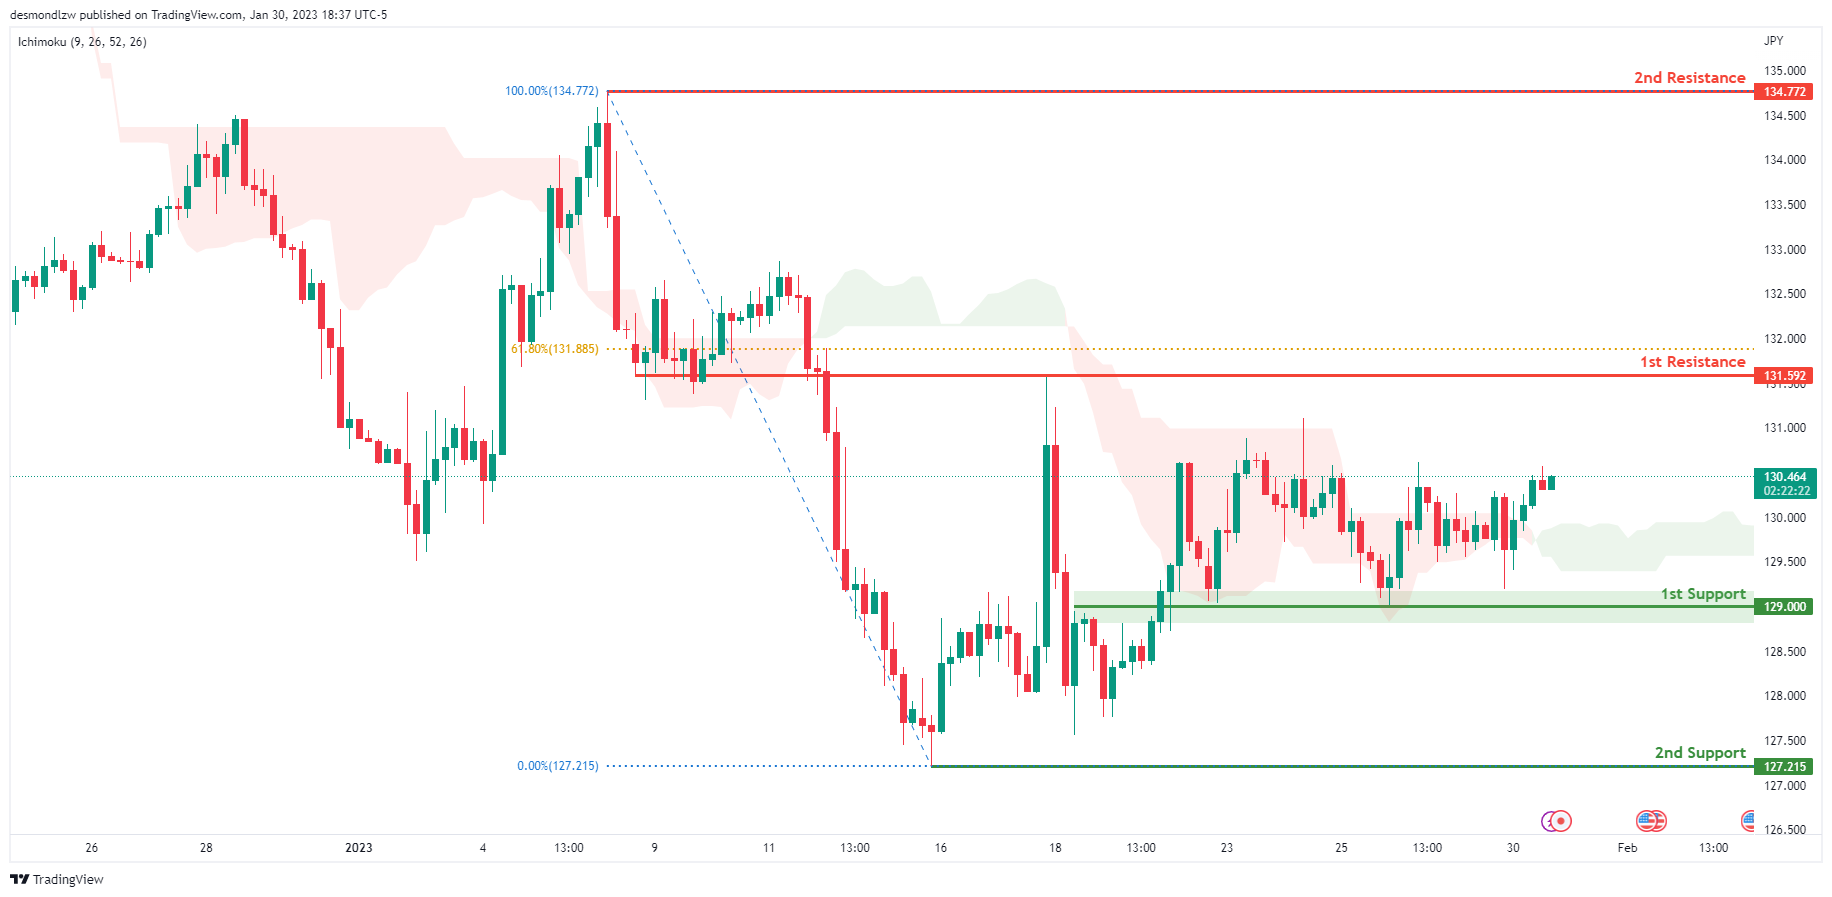
Looking at the H4 chart, my overall bias for USDJPY is bullish due to the current price crossing above the Ichimoku cloud, indicating a bullish market. If this bullish momentum continues, expect the price to possibly continue heading towards the 1st resistance level at 131.592, where the 61.8% Fibonacci line is. In an alternate scenario, price could possibly head back down to retest the 1st support at 129.000, where the overlap support is.
Areas of consideration:
- H4 time frame, 1st resistance at 131.592
- H4 time frame, 1st support at 129.000
DXY:
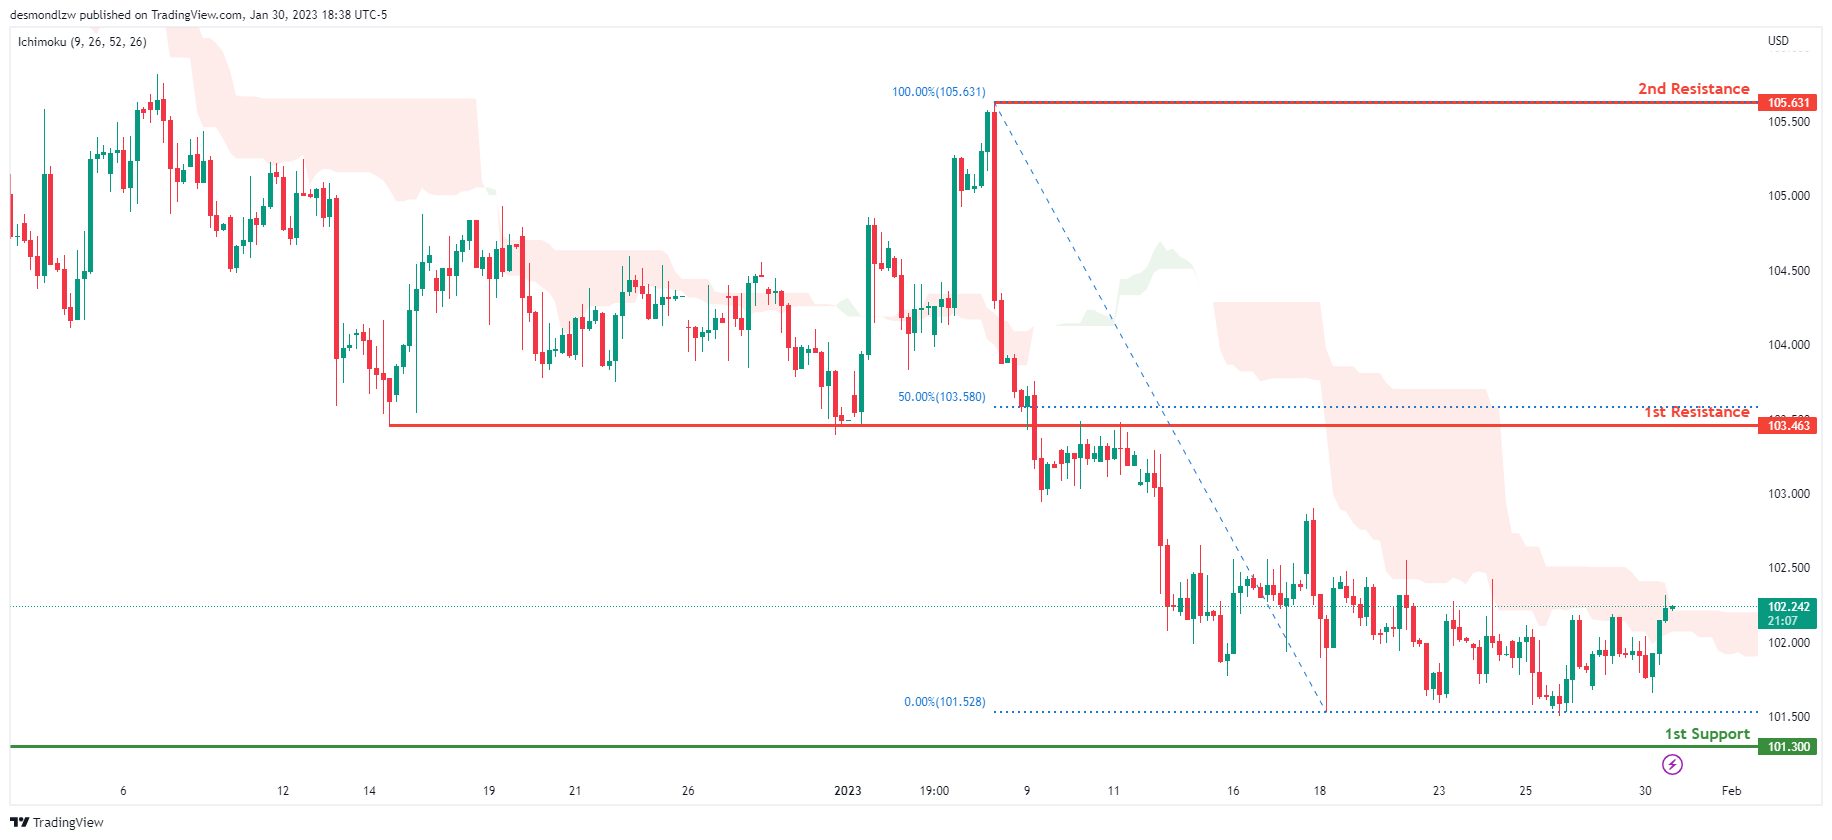
Looking at the H4 chart, my overall bias for DXY is bearish due to the current price being below the Ichimoku cloud, indicating a bearish market. If this bearish momentum continues, expect the price to possibly continue heading towards the 1st support at 101.300, where the previous swing low is. In an alternative scenario, price could head back up to retest the 1st resistance at 103.463, where the overlap resistance and 50% Fibonacci line is.
Areas of consideration:
- H4 time frame, 1st resistance at 103.463
- H4 time frame, 1st support at 101.300
EUR/USD:
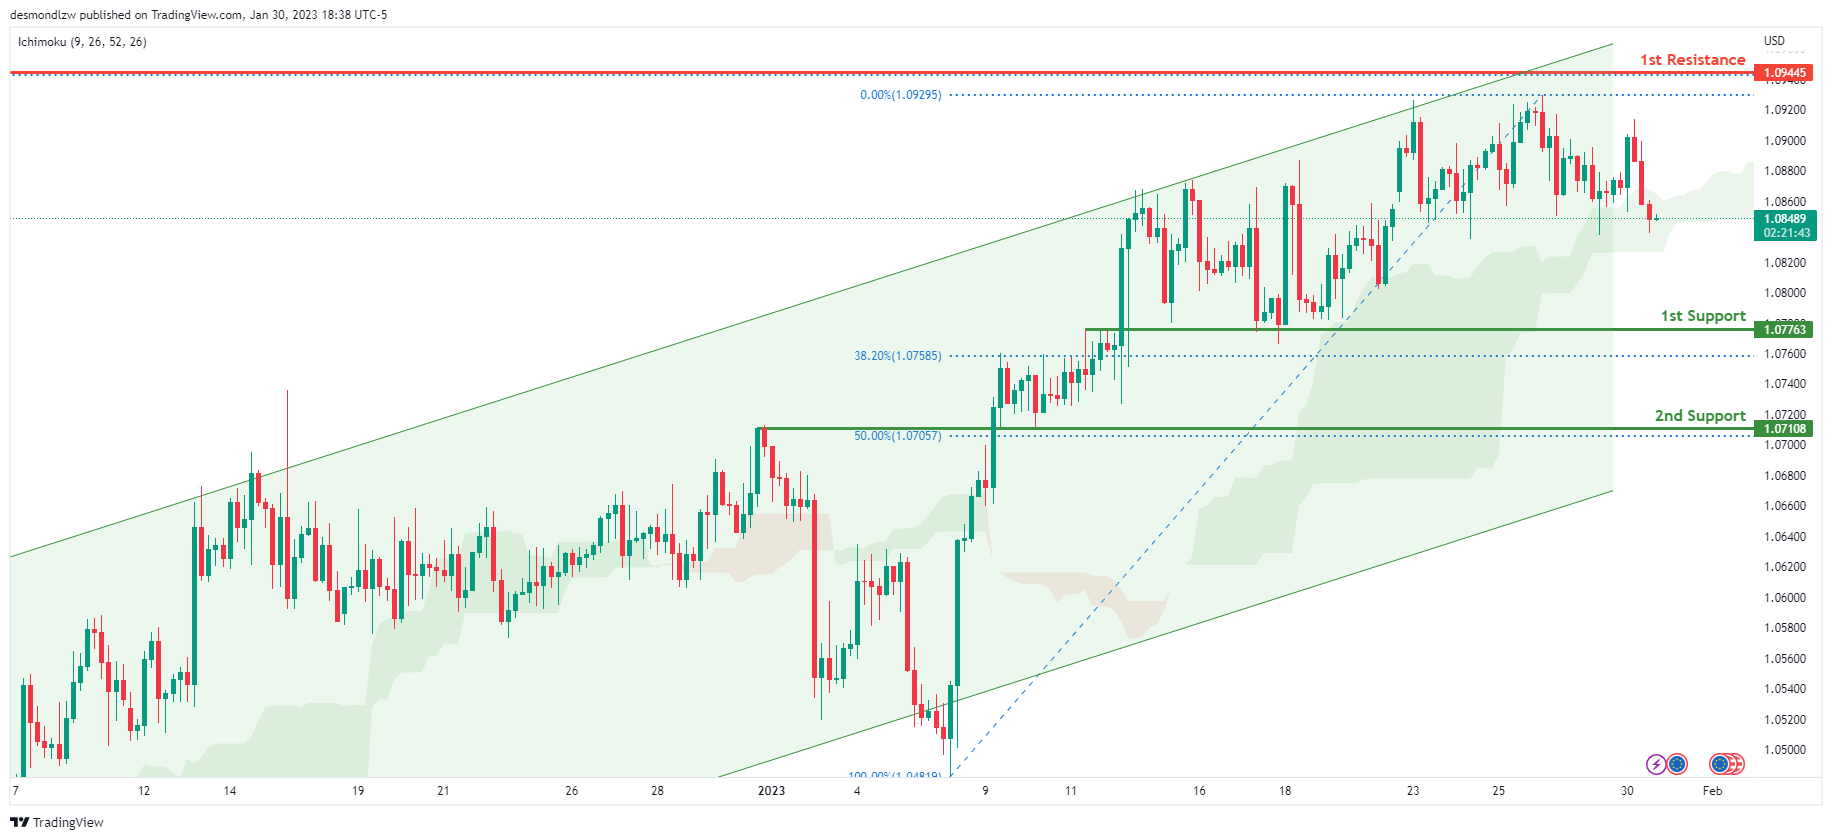
Looking at the H4 chart, my overall bias for EURUSD is bullish due to the current price being above the Ichimoku cloud, indicating a bullish market structure. To add confluence to this bias, price is also within an ascending channel. If this bullish momentum continues, expect the price to possibly continue heading towards the 1st resistance at 1.09445, where the 50% Fibonacci line is. In an alternate scenario, price could possibly head back down to retest the 1st support level at 1.07763, where the 38.2% Fibonacci line is.
Areas of consideration :
- H4 1st resistance at 1.09445
- H4 1st support at 1.07763
GBP/USD:
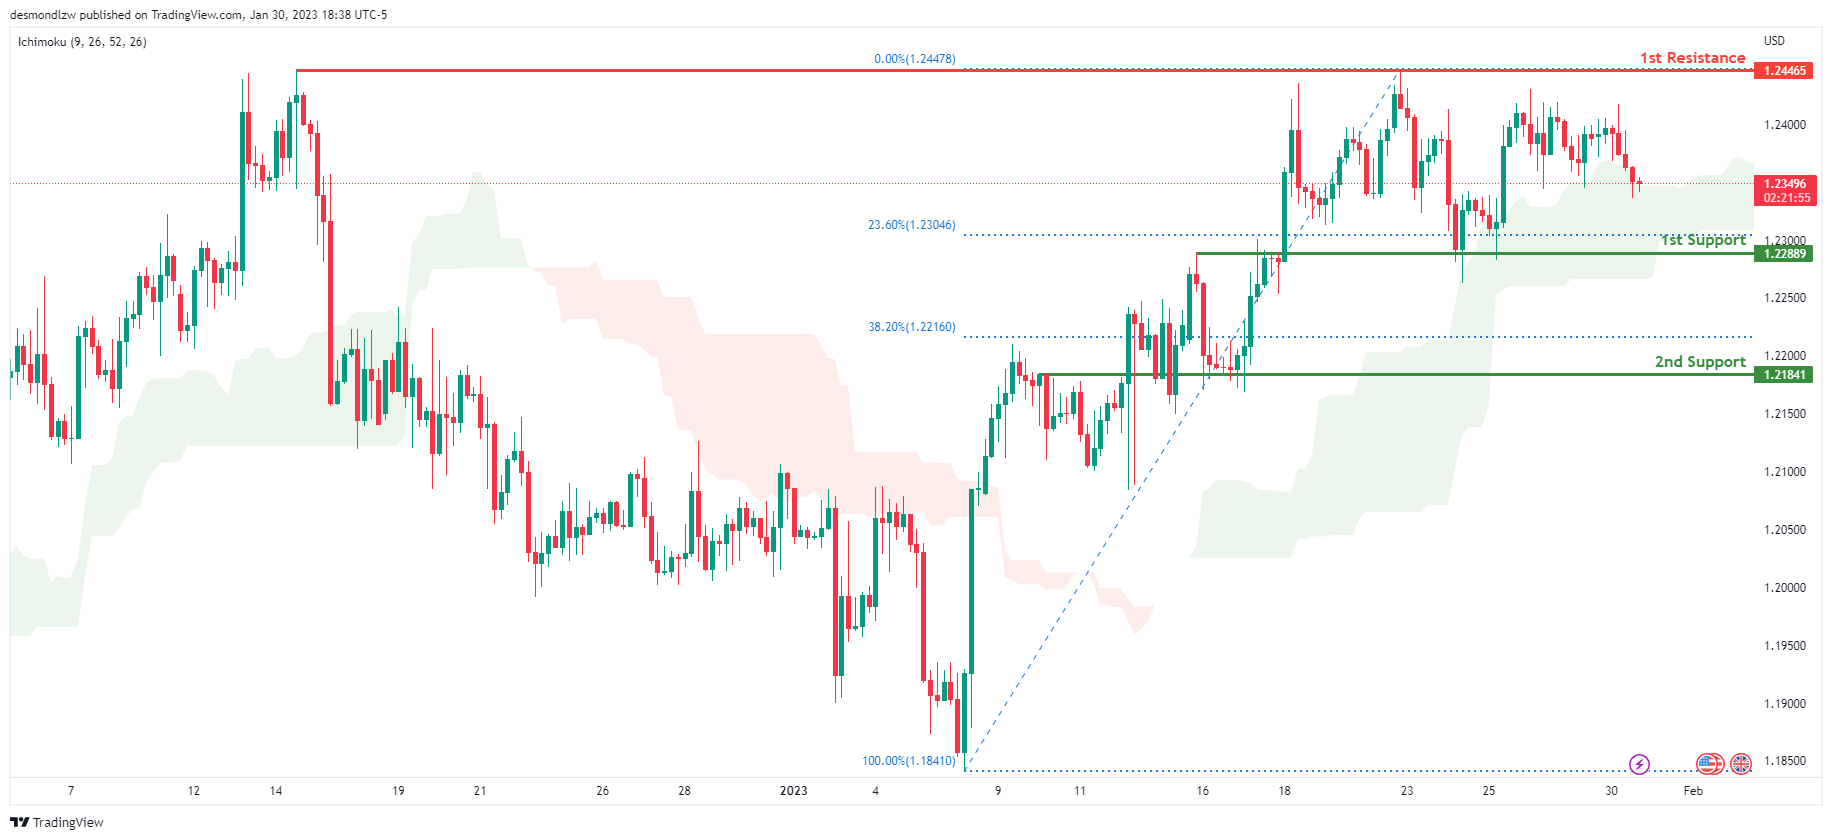
Looking at the H4 chart, my overall bias for GBPUSD is bullish due to the current price being above the Ichimoku cloud, indicating a bullish market. If this bullish momentum continues, expect price to possibly continue heading towards the 1st resistance line at 1.24465, where the previous swing high is. In an alternate scenario, price could possibly head back down and retest the 1st support at 1.22889, where the 23.6% Fibonacci line is.
Areas of consideration:
- H4 1st resistance at 1.24465
- H4 1st support at 1.22889
USD/CHF:
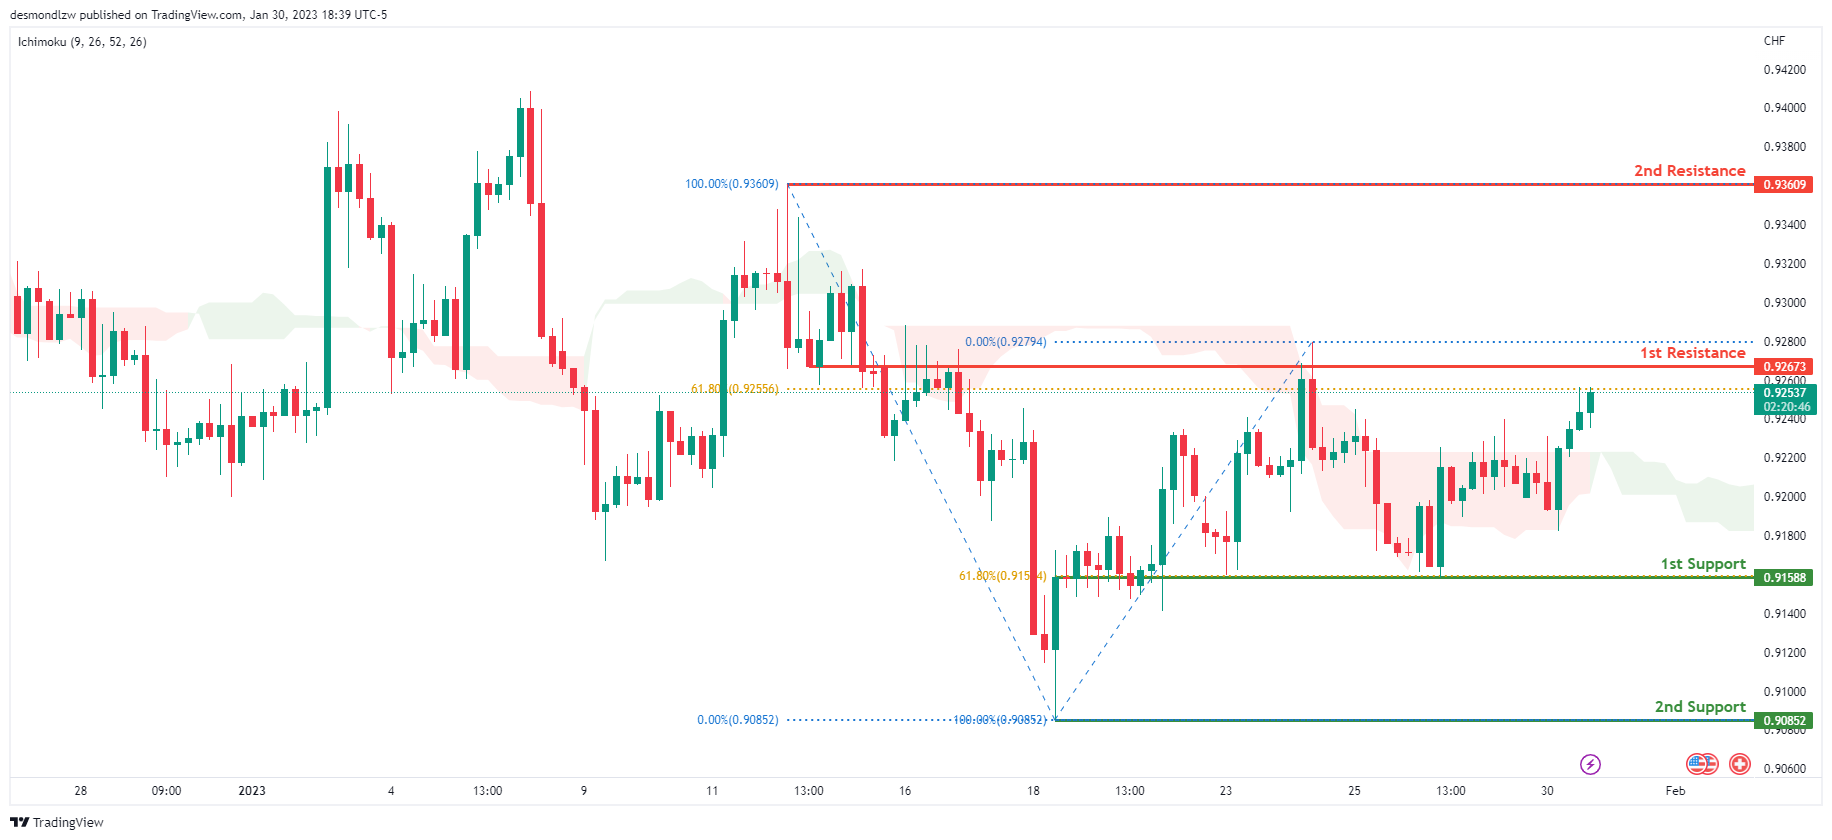
Looking at the H4 chart, my overall bias for USDCHF is bullish due to the current price crossing above the Ichimoku cloud, indicating a bullish market. If the current bullish trend continues, expect the price to possibly head back up to retest the 1st resistance at 0.92673, where the 61.8% Fibonacci line is. In an alternative scenario, price could possibly continue to head towards the 1st support at 0.91588, where the 61.8% Fibonacci line is.
Areas of consideration
- H4 1st support at 0.91588
- H4 1st resistance at 0.92673
XAU/USD (GOLD):
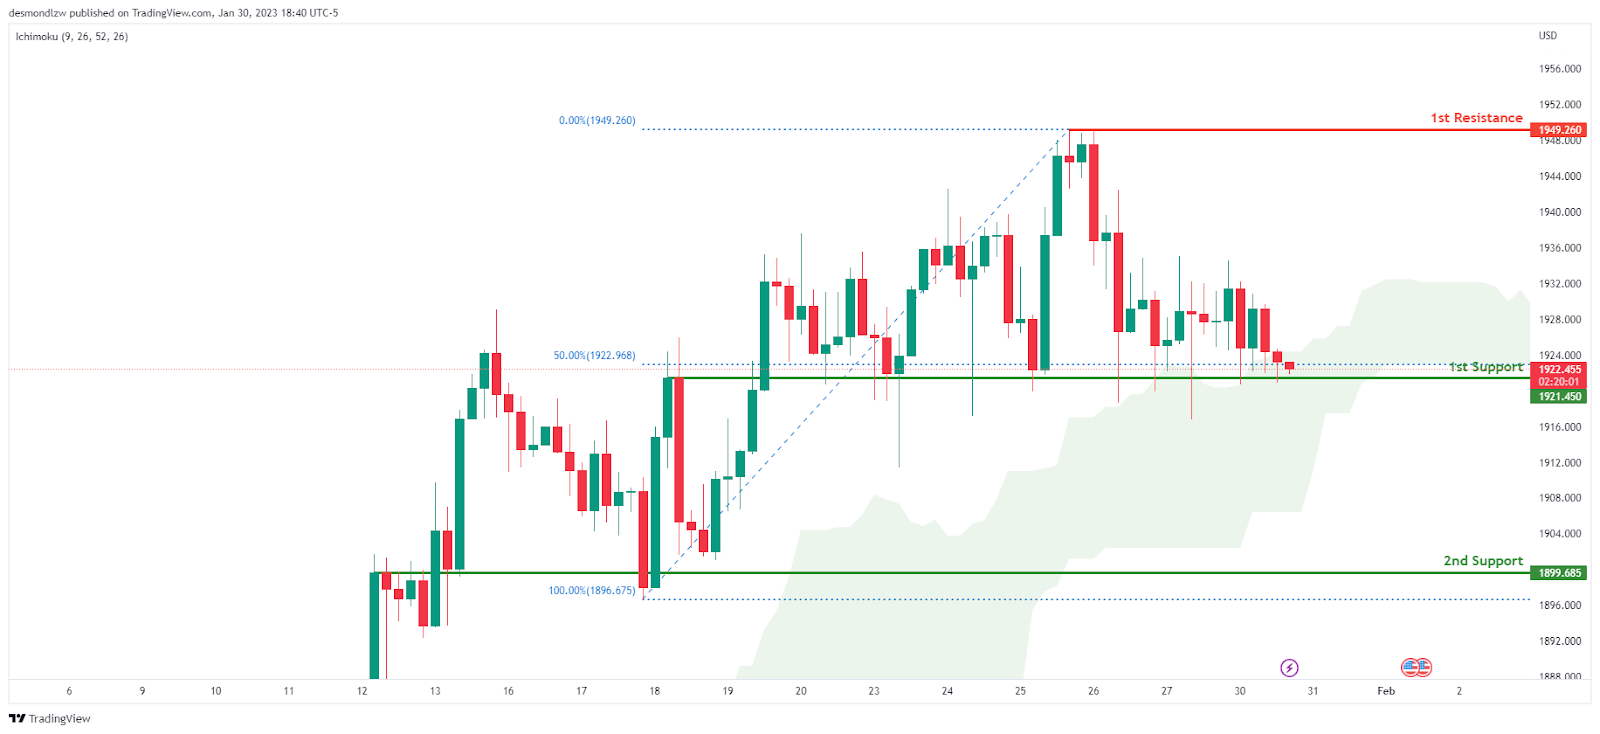
Looking at the H4 chart, my overall bias for XAUUSD is bullish due to the current price being above the Ichimoku cloud, indicating a bullish market. If this bullish momentum continues, expect the price to possibly continue heading towards the 1st resistance at 1949.260, where the recent swing high is. In an alternative scenario, price could possibly head back down to break the 1st support at 1921.450 where the 50% Fibonacci line is, before heading towards the 2nd support at 1899.685, where the overlap support and recent low is.
Areas of consideration:
- H4 time frame, 1st resistance at 1949.260
- H4 time frame, 1st support at 1921.450
- H4 time frame, 2nd support at 1899.685
AUD/USD:
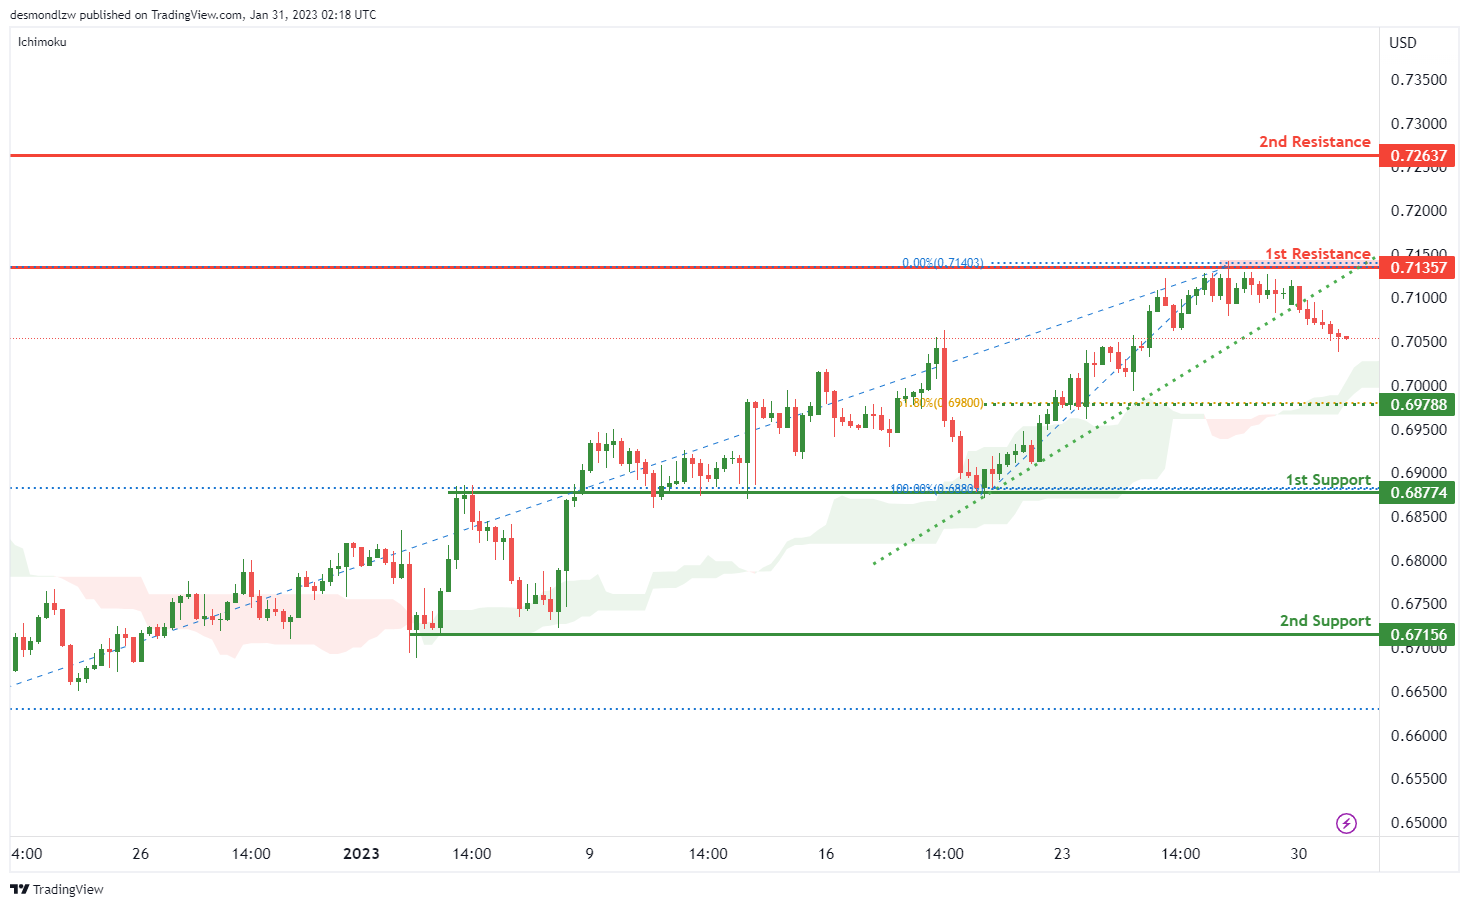
Looking at the H4 chart, my overall bias for AUDUSD is bullish due to the current price being above the Ichimoku cloud, However, the price breaking the ascending trend line, and head into the cloud.
If this price momentum continues, expect price to trade lower to the 61.8% Fibonacci level at 0.69800. And heading towards the 1st support level is at 0.68774 and 2nd support is at 0.67156.
In an alternate scenario, the price could possibly go back up towards the 1st resistance level at 0.71356 which is recent swing high, and the 2nd resistance is at 0.72637.
Areas of consideration
- H4 , 2nd resistance at 0.72637.
- H4. 1st resistance at 0.71357
- H4, 1st support at 0.68774
- H4, 2nd support at 0.67156
NZD/USD:
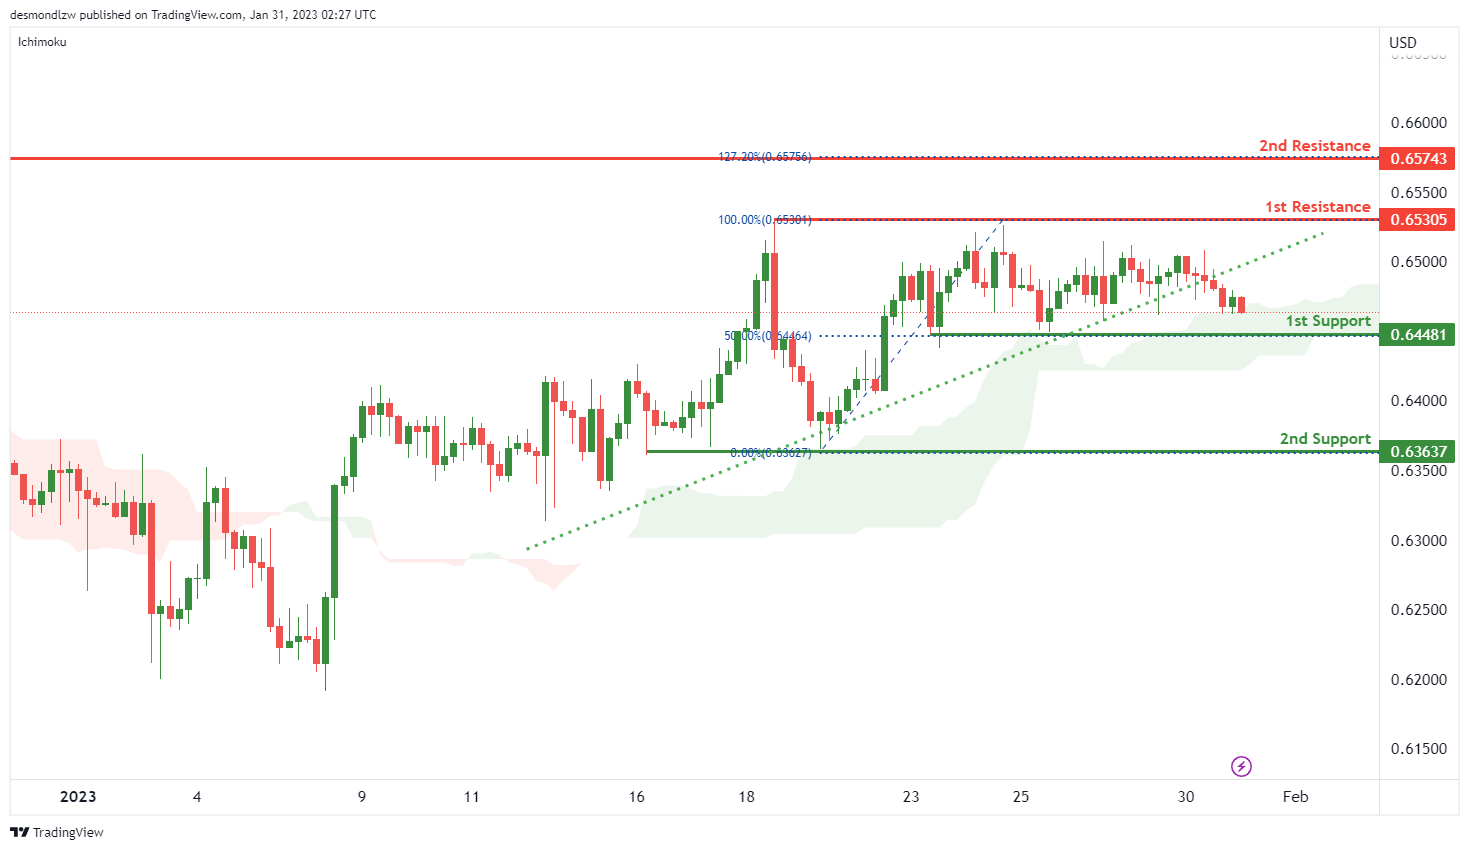
Looking at the H4 chart, my overall bias for NZDUSD is slightly bullish due to the current price is slightly above the Ichimoku cloud, indicating a slightly bullish market. To add confluence to this bias, there is an ascending trend line, however, the price is break this trend line, and it seems the price is retesring at the 1st support level at 0.64481 which is in line with 50% Fibonacci line. If this price momentum continues, expect price to possibly head down towards the 1st support at 0.63627 which is the recent swing low.
In an alternate scenario, price could possibly head back down towards the 1st reisitacne level at 0.65301 which is the recent swing high.. 2nd resistance is tya 0.65305 which is the previous swing lhigh.
Areas of consideration:
- H4 time frame, 2nd resistance at 0.65743
- H4 time frame, 1st resistance at 0.65305
- H4 time frame, 1st support at 0.64481
- H4 time frame, 2nd support at 0.63637
USD/CAD:
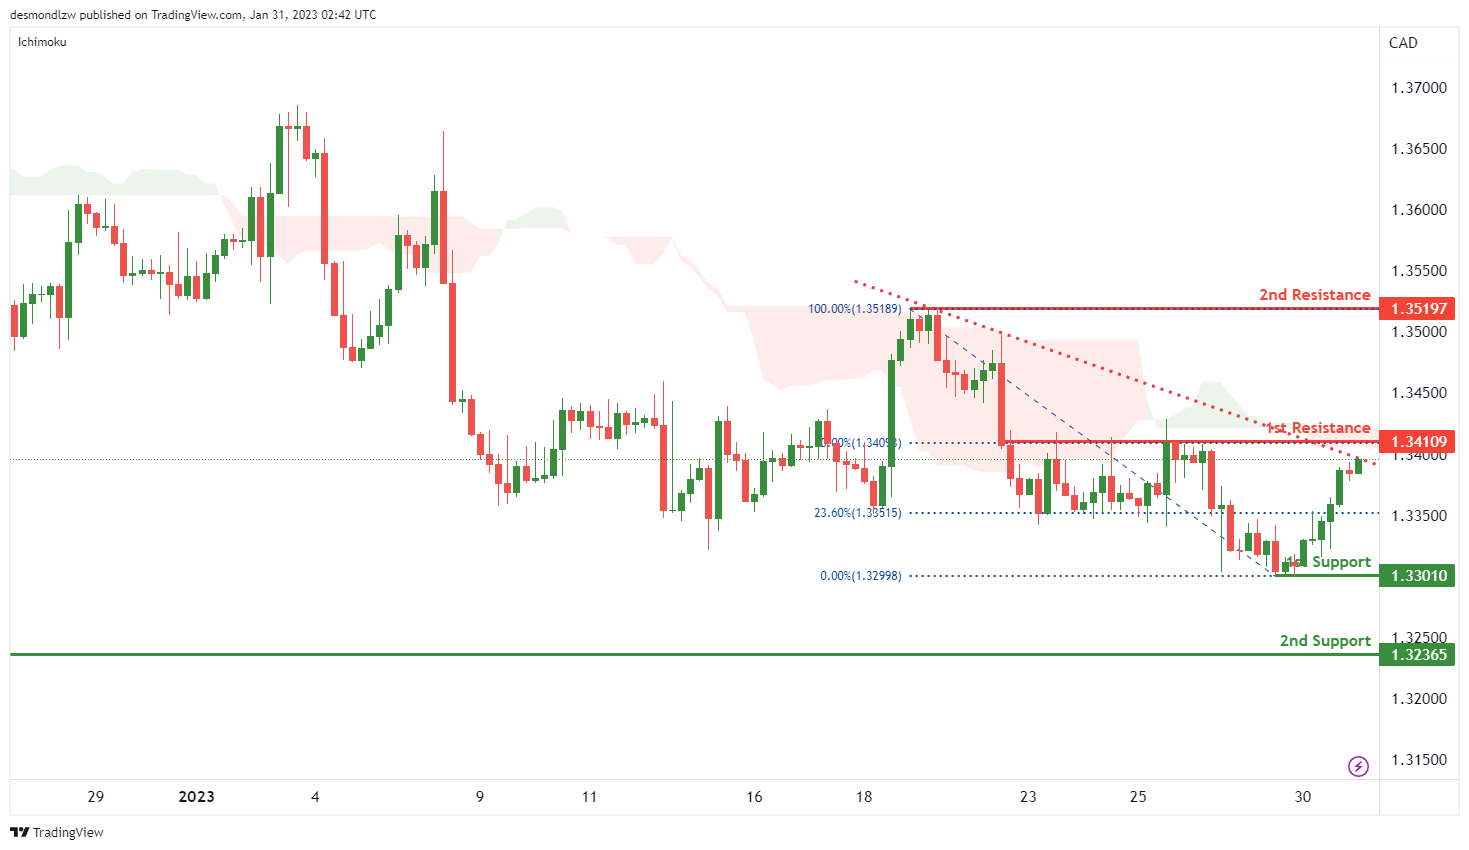
Looking at the H4 chart, my overall bias for USDCAD is bearish, however, the price seems to be breaking the descending trendline and heading towards the ichimoku cloud, possibility having a cross over. This might potentially indicate a shift to bullish market structure.If this price momentum continues, expect the price to possibly continue heading towards the 1st resistance at 1.34109 which is in line with the 61.8% Fibonacci line. 2nd resistance is at 1.35197 which is the recent swing high.
In an alternative scenario, price could possibly head down to the 1st support at 1.33010 which is the recent swing low. If the price continue to head down, it might down to the 2nd support at 1.32365.
Areas of consideration:
- H4 time frame, 2nd resistance at 1.35197
- H4 time frame, 1st resistance at 1.34109
- H4 time frame, 1st support at 1.33010
- H4 time frame, 2nd support at 1.32365.
OIL:
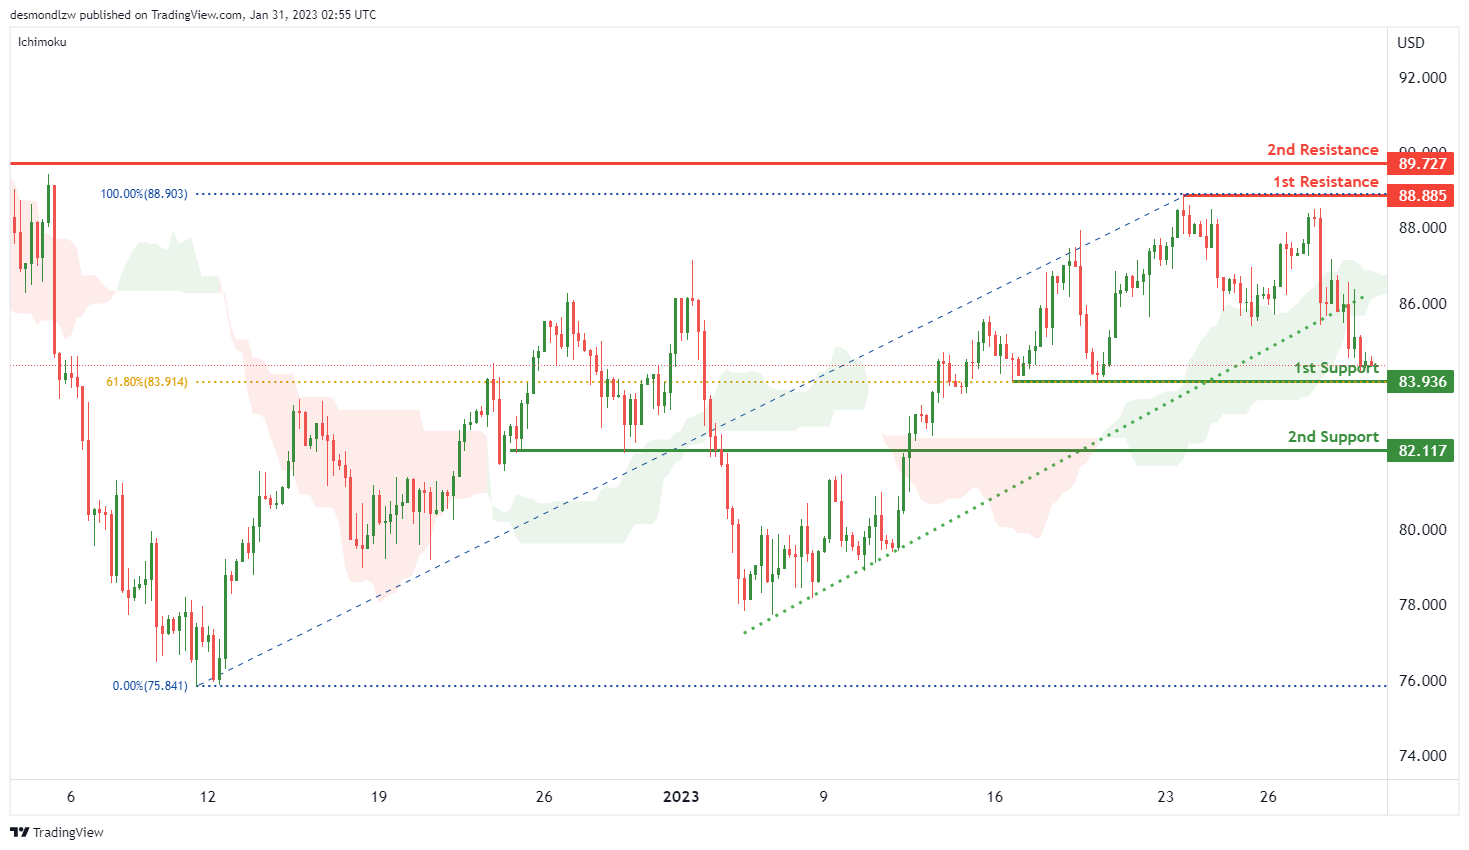
Looking at the H4 chart, my overall bias for BOC is slightly beraish. As the price seems to be breaking the rising trendline and now is below the ichimoku cloud. The price may head down toward the 1st support at 83.936 which is the recent swing low and 61.8% Fibonacci line. 2nd support is at 82.117.
In an alternate scenario, price could possibly head up towards the 1st resistance level at 88.885 hwoch is the recent swing high, 2nd resistance is at 89.727 which is the previous swing high.
Areas of consideration:
- H4 time frame, 2nd resistance at 89.727.
- H4 time frame, 1st resistance at 88.885
- H4 time frame,1st support at 83.936,
- H4 time frame, 2nd support at 82.117
Dow Jones Industrial Average:
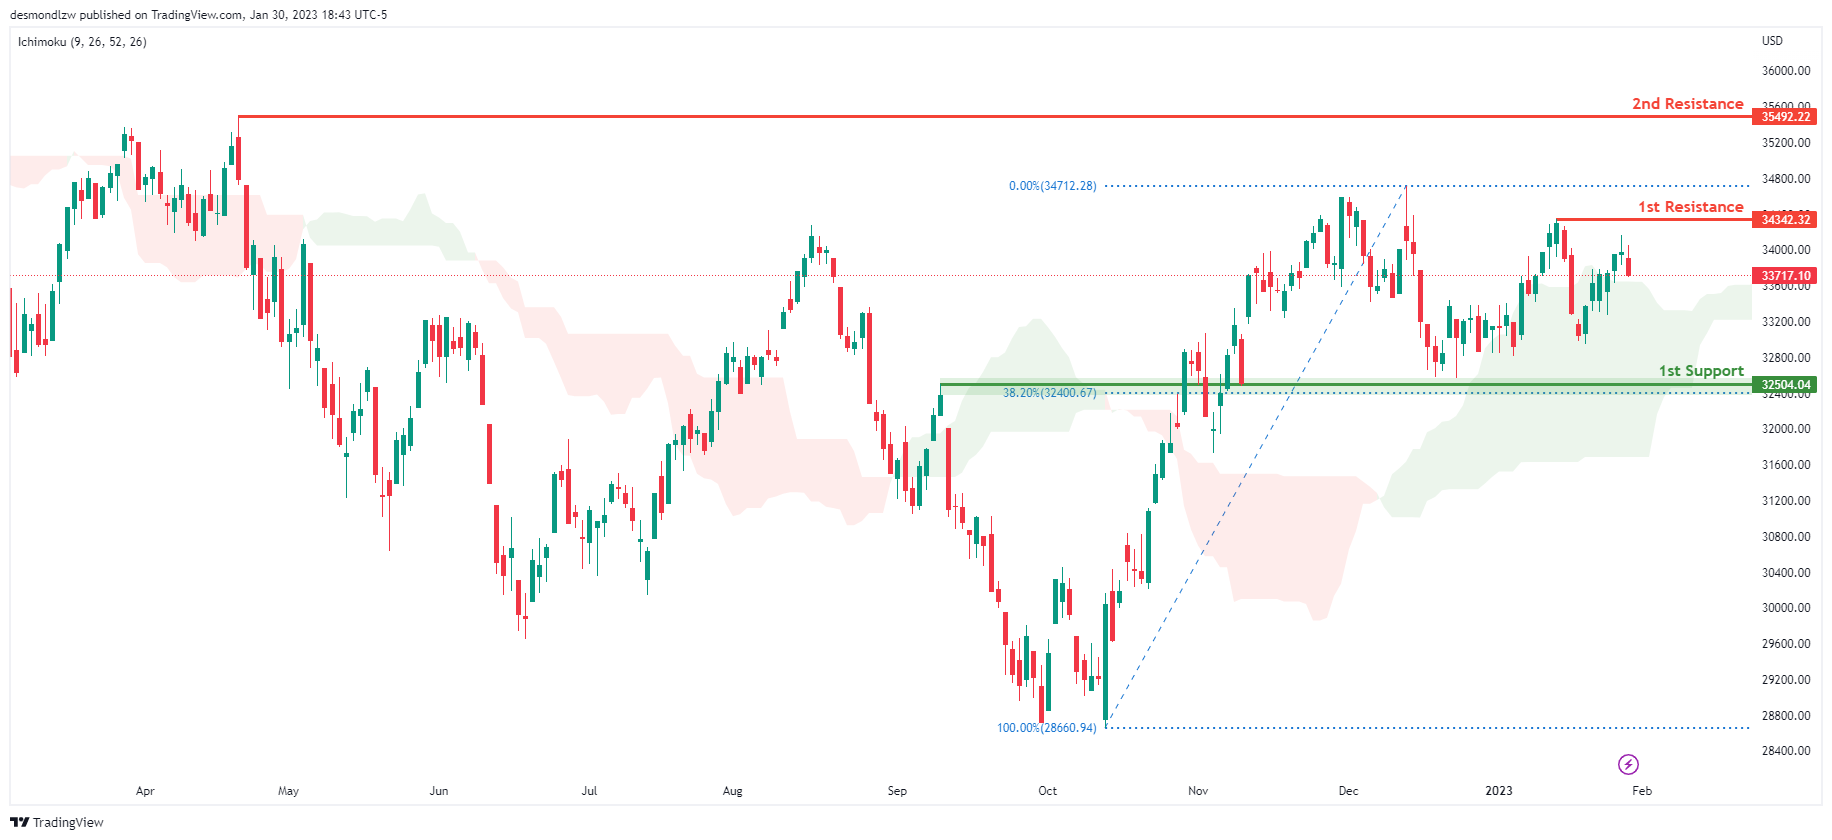
On the Daily chart, the overall bias for DJI is bullish. To add confluence to this, the price is crossing above the Ichimoku cloud which indicates a bullish market. If this bullish momentum continues, expect the price to possibly continue heading towards the 1st resistance line at 34342.32, where the recent swing high is. In an alternative scenario, price could possibly head back down towards the 1st support at 32581.97, slightly above where the 38.2% Fibonacci line is.
Areas of consideration:
- H4 time frame, 1st support at 32581.97
- H4 time frame, 1st Resistance at 34342.32
DAX:
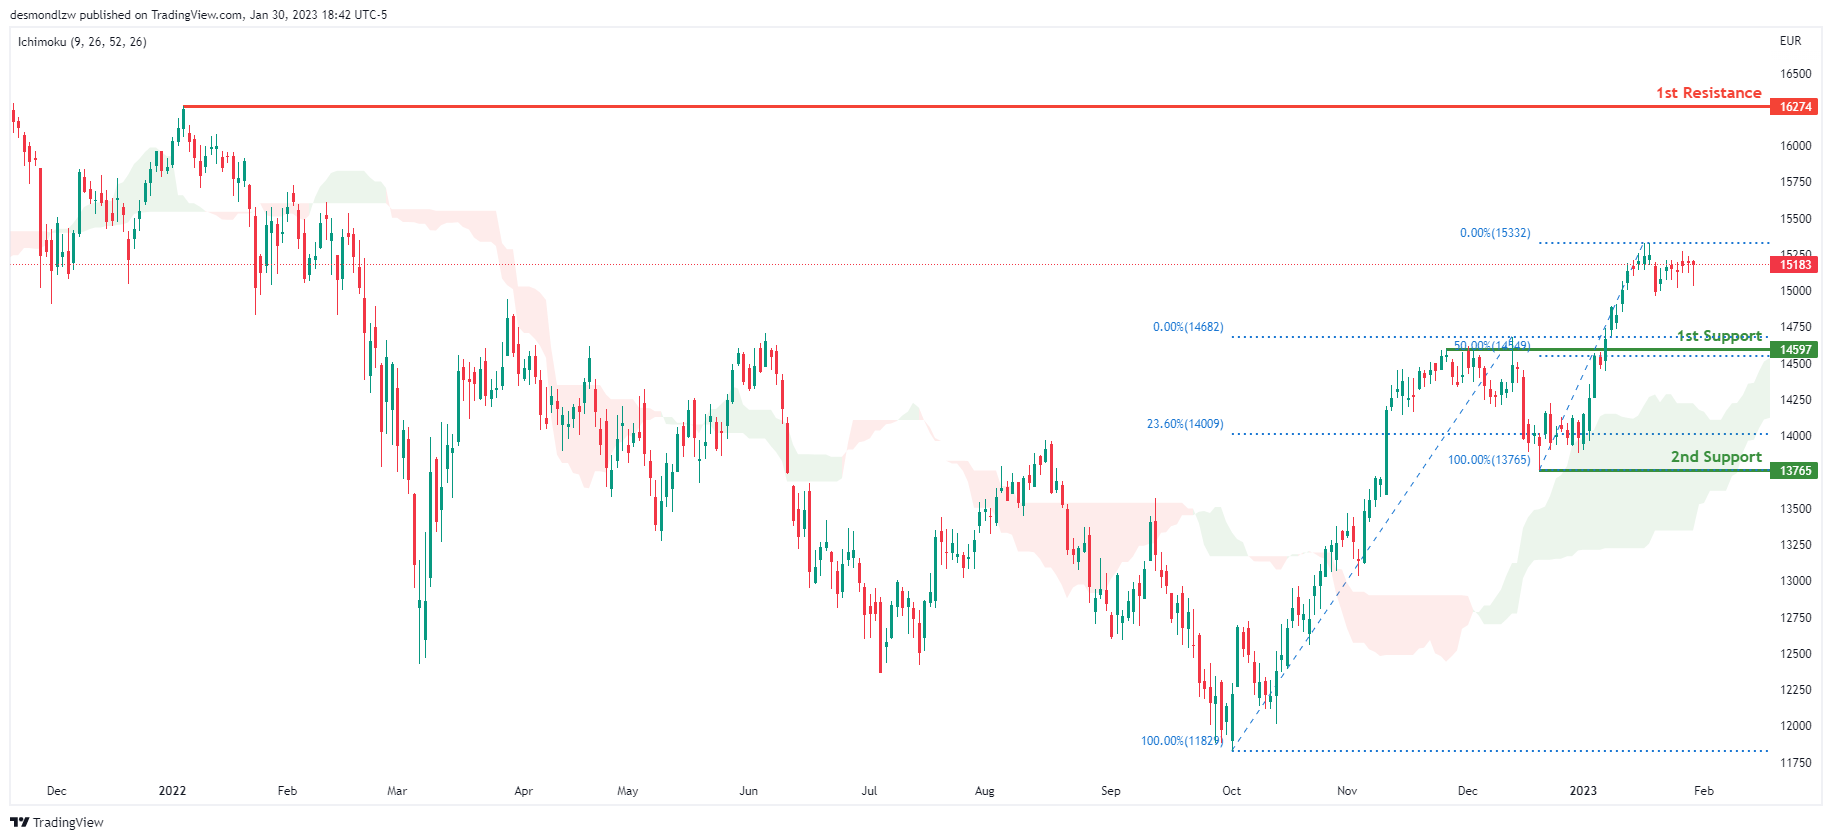
Looking at the Daily chart, my overall bias for DAX is bullish due to the current price crossing above the Ichimoku cloud, indicating a bullish market. If this bullish momentum continues, expect the price to possibly head towards the 1st resistance line at 16274, where the previous swing high is. In an alternative scenario, price could possibly head down to retest the 1st support at 14597, where the 50% Fibonacci line is.
Areas of consideration:
- H4 time frame, 1st resistance is at 16274
- H4 time frame, 1st support is at 14597
ETHUSD:
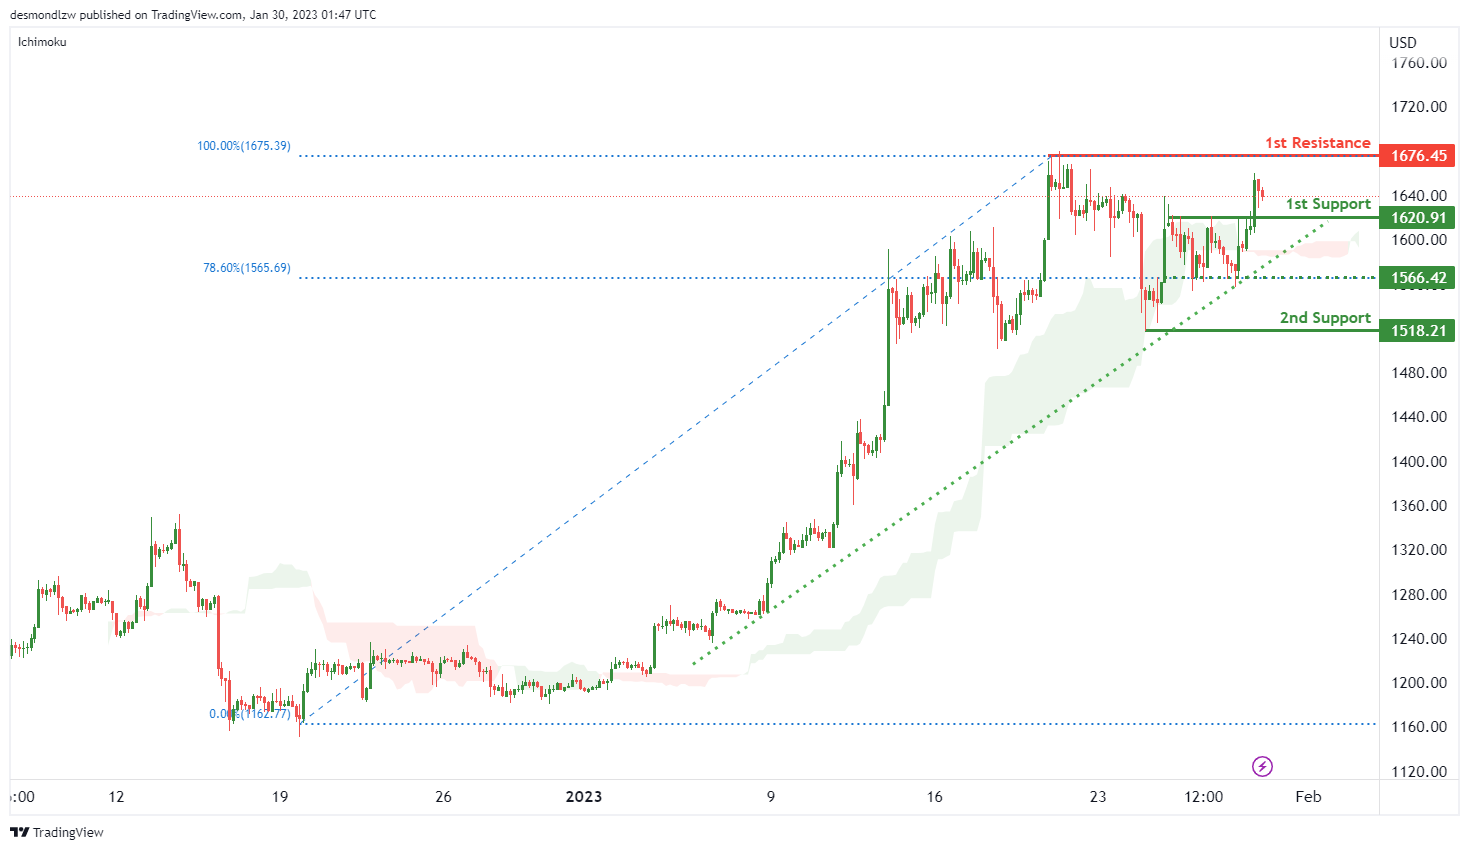
Looking at the H4 chart, my overall bias for ETHUSD is slightly bullish, even though the current price is below the Ichimoku cloud and the strong ascending trend has been broken. , the price has been retested at the 1st support at 1531.33 which is the recent swing low. If the price breaks the 1st support, it might head down to the 2nd support at 1509.50 which is the previous swing low.
In an alternate scenario, the price may rise up to the 1st resistance line at 1675.39 which is the recent swing high.
Areas of consideration:
- H4 time frame, 1st resistance of 1675.39
- H4 time frame, 1st support at 1531.33
- H4 time frame, 2nd support at 1509.50
BTCUSD:
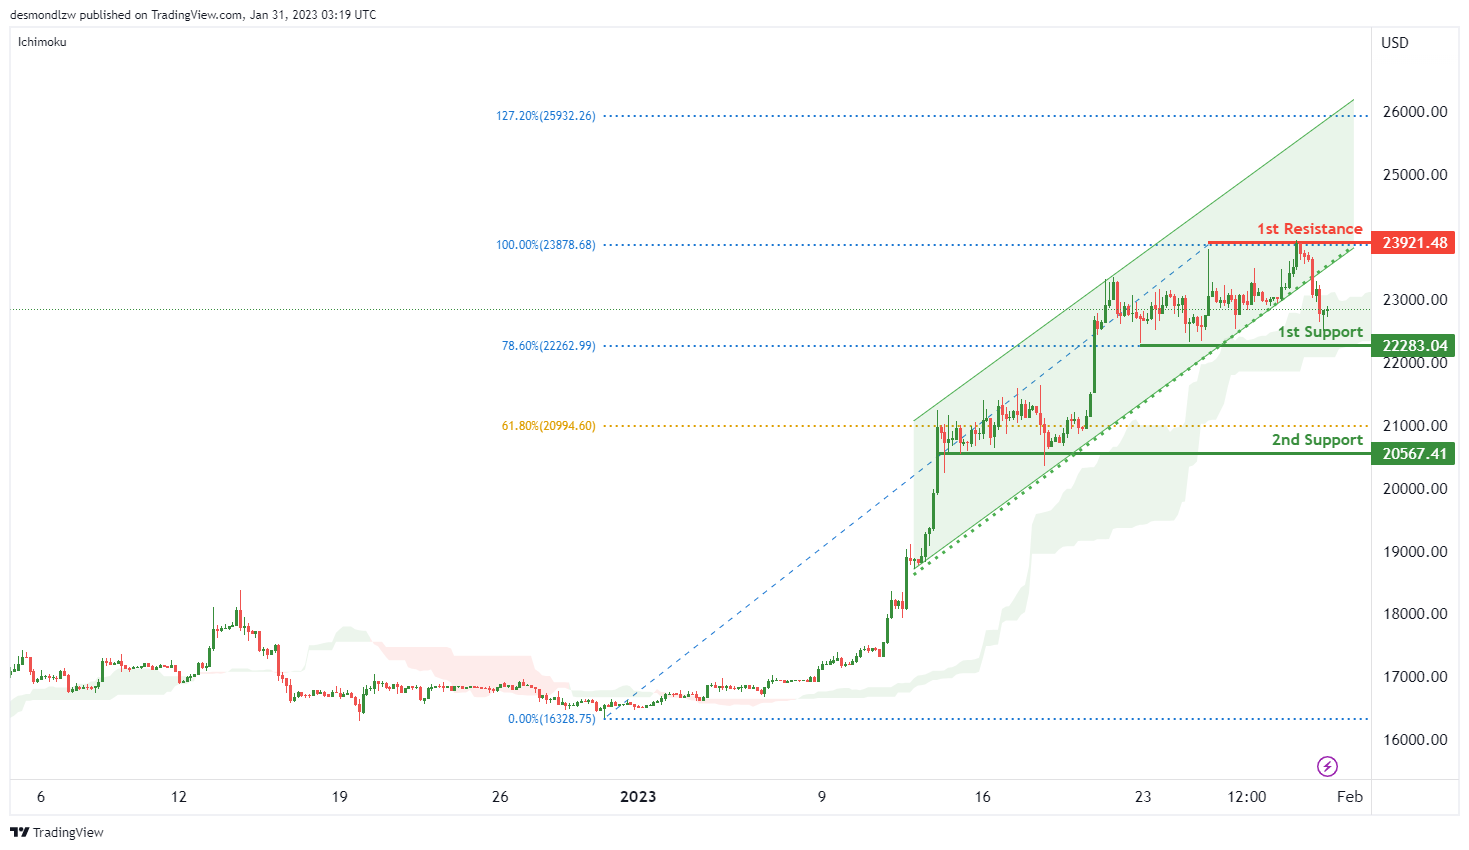
Looking at the H4 chart, my overall bias for BTCUSD is slightly bullish. Even though the ascending channel has been broken, the price has been retested at 1st support level at 22283.04. If the price breaks through the 1st support level, it might head down towards the 2nd support level at 20567.41 which is the previous swing low.
In an alternative scenario, the price could possibly head back up the 1st resistance at 23921.48 which is the previous swing high.
Areas of consideration:
- H4 time frame, 1st resistance 23921.48
- H4 time frame, 1st support at 22283.04
- H4 time frame, 2nd support a 20567.41
S&P 500:
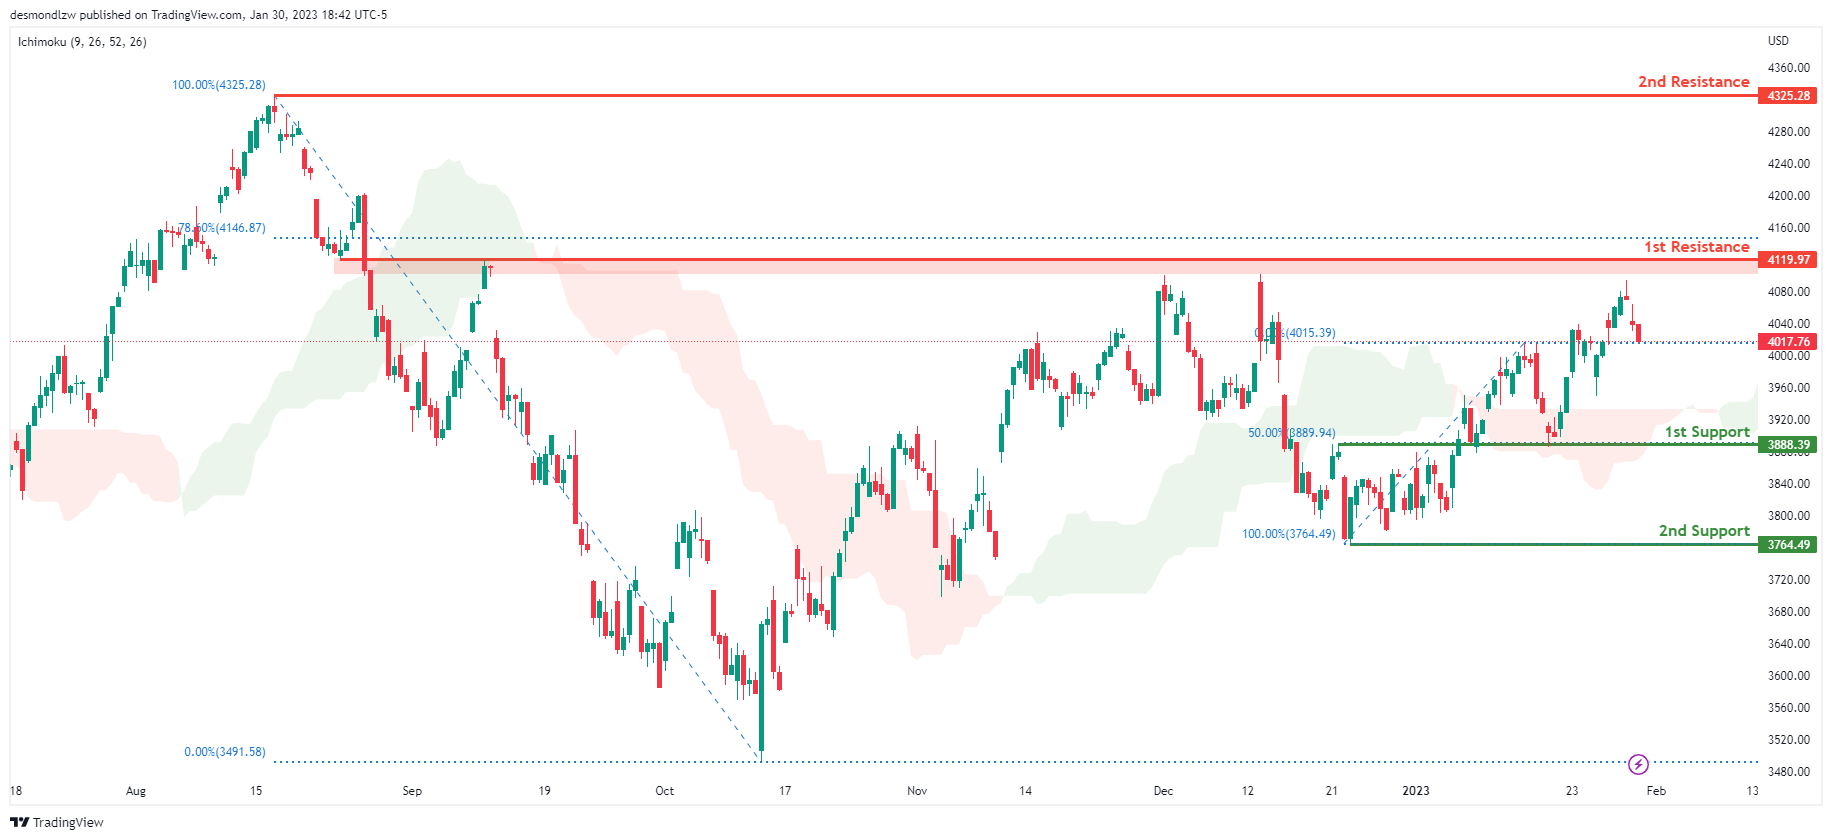
Looking at the H4 chart, my overall bias for S&P500 is bullish due to the current price being above the Ichimoku cloud, indicating a bullish market. If this bullish momentum continues, expect the price to continue heading towards the 1st resistance at 4119.97, where the 78.6% Fibonacci line is. In an alternative scenario, price could possibly head back down to break the 1st support at 3888.39, where the 50% Fibonacci line is, before heading towards the 2nd support at 3764.49, where the recent swing low is.
Areas of consideration:
- H4 time frame, 1st support at 3888.39
- H4 time frame, 2nd support at 3764.49
- H4 time frame, 1st resistance at 4119.97