Sample Category Title
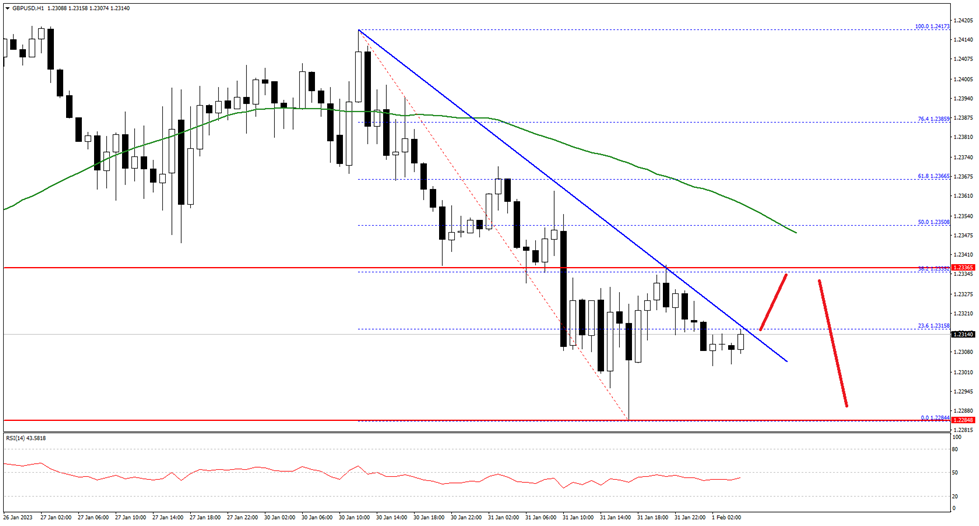
GBP/USD Pair Moved into a Short-term Bearish Zone Below 1.2365
The British Pound started a bearish reaction from the 1.2420 resistance zone against the US Dollar. The GBP/USD pair declined below the 1.2365 level to move into a short-term bearish zone.
There was a close below the 1.2350 level and the 50 hourly simple moving average. It is now consolidating near the 1.2315 level, with an immediate resistance at 1.2320 and a connecting bearish trend line on the hourly chart.
The first major resistance is near the 1.2350 level. If there is a clear upside break above the 1.2350 resistance, the pair could rise steadily towards the 1.2400 level in the near term. The next major resistance sits near 1.2420 on FXOpen.
On the downside, the first major support is near the 1.2300 level. The main support is forming near the 1.2285 level. A break below the 1.2285 support could push the pair towards the 1.2240 support.
GBP/JPY Daily Outlook
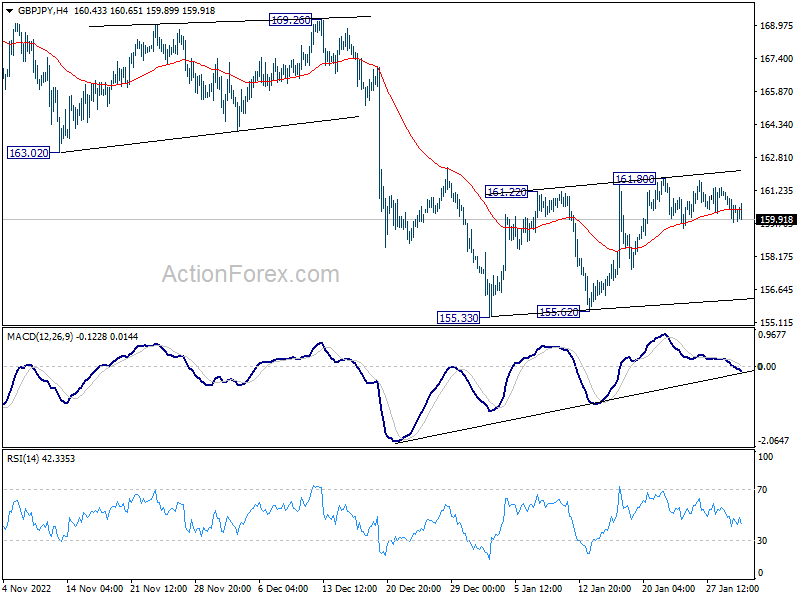
Daily Pivots: (S1) 159.63; (P) 160.41; (R1) 161.06; More…
No change in GBP/JPY's outlook as range trading continues. Intraday bias stays neutral at this point. On the downside, break of 155.33 low will resume the fall form 172.11 to 153.70 fibonacci level next. Nevertheless, sustained trading above 55 day EMA (now at 161.81) will turn bias to the upside, for stronger rise back to 169.26/172.11 resistance zone.
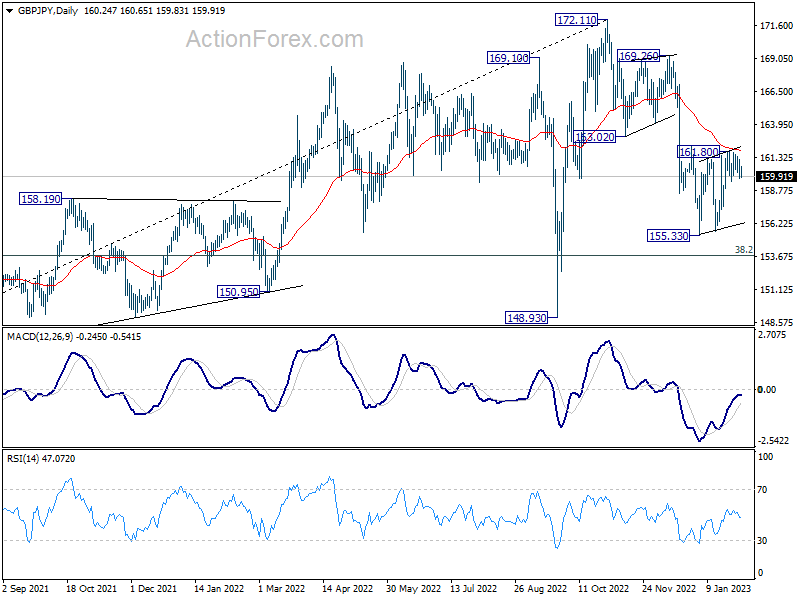
In the bigger picture, as long as 163.02 support turned resistance holds, decline from 172.11 medium term top is expected to continue to 38.2% retracement of 123.94 to 172.11 at 153.70. Sustained break there will raise the change of trend reversal and target 61.8% retracement at 142.34. Nevertheless, break of 163.02 support turned resistance will argue that the decline has completed, and retain medium term bullishness.
EUR/JPY Daily Outlook
Daily Pivots: (S1) 140.83; (P) 141.23; (R1) 141.70; More….
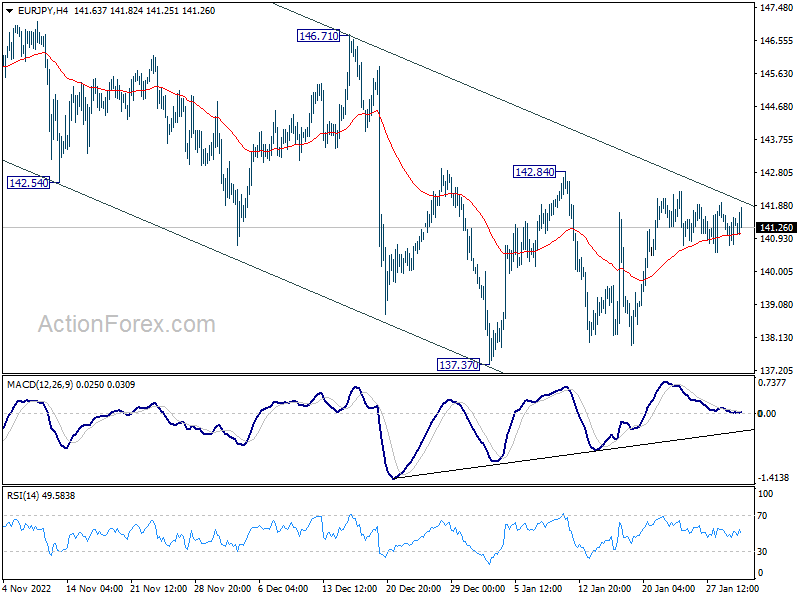
EUR/JPY is still bounded in range of 137.37/142.84 and intraday bias stays neutral. On the downside, break of 137.37 will resume the whole decline from 148.38 to 135.40 fibonacci level next. However, firm break of 142.84 will argue that the correction from 148.38 has completed, and bring stronger rise back to 146.71 resistance.
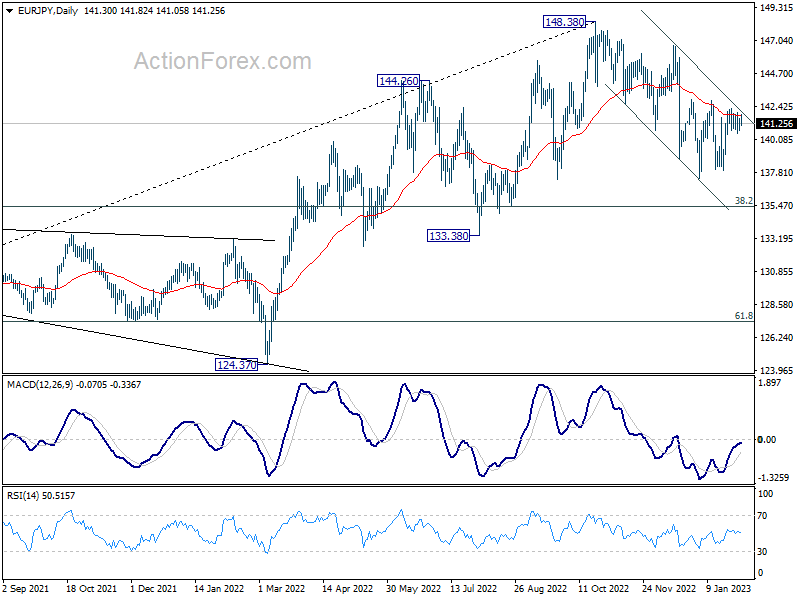
In the bigger picture, as long as 55 week EMA (now at 138.81) holds, larger up trend from 114.42 (2020 low) is still in progress for 149.76 long term resistance. However, firm break of 55 week EMA will bring deeper fall to 38.2% retracement of 114.42 to 148.38 at 135.40. Sustained break there will raise the chance of trend reversal, and target 61.8% retracement at 127.39.
EUR/GBP Daily Outlook
Daily Pivots: (S1) 0.8783; (P) 0.8806; (R1) 0.8841; More…
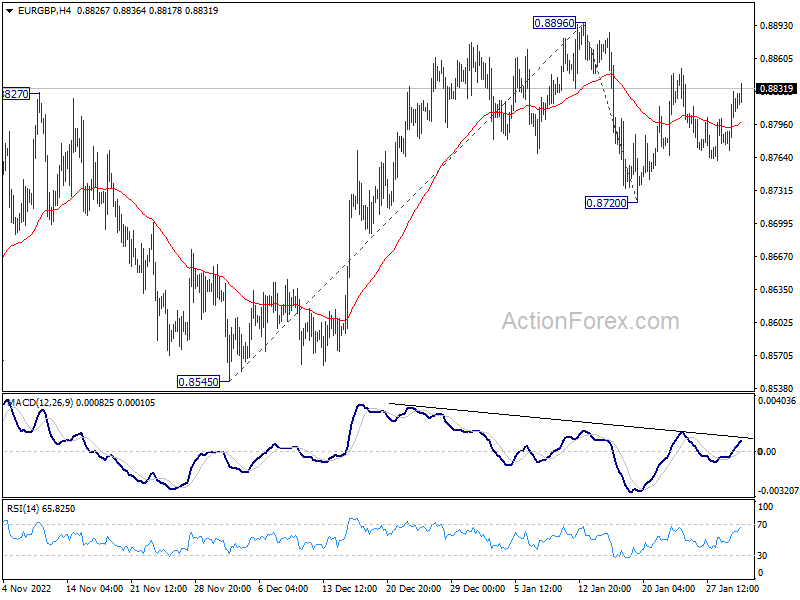
Intraday bias in EUR/GBP stays neutral as range trading continues. On the upside, firm break of 0.8896 will resume the rise from 0.8545 and target 61.8% projection of 0.8545 to 0.8896 from 0.8720 at 0.8937. On the downside, break of 0.8720 will resume the fall from 0.8896 instead.
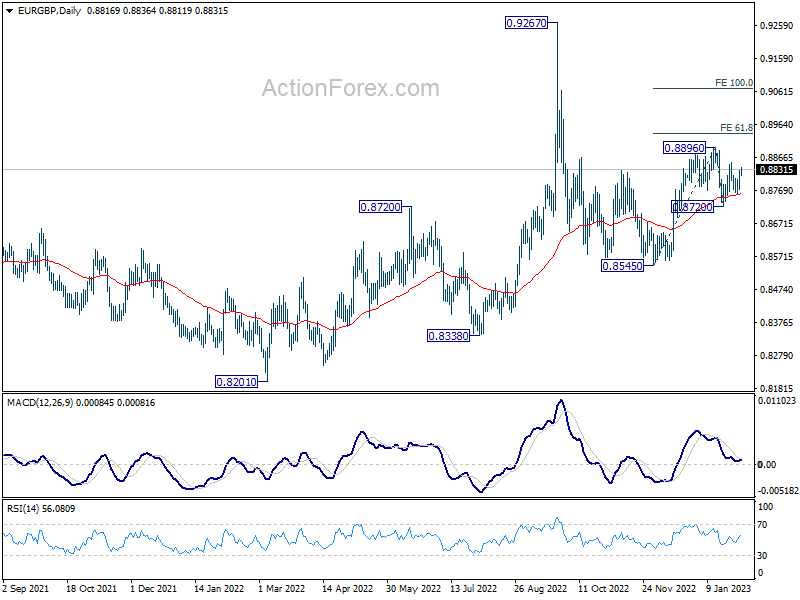
In the bigger picture, the notable support from 55 day EMA (now at 0.8752) retains near term bullishness. Break of 0.8896 should target 0.9267 (2022 high) and possibly above, to resume whole up trend from 0.8201 (2022 low). However, break of 0.8270 support and sustained trading below 55 day EMA will set the stage for 0.8545 and below.
EUR/AUD Daily Outlook
Daily Pivots: (S1) 1.5332; (P) 1.5415; (R1) 1.5483; More…
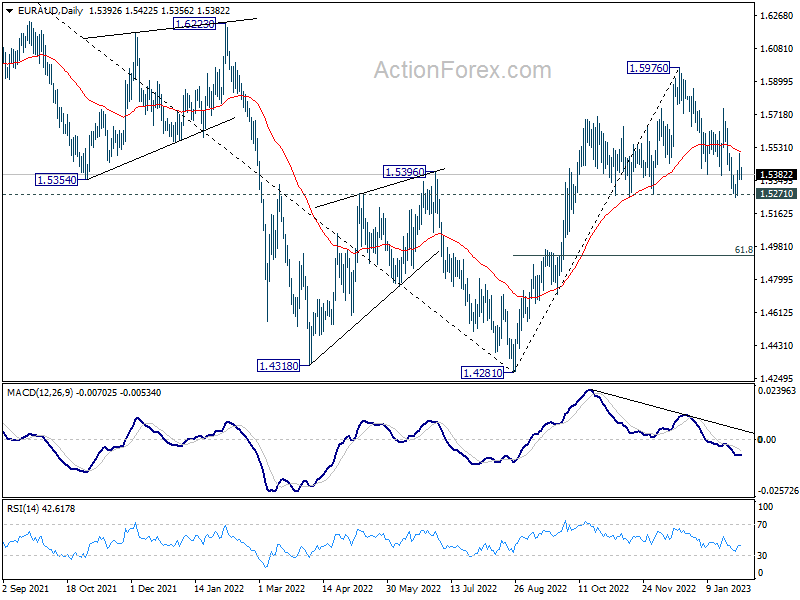
EUR/AUD rose to 1.5496 but quickly retreated. Initial bias stays neutral this week first. On the upside, above 1.5496 will affirm the case of short term bottoming 1.5254, after defending 1.5271 key support. Intraday bias will then be turned back to the upside for 55 day EMA (now at 1.5504) and above. On the downside, decisive break of 1.5271 will carry larger bearish implication and bring deeper fall to 61.8% retracement of 1.4281 to 1.5976 at 1.4928.
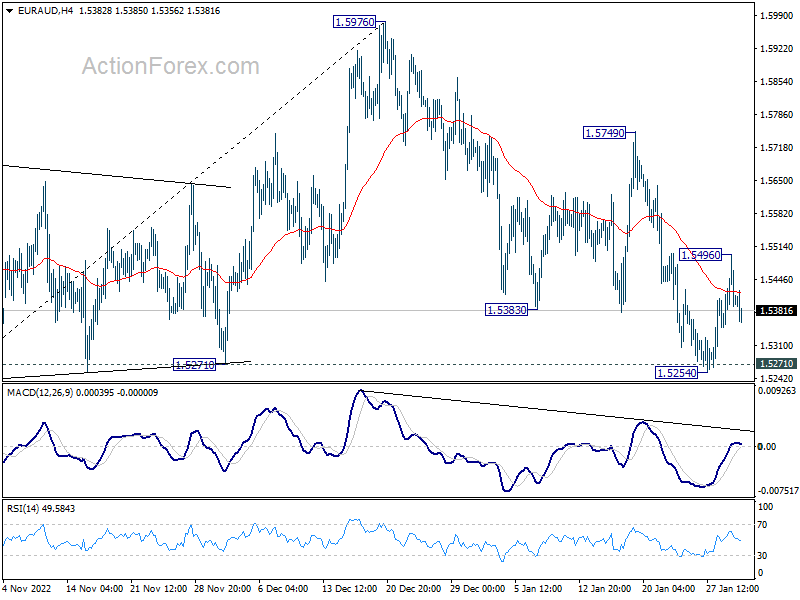
In the bigger picture, it's still early to confirm if rise from 1.4281 represents bullish trend reversal. But as long as 1.5271 support holds, such rally is in favor to continue. Break of 1.5976 will target 1.6434 key resistance next. On the other hand, firm break of 1.5271 will retain medium term bearishness instead.
EUR/CHF Daily Outlook
Daily Pivots: (S1) 0.9913; (P) 0.9983; (R1) 1.0022; More….
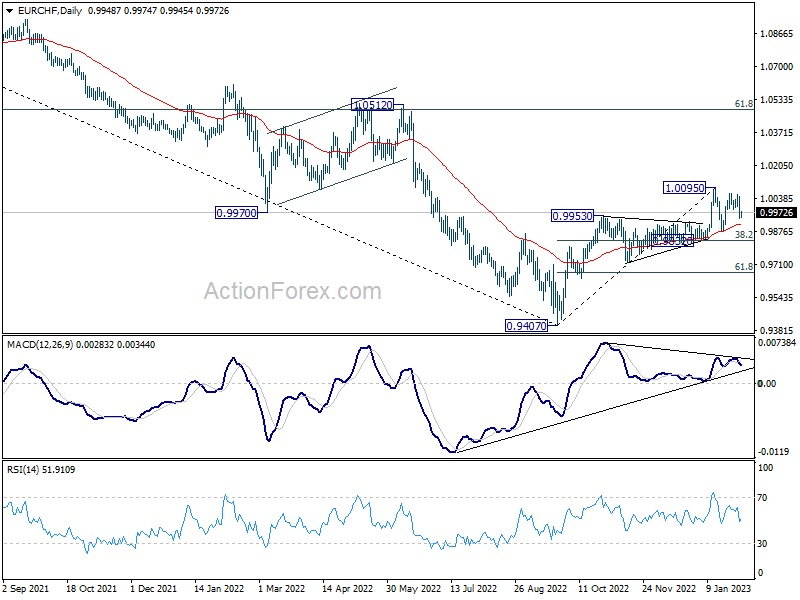
EUR/CHF's break of 0.9986 suggests that corrective pattern from 1.0095 is in the third leg. Intraday bias is back on the downside for 0.9874 support, and possibly below. But downside should be contained by 38.2% retracement of 0.9407 to 1.0095 at 0.9832 to bring rebound.
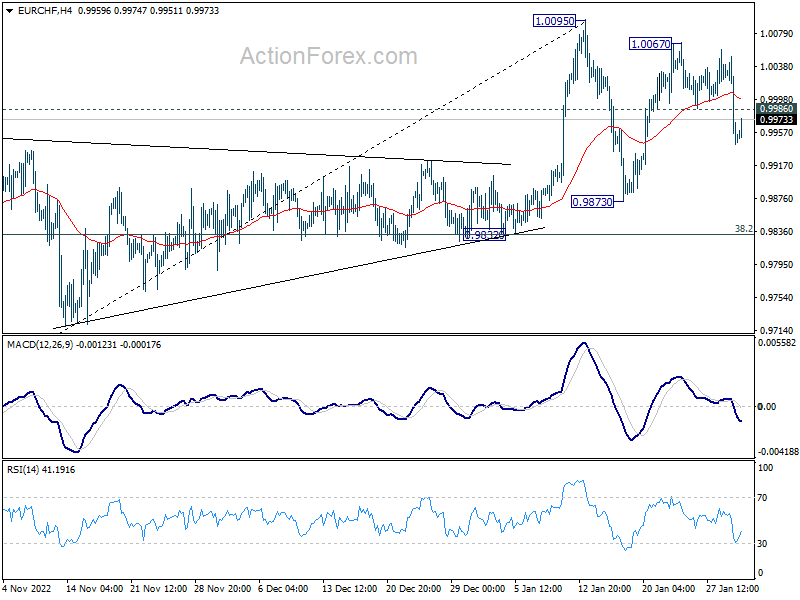
In the bigger picture, the initial rejection by 55 week EMA (now at 1.0039) mixed up the outlook. On the upside, sustained trading above 55 week EMA will raise the chance of bullish trend reversal. Rise from 0.9407 should then target 1.0505 cluster resistance (2020 low at 1.0505, 61.8% retracement of 1.1149 to 0.9407 at 1.1484). However, firm break of 0.9832 support will revive medium term bearishness and bring retest of 0.9407 low instead.
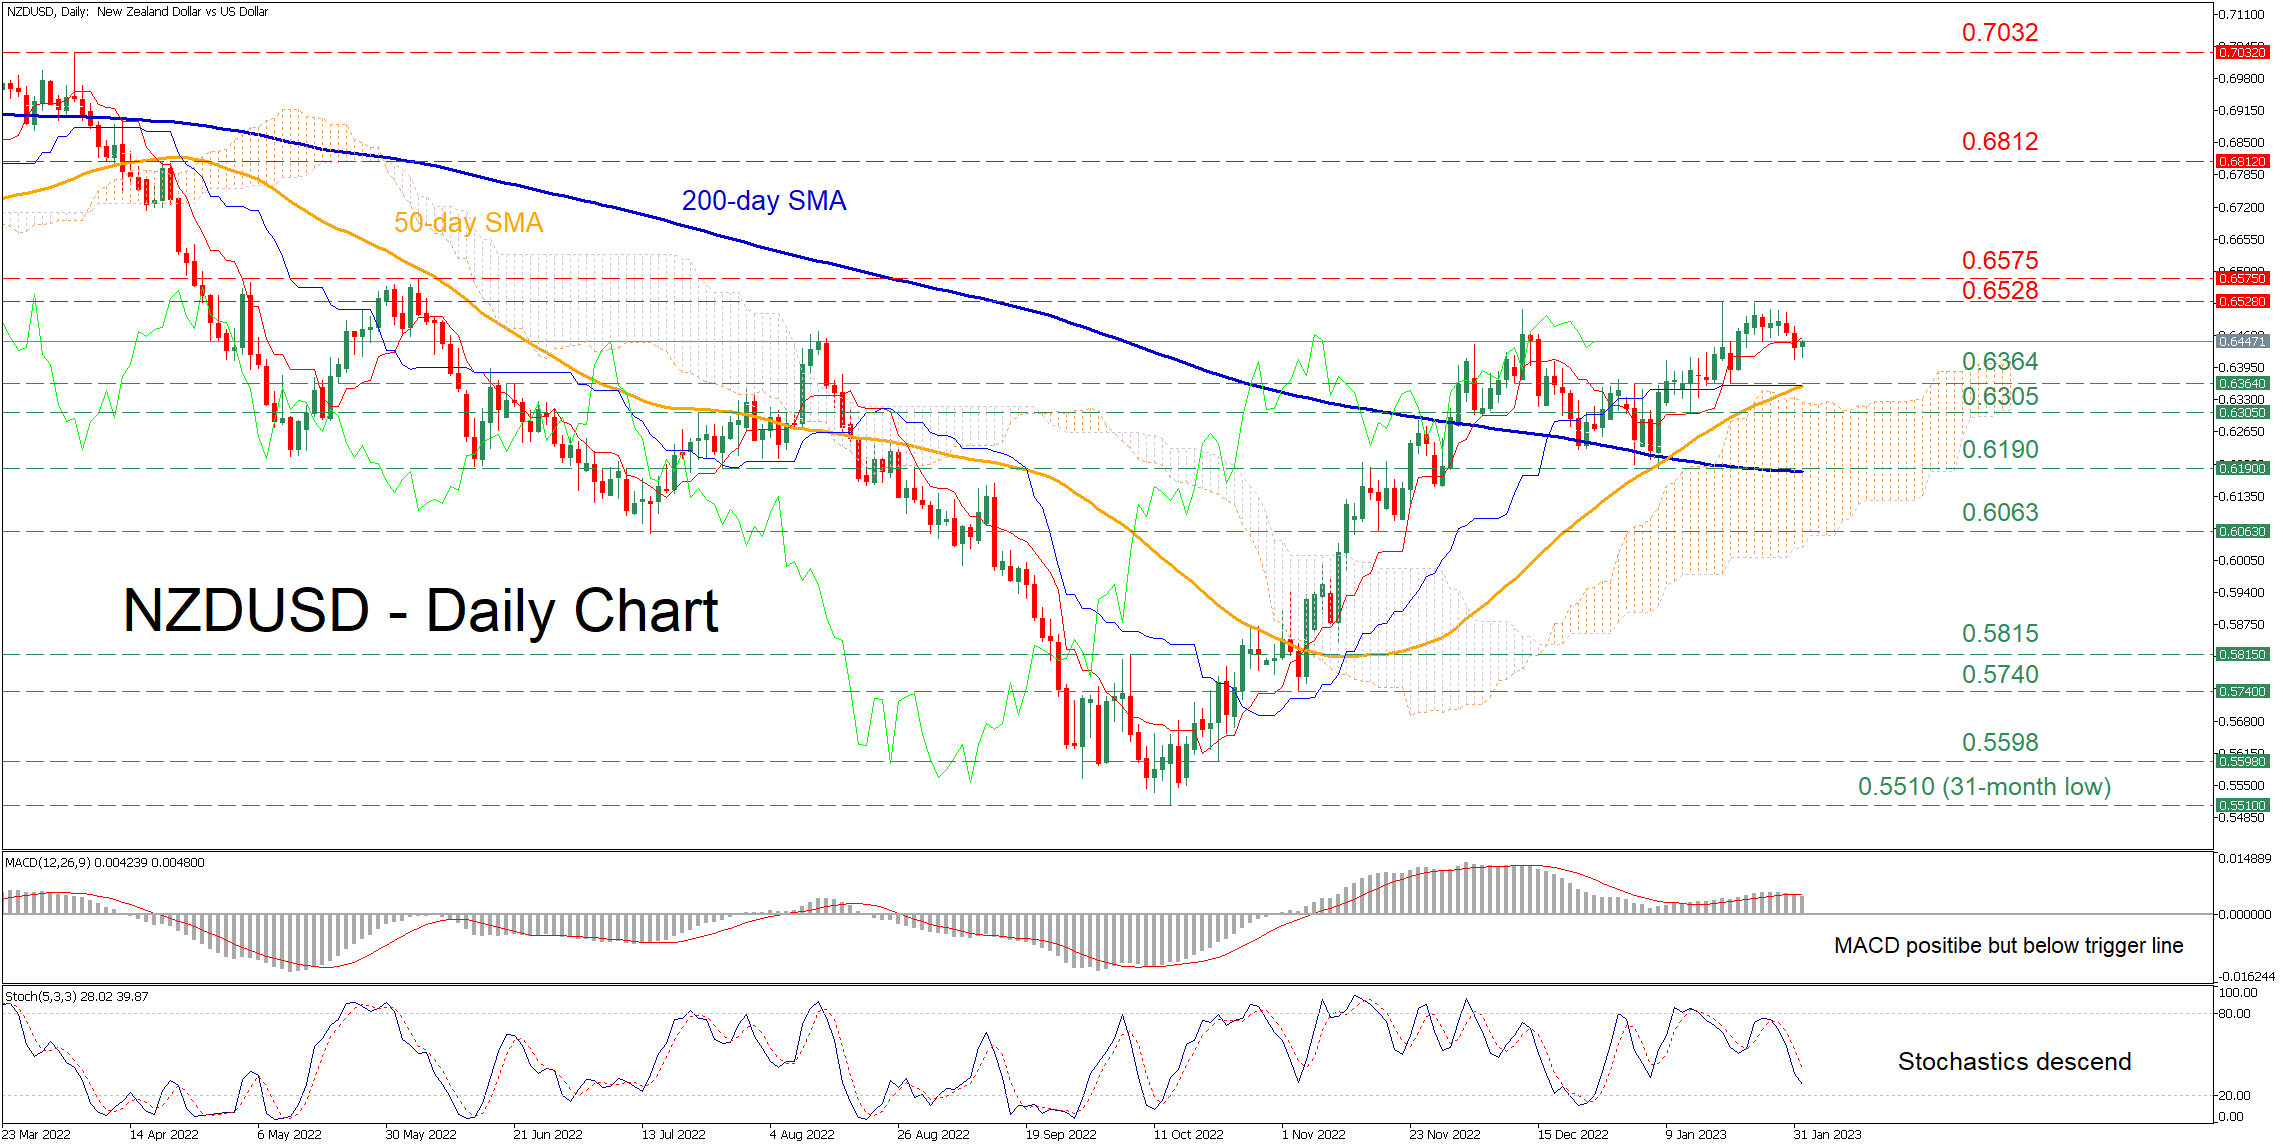
NZDUSD Extends Pullback after Advance Got Rejected
NZDUSD had been on a steady decline in 2022, finding its feet at the 31-month low of 0.5510 in early October. Even though the pair has staged a solid rebound since then, it is currently experiencing a downside correction after its uptrend got rejected at the seven-month high of 0.6528.
The momentum indicators currently suggest that selling forces are strengthening. Specifically, the MACD histogram is softening below its red signal line but remains in the positive region, while the stochastic oscillator is descending near its 20-oversold zone.
Should bearish pressures persist, the pair could decline towards the 0.6364 support, which overlaps with the 50-day simple moving average (SMA). Sliding beneath that floor, the 0.6305 barrier could curb further declines before the 2023 low of 0.6190 gets tested. Even lower, the pair may challenge the November support of 0.6063.
Alternatively, should buyers re-emerge and push the price higher, immediate resistance could be met at the recent rejection point of 0.6528, which is also a seven-month high. Conquering this barricade, the bulls could then aim for the June peak of 0.6575 before 0.6812 comes under examination. A break above the latter could set the stage for the 2022 high of 0.7032.
Overall, NZDUSD seems to be experiencing a downside correction as its rebound failed twice to cross above the 0.6528 ceiling, but the pair retains its bullish medium-term pattern. A test of the 50-day SMA could prove to be the next decisive factor for the pair’s future trajectory.
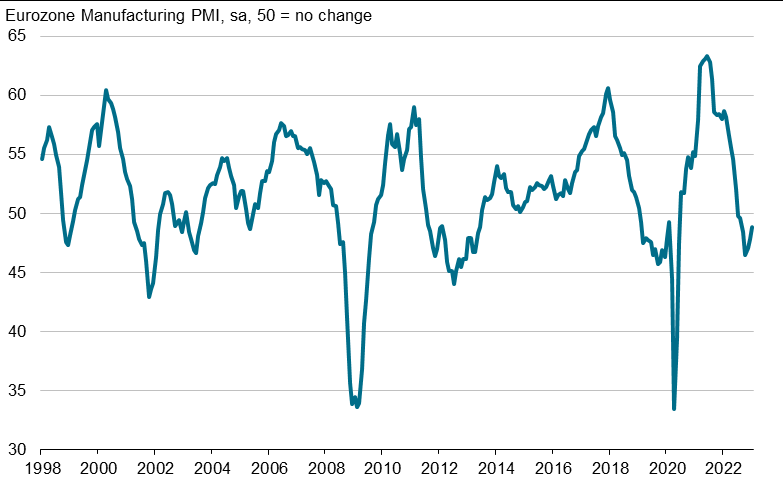
Eurozone PMI manufacturing finalized at 48.8 in Jan, picture considerably brighter
Eurozone PMI Manufacturing was finalized at 48.8 in January, up from December's 47.8, also a 5-month high. Manufacturing Output index was finalized at 48.9, up from December's 47.8, a 7-month high.
Readings in all member states improved, including France at 50.5 (5-month high), Italy at 50.4 (7-month high), Ireland at 50.1 (3-month high), the Netherlands at 49.6 (5-month high), Greece at 49.2 (4-month high), Austria at 48.4 (4-month high), Spain at 48.4 (4-month high), and Germany at 47.3 (4-month high).
Chris Williamson, Chief Business Economist at S&P Global Market Intelligence said: “Although euro area manufacturers continued to report falling output and deteriorating order books in January, sustaining the sector’s downturn for an eighth successive month, the picture is considerably brighter than the lows seen back in last October heading into the winter. Not only has the rate of output decline moderated now for three consecutive months, but business optimism about the year ahead has also surged higher over the past three months."
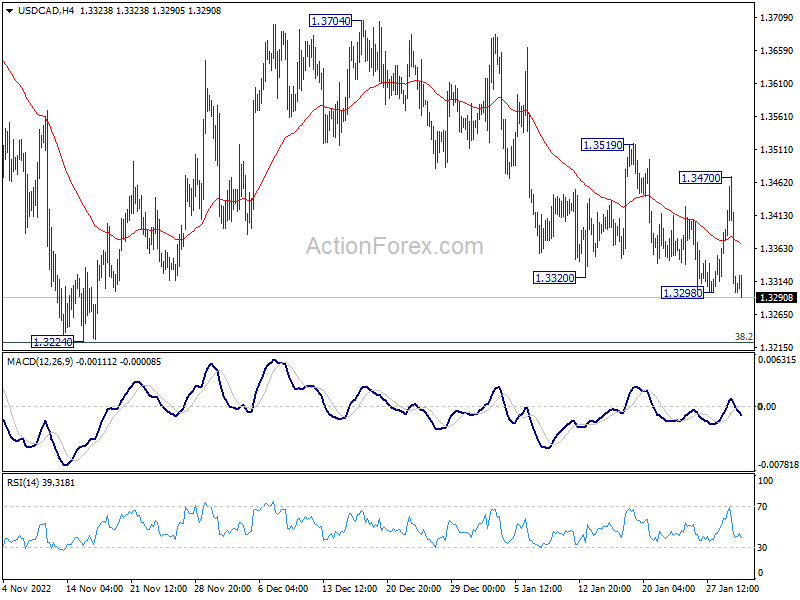
USD/CAD Daily Outlook
Daily Pivots: (S1) 1.3246; (P) 1.3359; (R1) 1.3419; More…
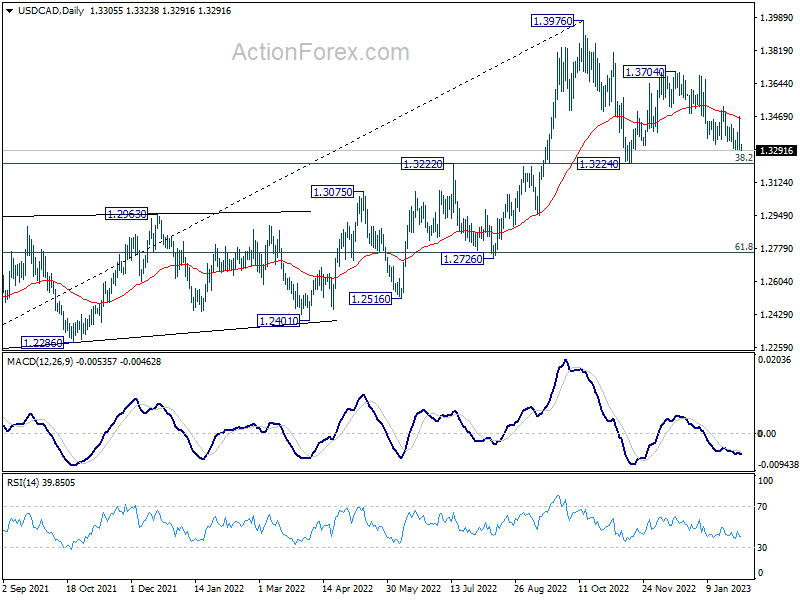
USD/CAD's choppy decline from 1.3704 resumed after brief recovery to 1.3470 and intraday bias is back on the downside. Further fall would be seen but strong support is still expected from 1.3224 key support level to bring rebound. On the upside, above 1.3470 minor resistance will turn intraday bias back to the upside for 1.3519 resistance. However, decisive break of 1.3224 would carry larger bearish implication.
In the bigger picture, as long as 1.3222 cluster support (38.2% retracement of 1.2005 to 1.3976 at 1.3223) holds, larger up trend from 1.2005 (2021 low) is still expected to resume through 1.3976 high at a later stage. However, firm break of 1.3222/3 will indicate that the trend might have reversed. Deeper fall would be seen to next cluster support at 1.2726 (61.8% retracement at 1.2758).
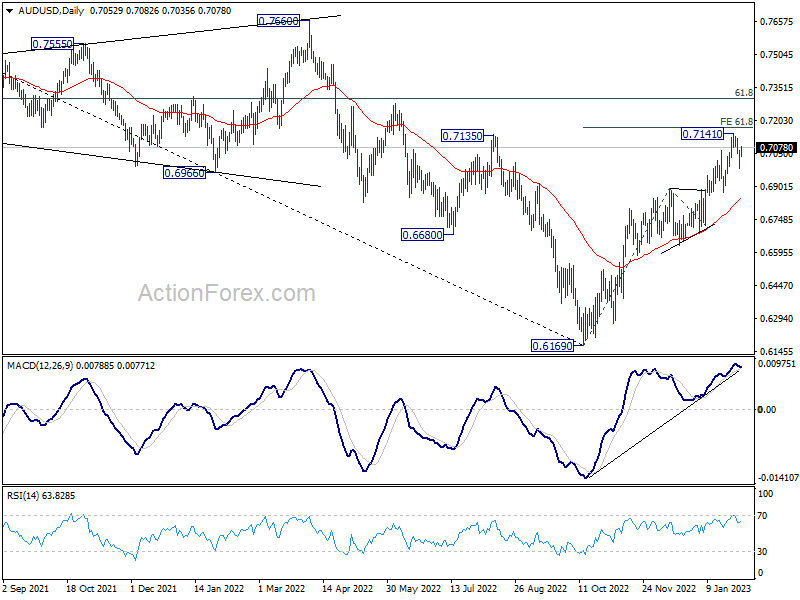
AUD/USD Daily Outlook
Daily Pivots: (S1) 0.7003; (P) 0.7035; (R1) 0.7087; More…
AUD/USD recovered after dipping to 0.6982 and intraday bias is turned neutral first. Risk stays mildly on the downside as long as 0.7141 resistance holds. Below 0.6982 will resume the correction to 0.6871 support, or further to 55 day EMA (now at 0.6848). On the upside, firm break of 0.7141 will resume the rally from 0.6169 to 0.7304 fibonacci level.
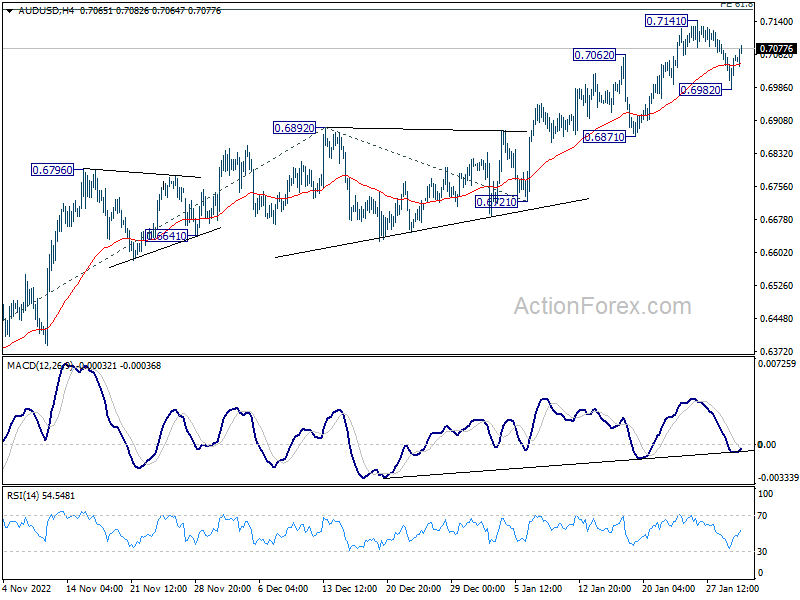
In the bigger picture, corrective decline from 0.8006 (2021 high) should have completed with three waves down to 0.6169 (2022 low). Further rally should be seen to 61.8% retracement of 0.8006 to 0.6169 at 0.7304. Sustained break there will pave the way to retest 0.8006. This will now remain the favored case as long as 0.6721 support holds.