Sample Category Title
Gold Price Started a Fresh Increase from $1,900
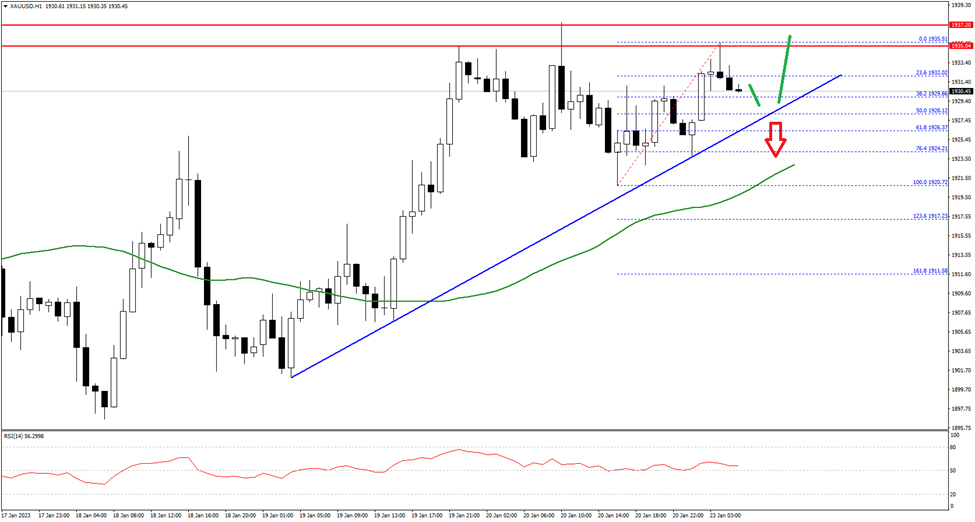
Gold price started a fresh increase from the $1,900 zone against the US Dollar. The price was able to settle above the $1,915 level to move further into a positive zone.
The pair even climbed above the $1,920 level and the 50 hourly simple moving average. The price is now trading above the $1,925 level and is showing positive signs. An immediate resistance on the upside is near the $1,935 level.
The first major resistance is near $1,938 on FXOpen. The next main resistance could be near the $1,945 level, above which the price could start a steady increase towards the $1,955 level.
On the downside, an immediate support is near the $1,927 level and a connecting bullish trend line. The next major support is near the $1,922 level, below which the price might decline towards the $1,905 support level in the near term. Any more losses might call for a test of $1,900.
USD/JPY: Bearish Trend Likely to Complete Near 127.55
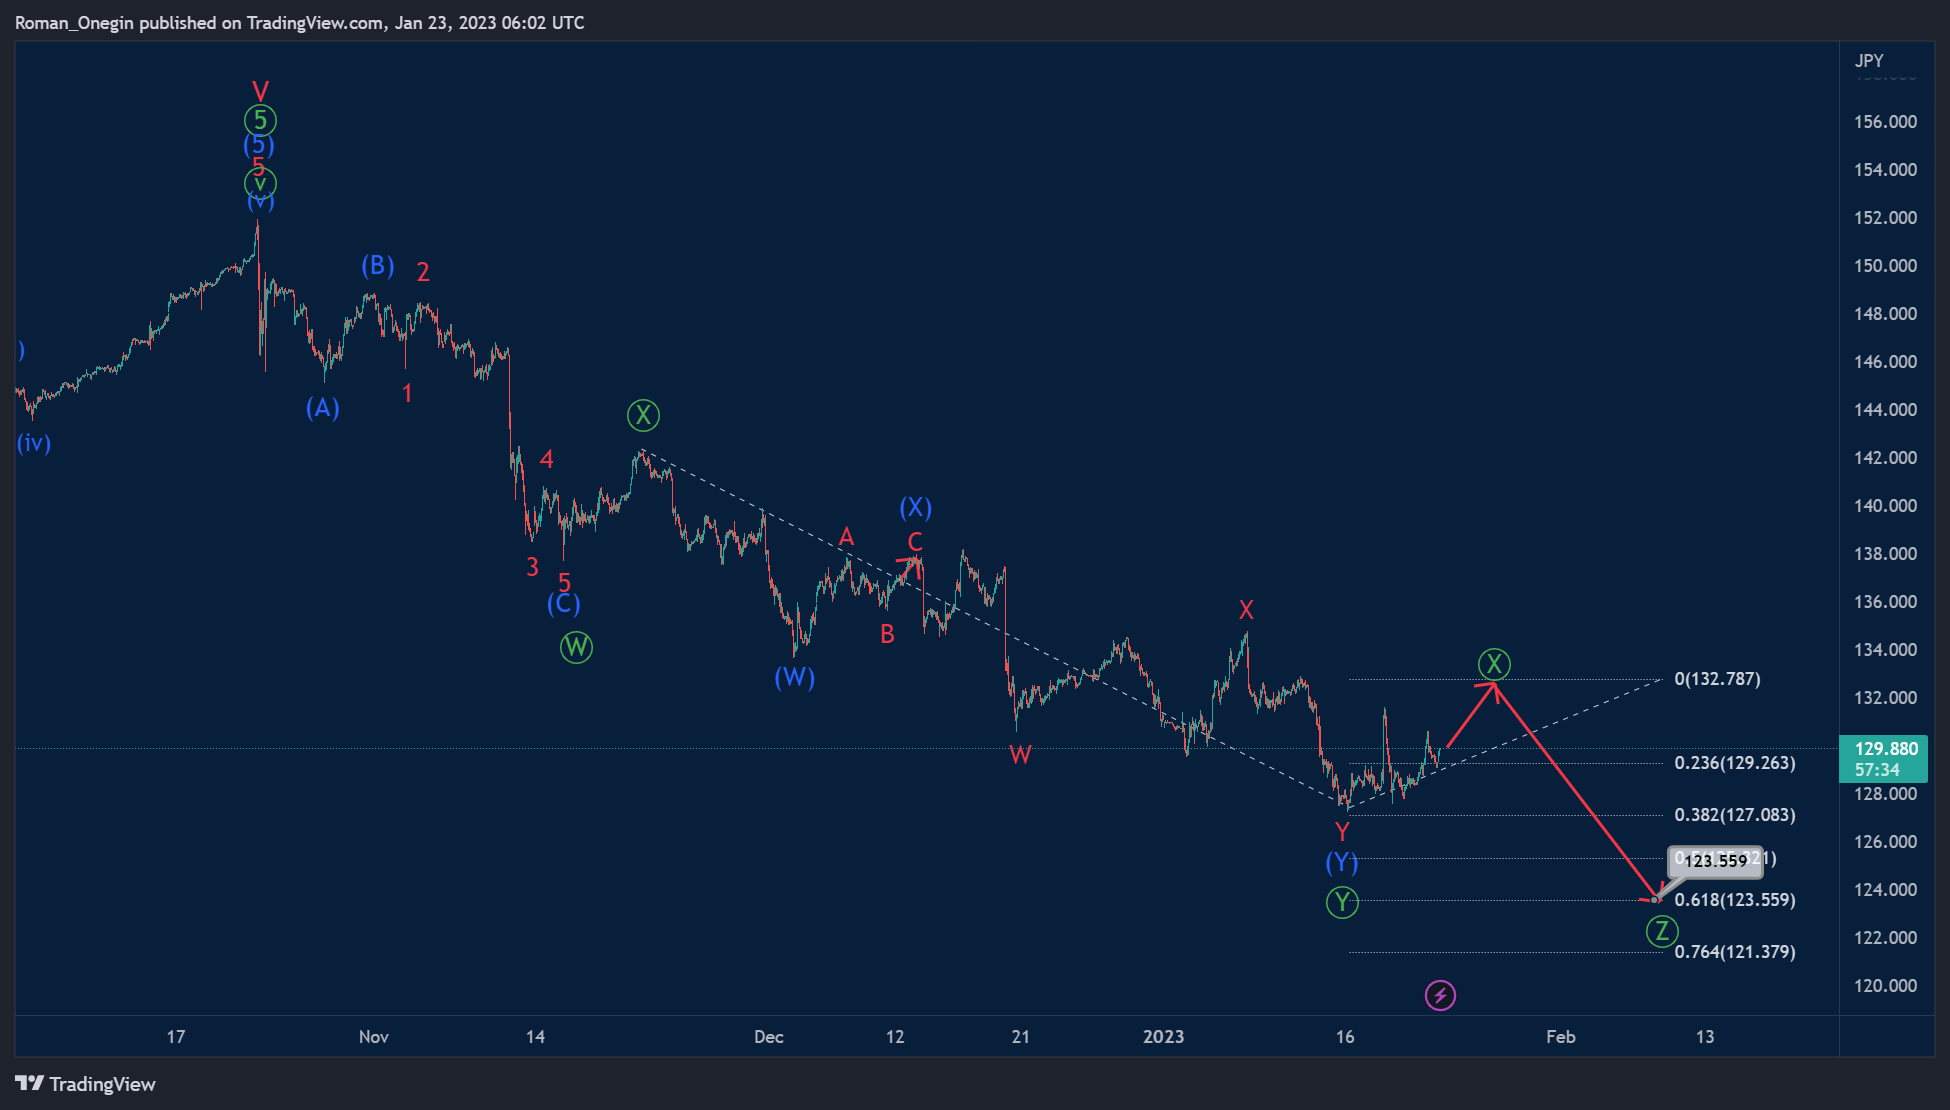
USDJPY suggests that the formation of a global cycle impulse could have been completed not so long ago. Then the fall of the exchange rate and the construction of a new bearish trend began.
Perhaps the market is developing a bearish triple zigzag of the primary degree Ⓦ-Ⓧ-Ⓨ-Ⓧ-Ⓩ. It is possible that the sub-waves Ⓦ-Ⓧ-Ⓨ have been completed to date.
Thus, in the near future we can expect the completion of the second intervening wave Ⓧ, after which it is possible to fall in the wave Ⓩ to 123.559. At that level, wave Ⓩ will be at 61.8% of wave Ⓨ.
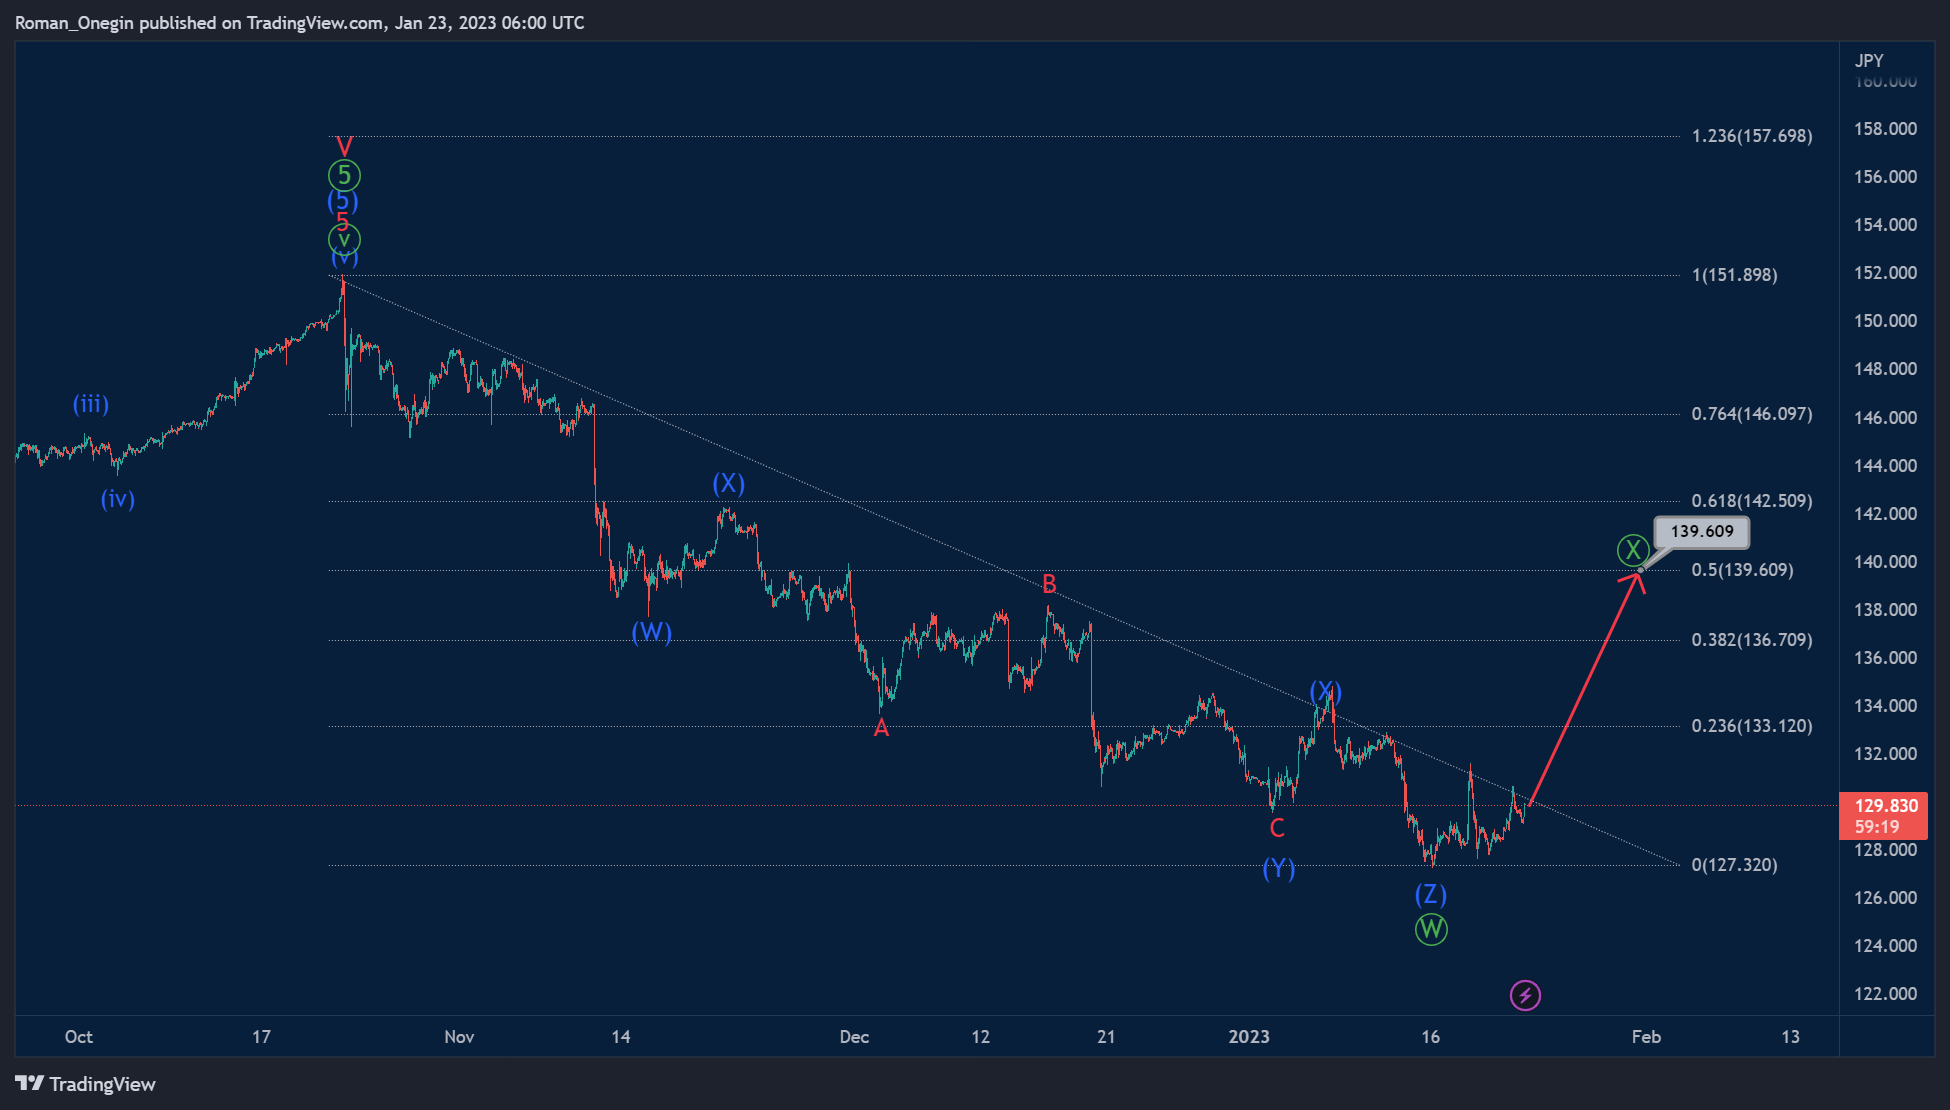
Alternatively, it is assumed that in the bearish double zigzag, only the first actionary wave Ⓦ is completed, and the intervening wave Ⓧ is still under development.
It is possible that in the near future the price growth may continue in the wave Ⓧ to the level of 139.60.
At that level, wave Ⓧ will be at 50% along the Fibonacci lines of wave Ⓦ.
GBP/JPY Daily Outlook
Daily Pivots: (S1) 159.36; (P) 160.33; (R1) 161.61; More...
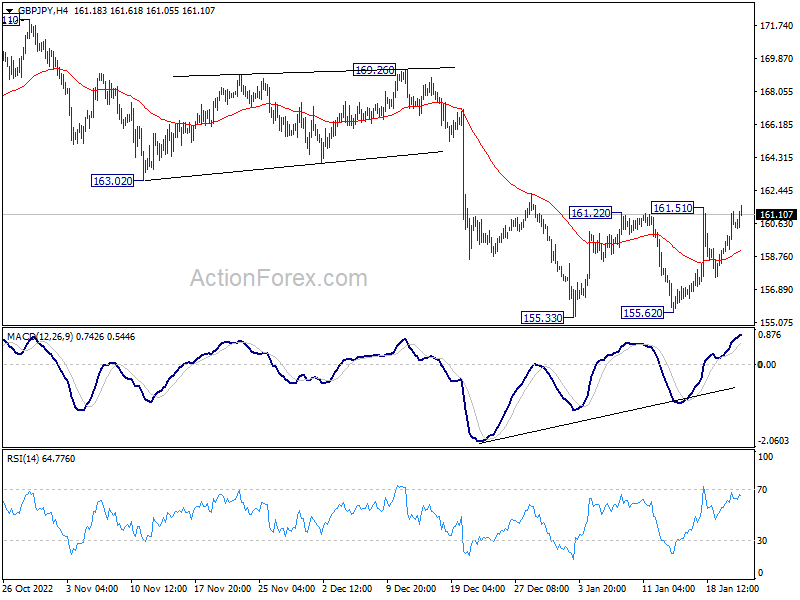
Intraday bias in GBP/JPY stays neutral for the moment. On the upside, above 161.51 will bring further rise to 55 day EMA (now at 162.32). Sustained trading above there will pave the way to retest 172.11 high. Nevertheless, on the downside, break of 155.33 will resume the whole decline from 172.11 to 153.70 fibonacci level.
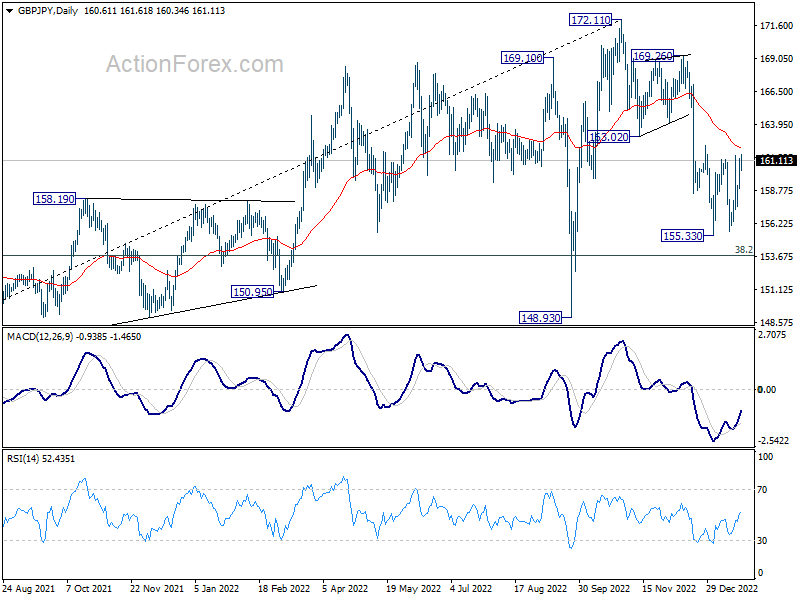
In the bigger picture, as long as 163.02 support turned resistance holds, decline from 172.11 medium term top is expected to continue to 38.2% retracement of 123.94 to 172.11 at 153.70. Sustained break there will raise the change of trend reversal and target 61.8% retracement at 142.34. Nevertheless, break of 163.02 support turned resistance will argue that the decline has completed, and retain medium term bullishness.
EUR/JPY Daily Outlook
Daily Pivots: (S1) 139.37; (P) 140.29; (R1) 141.58; More....
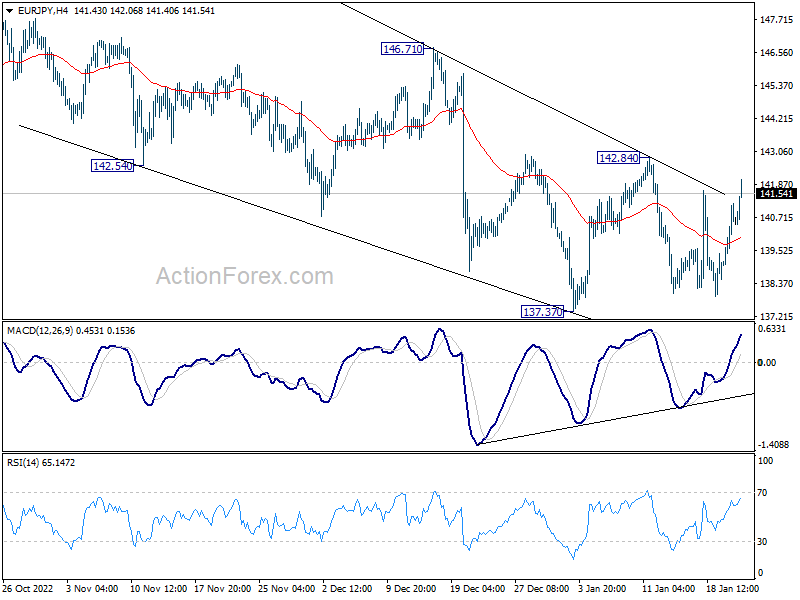
EUR/JPY is still bounded in range of 137.37/142.84 and intraday bias remains neutral. On the downside, break of 137.37 will resume the whole decline from 148.38 to 135.40 fibonacci level next. However, firm break of 142.84 will argue that the correction from 148.38 has completed, and bring stronger rise back to 146.71 resistance.
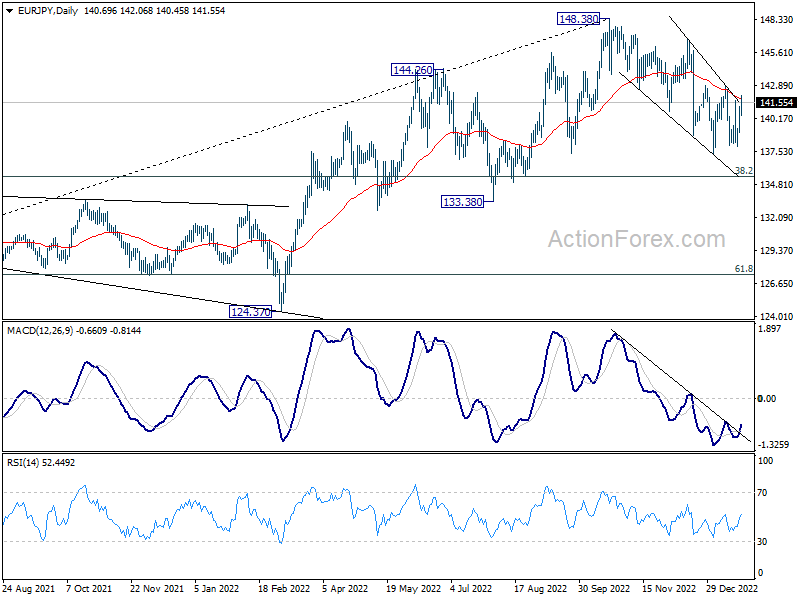
In the bigger picture, as long as 55 week EMA (now at 138.62) holds, larger up trend from 114.42 (2020 low) is still in progress for 149.76 long term resistance. However, firm break of 55 week EMA will bring deeper fall to 38.2% retracement of 114.42 to 148.38 at 135.40. Sustained break there will raise the chance of trend reversal, and target 61.8% retracement at 127.39.
EUR/GBP Daily Outlook
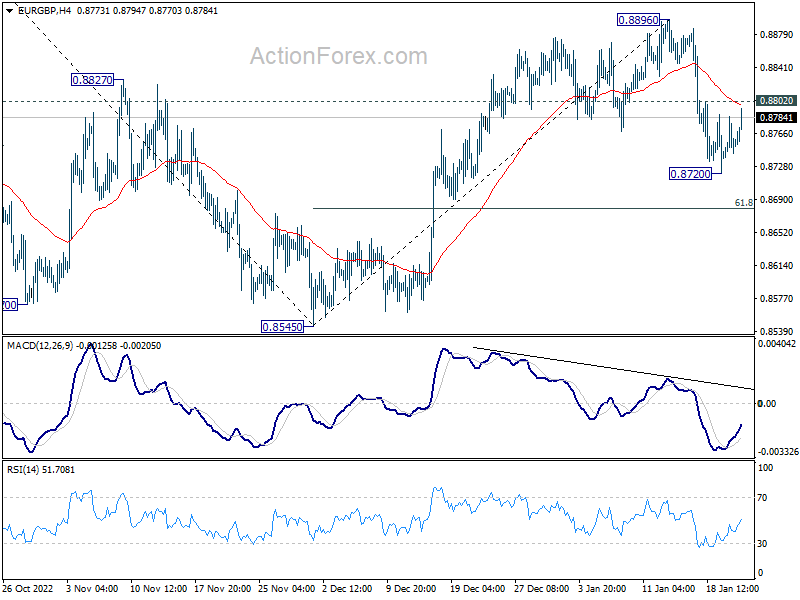
Daily Pivots: (S1) 0.8735; (P) 0.8760; (R1) 0.0.8782; More...
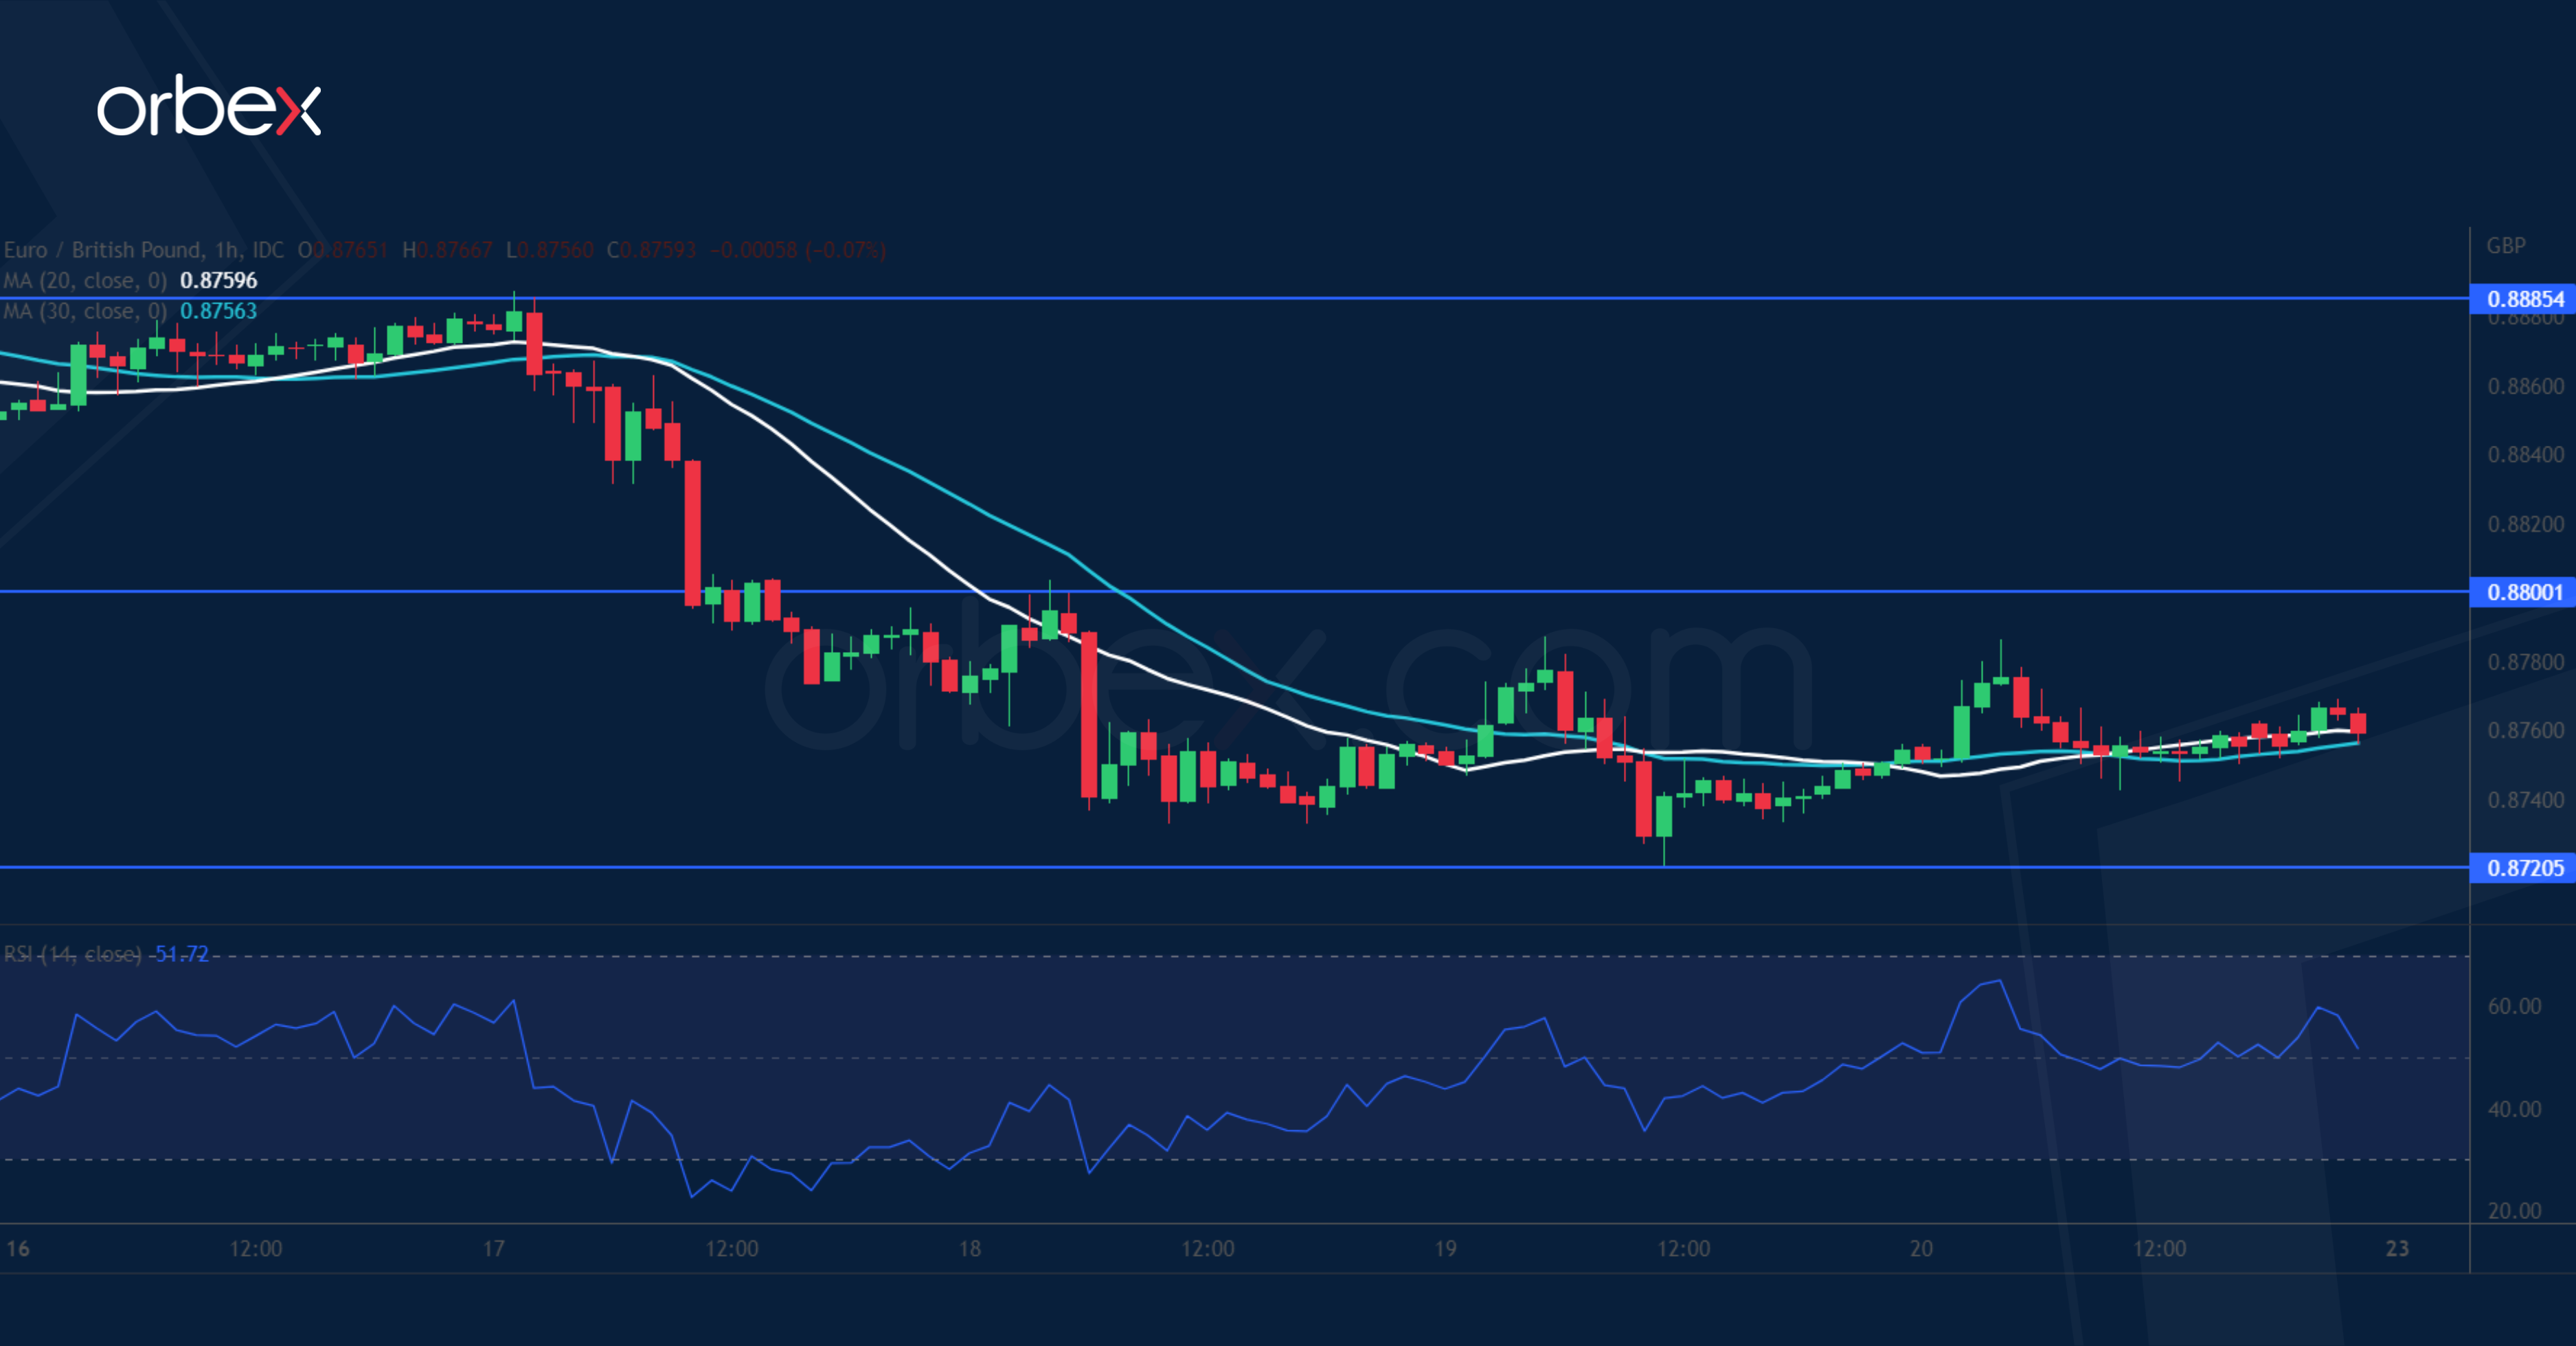
Intraday bias in EUR/GBP remains neutral at this point. On the downside, below 0.8720 will resume the fall from 0.8896 to 61.8% retracement of 0.8545 to 0.8896 at 0.8679. Sustained break there will pave the way back to retest 0.8545 low. On the upside, though, above 0.8802 will bring retest of 0.8896 resistance.
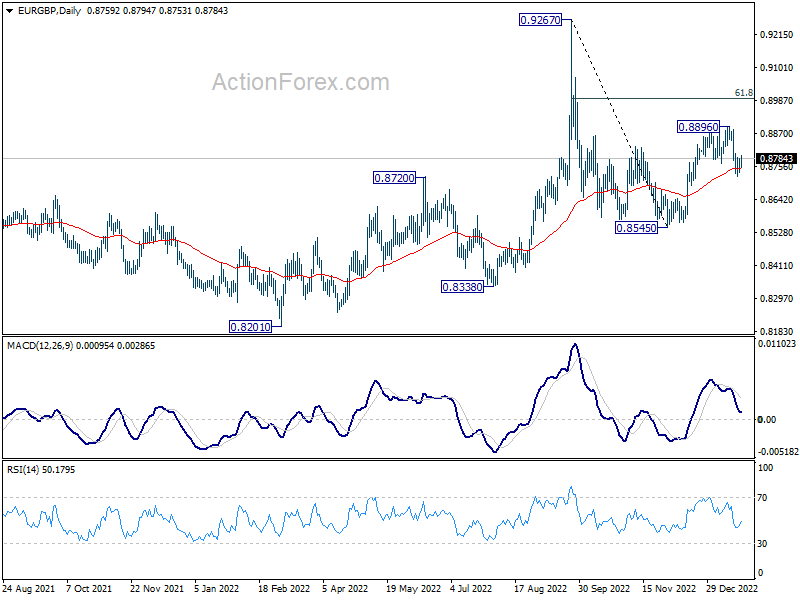
In the bigger picture, current development argues that rebound from 0.8545 is merely a correction to fall from 0.9267. Sustained trading below 55 day EMA (now at 0.8748) will affirm this bearish case and target 0.8545 and below. Nevertheless, strong rebound from current level will retain near term bullishness for another rise through 0.8896 later.
EUR/AUD Daily Outlook
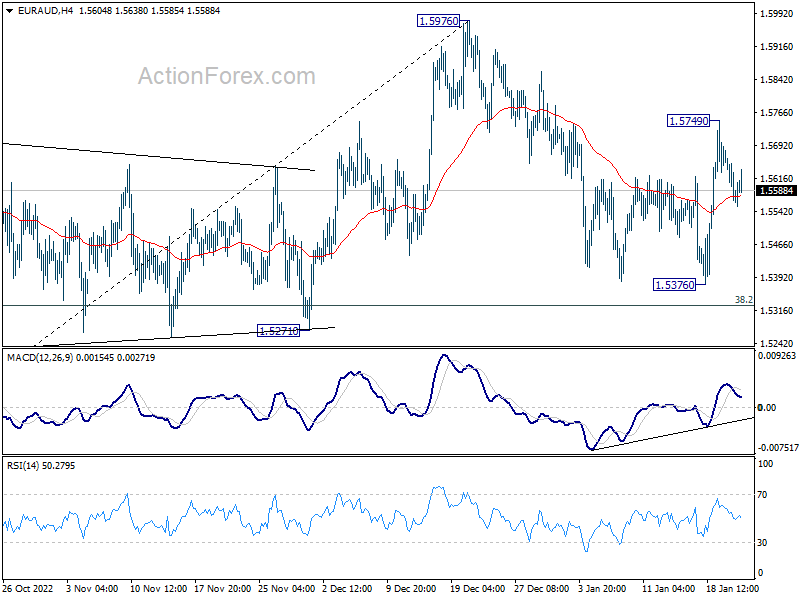
Daily Pivots: (S1) 1.5536; (P) 1.5609; (R1) 1.5654; More...
Intraday bias in EUR/AUD remains neutral for the moment. Corrective pattern from 1.5976 could still extend with another fall. But strong support could be seen from 38.2% retracement of 1.4281 to 1.5976 at 1.5329 to bring rebound. On the upside, above 1.5749 will resume the rise from 1.5376 for retesting 1.5976 high.
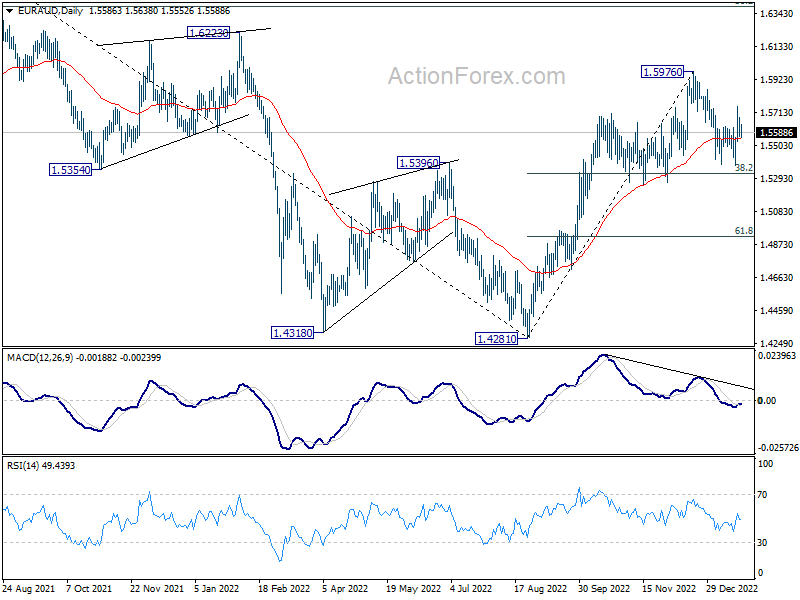
In the bigger picture, it's still early to confirm if rise from 1.4281 represents bullish trend reversal. But as long as 1.5271 support holds, such rally is in favor to continue. Break of 1.5976 will target 1.6434 key resistance next. On the other hand, firm break of 1.5271 will retain medium term bearishness instead.
EUR/CHF Daily Outlook
Daily Pivots: (S1) 0.9939; (P) 0.9969; (R1) 1.0021; More....
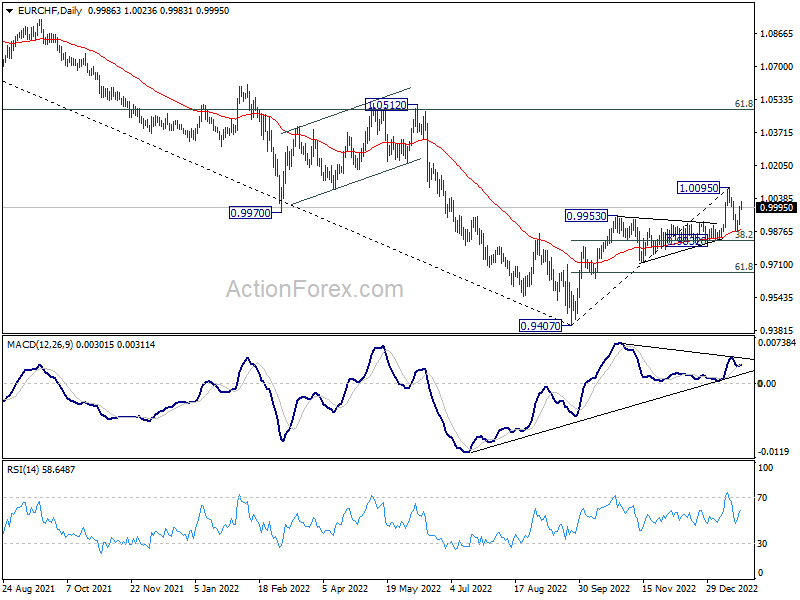
Intraday bias in EUR/CHF remains on the upside as rebound from 0.9873 extends higher today. Further rise would be seen to retest 1.0095 resistance. On the downside, though, break of 0.9952 minor support will turn bias back to the downside to resume the correction to 38.2% retracement of 0.9407 to 1.0095 at 0.9832.
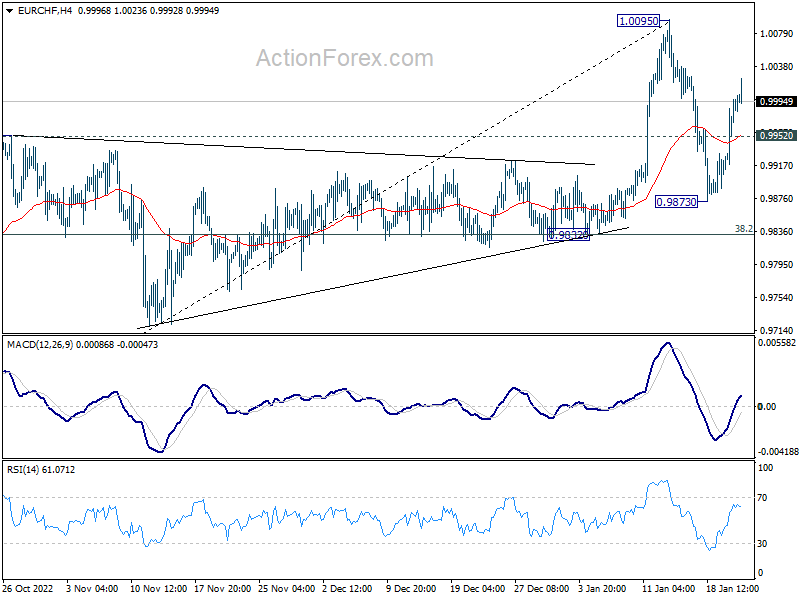
In the bigger picture, the initial rejection by 55 week EMA (now at 1.0039) mixed up the outlook. On the upside, sustained trading above 55 week EMA will raise the chance of bullish trend reversal. Rise form 0.9407 should then target 1.0505 cluster resistance (2020 low at 1.0505, 61.8% retracement of 1.1149 to 0.9407 at 1.1484). However, firm break of 0.9832 support will revive medium term bearishness and bring retest of 0.9407 low instead.
Gold Falls Slightly Below the 9-Month Gigh
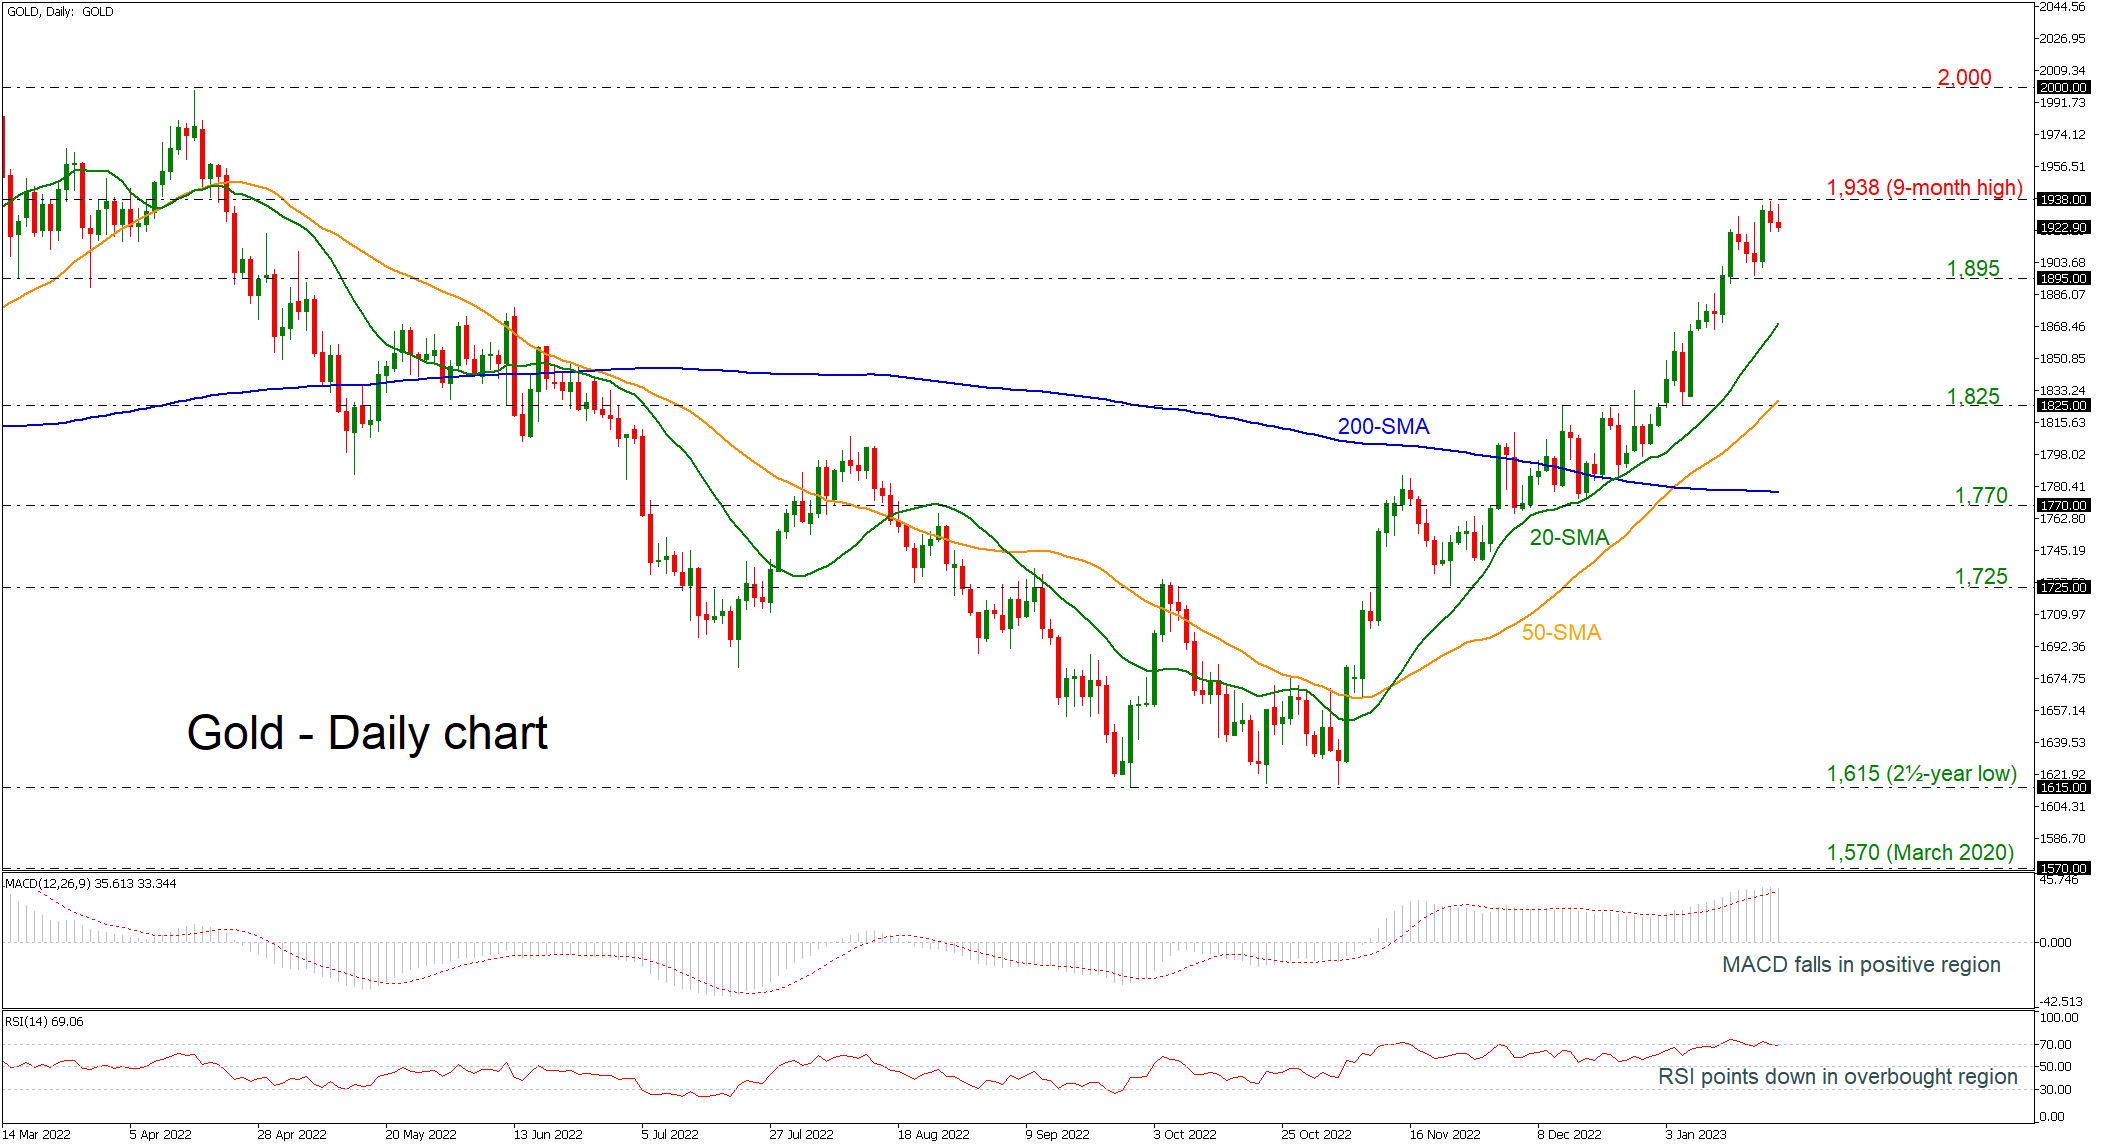
Gold rallied towards a fresh nine-month high of 1,938 in the preceding week, but quickly lost some ground and is currently moving slightly lower. The commodity added more than 20% from the two-and-a-half-year low of 1,615 and is holding well above the short-term simple moving averages (SMAs).
Technically, the MACD oscillator is moving marginally lower near its trigger line in the positive territory, while the RSI is easing after the pullback in the overbought region, suggesting that the momentum is weakening.
More downside pressures may open the door for the 1,895 barrier ahead of the 20-day SMA at 1,870 and the 50-day SMA, which overlaps with the 1,825 support. Any moves towards the 200-day SMA at 1,777 and below that at 1,770 could switch the outlook to neutral in the near-term timeframe.
In the positive scenario, a climb beyond the nine-month peak of 1,938 could drive the market towards the crucial 2,000 round number, reached in April 2022, before challenging the 20-month peak of 2,070.40.
Summarizing, gold is looking predominantly bullish in the medium-term timeframe, and only a decline beneath the 1,770 obstacle may change this view.
Dax 40 Holds on to Gains
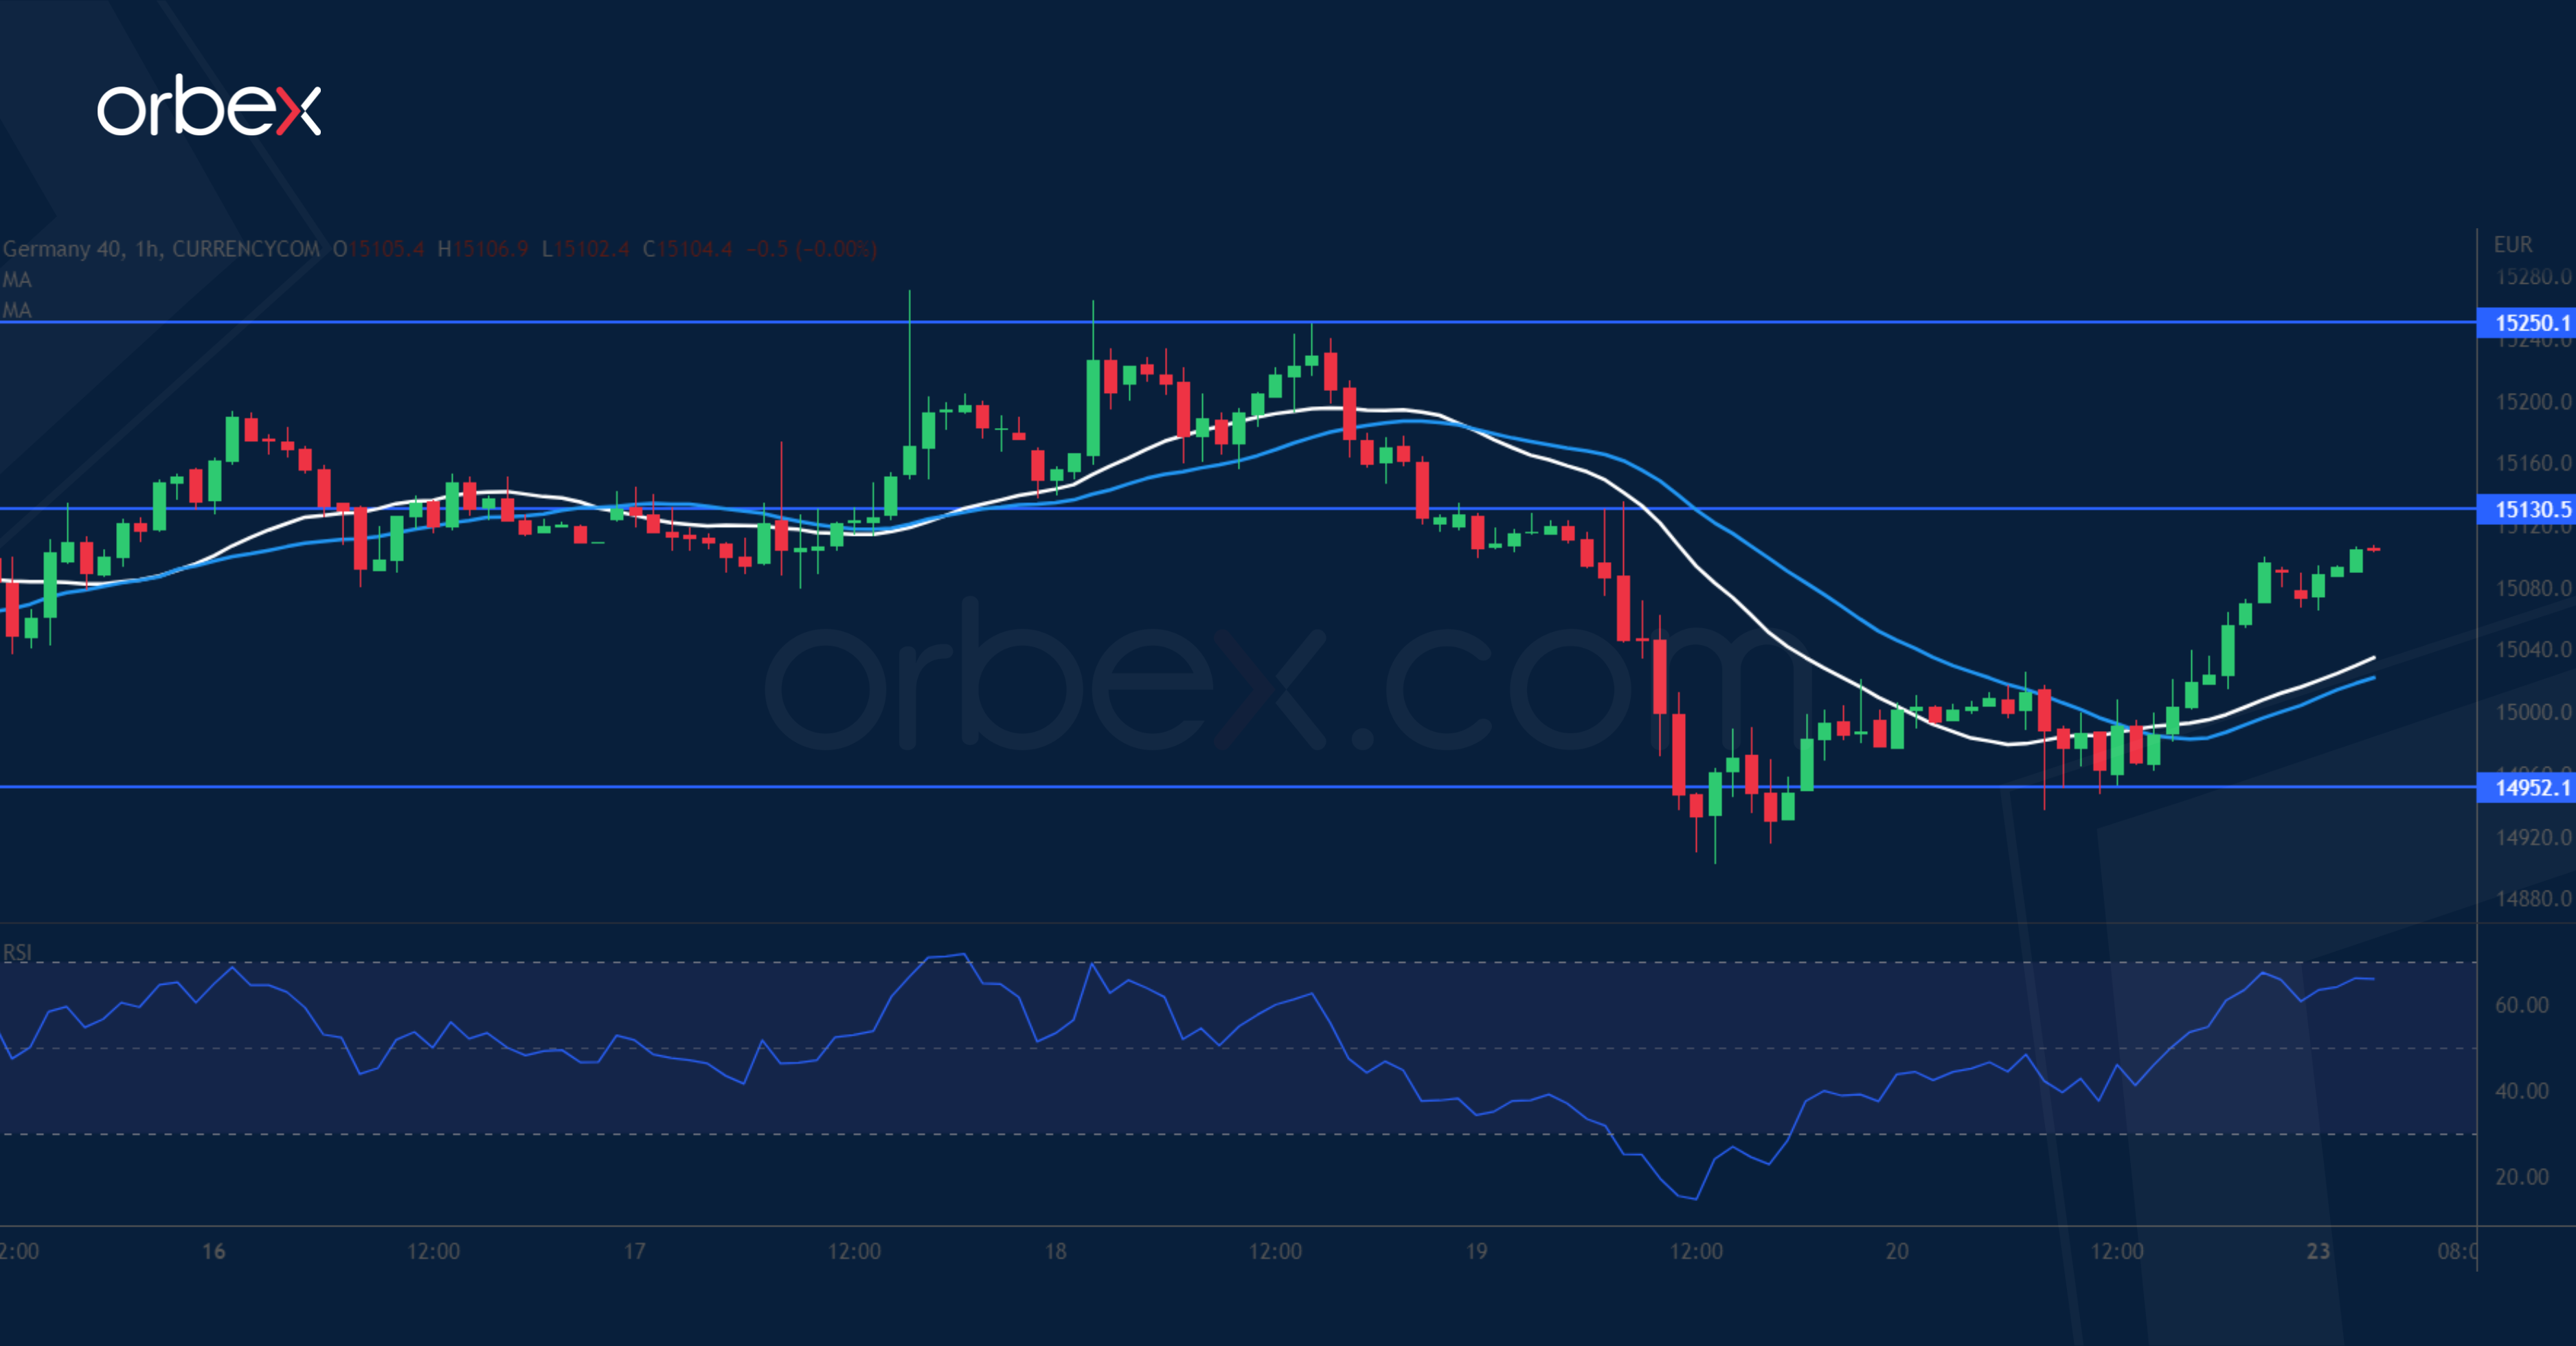
The Dax 40 recouped losses as investors saw a bargain hunting opportunity. On the daily chart, the RSI’s double top in the overbought area suggests overextension after the index recovered to a 11-month high. A break below 15100 then the psychological level of 15000 has prompted complacent buyers to look for the exit. The bounce may come under pressure at 15130 and only a close above 15250 would resume the uptrend. 14950 is a fresh support and 14800 further down is the next level to gauge buyers’ interest.
EUR/GBP Licks Wounds
Sterling fell back over weak retail sales in December. A sharp fall below the previous swing low at 0.8770 has put the bulls on the defensive. The single currency is resting on 0.8720 at the base of the bullish breakout in late December. Sentiment has grown cautious and the sideways action may end soon in a breakout. A hold above this critical floor would challenge 0.8800 where a breakout could help the pair recover to 0.8880. Failing that, a bearish turn would trigger a new round of sell-off and send the pair to 0.8650.