

Sample Category Title
AUDUSD Retraces Lower as Advance Falters Around 5-month Peak
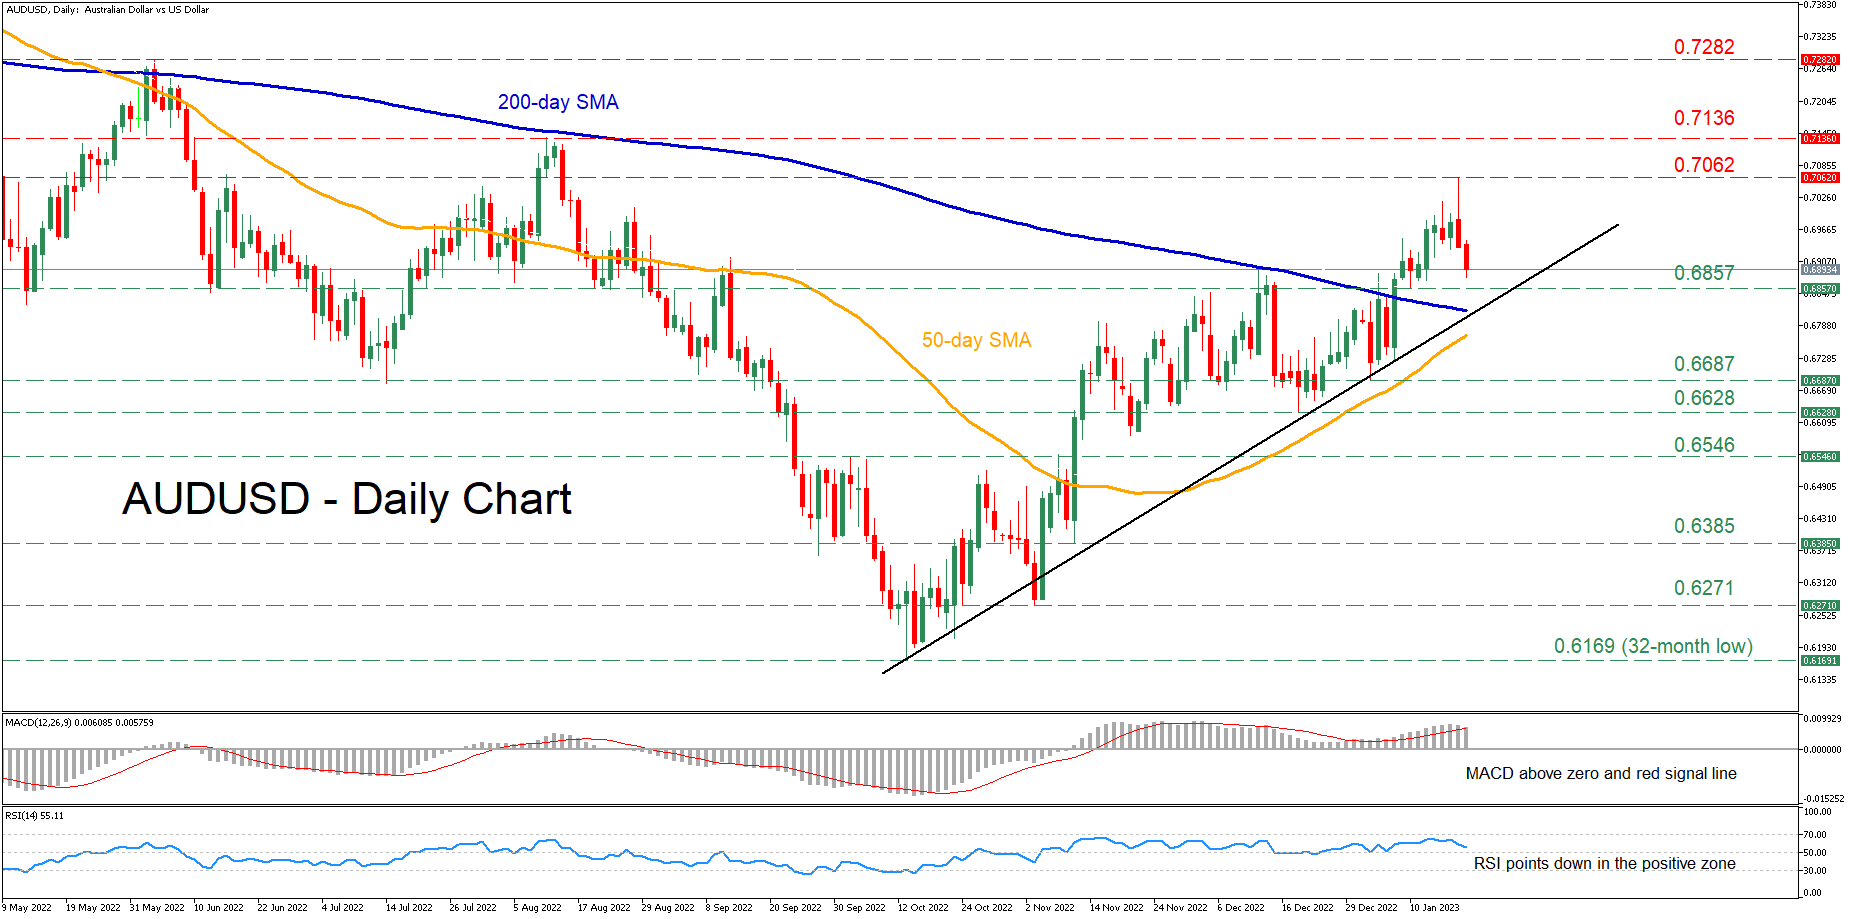
AUDUSD has been staging an impressive rebound after finding its feet at the 32-month low of 0.6169 in mid-October. Nevertheless, the pair has experienced a moderate pullback in the near term, with its latest advance getting rejected at a fresh five-month high of 0.7062.
The momentum indicators currently suggest that bullish forces are waning but retain control. Specifically, the MACD histogram is softening but continues to hold above both zero and its red signal line, while the RSI is pointing downwards in the positive territory.
Should selling pressures intensify further, the pair could decline towards the recent support of 0.6857. Sliding beneath that zone, the bears could aim for the January low of 0.6687 before the December bottom of 0.6628 comes under examination. Even lower, further retreats could cease at the 0.6546 barrier.
On the flipside, bullish actions might propel the price towards the recent rejection point of 0.7062. Conquering this barricade, the pair could extend its recovery to test the August peak of 0.7136. Breaking above the latter, the June high of 0.7282 could come under examination.
Overall, AUDUSD seems to be experiencing some weakness after its medium-term advance ran out of steam. However, a break above the recent rejection region could signal the continuation of the pair’s recovery.
WTI Futures Maintain Bearish Bias Below Downtrend Line
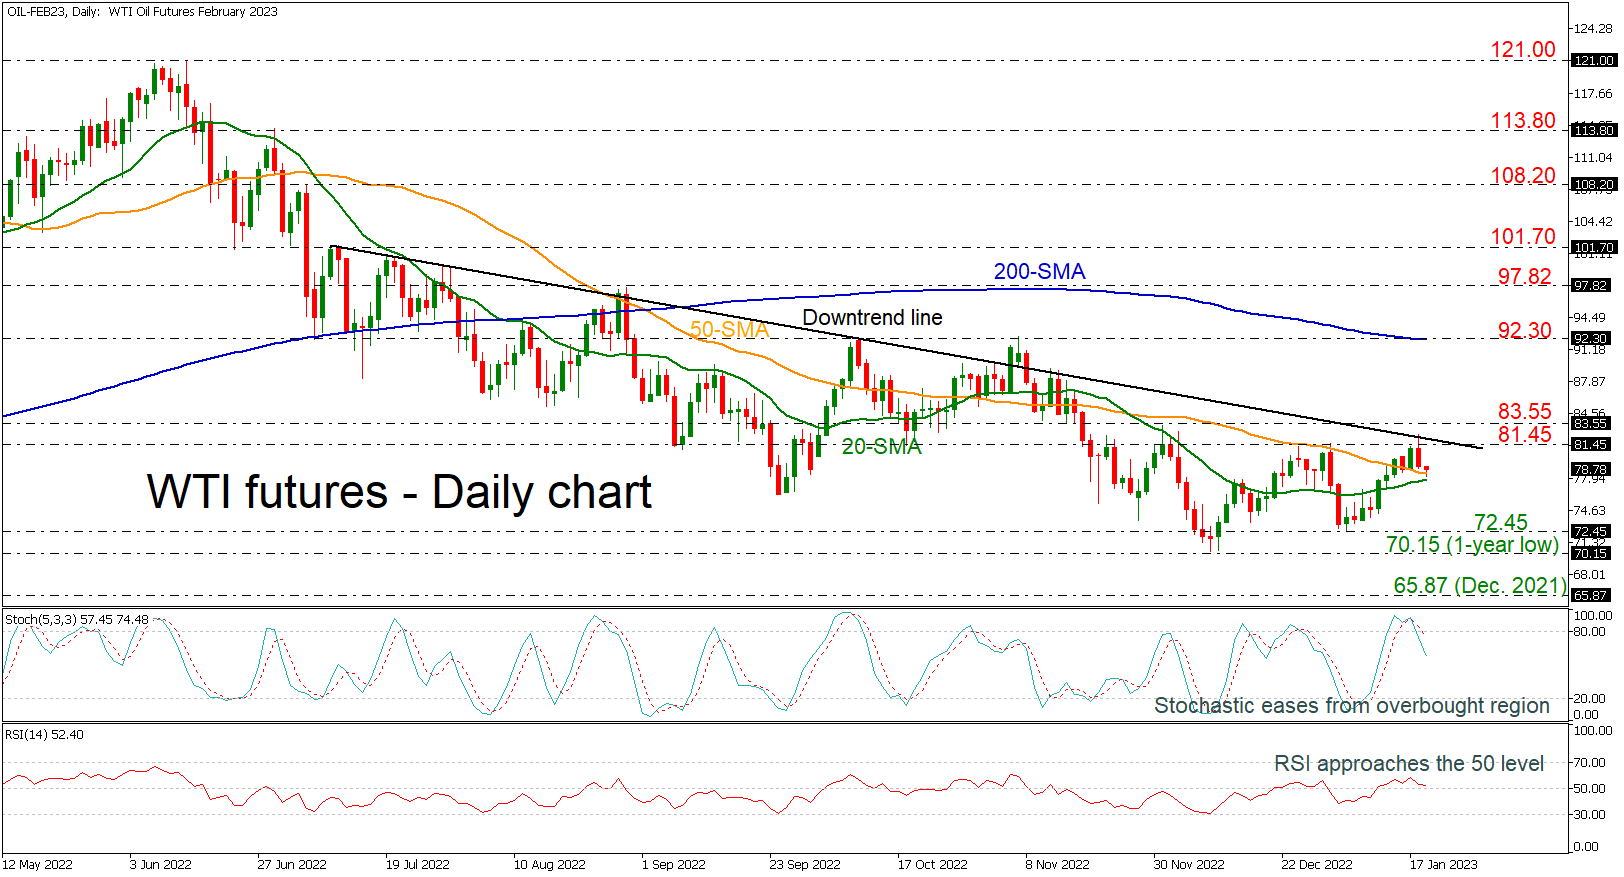
WTI crude oil futures are easing near the short-term simple moving averages (SMAs), which are ready to post a bullish crossover. The broader outlook is still bearish as the price remains beneath the long-term descending trend line.
Technically, the stochastic oscillator is heading south after the pullback from the overbought region, while the RSI is moving lower, approaching the neutral threshold of 50. Both are indicating more bearish actions in the near term timeframe.
If the market dives beneath the SMAs then immediate support level could come from the 72.45 barrier, ahead of the one-year low of 70.15. Further decreases could open the door for the December 2021 trough of 65.87.
On the flip side, a climb beyond the 81.45 resistance level and the descending trend line could meet the next obstacle at 83.55, while another key level at 92.30, which overlaps with the 200-day SMA, may halt the positive move.
Summarizing, oil prices are in a bearish mode; however, any moves above the downtrend line and the 200-day SMA may switch the picture to bullish.
XAU/USD Grinds Resistance
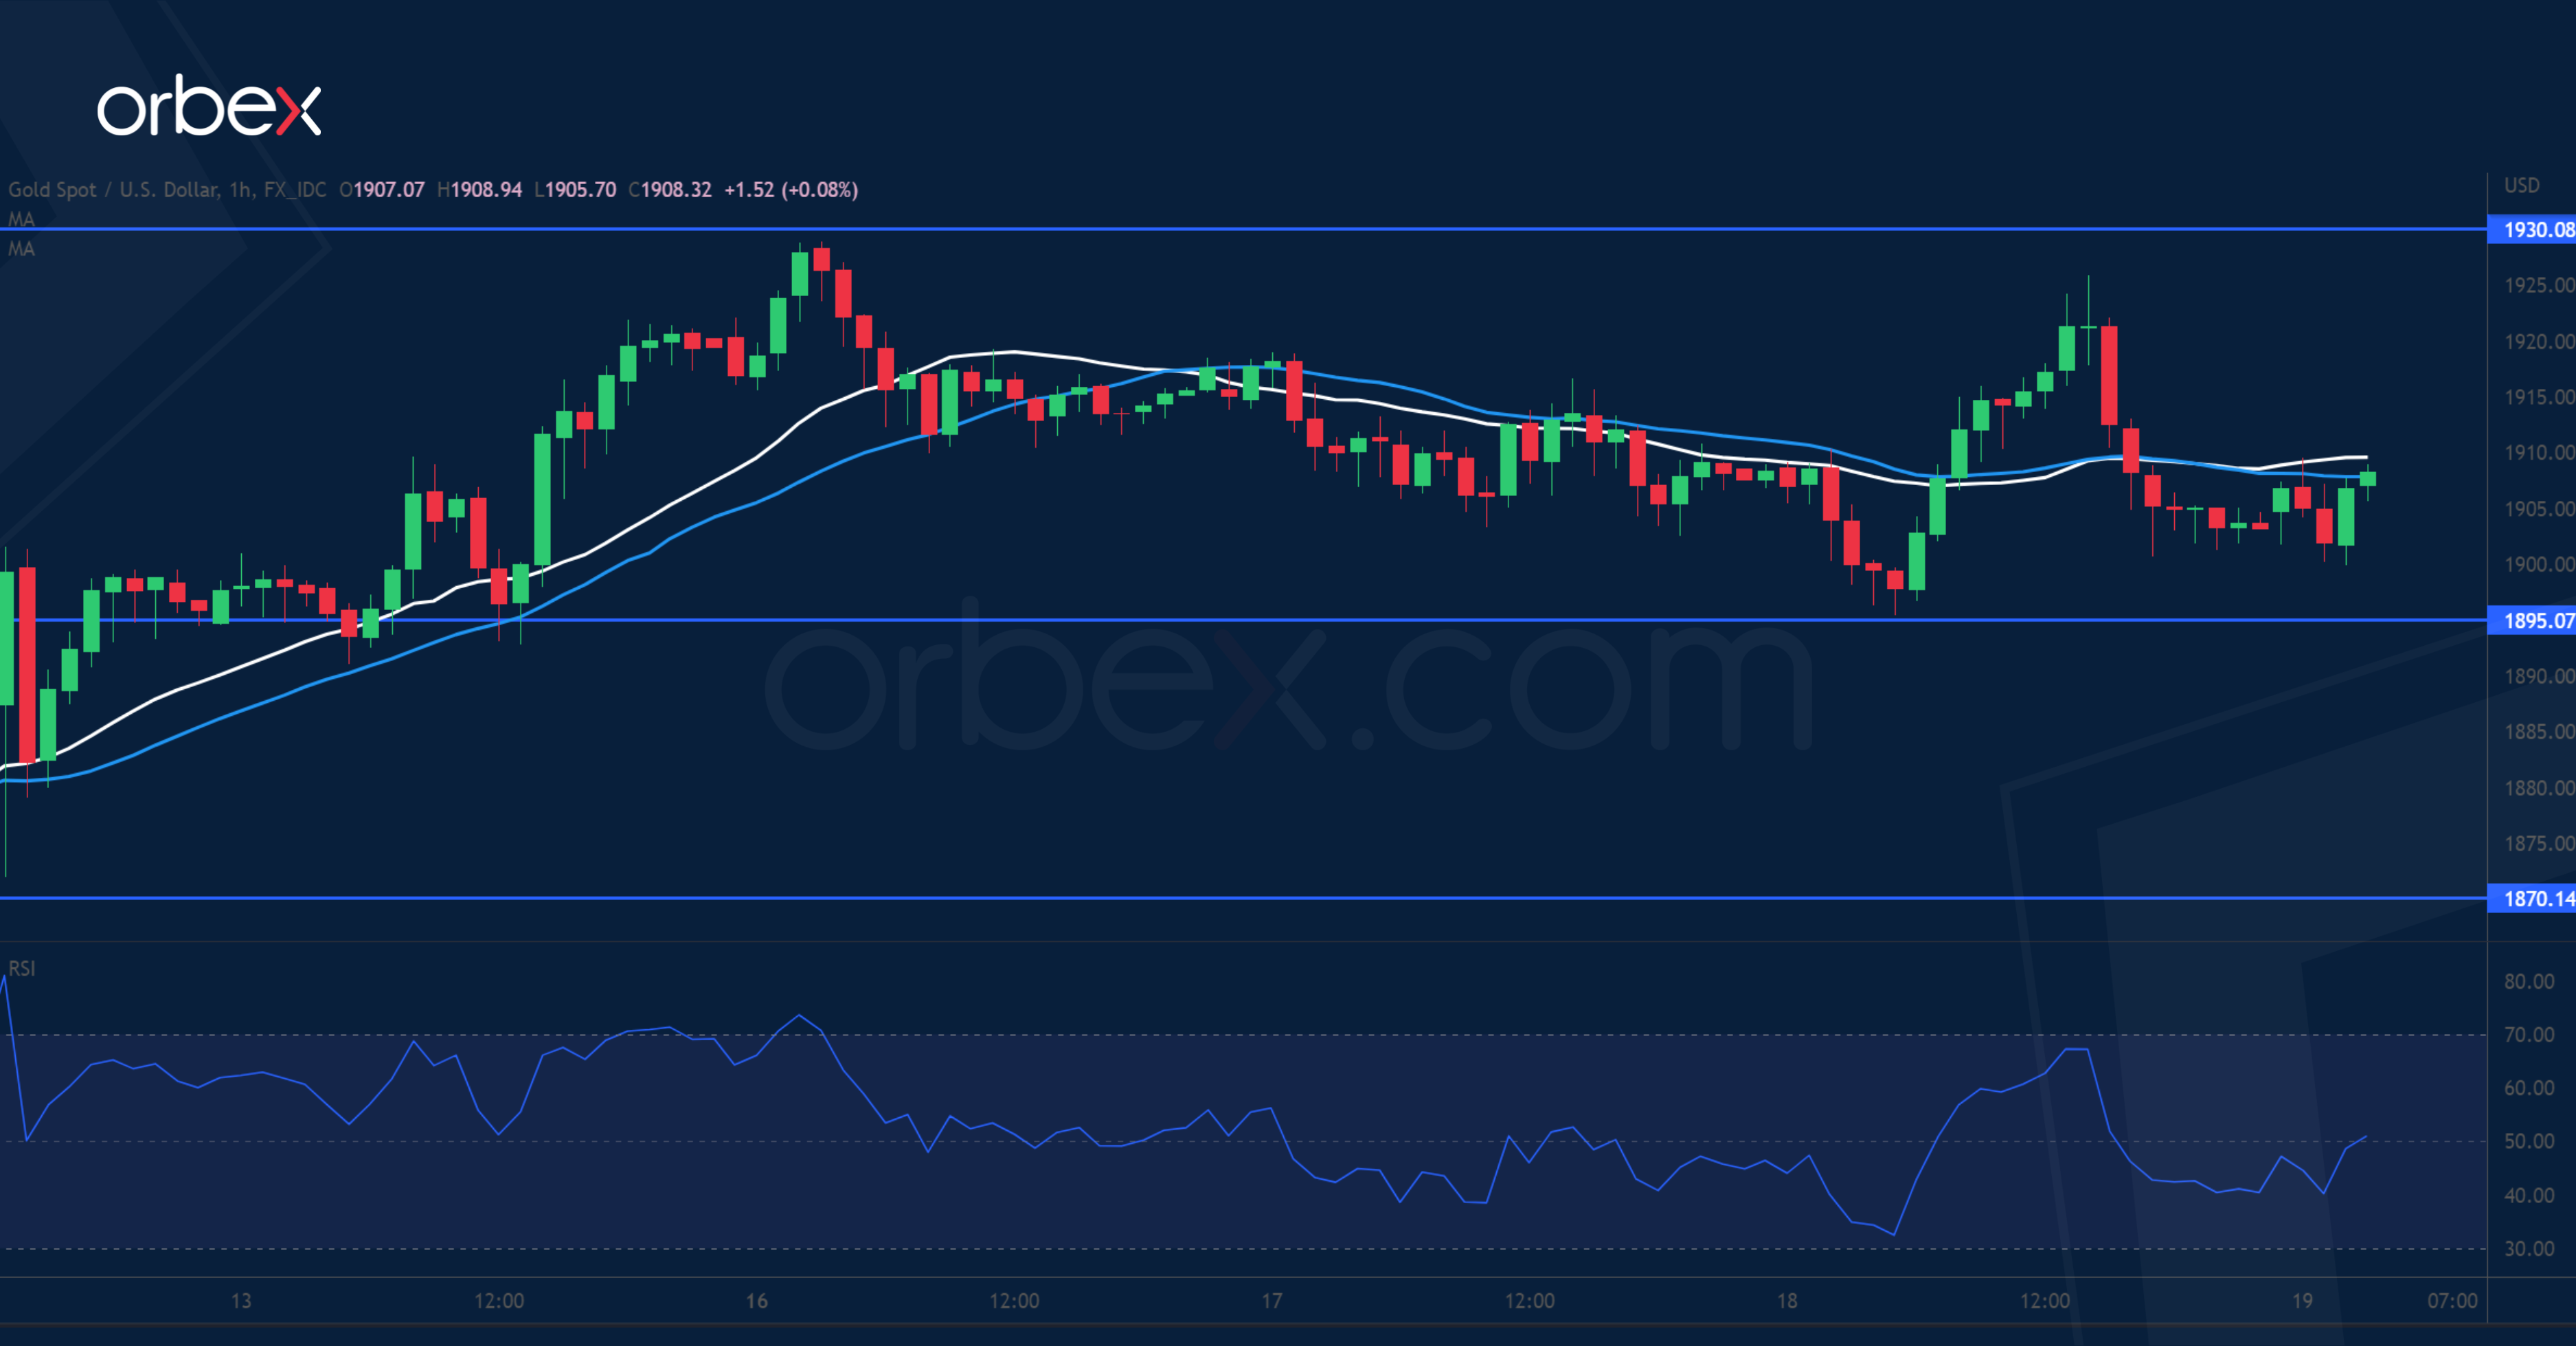
Gold retreated after Fed officials echoed hawkish sentiments. On the daily chart, the price is grinding the major supply zone around 1930 from last April’s sell-off. The RSI has ventured again into the overbought area and may prompt buyers to start to take chips off the table. 1895 is the first support on the hourly chart and a bounce above 1930 would renew the bullish pressure and send bullion to 1975, which is only a step away from its 9-month high of 1995. 1870 would be another support in case the metal runs out of steam.
GBP/USD Tests Major Resistance
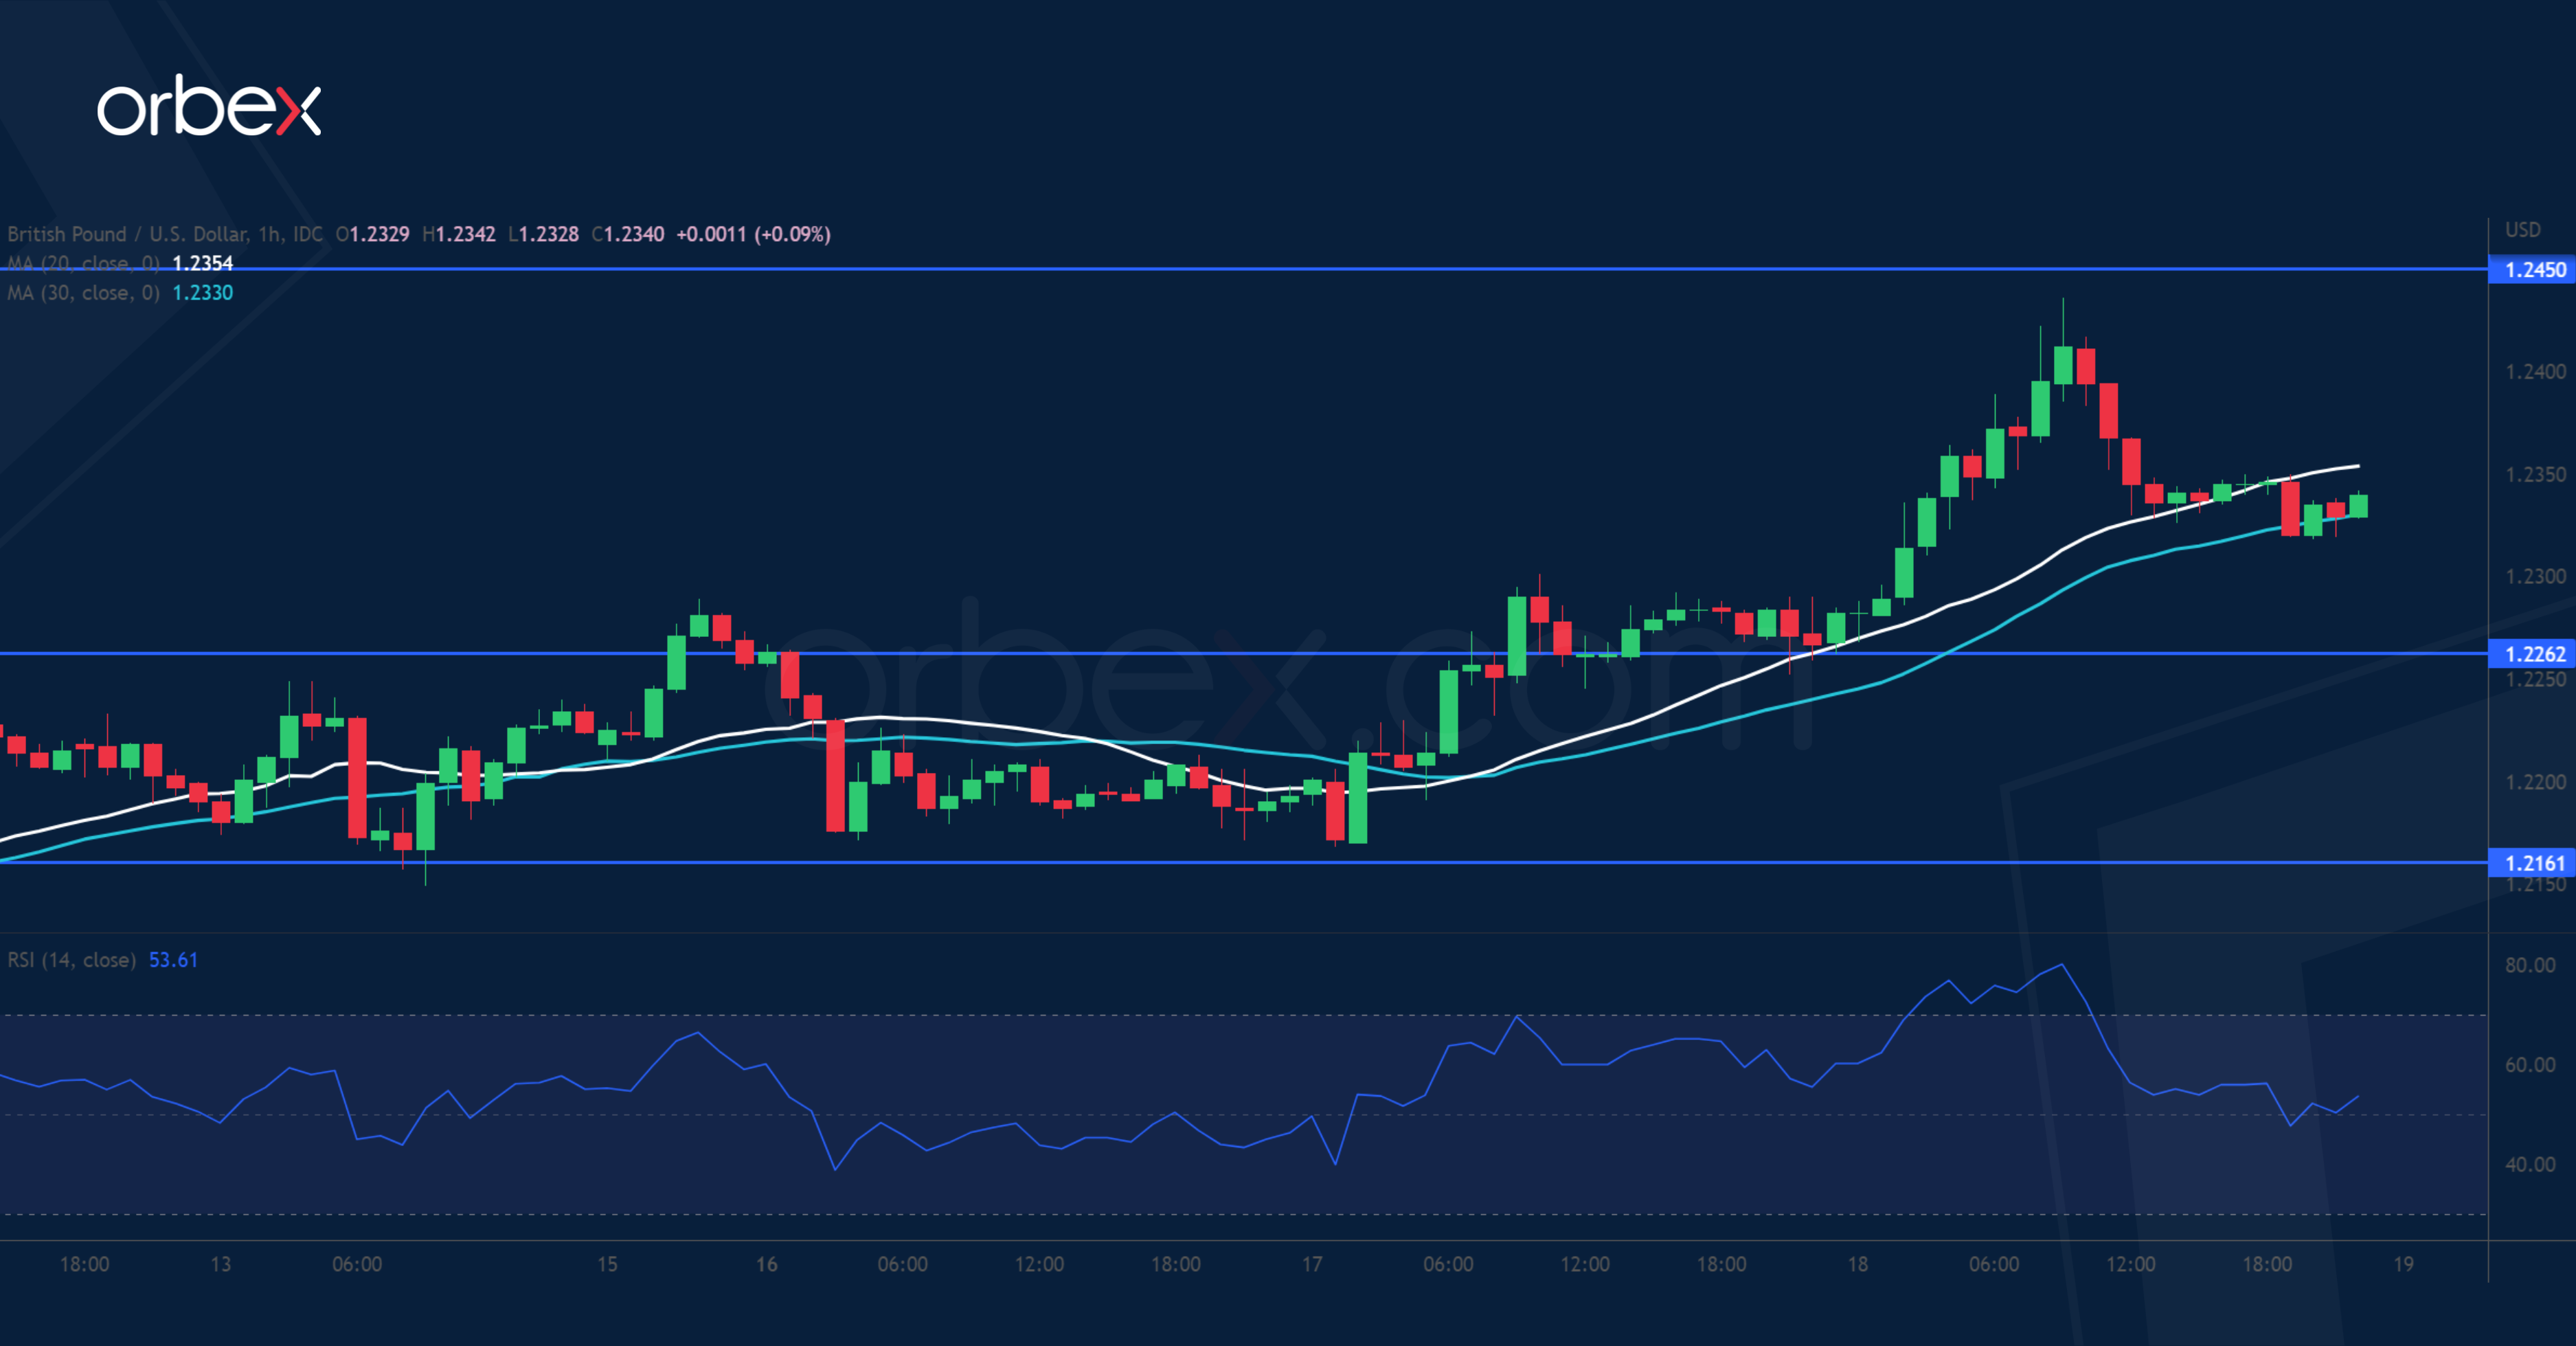
The US dollar faltered over lacklustre retail sales in December. The pair continues to capitalise on its bounce from the daily low at 1.1840, recouping most of the losses from the December sell-off. A close above 1.2300 has attracted more momentum and is pushing the cable to its five-week high at 1.2450. A break of which would help the bullish reversal gain traction. As the RSI shows an overbought situation, a drop towards 1.2260 may meet support from short-term trend followers. 1.2160 would be a second level of support.
USD/JPY Gives Up Gains
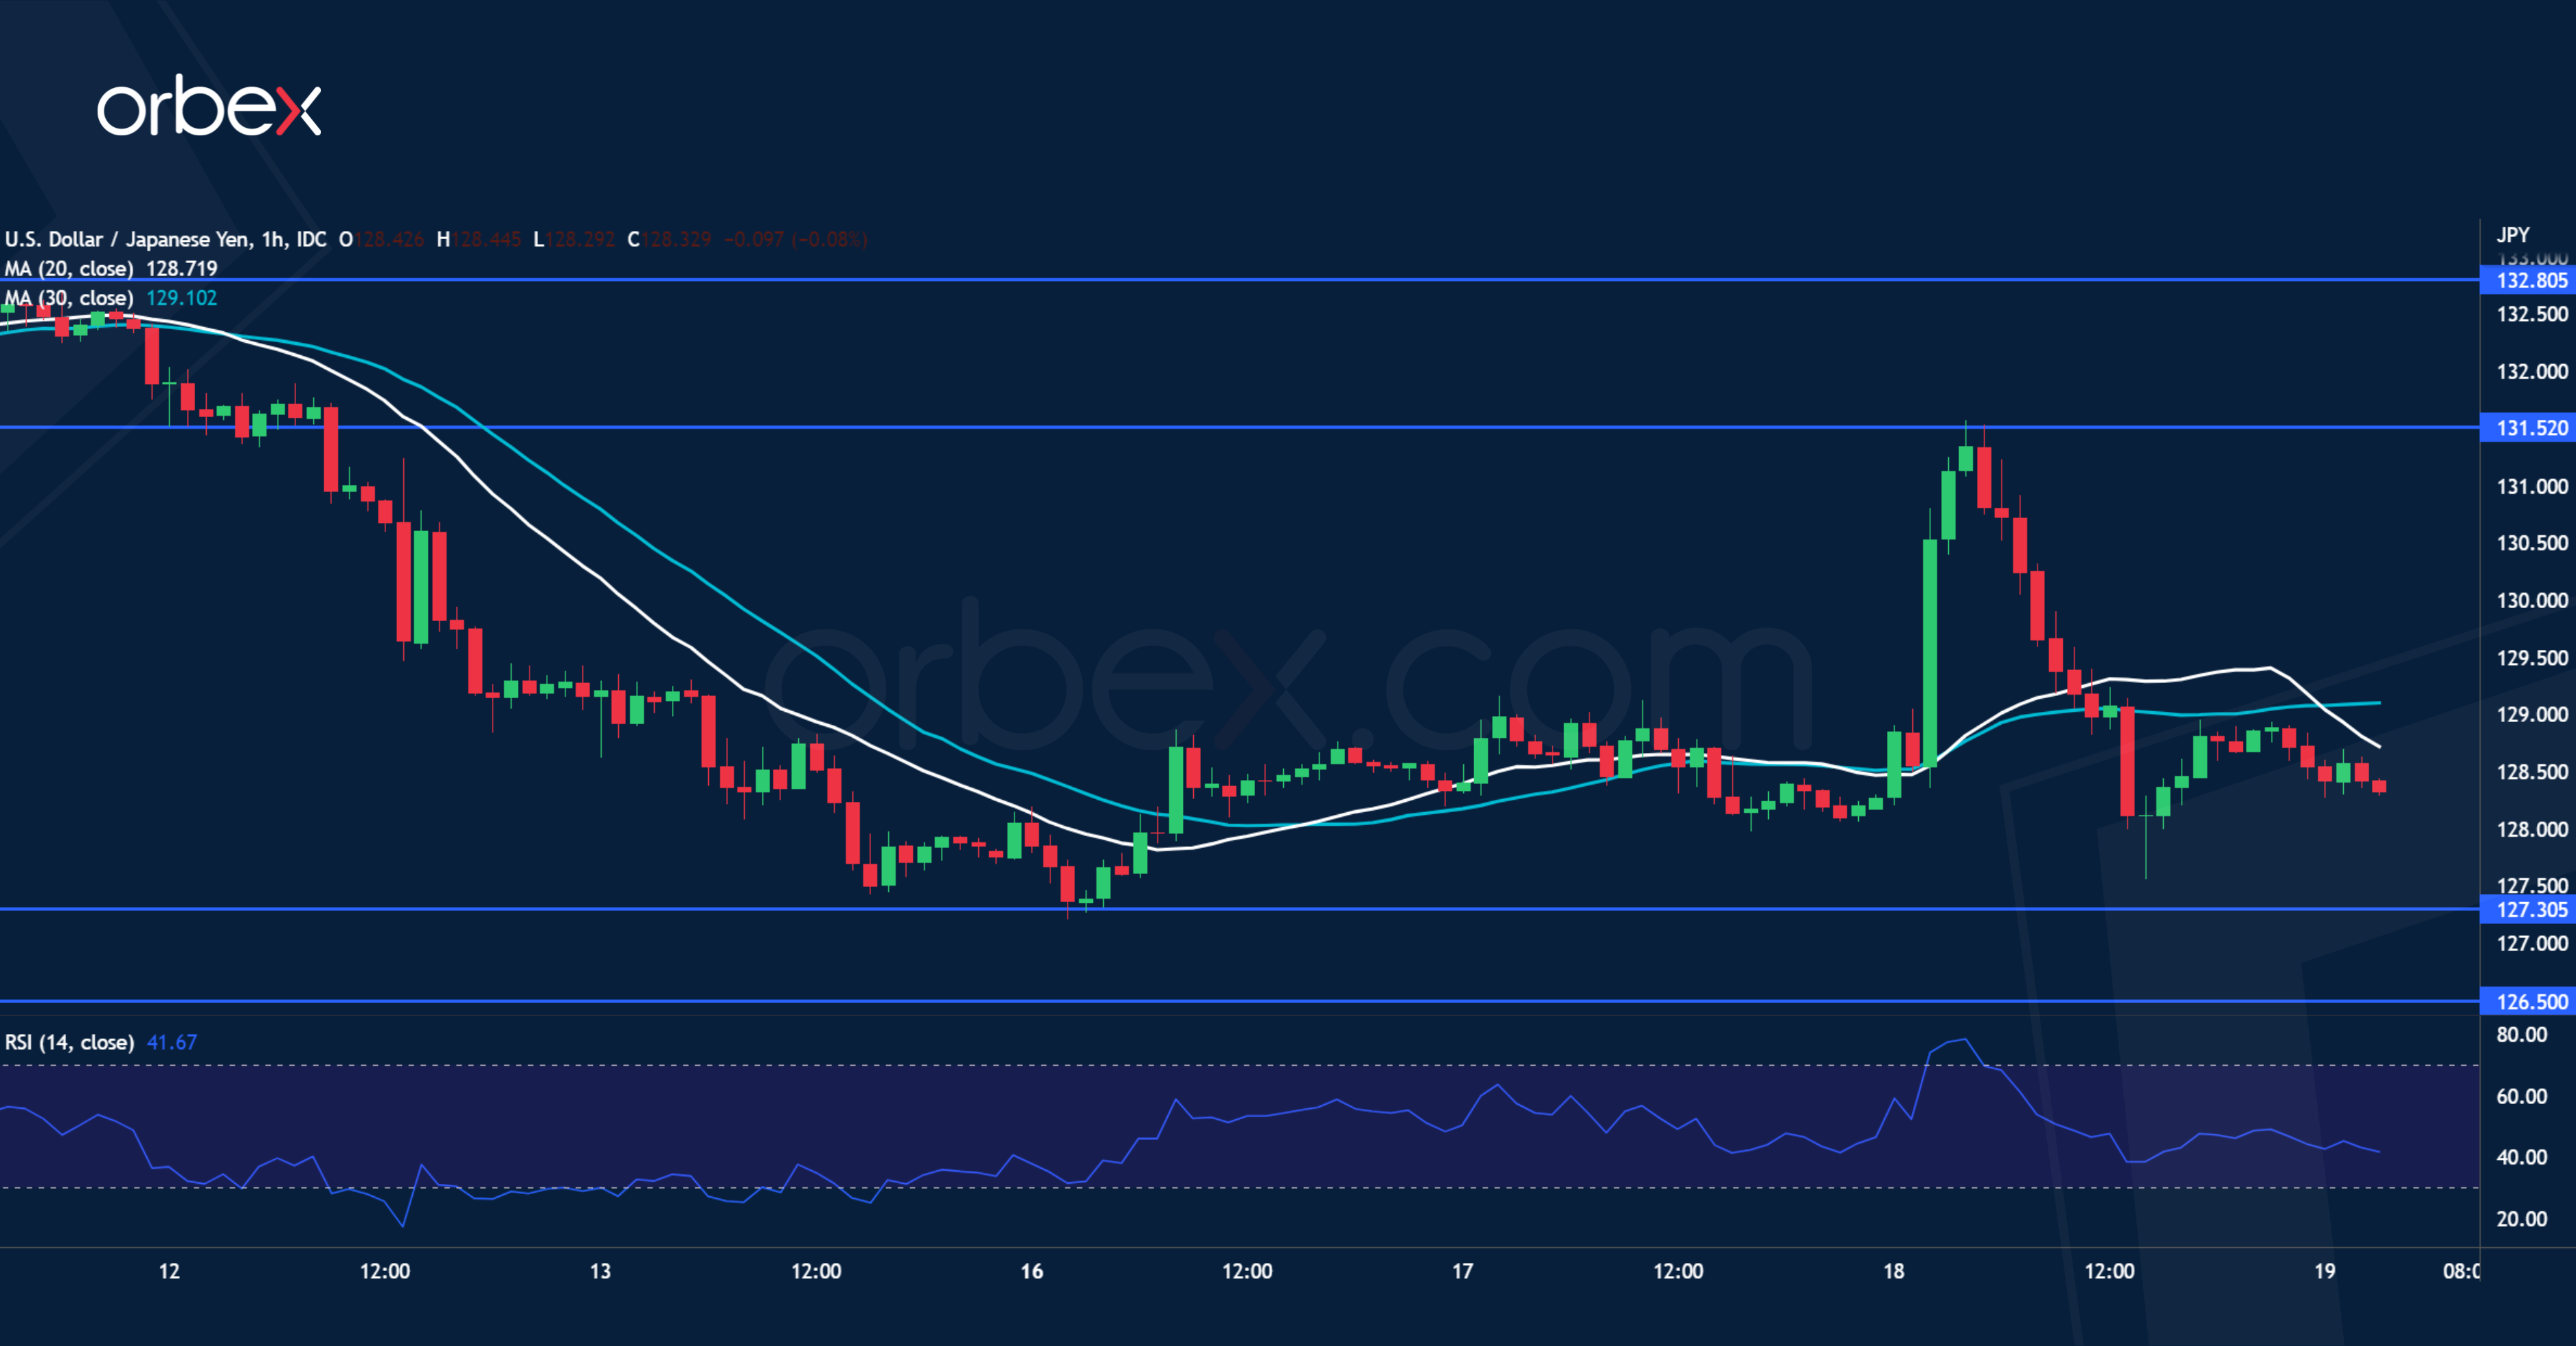
The Japanese yen tumbled after the BoJ shattered hopes that it would wind down its stimulus policy. Still the dollar’s short-lived surge turned south at a previous demand zone around 131.50 which coincides with the 20-day moving average. This is a sign that the mood has remained cautious for the time being and the bears saw in the rebound an opportunity to sell into strength. The recent low of 127.30 is a key support. A bearish breakout would expose the greenback to further downside below last May’s low at 126.50.
Won’t Be Easy for EUR/USD to Push Through Recent Highs
Markets
The BoJ’s status quo set the tone for core bond yields right from the start of the trading day. ECB’s Villeroy dismissing rumours about a possible slowdown in the tightening pace from March was brushed aside while US economic data (disappointing retail sales, easing PPI) a bit later only reinforced the current market trend. US yields tanked 12.2 bps to 19.2 bps with the belly of the curve outperforming. Germany’s yield curve inversion deepened by 10 bps+ at the longest tenor. European shares forfeited earlier gains, Wall Street ended with losses of 1.24-1.81% as recessionary fears loom while yesterday’s central bank talk by Bullard & Mester suggested that the Fed isn’t backing off anytime soon despite weakening (hard) economic data. The sharp (US) yield drop initially pushed the dollar further in the defensive. EUR/USD hit an intraday high just below 1.09. But the greenback gradually recovered on safe haven flows as (equity) sentiment deteriorated. USD/JPY experienced a lot of volatility. Post-BoJ yen weakness was followed by a fainting dollar only to recover a bit again. The pair ended the rollercoaster ride higher at 128.90 (compared to an intraday high/low of 131.58/127.57). The British currency bucked the risk-off by appreciating to EUR/GBP to 0.874 following (higher-than-expected core) CPI that keeps pressure on the Bank of England high.
Recession fears spill over into the Asian session this morning. Stocks trade mixed with Japan underperforming (-1.4%). A setback in Australia’s labour market (see below) served as an additional mood killer. Yields in the region tank >20 bps. Rates in other markets, including the US and Japan, also extend the move lower. Dallas Fed Logan and Philly Fed Harker struck a less hawkish note in overnight interviews. Both voting members favour to downsize to 25 bps at the next meeting though the latter reiterated the need of getting above 5%. The yen outperforms this morning. USD/JPY eases to 127.81. The Australian dollar is on the other side of the spectrum, dropping to the low AUD/UD 0.69 area (from 0.6943). The US dollar trades mixed with EUR/USD eking out a slight gain to 1.08.
Today’s economic calendar contains US housing data and weekly jobless claims but they won’t be able to turn the current market tide. If anything, a sub-consensus reading would only reinforce it. US 10y yield technicals have deteriorated after losing support at 3.40/42%. The next reference is located between 3.20/3.25% (May interim high/38.2% retracement on the 2022 yield rally). Germany’s 10y yield avoided a close sub 2% yesterday. But if hawkish ECB meeting minutes fail to convince (European) markets, we fear it is postponing the inevitable. The 23.6% 2022 retracement/June high (1.923/7%) is next on the charts. EUR/USD’s intraday pattern suggests it won’t be easy for the pair to push through the recent highs in case of risk aversion driven by recessionary fears. The dollar’s downside looks a bit better protected. Several ECB and Fed speeches serve as a wildcard.
News Headlines
The Australian December labour market report disappointed. Employment fell by 14.6k, though details showed a divergence between a 17.6k increase in full-time jobs and a 32.2k loss of part time occupations. The seasonally adjusted unemployment rate remained at 3.5%, in line with the updated figure for November though this happened against the background of a lower participation rate (66.6% from 66.8%). Despite this setback, it is still 0.8 ppt above the pre-pandemic level. The fall in employment and hours worked (-0.5% M/M) in December followed strong growth through 2022, with an annual employment growth rate of 3.4% and hours worked increasing by 3.2%. Overall, the Australian labour market remains tight. Separately, the Melbourne Institute of Applied Economic and Social Research released its January consumer survey. Consumers expect prices will rise 5.6% over the next 12 months, up from 5.2% in December and compared with 4.4% in the January 2022 survey. The Aussie dollar cedes more ground this morning, returning to AUD/USD 0.69 after yesterday failing to take out the 0.70 big figure. Australian money markets are split over whether or not the RBA will deliver another 25 bps rate hike at its February policy meeting.
The Royal Institution of Chartered Surveyors (RICS) released its December UK Housing Market Survey. The headline figure dropped to -42% (proportion of surveyors reporting a rise in prices minus those reporting a fall), the lowest level since October 2010. Details were weak all over with price & sales expectations, new buyer enquiries, new instructions and agreed sales all showing deeper declines. The sales to stock ratio fell from 39.1% to 38.8% with both stock and sales falling.
USD/JPY at 126 Support with Wedge Formation
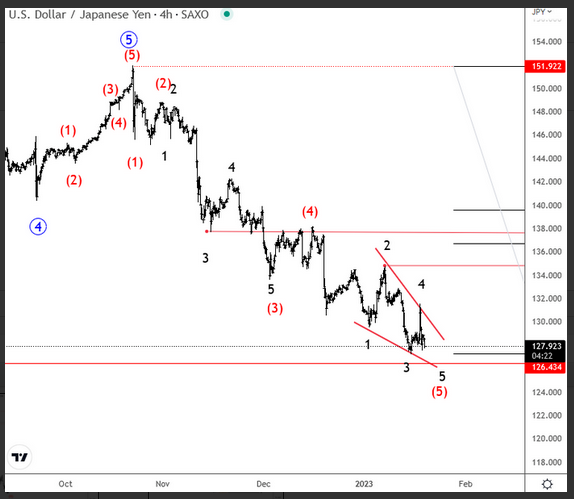
USDJPY came down at the end of 2022, breaking to even lower prices in the last few weeks after BoJ policy YCC adjustment back in December, with price breaking out of a wave 4 and falling through 135 level which put bears back in play, possibly for the final fifth wave of a bearish impulse that can be looking for completion now at 126 area. That's a final stage of a bearish impulse from 152.00, so be aware of a turn-up into a correction, possibly still this month if we see prices coming out of a wedge formation. Ideally, the breakout will cause a three-wave recovery back to 135-138 resistance area from where we will look for a new resumption of a bearish trend.
Dow Futures (YM) Looking for 5 Waves Elliott Wave Move Lower
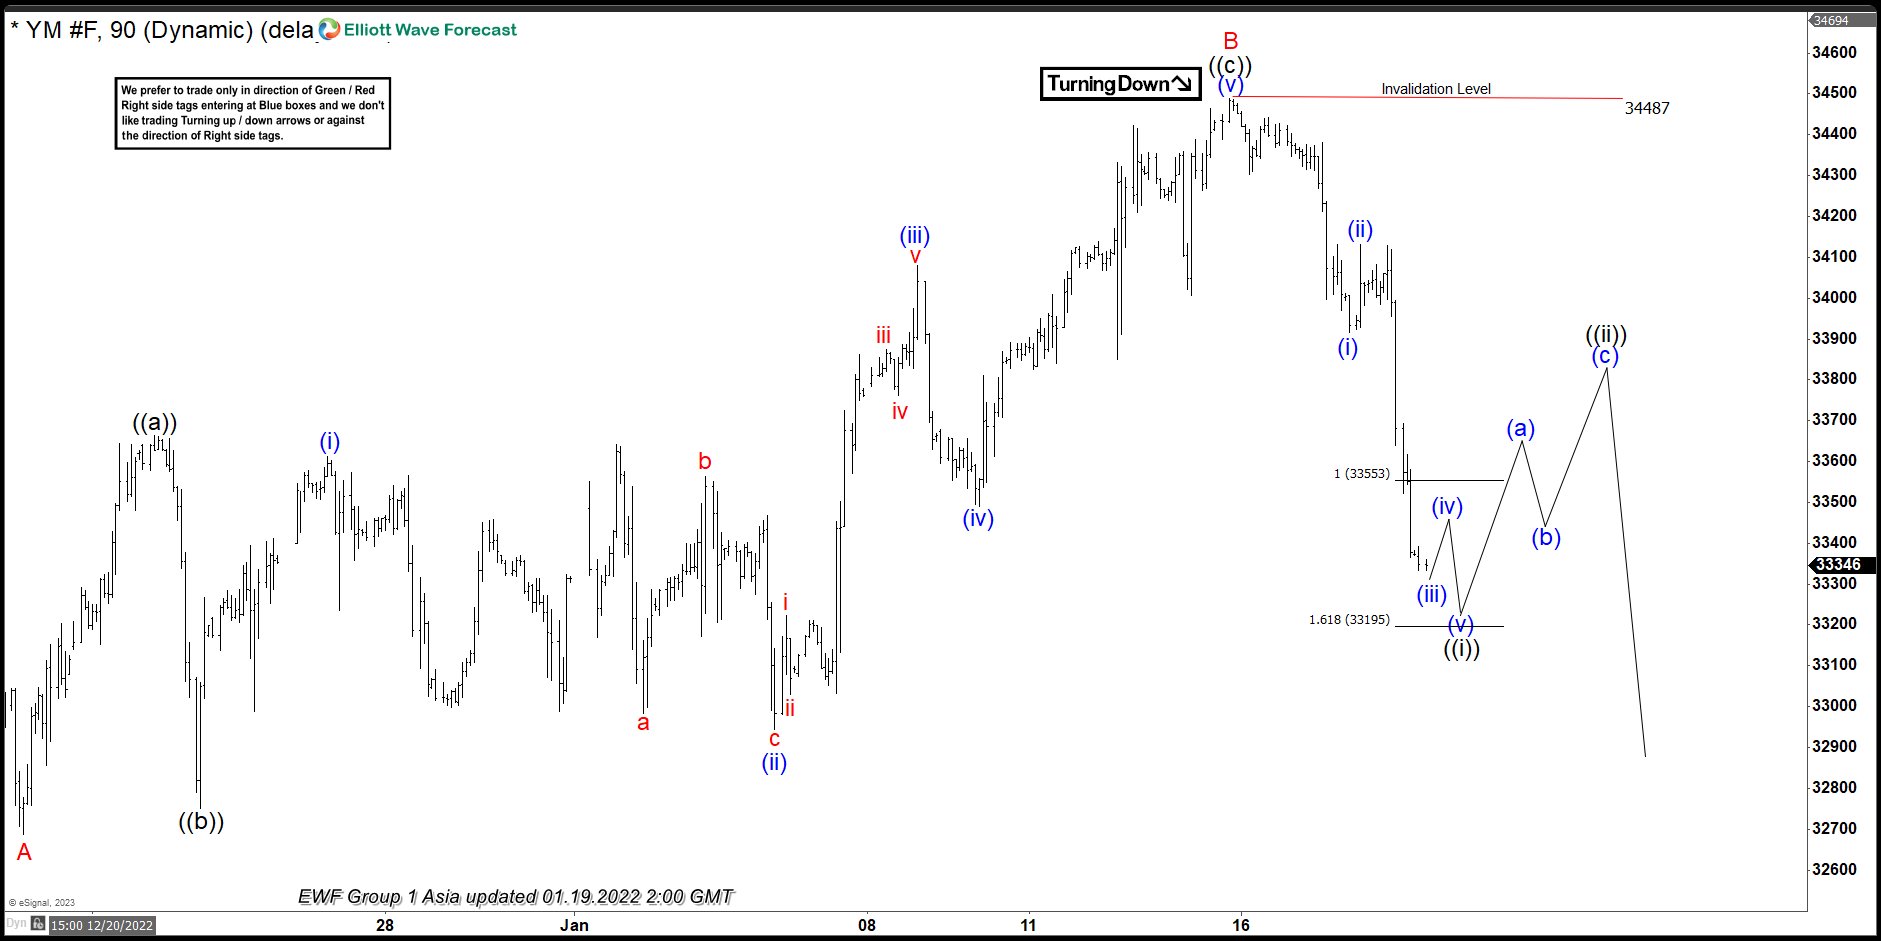
Cycle from 12.13.2022 high in Dow Futures (YM) is unfolding as a zigzag Elliott Wave structure. Down from 12.13.2022 high, wave A ended at 32686. Wave B rally ended at 34487 as the 90 minutes chart below shows. Internal subdivision of wave B unfolded as a zigzag structure in lesser degree. Up from wave A, wave ((a)) ended at 33663 and dips in wave ((b)) ended at 32750. Index then extended higher in wave ((c)) as a 5 waves diagonal. Up from wave ((b)), wave (i) ended at 33613 and dips in wave (ii) ended at 32943. Wave (iii) ended at 34080, wave (iv) ended at 33489, and final leg higher wave (v) ended at 34487 which completed wave ((c)) and B in higher degree.
Wave C lower is currently in progress as an impulse structure. The Index still needs to break below wave A at 32686 to confirm this view. Down from wave B, wave (i) ended at 33916 and rally in wave (ii) ended at 34131. Wave (iii) ended at 33318 and expect rally in wave (iv) to fail and Index to extend lower in wave (v) to complete wave ((i)). Afterwards, it should rally in wave ((ii)) to correct cycle from 1.16.2023 high before the decline resumes. Near term, as far as pivot at 34487 high stays intact, expect rally to fail in 3, 7, or 11 swing for further downside. Potential target lower is 100% – 161.8% Fibonacci extension of wave A. This area comes at 30385 – 31952 from where buyers can appear and Index can start to resume higher.
YM 90 Minutes Elliott Wave Chart
S&P 500 is An Easy Short
There was good, and less good news for investors on the wire yesterday.
The latest PPI data showed that the producer price inflation in the US fell way faster than expected. The expectation was a slowdown in factory gate inflation from 7.3% to 6.8%. And the data printed a sexy 6.2% for December – which meant a 0.5% retreat instead of a 0.1% decline. Core PPI also slowed. That’s the good news.
The bad news is the US retail sales fell 1.1% in December – marking the biggest monthly drop of last year.
On the jobs front, Microsoft said that it will cut 10’000 jobs while Amazon started cutting jobs in the context of 18’000 job cuts announced a couple of weeks earlier. Exactly what the Fed wants.
The bad news would normally be good news for the stocks, if the Federal Reserve (Fed) members weren’t there to spoil the dovish Fed expectations by saying that the US rates should go higher. Loretta Mester said more hikes are needed, and James Bullard reminded that the rates would have to stay ‘on the tighter side this year’ to help the Fed reach its 2% inflation goal.
S&P 500 is an easy short at the current levels
The S&P500 didn’t like the mix of slowing economic data, and still a hawkish Fed, and dived more than 1.50% yesterday.
And traders didn’t hesitate much sending the index below the 200-DMA, and below the bearish trend building since the start of 2022, given that there is nothing encouraging for stock investors out there, other than the softening Fed expectations – which don’t help filling the company’s coffers.
Stock/bond divergence is happening
The dovish expectations are, however, feeding well into the bond markets: the US 2-year yield is diving toward the 4% mark, while the 10-year yield hit 3.30%, the lowest level since September.
This means that the positive divergence in the sovereign space, compared with the stocks, is happening. Investors return to US sovereign bonds on expectation that the Fed would soften its policy due to recession jitters, while stock markets don’t benefit from the expectation of softer financial conditions, as slowing economic activity is bad for profits.
And speaking of profits, Procter & Gamble and Netflix are due to release their Q4 earnings today!
Crude oil swings between gains and losses
US crude advanced past the $82 mark on Chinese reopening optimism and IEA predicting that the oil demand will hit a record in 2023, before falling back below the $80 on recession pessimism, and the news that the US crude inventories jumped by 7.6 million barrels last week, while the expectation was a drop in inventories.
The more official EIA data is due today, and the expectation of a 2.1 million barrel fall will likely disappoint the bulls. But I continue believing that the bulls will take the upper hand and carry the rally higher, though on a bumpy road.
Falling stocks + falling yields: A boon for Gold diggers
Gold is bid above the $1900 level, and the positive pressure is supported by lower US yields – which decrease the opportunity cost of holding the non-interest-bearing yellow metal, and the softer US dollar.
The overbought conditions hint that we could see a minor downside correction in the short run, but levels between $1855 and 1900 are interesting for amassing gold.
There is potential for a further rise in gold, especially if the stocks fall, while the US yields continue easing.
Central Banks in Focus
Market movers today
It will be a rather busy day on central bank front, kicking off with Norges Bank (NB). It is an interim meeting, hence, we will get only a rate decision, monetary policy assessment (both at 10.00 CET) and a press conference in Norwegian (at 10.30 CET). We will not get revised projections, nor a new rate path. We expect NB to keep rates unchanged, generally deliver little news to markets and reiterate the message from December that rates most likely will be raised in March by 25bp.
The central bank of Turkey also has a meeting today, but it seems the cutting cycle is over for now and consensus expects them to keep the policy rate unchanged at 9%.
ECB minutes from the December meeting will be released at 13.30 CET. There, we look for more details surrounding the upcoming balance sheet normalisation (QT) and how much more 'significant' interest rate increases the Governing Council has in mind in light of the inflation outlook. We also have ECB's Lagarde and Knot speaking at Davos.
In the US, the focus is on housing market data due in the afternoon and on speeches by the Fed's Collins and Brainard.
The 60 second overview
US: Weak US economic data spurred further speculation in the market that inflation is peaking and global policy makers may be nearing the end of their hiking cycles. US retail sales fell by more than expected (-1.1% m/m) in December, while industrial production declined 0.7% m/m, and PPI for final demand slid m/m by the most since the start of the pandemic. With souring risk sentiment S&P 500 closed down 1.6%, the biggest decline in a month, and 10Y Treasury yields are back at 3.3%, despite comments from Fed officials that stressed more rate hikes are needed.
China: The Chinese economy performed better than expected in Q4 22 and data suggests that Q1 23 could also be stronger than expected, as Covid cases have already peaked in the big cities. We now look for an even more frontloaded recovery starting already in early Q1 rather than late Q1 as the service sector is already showing clear signs of rebounding and companies are likely to raise production in anticipation of better demand in the coming quarters. Read more in China growth update - More frontloaded recovery, 18 January.
Bank of England: UK inflation eased 0.2pp to 10.5% in December, but with core inflation remaining unchanged at 6.3% and wage growth edging even higher (+0.2pp to 6.4% in November), pressure is rising for Bank of England to deliver another 25bp rate hike not only in February, but also in March.
FI: European rates staged another significant rally following Tuesday's late ECB sources story saying that ECB is pondering its hiking size after the 50bp rate hike in February as well as Bank of Japan's decision to stay put on a potential widening on the YCC. Weaker than anticipated US data also supported the lower yield move and curves flattened from the long end. Italian bonds continued its recent performance vs. peers, while Bunds briefly touched below the 2% level.
FX: EUR/USD was stable overnight at just below 1.08 after yesterday's session, where the cross was first pushed higher by ECB comments, then lower by poor risk sentiment. SEK had a strong session, but eventually both SEK and NOK took a hit after equities fell. JPY underperformed as did antipodeans.
Credit: Yet another day with a flood of new issues in the credit market - especially in the financial space. Spanish based clean energy producer Iberdrola SA sold EUR1bn of Green Hybrid notes with a coupon of 4.875%. The order book was EUR 3.2bn at final pricing level - a testament to the strong demand currently in the corporate bond market. Secondary markets were relatively unchanged with ITraxx-Xover 1bp tighter at 410bp while Main was also 1bp tighter at 77bp.