Sample Category Title
Fed Williams: Monetary policy still has more work to do
New York Fed President John Williams said overnight, "with inflation still high and indications of continued supply-demand imbalances, it is clear that monetary policy still has more work to do to bring inflation down to our 2% goal on a sustained basis."
"Bringing inflation down is likely to require a period of below-trend growth and some softening of labor market conditions," he added. "Restoring price stability is essential to achieving maximum employment and stable prices over the longer term, and it is critical that we stay the course until the job is done."
Fed Brainard: Policy will need to be sufficiently restrictive for some time
Fed Vice Chair Lael Brainard said in a speech yesterday, "even with the recent moderation, inflation remains high, and policy will need to be sufficiently restrictive for some time to make sure inflation returns to 2 percent on a sustained basis."
"The FOMC moved policy into restrictive territory at a rapid pace and subsequently downshifted the pace of increases in the target range at its most recent meeting," She noted. "This will enable us to assess more data as we move the policy rate closer to a sufficiently restrictive level, taking into account the risks around our dual-mandate goals.
Inflation Dynamics Point to RBA’s Tightening Cycle Peaking after the FOMC
The central issue for the economies and markets will be the evolution of inflation over 2023.
Westpac forecasts that headline inflation in Australia will peak at 7.4% in 2022 (December quarterly result to be released on January 25).
That read will be an increase from 6.3% in the year to June 2022. We expect headline inflation in 2023 to slow to 3.7% – well below the Reserve Bank's current forecast of 4.7%, although it is likely that the RBA will lower its forecast in the February Statement on Monetary Policy.
While lower than the current official forecast the annual print in 2023 will still be well above the Bank's 2–3% target range, most likely precluding it from easing policy anytime in 2023.
With inflation running well above the target range it seems it will be reluctant to ease policy during 2023 despite a stagnating economy; a rising unemployment rate and a slowdown in inflation momentum in the second half of 2023.
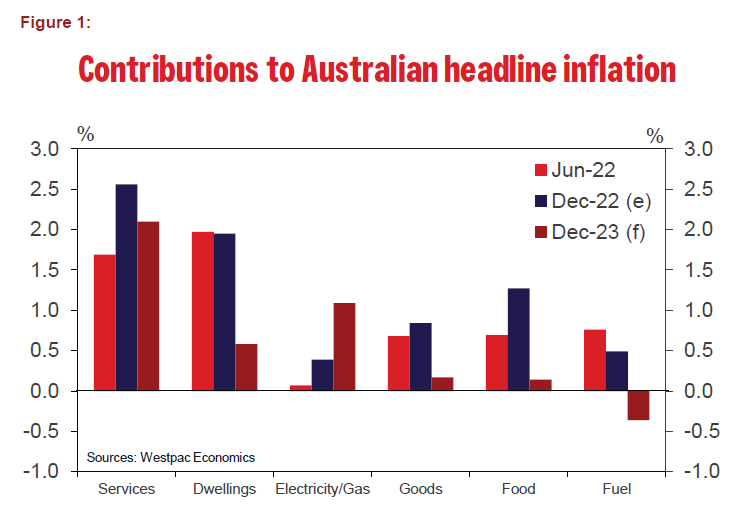
Figure 1, sets out the forecast contribution to inflation from the key components, highlighting the evolution of those components in 2023.
Key factors to note are:
- The contribution to inflation from dwellings and rent will slow dramatically in 2023. In particular dwelling costs which contributed 1.87 ppt's to inflation in the year to June 2022 and 1.70 ppt's to December will slow to 0.29 ppt's in 2023. Rents themselves that lifted from 0.1 ppt's in June to 0.25 ppt's in December are likely to hold at 0.29 ppt's in 2023. The trend in the slowdown in dwelling costs is already underway with the monthly measure showing that dwelling costs have slowed from 1.5–2.0% per month in the middle of 2022 to only 0.1 % in November following 0.5% in both October and September.
- The services measure used in Figure 1 combines both private sector and public sector (including both health and education) services. The lift in the services contribution between June and December is apparent (1.69 ppt's up to 2.56 ppt's). This measure most closely captures the impact on inflation of rising wages. We expect wages growth to lift from the 3.1% recorded for the September quarter 2022 to 4.5% by June before slowing in the second half. Although over the year we have a slowing in the contribution relative to December (2.1 ppt's) the risks on this component are to the upside. Because these forces most closely capture the "demand" element they are likely to keep the RBA on "inflation alert" during the first half of 2023. The slowing in these pressures is expected in the second half of 2023 and will provide the RBA with some comfort to remain on hold in the second half of 2023 with a view to easing policy in 2024.
- Easing supply chain pressures not only directly lower building cost inflation but direct goods inflation. We expect goods to contribute only 0.17 ppt's in 2023 down from 0.84 ppt's in 2022.
- Fuel and food prices are also expected to contribute to the slowdown in inflation in 2023 – food 1.27 ppt's in 2022 down to 0.14 ppt's; fuel: 0.76 ppt's in June and 0.49 ppt's in December. Down to –0.36% in 2023.
- Partially offsetting these positive developments is energy with electricity/gas contributing 1.09 ppt's in 2023 compared to 0.39 ppt's in 2022.
So, for Australia the forecast reduction in inflation in 2023 of 3.7 ppt's (from 7.4% to 3.7%) is driven by dwelling costs (1.38 ppt's); food (1.13 ppt's); goods (0.68 ppt's); and services (0.46 ppt's).
Markets are currently focussing on the theme that global inflation is falling faster than expected and that should be an encouraging signal for central banks.
We agree that inflation relating to supply chains and other supply shocks is largely a global story. Our forecasts for 2023 certainly incorporate those messages – around building costs; fuel; food and goods.
But the demand factors in Australia, largely captured by services, are likely to intensify in the first half of 2023 before easing in the second half.
Those intensifying demand pressures should keep the RBA in tightening mode in the first half of 2023.
The "global theme" is best captured by the inflation developments in the US.
Figure 2, shows our assessments of the contribution to inflation of the comparable components in the US, including estimates of the components making up our (top down) forecast of 2.3% headline inflation for the US in 2023.
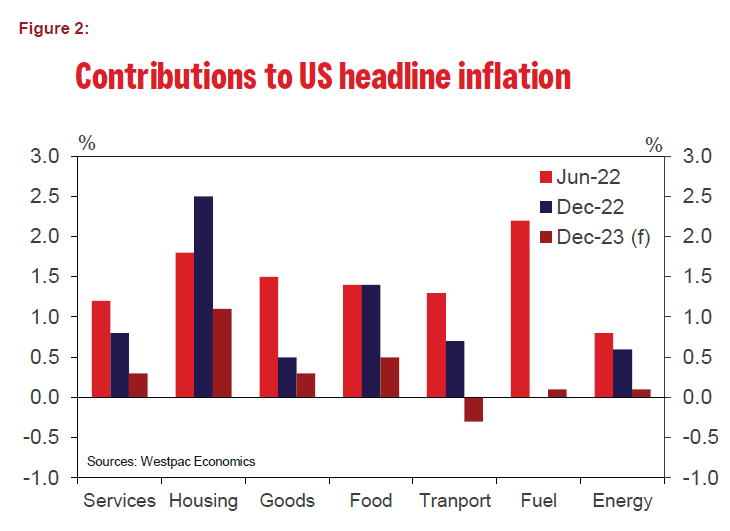
The figure shows that actual headline inflation in the US slowed from 9.1% in June 2022 to 6.5% in December. That compares with our forecast lift in inflation over the same period in Australia from 6.3% to 7.4%.
Some points to note:
- The services contribution to inflation slowed between June and December in contrast with Australia. This is likely to be explained by Australia being behind the US on the wages and labour market cycle; while wages growth is set to accelerate in Australia it seems to have peaked in the US.
- Easing of supply chain pressures has already become apparent in goods inflation in the US and that is expected to ease further in 2023, as we expect for Australia.
- Easing in food pressures is expected in the US along similar lines to Australia.
- Over 2023, housing pressures in the US (as measured by owners equivalent rents) are expected to ease substantially, just as we are seeing in Australia (although Australia takes a different approach to measuring housing cost pressures). In the US market driven rents are already falling although there will be lag before those effects show up in US inflation significantly reducing shelter's contribution to inflation through 2023.
- A major difference between Australia and US inflation in 2023 is expected to be around utility inflation (electricity/gas) where Australia's market rigidities are expected to boost inflation in 2023 whereas in the US markets are operating efficiently
Conclusion
Inflation is expected to ease substantially in both Australia and the US in 2023. Supply issues, which represent global pressures, associated with housing; goods; food; and fuel will all generate downward pressure on inflation.
However, the key services inflation cycle looks to be ahead for Australia while it is slowing in the US. Wage inflation in Australia is still lifting as labour markets remain tight through the first half of the year.
Headline inflation in Australia will also be held up in 2023 by rising gas and electricity prices.
The high starting point for inflation and initially slow progress should mean that both the Federal Reserve and RBA have more work to do before remaining on hold in the second half of 2023.
With Australia's inflation cycle behind the US and both central banks facing much higher, albeit slowing, inflation than their target levels it seems appropriate that they will continue to tighten through the early months of 2023.
On this basis that the demand cycle in Australia is lagging the US it also seems prudent for the RBA to be behind the FOMC on the cycle.
We expect that the FOMC's tightening cycle will peak at the March FOMC meeting while the RBA will persist for a little longer with the peak being in May.
NZDUSD Wave Analysis
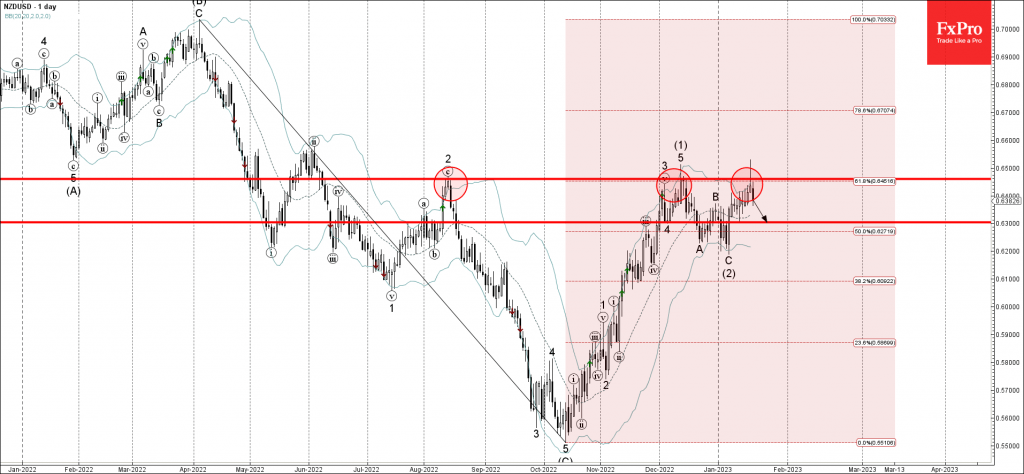
- NZDUSD reversed from resistance level 0.6460
- Likely to fall to support level 0.6300
NZDUSD recently reversed down from the major resistance level 0.6460 (which has been reversing this currency pair from August).
The resistance level 0.6460 was strengthened by the upper daily Bollinger Band and by the 61.9% Fibonacci retracement of the strong downtrend from last April.
Given the clear daily downtrend, NZDUSD can be expected to fall further toward the next support level 0.6300.
CADCHF Wave Analysis
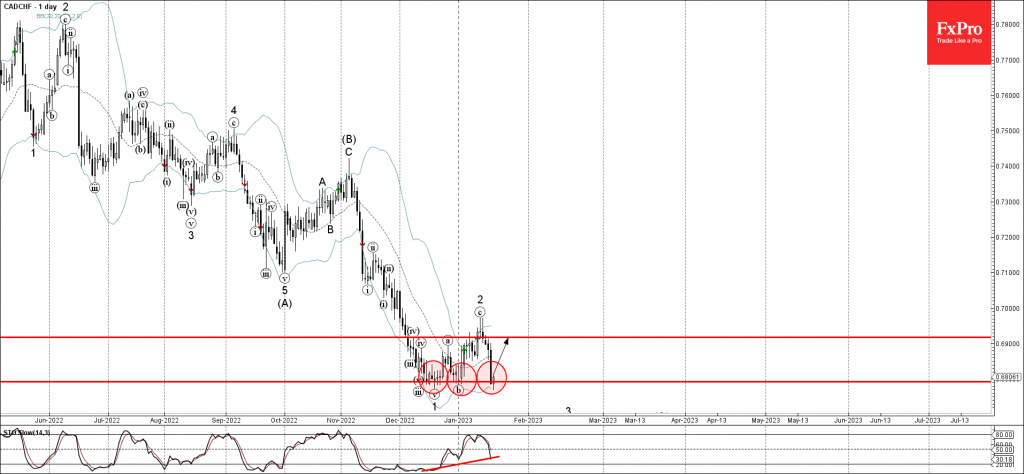
- CADCHF reversed from support level 0.679
- Likely to rise to resistance level 0.6916
CADCHF today reversed up from the key support level 0.679 (which has been stopping all downward impulses from December).
The support zone near the support level 0.679 was strengthened by the lower daily Bollinger Band.
Given the bullish divergence on the daily Stochastic indicator, CADCHF can be expected to rise further toward the next resistance level 0.6916.
Why Oil Prices Have Been All Over the Place
The price of crude has been on something of a roller-coaster since the start of the year. From a sudden drop in the first days of January, it climbed through the third week, only to have a hard drop a couple of days ago.
Naturally there have been news events that have driven these moves, which we'll get to in a moment. The underlying theme, however, is general uncertainty. Without a clear direction for the global economy, traders are swinging from optimism to pessimism rather quickly. This, in turn, leads to wider swings in commodities that are barometers for economic activity. Oil, naturally, is one of the top commodities that depend on expectations of economic performance. If the economy is doing good, then more energy is needed. If the economy is doing poorly, then demand for oil will drop.
The drivers
China's surprise GDP growth last quarter was something of a double-edged sword. On the one hand, it had a positive implication that the world's second largest economy had gone through the covid situation without being seriously affected. On the other, it meant that less of a bounce could be expected from China, since it hadn't gone down as much in the first place.
The rally in oil prices, therefore, was a bit fragile. It might simply have been corrected as it reached a point that was good for profit taking. But there was a series of economic data that pointed to a potential bumpy road ahead for the US. The big one was that retail sales came in well below expectations. With the US being the largest consumer of fuel in the world, it wasn't a surprise that oil prices faltered.
It's not just the US
The situation in Europe is complicated as well. In the last couple of weeks, Europe has had unseasonably warm weather. But a bout of cold is expected over the weekend, that could put a strain on energy. Weather perhaps is more difficult to predict than the markets; and the relative uncertainty could keep oil traders apprehensive.
On top of that, workers at French refineries went on a one-day warning strike over salary as the country faces increasing cost of living pressure. Further industrial action could substantially curtail crude demand. If the workers' demands aren't met, they could opt for a longer strike, which could reduce European refinery capacity, and drive up prices. The US relies on imports of refined petroleum products to meet its own demand.
The outlook smooths out later
The latest IEA report coincides with the OPEC monthly report suggesting that there will be an abundance of supply in the short term. This in the context of the global economy expected to underperform under the weight of central bank tightening.
But the IEA also warns that this oversupply situation could rebalance at any moment depending on how quickly China's economy rebounds. Or if there is another factor that helps OECD countries achieve a soft landing and avoid a recession. After that, global crude consumption is expected to hit another record high later this year.
US Data, and the Disinflation Narrative
After months of inflation coming in way above the Fed's target, the latest releases show a different trend. US monthly CPI figures for December showed a drop in prices, largely aided by energy prices. Yesterday, producer prices came in much more negative than expected.
If inflation is bad, then the opposite would be good, right? Not so much. The opposite of inflation is deflation, and it can be just as bad for the economy as inflation. Particularly in the case of the US, where the Fed has never had to deal with runaway inflation. High inflation, yes; but hyperinflation like experienced in Europe in the last century, for example, has not happened. What the Fed did have to deal with up until the US left the gold standard, were bouts of deflation. And, as such, the Fed tends to be more worried about deflation than inflation.
The warning signs
More immediately for traders, however, deflation is an important warning sign. Increasing economic activity typically translates into growing prices; and the reverse, slowing economic activity typically translates into deflation. Looking at yesterday's data, the surprise deflationary PPI came along with a surprise drop in retail sales and industrial production. The data was expected to be negative, but it was a lot more negative than expected.
A similar vein is expected in the coming data to be released later today and tomorrow relating to the largest component of the American economy: Housing. Home prices have been on the backfoot as rising interest rates have made buying houses much more expensive. But, over the last few weeks, interest rates have been coming down, including the average mortgage rate.
What are the projections
Despite the lower costs to buy, housing starts are expected to continue to fall, forecast at 1.36M compared to 1.43M in November. Typically in the winter, homes sell slower, but the expected slowdown is much faster than what is typical of the season. Existing home sales are also expected to continue its descent to 3.96M compared to 4.09M in November.
In the wake of the latest data, the dollar slid compared to other pairs as the US benchmark bond rates slid, hitting the lowest level since last September. The greenback was at its worst level since May of last year. Which brings us back to the potential Fed reaction.
Which way are we going?
This shift in price trends is happening in the middle of a market debate over whether the Fed will raise rates and keep them high, or there will be a pivot and the Fed will cut rates. Traditionally, the Fed is much quicker to cut rates to head off potential deflation than it is to raise rates to counter inflation. In the end, the Fed does want there to be some (controlled) inflation.
For now, the deflation has shown up in the headline CPI figure and PPI, which aren't the key metrics used by the Fed to determine rates. Some volatility in the headline inflation number is understandable, particularly when the Fed is trying to lower inflation. But if this is the first sign that negative inflation numbers will become the norm, then it could increase the chances of a Fed rate cut in the near future.
Sunset Market Commentary
Markets:
After yesterday’s US-driven decline in bond yields (poor US data), the market focus turned to ECB communication. ECB’s Knot, admittedly a member of the hawkish wing, set the tone by warning that the market should take the ECB’s guidance on multiple 50 bps rate hikes seriously. Speaking later at the WEF in Davos, ECB’s Lagarde also vowed to stay the course. ‘Inflation is still way too high’ and the ‘ECB remains determined to bring inflation to 2% in a timely manner’. The comments of the ECB president accelerated a tentative rebound in EMU yields and this was reinforced after the publication of the accounts of the Dec 15 policy meeting. At that meeting, the Governing council clearly wasn’t happy with the easing of market conditions (lower yields, higher equites) witnessed after the October meeting. ‘The loosening was seen as an unwelcome development and was judged inconsistent with the significantly more adverse euro area inflation outlook embedded in the staff projections’. Regarding the internal debate on the decision, a large number of members initially preferred a 75 bps increase. Finally some of these members agreed to a 50 bps hike if the communication was strengthened ‘on the Governing Council’s policy intentions and the enhanced message that the Governing Council would continue raising rates significantly at a sustained pace’. With respect to the reduction of the bond portfolio, some members also advocated a faster reduction than the €15bn/month that was approved for Q2. To summarize: the ECB unequivocally keeps the focus on fighting uncomfortably high inflation. Given recent market developments (easing of financial conditions), this assessment hasn’t changed going into the February meeting. After the recent sharp decline in yields, there is still long way to go to fulfill the ‘ECB’s wishes’. German yields are rebounding 5 (2y) to 1.5 bps (30y). It’s too early to call it the start of a bottoming out process, but at least the free fall has halted. US yields are rising between 3/2 bps. The combination of rising recessionary risks combined with hawkish central bank talk weighed on European equities markets. After an uninterrupted up-leg since the start of the year, the EuroStoxx 50 is ceding 1.6%. US equities, are losing 0.4%. The dollar still fails to really profit from a less positive risk sentiment. EUR/USD today held a tight sideways range in the lower half of the 1.08 big figure. (1.082). DXY still struggles to hold above the 102 handle. Sterling rebounds from the previous two sessions came to a halt; EUR/GBP rebounds a few ticks (EUR/GBP 0.876).
News Headlines
The Norges Bank kept its policy rate unchanged today at 2.75%, though some arguments called in favour of a (25 bps) rate hike. Since the December Monetary Policy Report, the labour market appears to have been a little tighter than projected while continued pressures in the Norwegian economy may contribute to keeping inflation elevated. On the other hand, there are prospects that energy prices will be lower than expected earlier, and global inflationary pressures appear to be easing. High inflation and higher interest rates are also weakening household purchasing power, and many firms expect a fall in activity ahead. Based on its current assessment of the outlook and balance of risk, the policy rate will most likely be raised in March. The Norwegian krone didn’t budge after the anticipated decision and holds near weak levels around EUR/NOK 10.75.
Swiss National Bank president Jordan told Bloomberg TV at the sidelines of the WEF in Davos that some tightening is probably still in the cards from the SNB. The policy rate stands at 1% currently (coming from -0.75%), with inflation still above 2%. Jordan says that headline inflation (2.8% Y/Y) will come down very quickly after spiking at the start of 2023, but the focus is on core inflation (2% Y/Y). The strong Swiss franc is one of the reasons why inflation remains relatively low, but the SNB won’t hesitate again to be active on the FX market if it becomes too strong. The SNB president expects the economy to cool this year, but avoid a recession. CHF weakened today from EUR/CHF 09890 to 0.9925 as global interest rates are on the rise again.
BTCUSD Consolidates After Advance Pauses
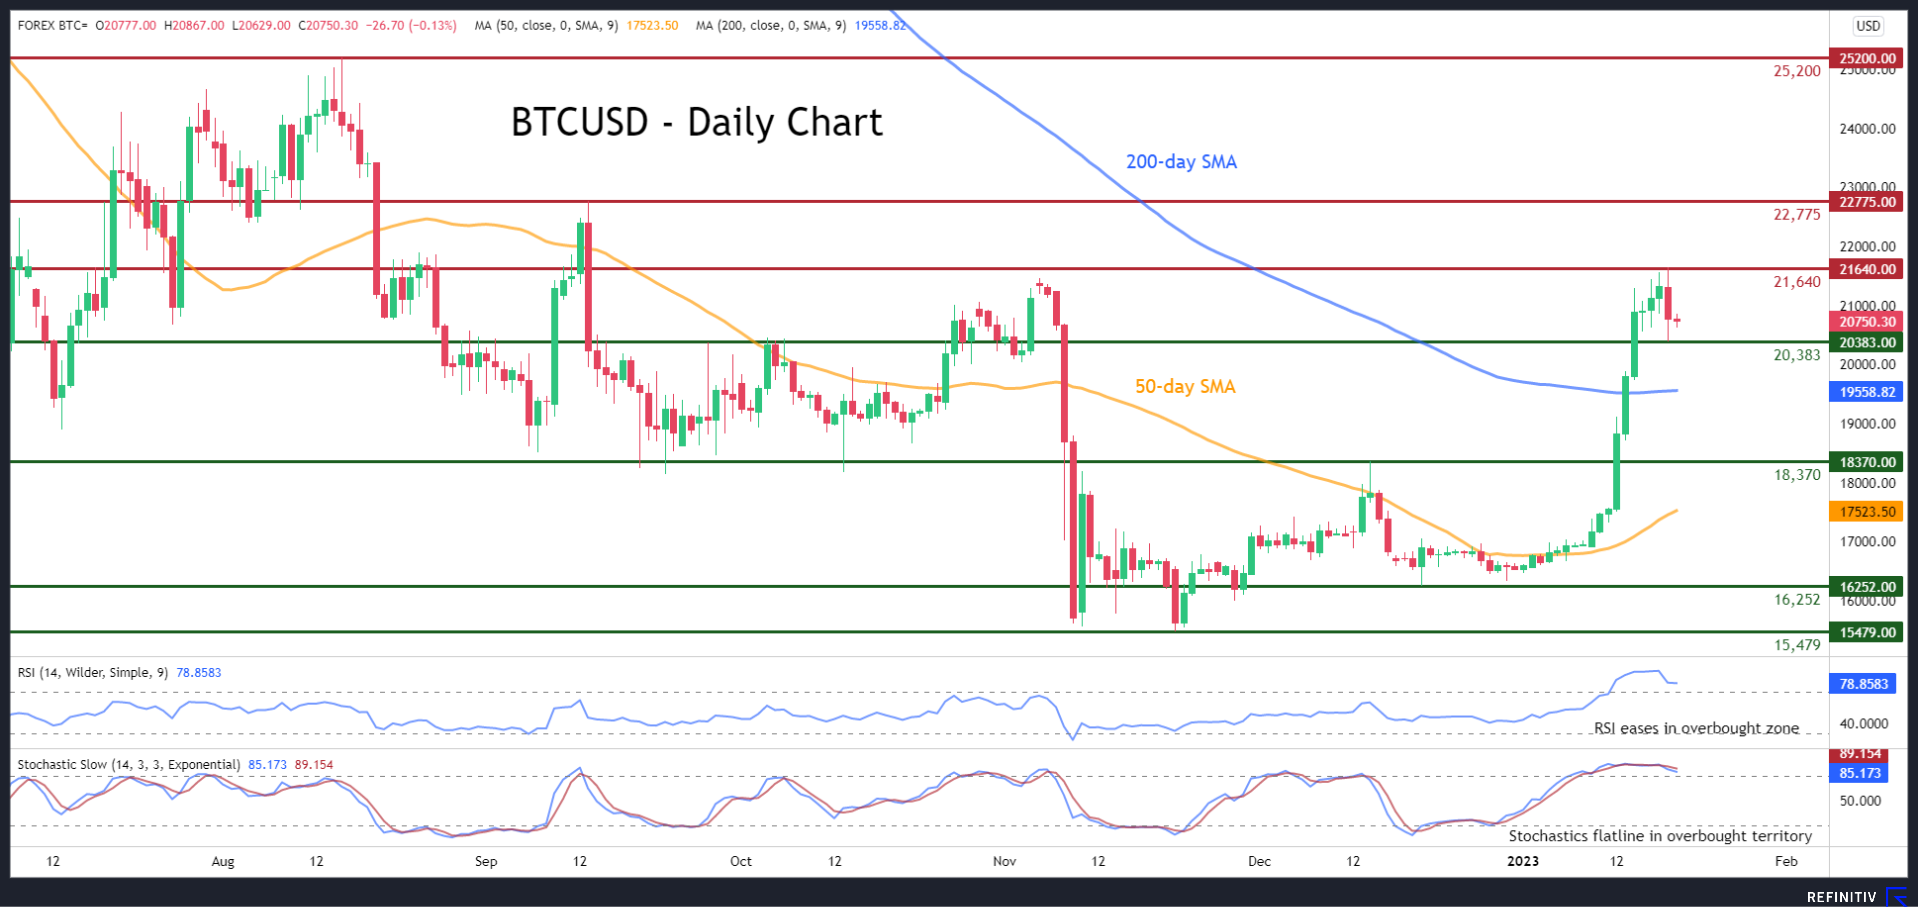
BTCUSD (Bitcoin) has been edging higher after breaking above its prolonged sideways pattern in early 2023. However, the king of cryptocurrencies is currently trading within a range as its rebound got rejected at the four-month high of 21,640.
The momentum indicators currently suggest that the recent rally could be overstretched as both the RSI and the stochastic oscillator are currently well within their overbought territories. Hence, a potential downside correction may be on the cards.
Should buying pressures persist, the digital coin could test the recent resistance of 21,640, which is also a four-month high. Conquering this barricade, the bulls could then aim for the September peak of 22,775. A break above that level could trigger an advance towards the 25,200 barrier.
On the flipside, if the price reverses lower, the recent support of 20,383 could curb initial declines. Sliding beneath that floor, the price may descend to test the December resistance of 18,370, which could act as support in the future. Even lower, the 16,252 hurdle might prove to be a tough one for the price to overcome.
Overall, although some overbought signals have emerged, BTCUSD seems to be holding its ground. Therefore, for the rally to resume, the price needs to break above the recent rejection zone.