Sample Category Title
GBP/USD Daily Outlook
Daily Pivots: (S1) 1.2337; (P) 1.2368; (R1) 1.2422; More...
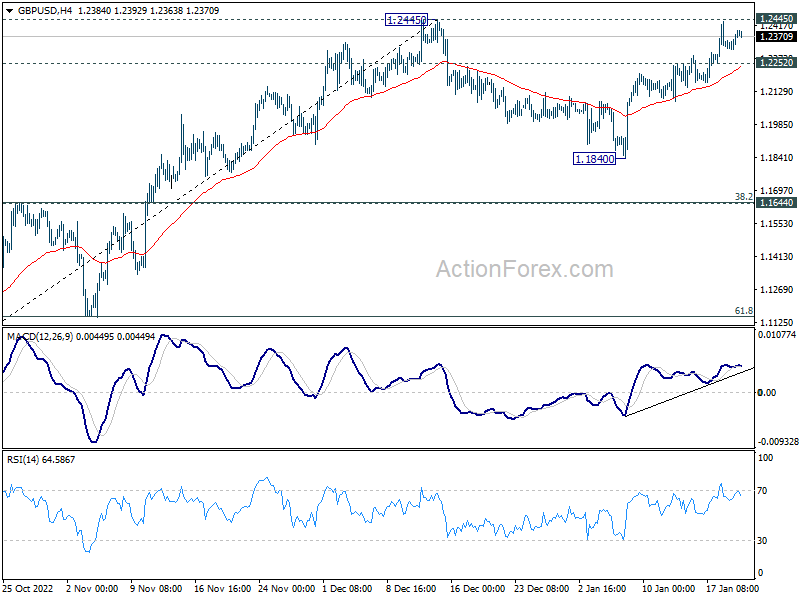
Intraday bias in GBP/USD is turned neutral with loss of upside momentum ahead of 1.2445 resistance. On the upside, decisive break of 1.2445 will confirm resumption of whole rise from 1.0351. Next target will be 1.2759 fibonacci level. On the downside, break of 1.2252 minor support will turn bias to the downside, and extend the corrective pattern from 1.2445 with another falling leg.
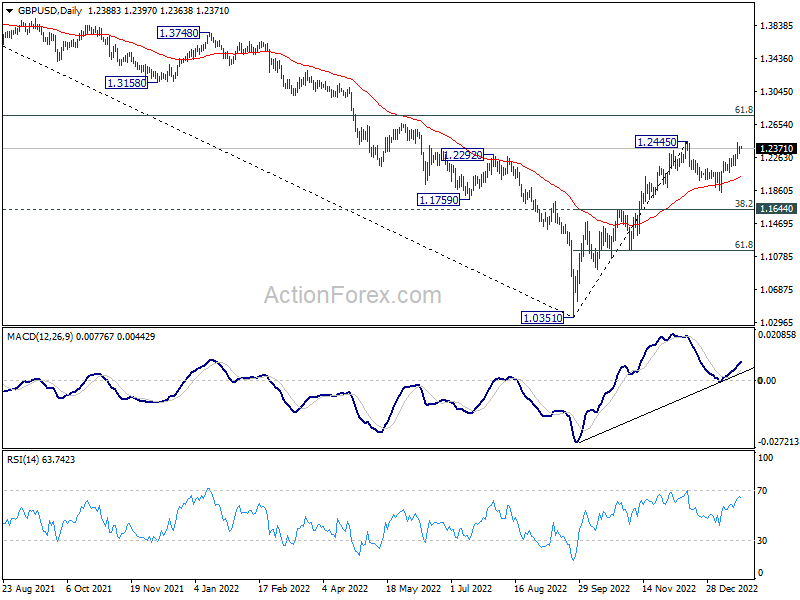
In the bigger picture, rise from 1.0351 medium term bottom is at least correcting whole down trend from 1.4248 (2021 high). Further rise is expected as long as 1.1644 resistance turned support holds. Next target is 61.8% retracement of 1.4248 to 1.0351 at 1.2759. Sustained break there will pave the way back to 1.4248.
USD/CHF Daily Outlook
Daily Pivots: (S1) 0.9142; (P) 0.9166; (R1) 0.9184; More...
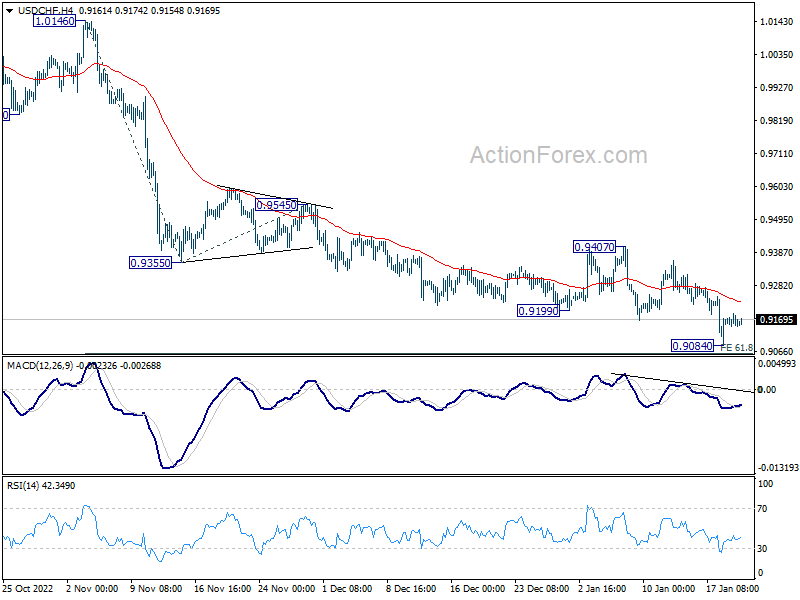
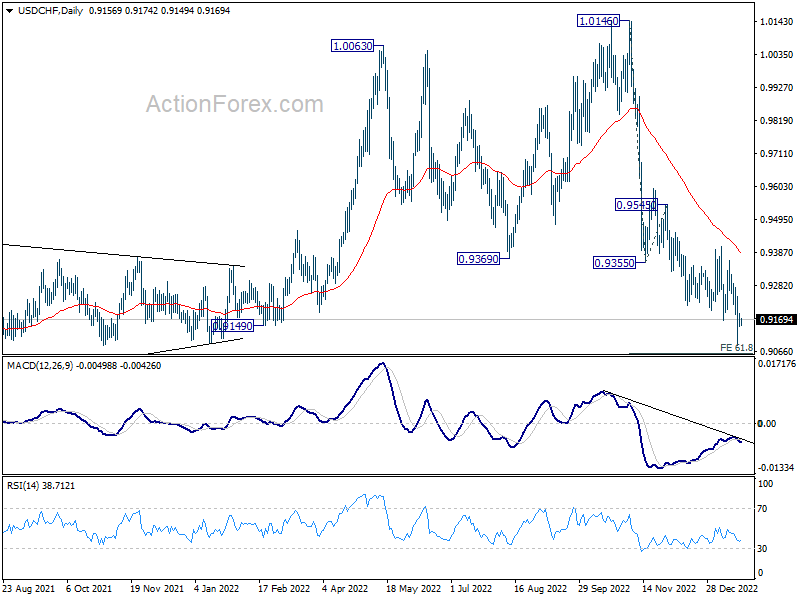
Intraday bias in USD/CHF is turned neutral first with current recovery. But outlook remains bearish as long as 0.9407 resistance holds. Sustained break of 61.8% projection of 1.0146 to 0.9355 from 0.9545 at 0.9056 will pave the way to 100% projection at 0.8754, which is close to 0.8756 long term support. Nevertheless, on the upside, break of 0.9407 should confirm short term bottoming and turn bias back to the upside.
In the bigger picture, rise from 0.8756 (2021 low) has completed at 1.0146, well ahead of 1.0342 long term resistance (2016 high). Based on current downside momentum, fall from 1.0146 should be a medium term down trend itself. Next target is a test on 0.8756 low. Strong support should be seen there to bring rebound. Still, further decline will now be expected as long as 0.9407 resistance holds, in any case.
USD/JPY Daily Outlook
Daily Pivots: (S1) 127.13; (P) 129.35; (R1) 131.14; More...
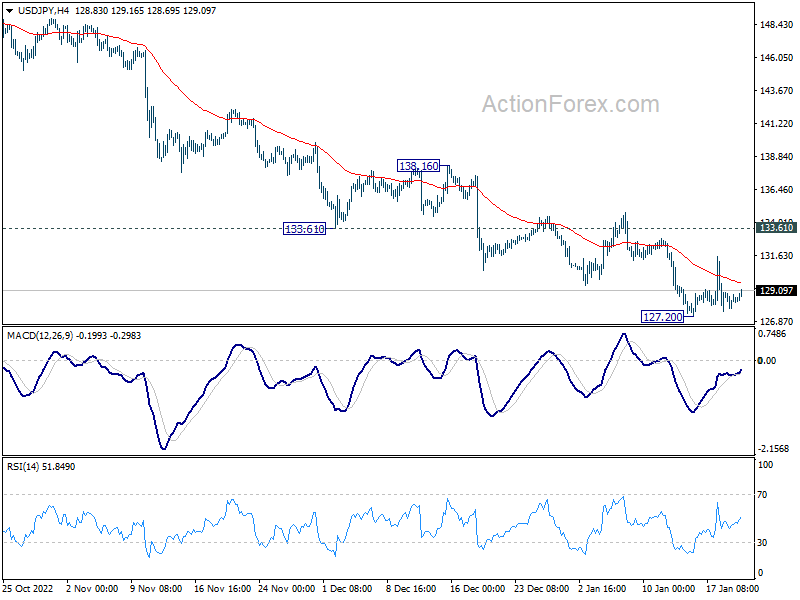
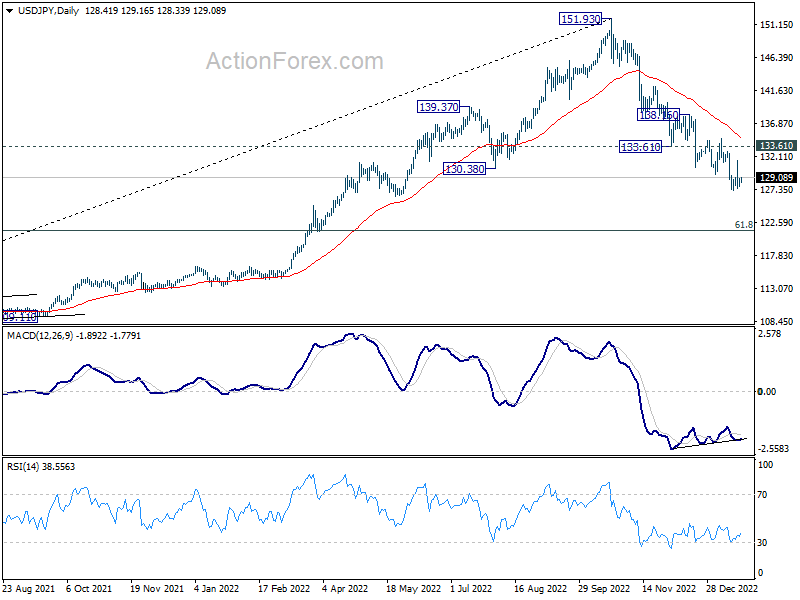
USD/JPY is staying in range above 127.20 and intraday bias remains neutral. Outlook remains bearish with 133.61 support turned resistance intact. Break of 127.20 will resume larger fall from 151.93 to 121.43 fibonacci level next. On the upside, though, firm break of 133.61 will indicate short term bottoming and bring stronger rebound.
In the bigger picture, the firm break of 55 week EMA (now at 131.59) raises the chance of medium term bearish reversal, but that's not confirmed yet. Strong support could be seen around 61.8% retracement of 102.58 to 151.93 at 121.43 and 38.2% retracement of 38.2% retracement of 75.56 to 151.93 at 122.75 to bring rebound. But break of 134.76 resistance is needed to indicate bottoming first. Otherwise further fall will remain in favor.
Yen Weakens Despite Inflation Hitting Four-Decade High
Yen weakens broadly in Asian session despite data showing that inflation hit a four-decade high. Speculations on any BoJ move should cool for a while, given that there is no meeting until March. There is room for Yen to correct lower to digest recent rally. Meanwhile, the Japanese currency is also the worst performer for the week, followed by Aussie and Loonie. Sterling is currently the best, followed by Swiss Franc. Dollar and Euro are mixed.
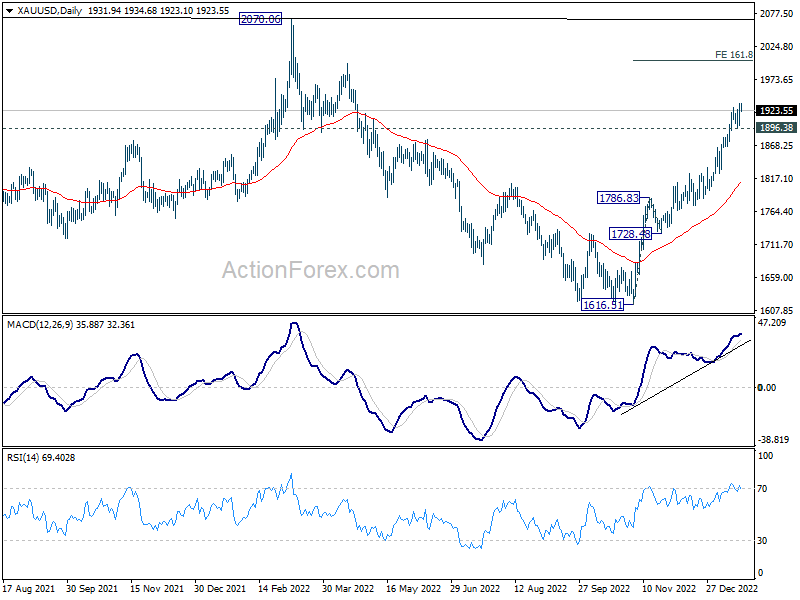
Technically, Gold's up trend from 1616.51 is still in progress despite being overbought. For now, further rise is expected as long as 1896.38 support holds. Next target is 161.8% projection of 1616.51 to 1786.83 from 1728.48 at 2004.05. Any rebound in Dollar could be capped if Gold's rally is continuing.
In Asia, at the time of writing, Nikkei is up 0.32%. Hong Kong HSI is up 1.00%. China Shanghai SSE is up 0.54%. Singapore Strait Times is up 0.55%. Japan 10-year JGB yield is down -0.0031 at 0.401. Overnight, DOW dropped -0.76%. S&P 500 dropped -0.76%. NASDAQ dropped -0.96%. 10-year yield rose 0.022 to 3.397.
Fed Williams: Monetary policy still has more work to do
New York Fed President John Williams said overnight, "with inflation still high and indications of continued supply-demand imbalances, it is clear that monetary policy still has more work to do to bring inflation down to our 2% goal on a sustained basis."
"Bringing inflation down is likely to require a period of below-trend growth and some softening of labor market conditions," he added. "Restoring price stability is essential to achieving maximum employment and stable prices over the longer term, and it is critical that we stay the course until the job is done."
Fed Brainard: Policy will need to be sufficiently restrictive for some time
Fed Vice Chair Lael Brainard said in a speech yesterday, "even with the recent moderation, inflation remains high, and policy will need to be sufficiently restrictive for some time to make sure inflation returns to 2 percent on a sustained basis."
"The FOMC moved policy into restrictive territory at a rapid pace and subsequently downshifted the pace of increases in the target range at its most recent meeting," She noted. "This will enable us to assess more data as we move the policy rate closer to a sufficiently restrictive level, taking into account the risks around our dual-mandate goals."
Japan CPI core rose to 4% yoy in Dec, highest since 1981
Japan CPI core (all items ex-fresh food) accelerated from 3.7% yoy to 4.0% yoy in December, matched expectations. That's also the highest level in four decades since 1981. CPI core-core (all items ex-food and energy) also accelerated from 2.8% yoy to 3.0% yoy, hitting the highest level since 1991. Headline inflation rose from 3.8% yoy to 4.0% yoy.
Food prices jumped 7.4% while energy prices rose 15.2%. "The impact on CPI from higher energy prices was large in 2022 but contributions from food prices are now bigger," a government official said.
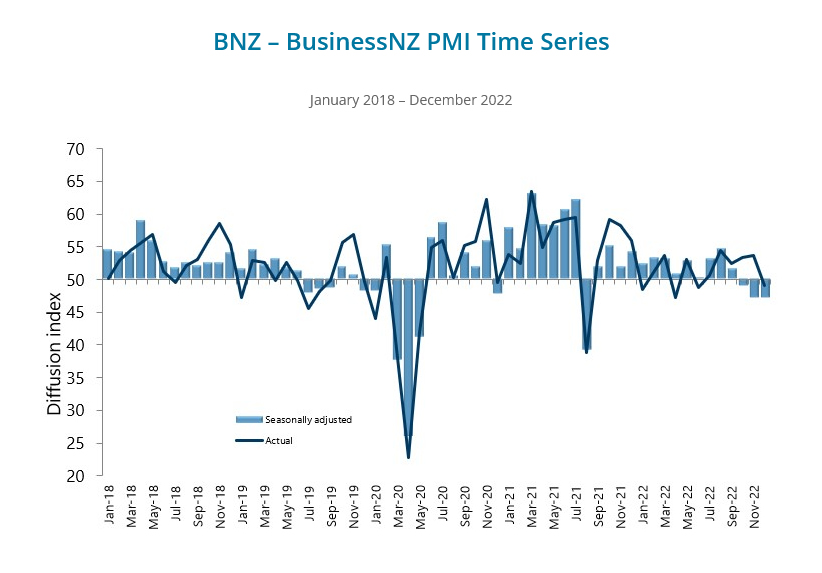
NZ BusinessNZ manufacturing unchanged at 47.2, further slippage expected in Q1
New Zealand BusinessNZ Performance of Manufacturing Index was unchanged at 47.2 in December. Looking at some details, production ticked up from 49.5 to 49.7. Employment rose from 46.9 to 48.8. New orders rose from 42.2 to 46.1. Finished stocks dropped from 55.5 to 50.1. Deliveries dropped from 49.6 to 48.4.
BNZ Senior Economist, Doug Steel stated that the latest PMI result "broadly fits with the clear decline we already expect for manufacturing GDP in Q4 with further slippage expected in Q1".
Looking ahead
UK retail sales and Germany PPI will be released in European session. Later in the day, Canada retail sales is the main focus while US will release existing home sales.
USD/JPY Daily Outlook
Daily Pivots: (S1) 127.13; (P) 129.35; (R1) 131.14; More...
USD/JPY is staying in range above 127.20 and intraday bias remains neutral. Outlook remains bearish with 133.61 support turned resistance intact. Break of 127.20 will resume larger fall from 151.93 to 121.43 fibonacci level next. On the upside, though, firm break of 133.61 will indicate short term bottoming and bring stronger rebound.
In the bigger picture, the firm break of 55 week EMA (now at 131.59) raises the chance of medium term bearish reversal, but that's not confirmed yet. Strong support could be seen around 61.8% retracement of 102.58 to 151.93 at 121.43 and 38.2% retracement of 38.2% retracement of 75.56 to 151.93 at 122.75 to bring rebound. But break of 134.76 resistance is needed to indicate bottoming first. Otherwise further fall will remain in favor.
Economic Indicators Update
| GMT | Ccy | Events | Actual | Forecast | Previous | Revised |
|---|---|---|---|---|---|---|
| 21:30 | NZD | Business NZ PMI Dec | 47.2 | 47.4 | 47.2 | |
| 23:30 | JPY | National CPI Y/Y Dec | 4.00% | 4.40% | 3.80% | |
| 23:30 | JPY | National CPI Core Y/Y Dec | 4.00% | 4.00% | 3.70% | |
| 23:30 | JPY | National CPI Core-Core Y/Y Dec | 3.00% | 2.90% | 2.80% | |
| 00:01 | GBP | GfK Consumer Confidence Jan | -45 | -41 | -42 | |
| 07:00 | GBP | Retail Sales M/M Dec | 0.40% | -0.40% | ||
| 07:00 | GBP | Retail Sales Y/Y Dec | -4.20% | -5.90% | ||
| 07:00 | GBP | Retail Sales ex-Fuel M/M Dec | 0.40% | -0.30% | ||
| 07:00 | GBP | Retail Sales ex-Fuel Y/Y Dec | -4.40% | -5.90% | ||
| 07:00 | EUR | Germany PPI M/M Dec | -1.20% | -3.90% | ||
| 07:00 | EUR | Germany PPI Y/Y Dec | 20.80% | 28.20% | ||
| 13:30 | CAD | Retail Sales M/M Nov | -0.50% | 1.40% | ||
| 13:30 | CAD | Retail Sales ex Autos M/M Nov | -0.90% | 1.70% | ||
| 15:00 | USD | Existing Home Sales M/M Dec | 3.95M | 4.09M |
Cliff Notes: The New Year Brings Optimism Over Inflation
Key insights from the week that was.
This week’s data was broadly supportive of confidence, with the risks around inflation and therefore the policy outlook thought to have improved into the new year.
Beginning in Australia, the Westpac-MI Consumer Sentiment survey reported another improvement in confidence, the headline index up 5.0% in January to be up 8.1% over the last two months. However, at 84.3, confidence among households is still in deeply pessimistic territory comparable to other major recessions. The lack of an RBA Board meeting in January looks to have provided households some temporary relief from the tightening cycle, highlighted by a 10.7% lift in sentiment among mortgage holders.
Although the survey’s sub-indexes showed an improvement in households’ expectations around the economic outlook and finances, households’ spending intentions for major items remained little changed and acutely pessimistic given the persistence of cost-of-living pressures. As detailed in our CPI preview, Westpac expects inflation to peak in Q4 2022 at 7.4%yr after a 1.5% quarterly lift in consumer prices before gradually easing over the course of 2023. Still, with more interest rate rises anticipated in coming months, consumer confidence will likely remain in a fragile state.
The December labour force survey provided the largest domestic surprise of the week. Against a market consensus of an around-trend 30k gain in employment, 14.6k jobs were instead lost in the month. This follows multiple months of robust prints for employment growth, averaging around 40k between August and November. Illness remains the key factor limiting employment and hours worked, as evinced by the fact that 50% more people worked reduced hours than is typically seen in December. This is also likely why the participation rate declined by 0.2ppts to 66.6%, resulting in the unemployment rate holding at 3.5%.
It was also interesting to note though that the proportion of workers taking annual leave was below the pre-pandemic average in December despite 2022/23 being the first summer of unrestricted travel since the pandemic. This was also partly reflected in Australia’s overseas arrivals and departures data wherein we estimate that departures, despite posting a 345.6k lift in original terms, underperformed once seasonally adjusted. Progress in short-term visitor flows has been a key positive of late, with the excess of arrivals over departures averaging roughly 65k/mth so far in FY23, pointing to some upside risk to the Government’s net overseas migration forecast of 235k.
In New Zealand meanwhile, we saw evidence of the impact of higher rates and inflation on consumer spending and the housing market. In December, retail card spending materially disappointed expectations, falling 2.5% following a 0.3% rise in November. House prices also continued their decline, taking the cumulative loss-to-date to 15% -- Westpac believes on its way to a trough reading of -21%. Unsurprisingly, given the much-higher marginal cost of debt, house sales are now down 39% versus a year ago. This week, Westpac NZ economics released a detailed view on the impact of higher rates on household finances and wealth. Ahead of next week’s Q4 CPI, their preview was also released.
Arguably though, the data release of the week came from offshore, with Chinese GDP and the associated partials witnessing to the turmoil created by the December end of COVID-zero but also the underlying strength of their economy. Instead of contracting, GDP stalled in the December quarter as households’ panic buying of necessities offset a significant fall in services consumption. Fixed asset investment meanwhile remained resilient, both to the 10% decline in residential construction through 2022 and COVID-zero’s end, with total investment up 5% for the year. Most notable for the outlook is the strength of high-tech investment in both manufacturing and services, up 22% and 12% respectively in 2022.
Not only is this a way to offset the cost to the economy of the structural decline and ageing of their population, but also to produce the increased productivity and profitability necessary to fund a doubling in per capita GDP by 2035 as Chinese authorities intend. We continue to expect China’s economy to grow at an average rate of 5% or more through 2022-2024, and for this rate of growth to prove sustainable into the medium term. There may however be consequences for geopolitical relations, with US authorities showing through 2022 a desire to restrict China’s rise, both in the global economy and industry.
Still in Asia, the Bank of Japan kept policy unchanged at its January meeting, having surprised by adjusting their stance the month prior. The January decision highlights the doubts the BoJ have over the sustainability of inflation at-or-above target into the medium term despite the extraordinary inflation the developed-world is currently experiencing. Arguably, these doubts could grow hence, with the global fight against inflation proving successful – best evinced by the US. With the evolving global backdrop and having held firm in January, it is difficult to see the BoJ making another change before Governor Kuroda steps down in April, keeping the historic divergence in rates between Japan and the rest of the developed world intact.
Then to the US. The limited commentary we have seen from FOMC members to date in 2023 has, by and large, suggested the Committee remains on track to raise the fed funds rate to a peak around 5% at March or May – Westpac continues to expect two more 25bp moves to a 4.875% peak in March. However, increasingly it is becoming clear that activity in the economy is deteriorating more than the FOMC expected. Retail sales was an example this week.
More to the point for the FOMC though, the inflation detail is now showing very clear signs of rapid disinflation. From a peak of 7.6% annualised at June, the three-month change in ‘sticky’ prices as measured by the Atlanta Federal Reserve has fallen to 5.5%. Excluding shelter, the deceleration has been more than twice as large, from 7.7% to 2.9% annualised. ‘Flexible’ price growth on a core basis has dropped from +8.7% to -6.8% annualised over the same period. These are very large and sustained moves which put US headline inflation on a path back near the FOMC’s 2.0% annualised target in the second half of the year.
It is not surprising then the market is pricing in rate cuts by the FOMC in the second half of the year and that the 10-year yield has declined almost 50bps through January. With the US labour market to only weaken slowly, and given the FOMC’s resolve over inflation, we believe a 2024 start date for rate cuts is more probable, although we then forecast a hefty 200bps of cuts to end-2024.
While Europe and the UK have seen much less of an improvement in printed inflation, upside risks are subsiding and there is growing belief that through 2023 a marked reduction in price pressures will occur. So, through January, a more cautious tone has been struck by officials on the policy outlook. Most notably, ECB Chief Economist Lane put the focus squarely on the tightening to date when speaking in January, with interest rates now seen as “ballpark neutral” – as an aside, Westpac believes they are best considered contractionary, particularly if market spreads and the limited risk tolerance of banks is taken into consideration. To that end, we anticipate the ECB’s tightening cycle will conclude at roughly the same time as the FOMC’s, but at a much lower level of rates. For EUR/USD and the US dollar more broadly, relative growth opportunities should then take centre stage, with Euro and Asia gaining favour as this transition occurs.
Technical Outlook and Review
USD/JPY:
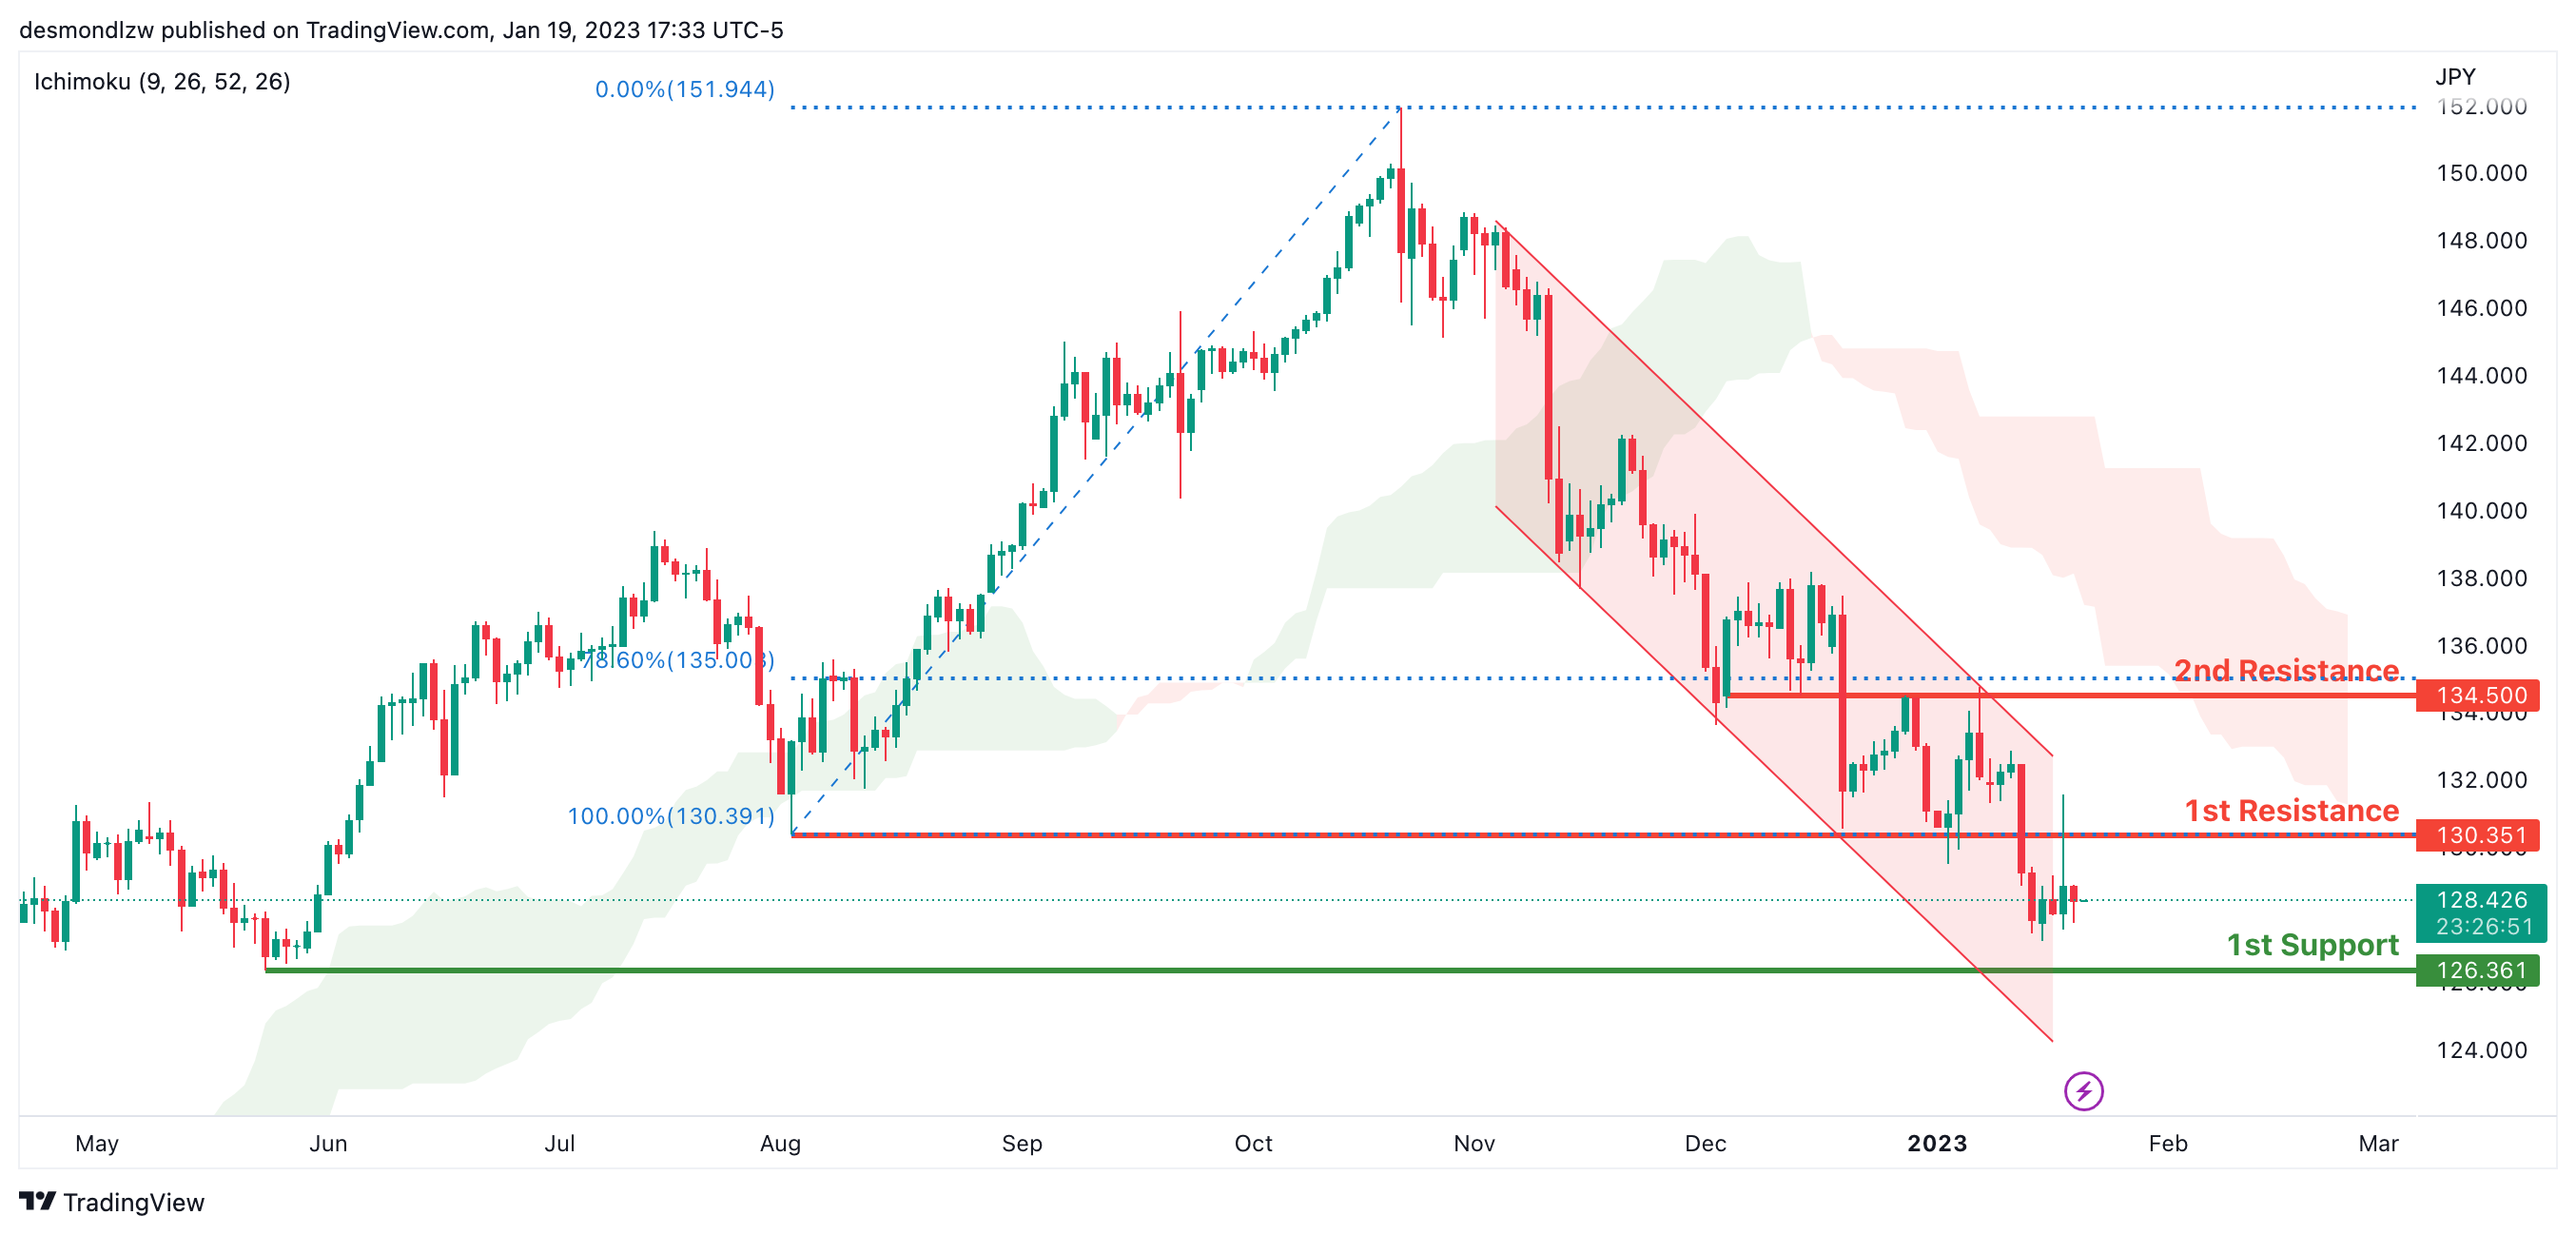
Looking at the Daily chart, my overall bias for USDJPY is bearish due to the current price being below the Ichimoku cloud, indicating a bearish market. To add confluence to this bias, price is also within a descending channel. If this bearish momentum continues, expect the price to possibly continue heading towards the 1st support level at 126.361, where the previous swing low is. In an alternate scenario, price could possibly head back up to retest the 1st resistance at 130.351, where the previous swing low is.
Areas of consideration:
- H4 time frame, 1st resistance at 130.351
- H4 time frame, 1st support at 126.361
DXY:
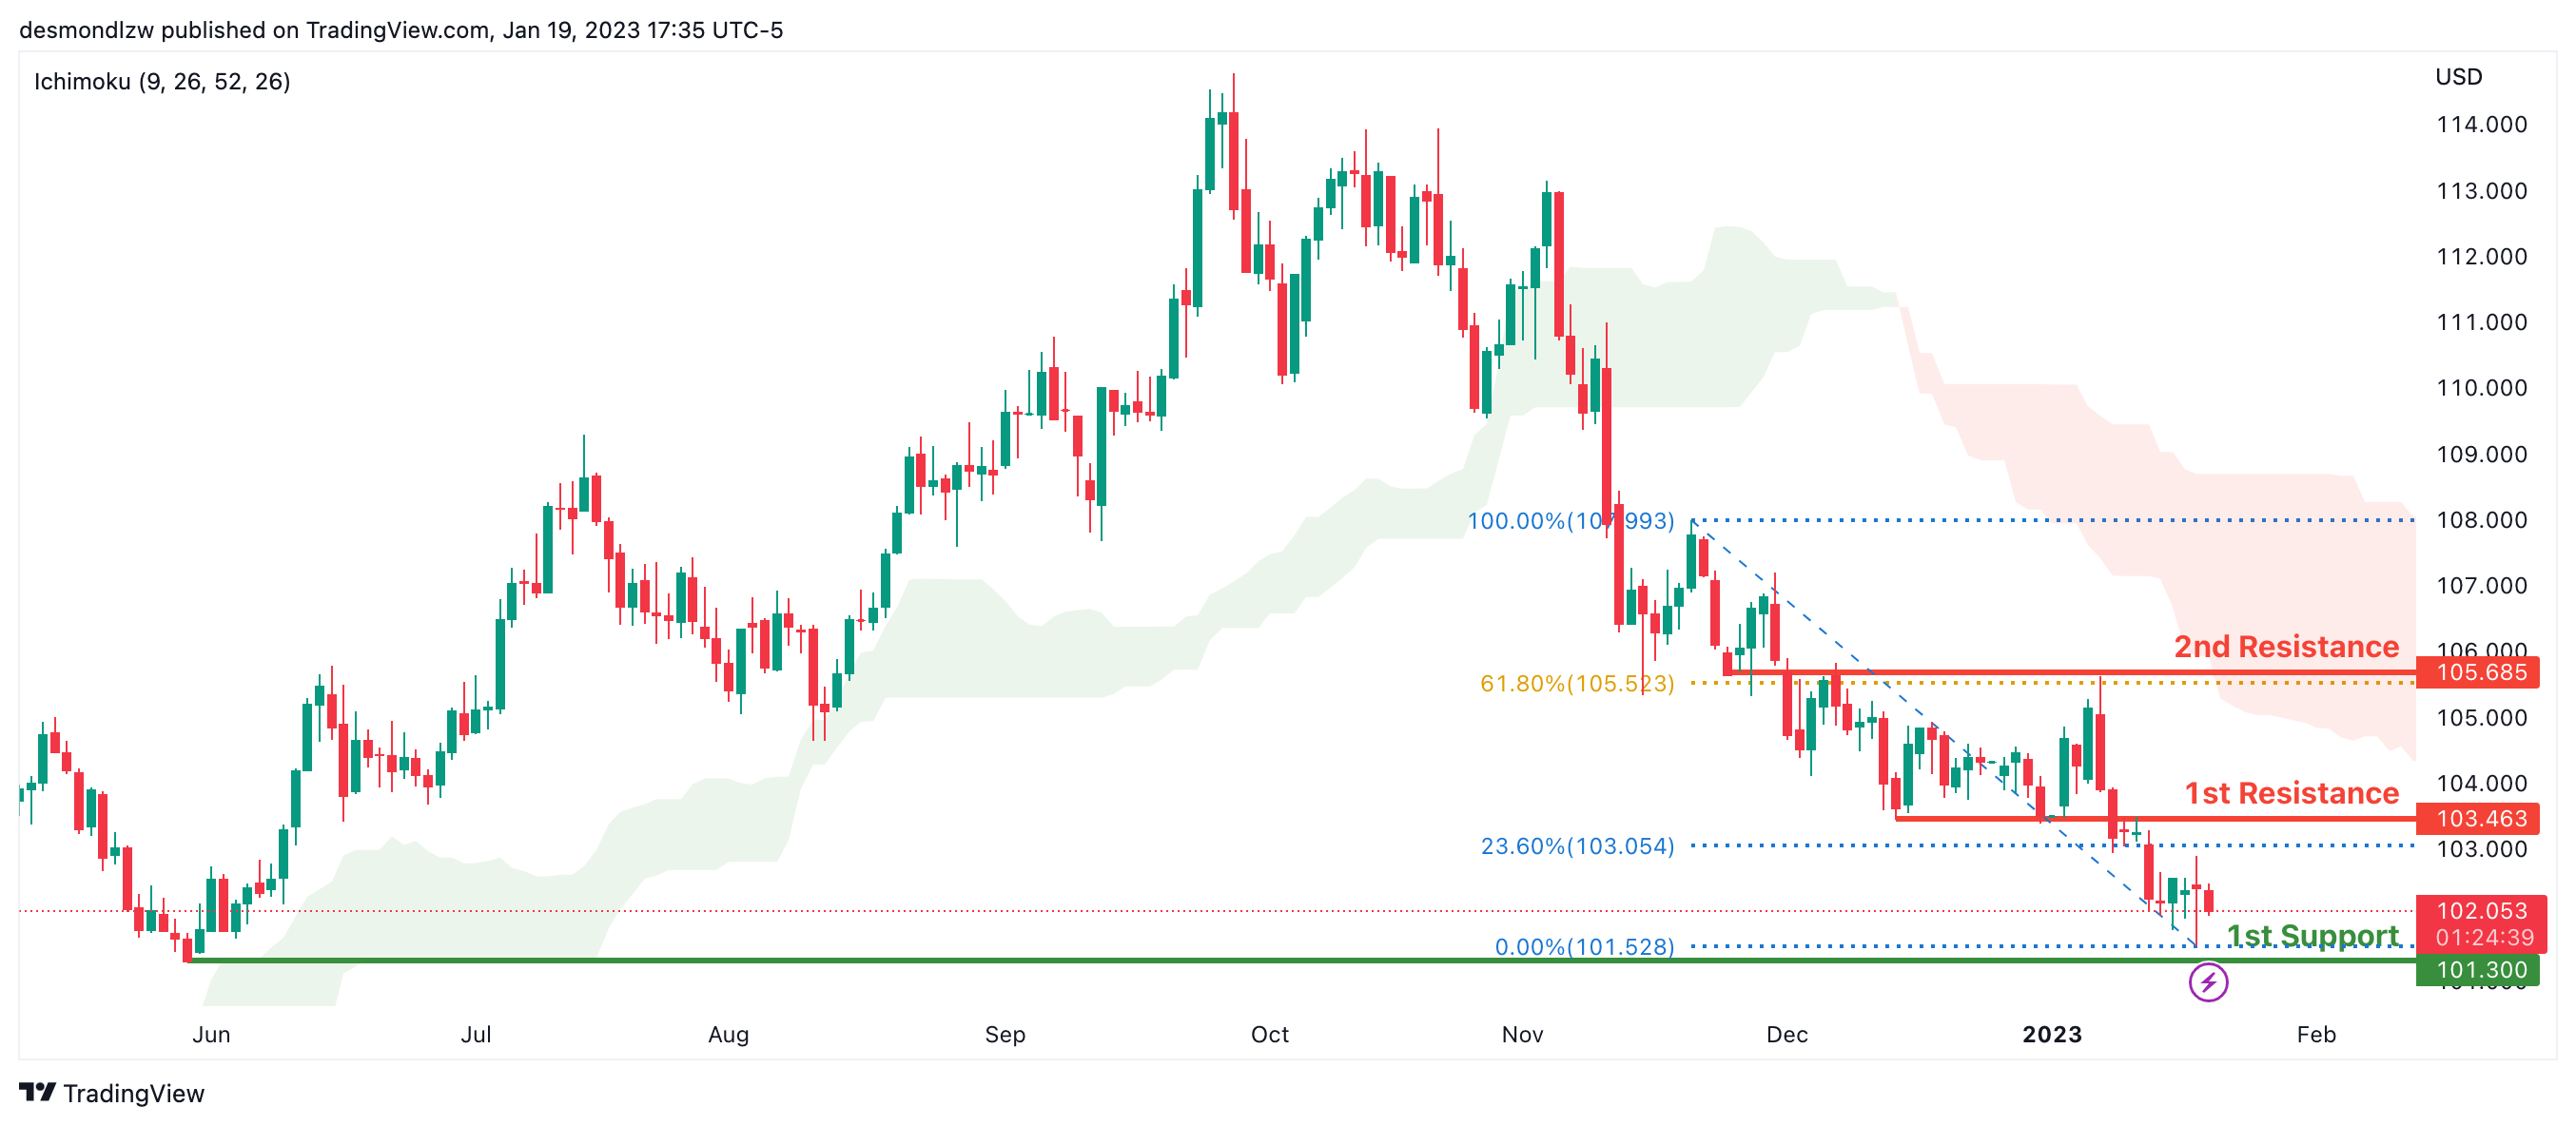
Looking at the Daily chart, my overall bias for DXY is bearish due to the current price being below the Ichimoku cloud, indicating a bearish market. If this bearish momentum continues, expect the price to possibly continue heading towards the 1st support at 101.300, where the previous low is. . In an alternative scenario, price could head back up to retest the 1st resistance at 103.463, where the 23.6% Fibonacci line is.
Areas of consideration:
- H4 time frame, 1st resistance at 103.463
- H4 time frame, 1st support at 101.300
EUR/USD:
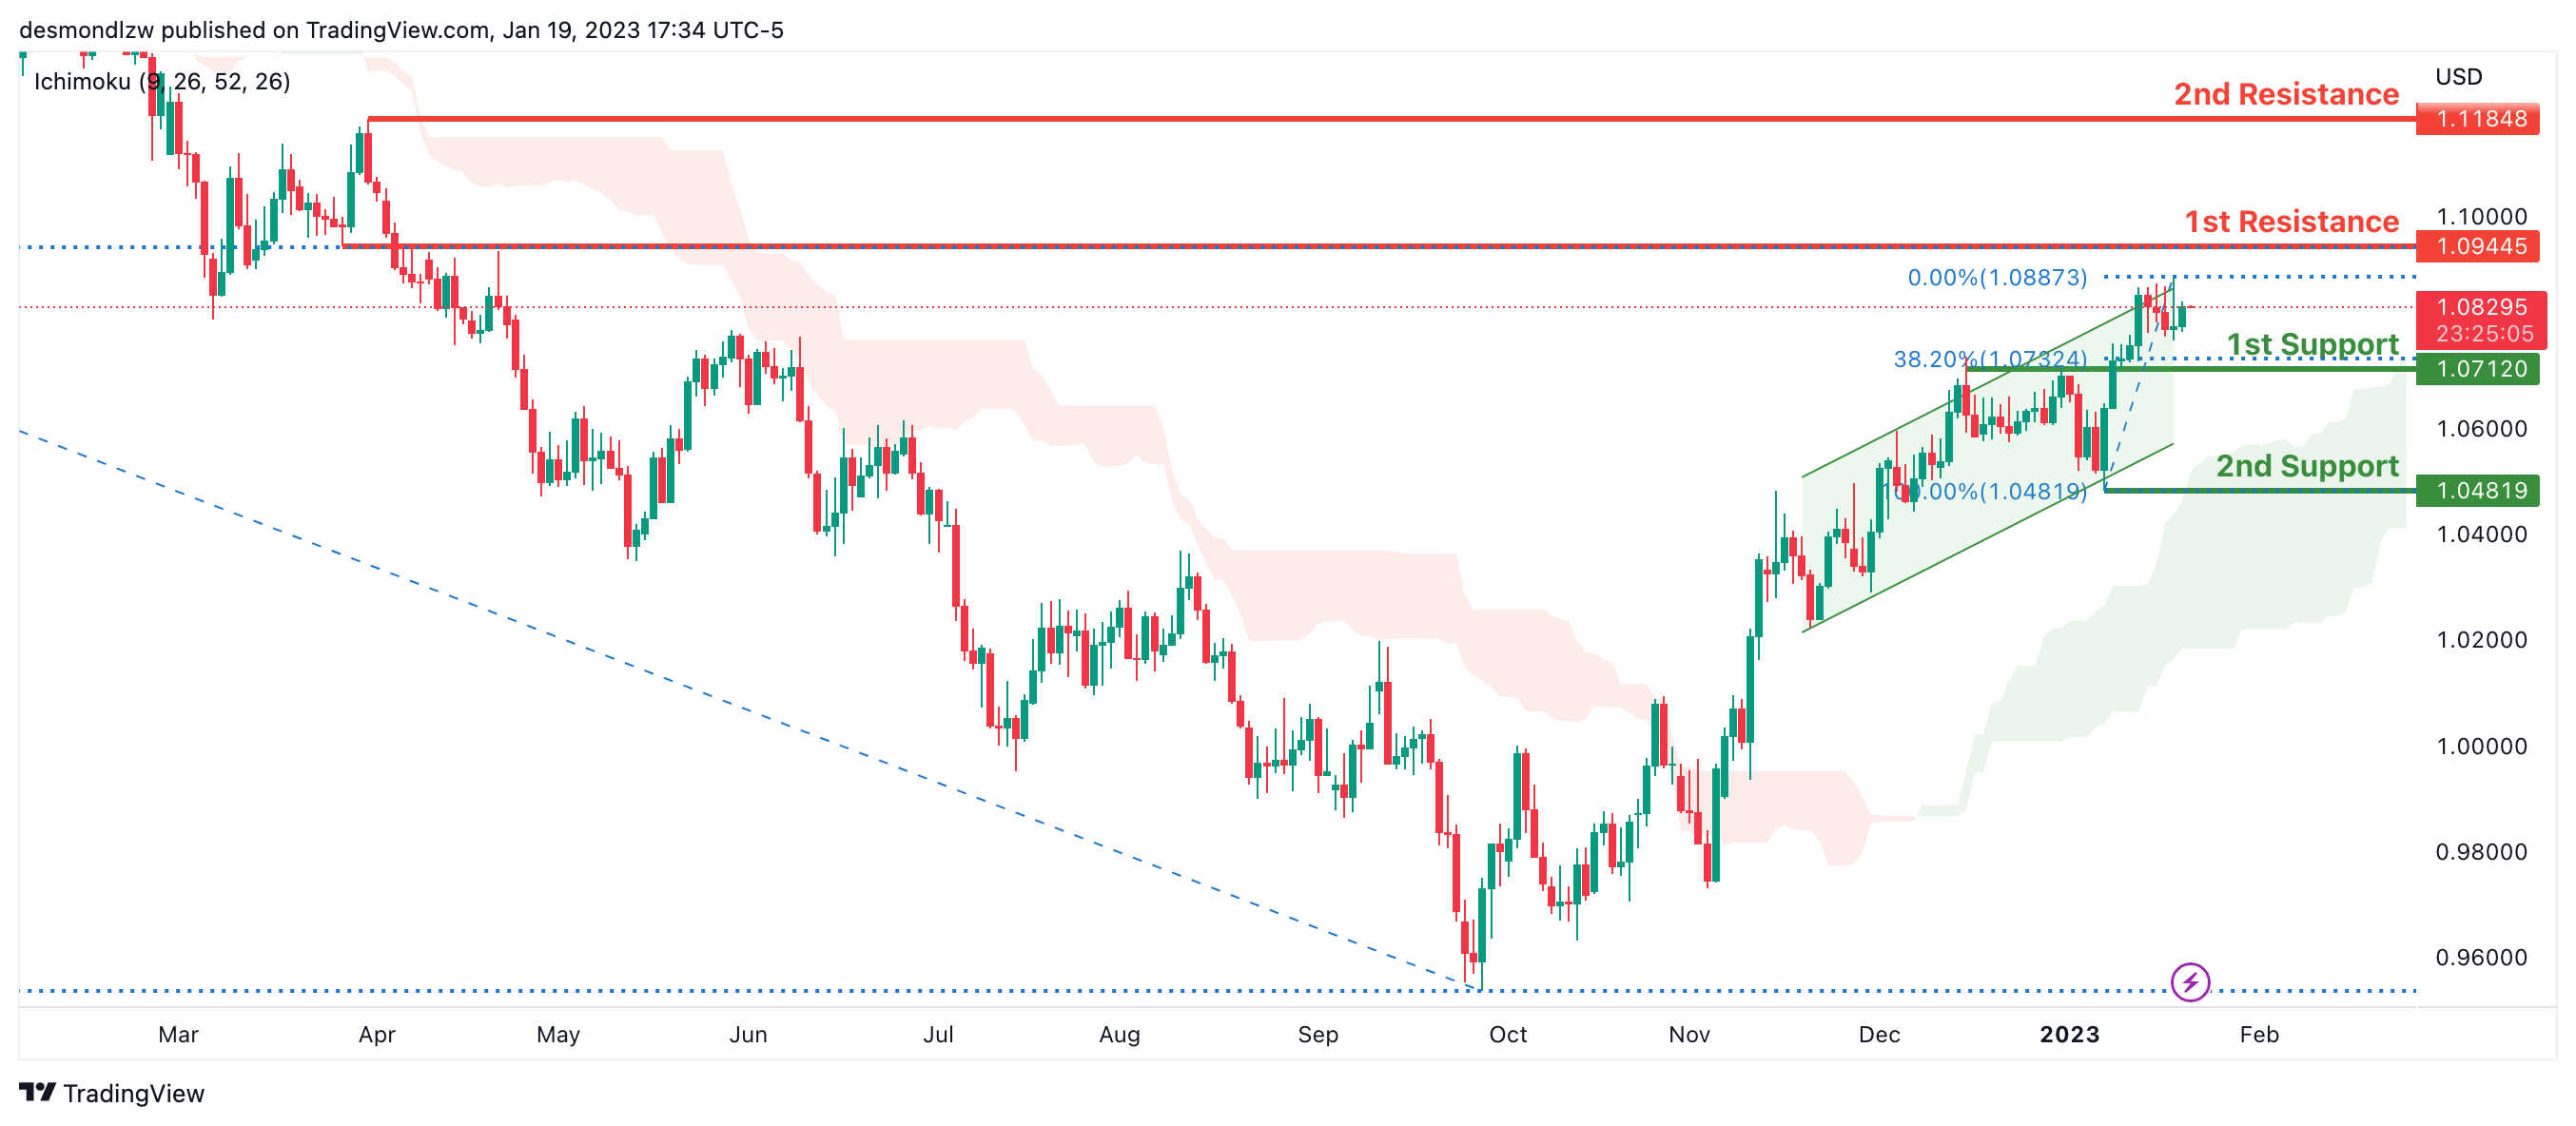
Looking at the Daily chart, my overall bias for EURUSD is bullish due to the current price being above the Ichimoku cloud, indicating a bullish market structure. To add confluence to this bias, price is also within an ascending channel. If this bullish momentum continues, expect the price to possibly continue heading towards the 1st resistance at 1.09445, where the 50% Fibonacci line is. In an alternate scenario, price could possibly head back down to retest the 1st support level at 1.07120, where the 38.2% Fibonacci line is.
Areas of consideration :
- H4 1st resistance at 1.09445
- H4 1st support at 1.07120
GBP/USD:
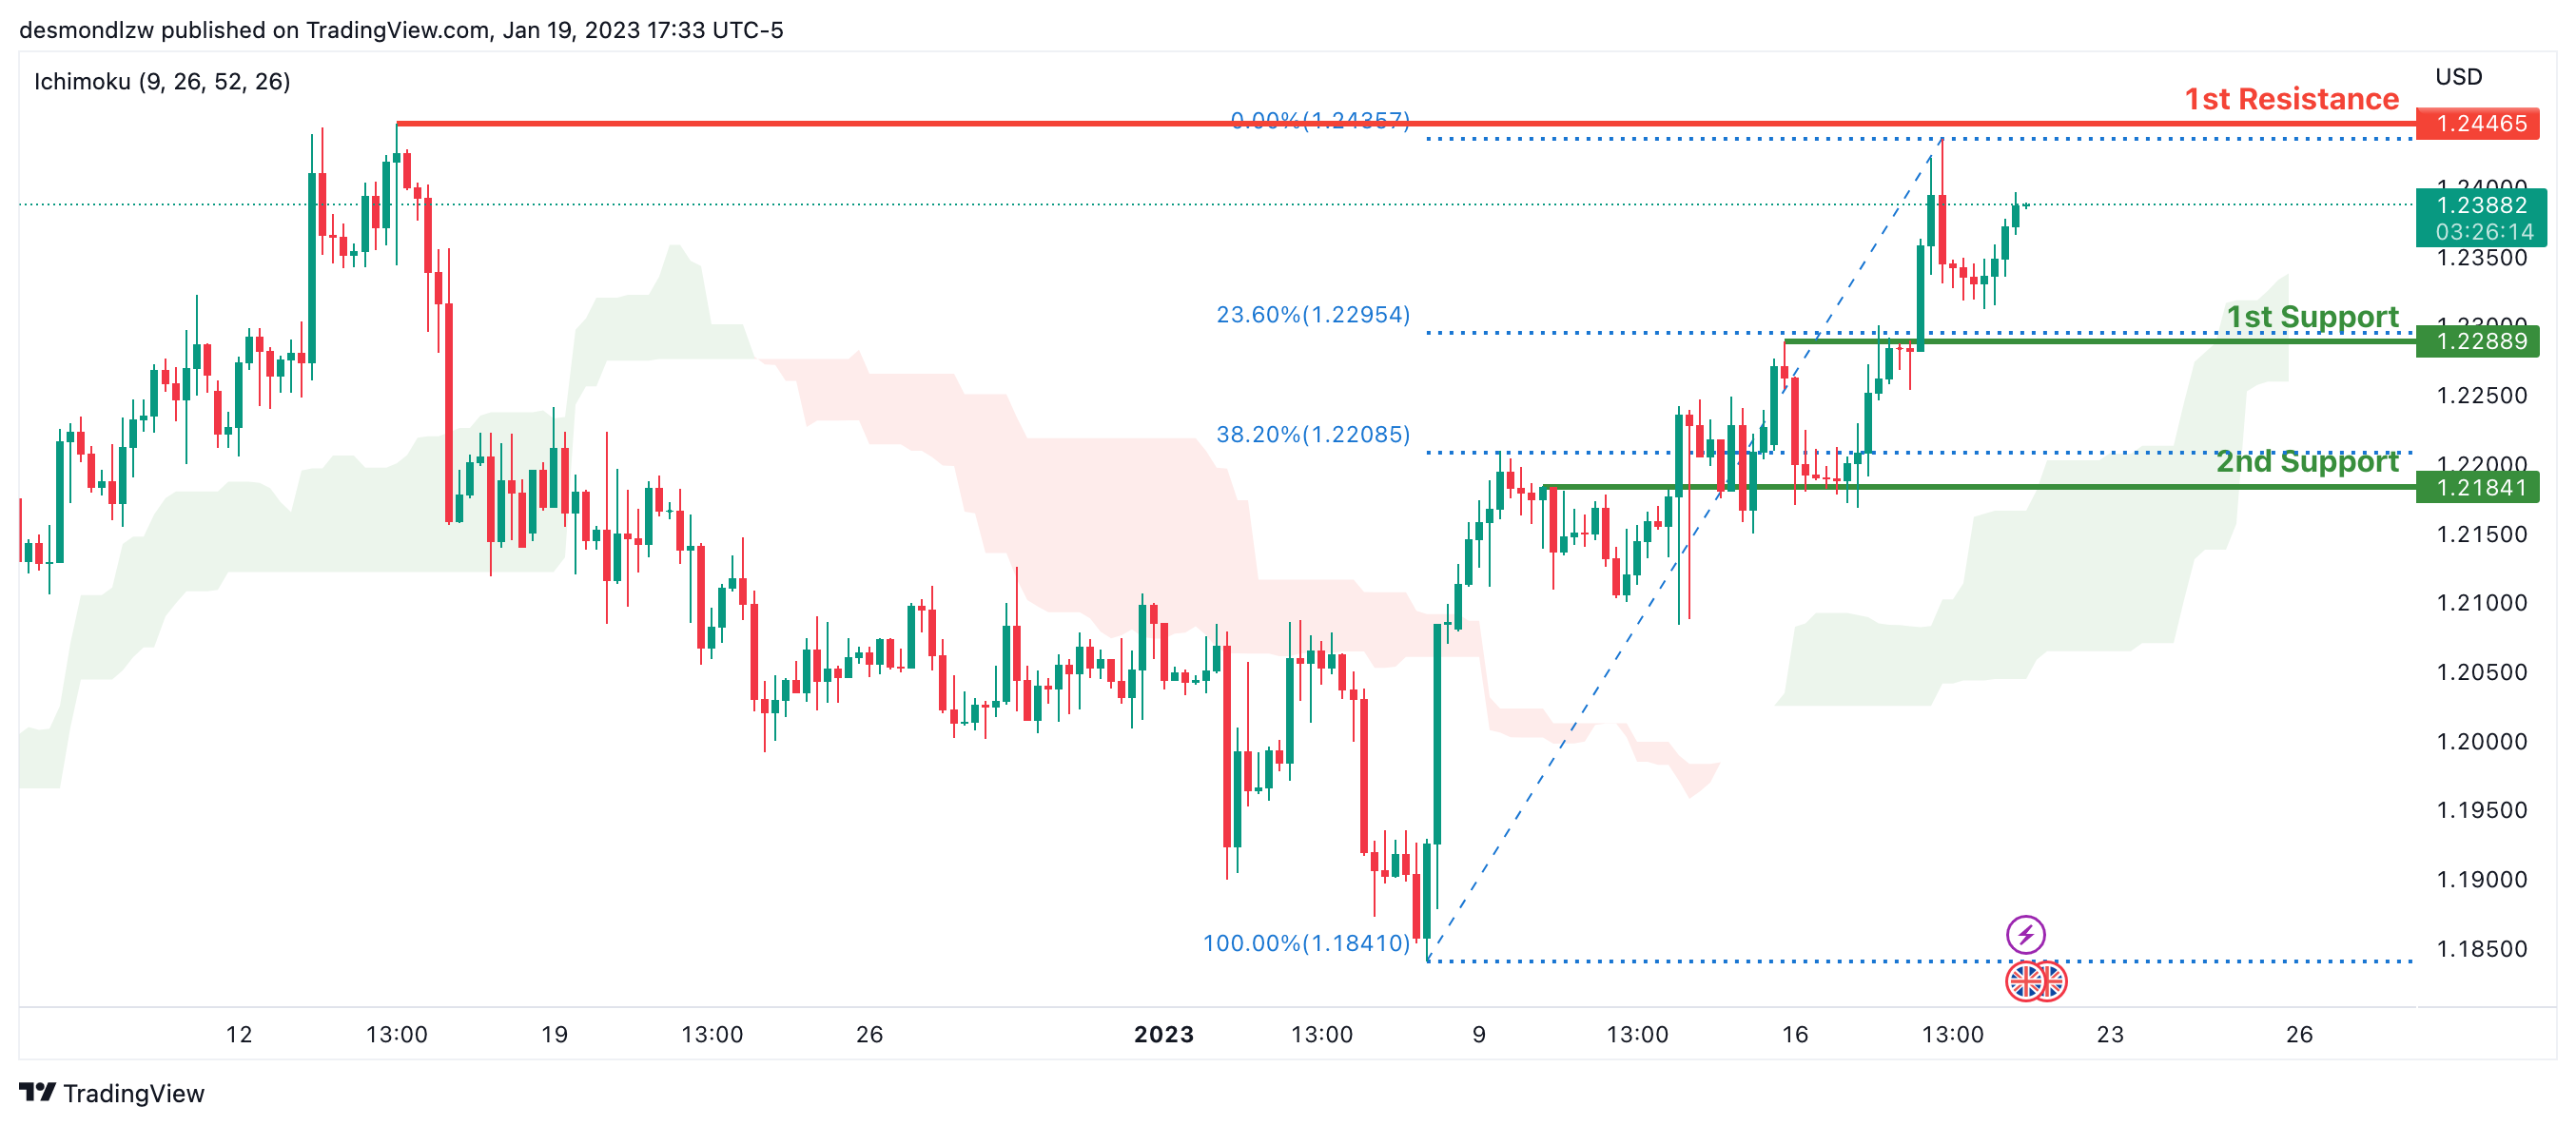
Looking at the H4 chart, my overall bias for GBPUSD is bullish due to the current price being above the Ichimoku cloud, indicating a bullish market. If this bullish momentum continues, expect price to possibly continue heading towards the 1st resistance line at 1.24465, where the previous swing high is. In an alternate scenario, price could possibly head back down and retest the 1st support at 1.22889, where the 23.6% Fibonacci line is.
Areas of consideration:
- H4 1st resistance at 1.24465
- H4 1st support at 1.22889
USD/CHF:
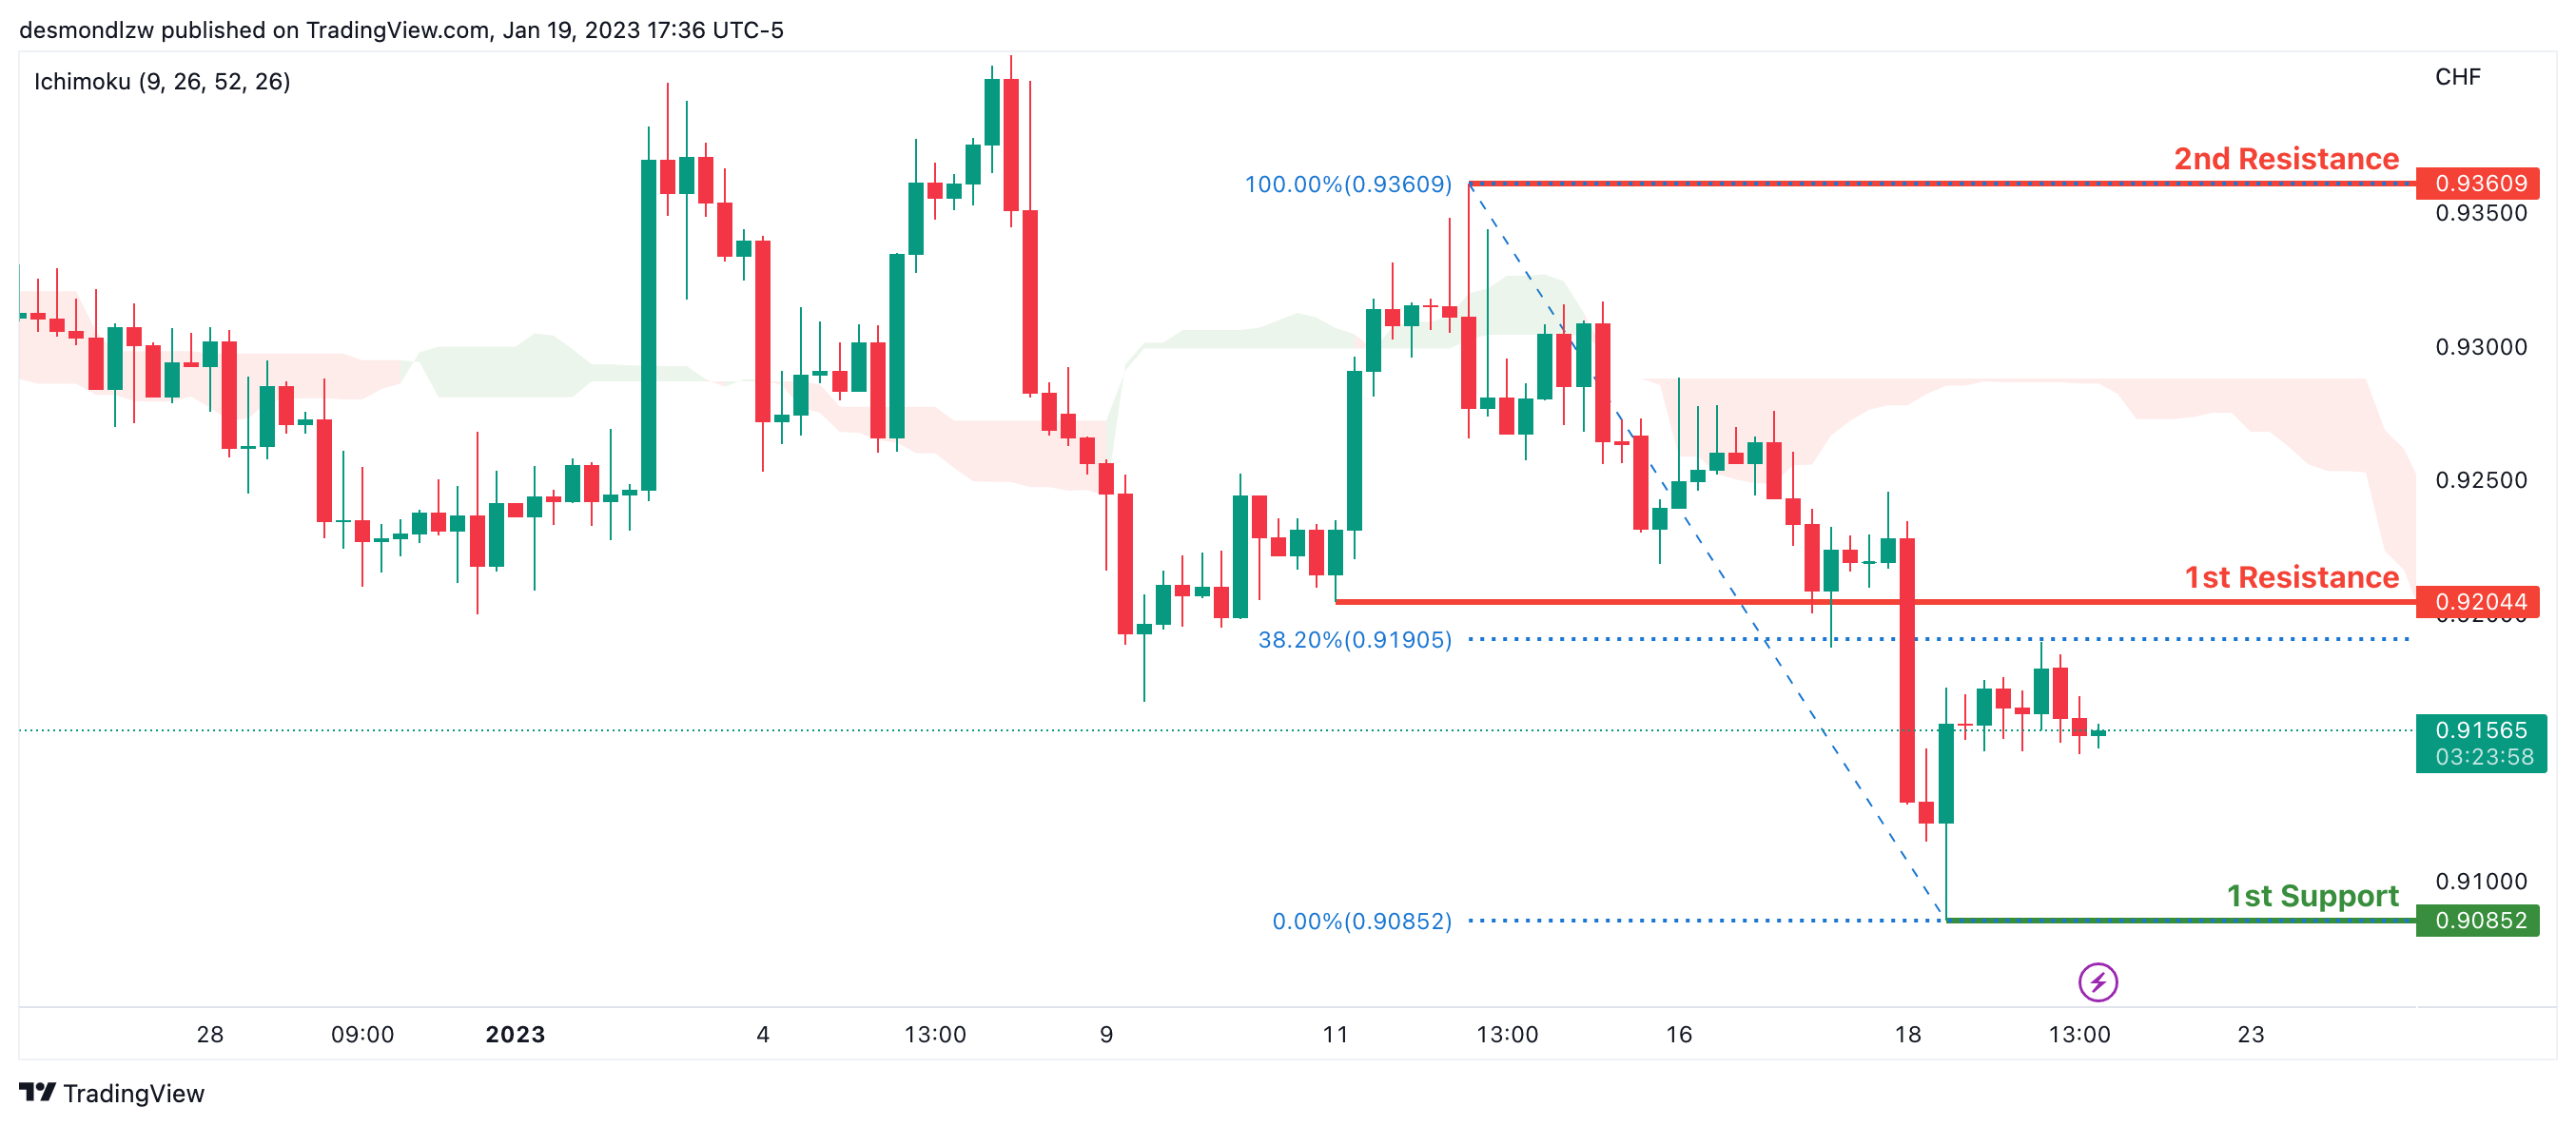
Looking at the H4 chart, my overall bias for USDCHF is bearish due to the current price crossing below the Ichimoku cloud, indicating a bearish market. If the current bearish trend continues, expect the price to possibly continue to head towards the 1st support at 0.90852, where the recent low is. In an alternative scenario, price could possibly head back up to retest the 1st resistance at 0.92044, where the 38.2% Fibonacci line is.
Areas of consideration
- H4 1st support at 0.90852
- H4 1st resistance at 0.92044
XAU/USD (GOLD):
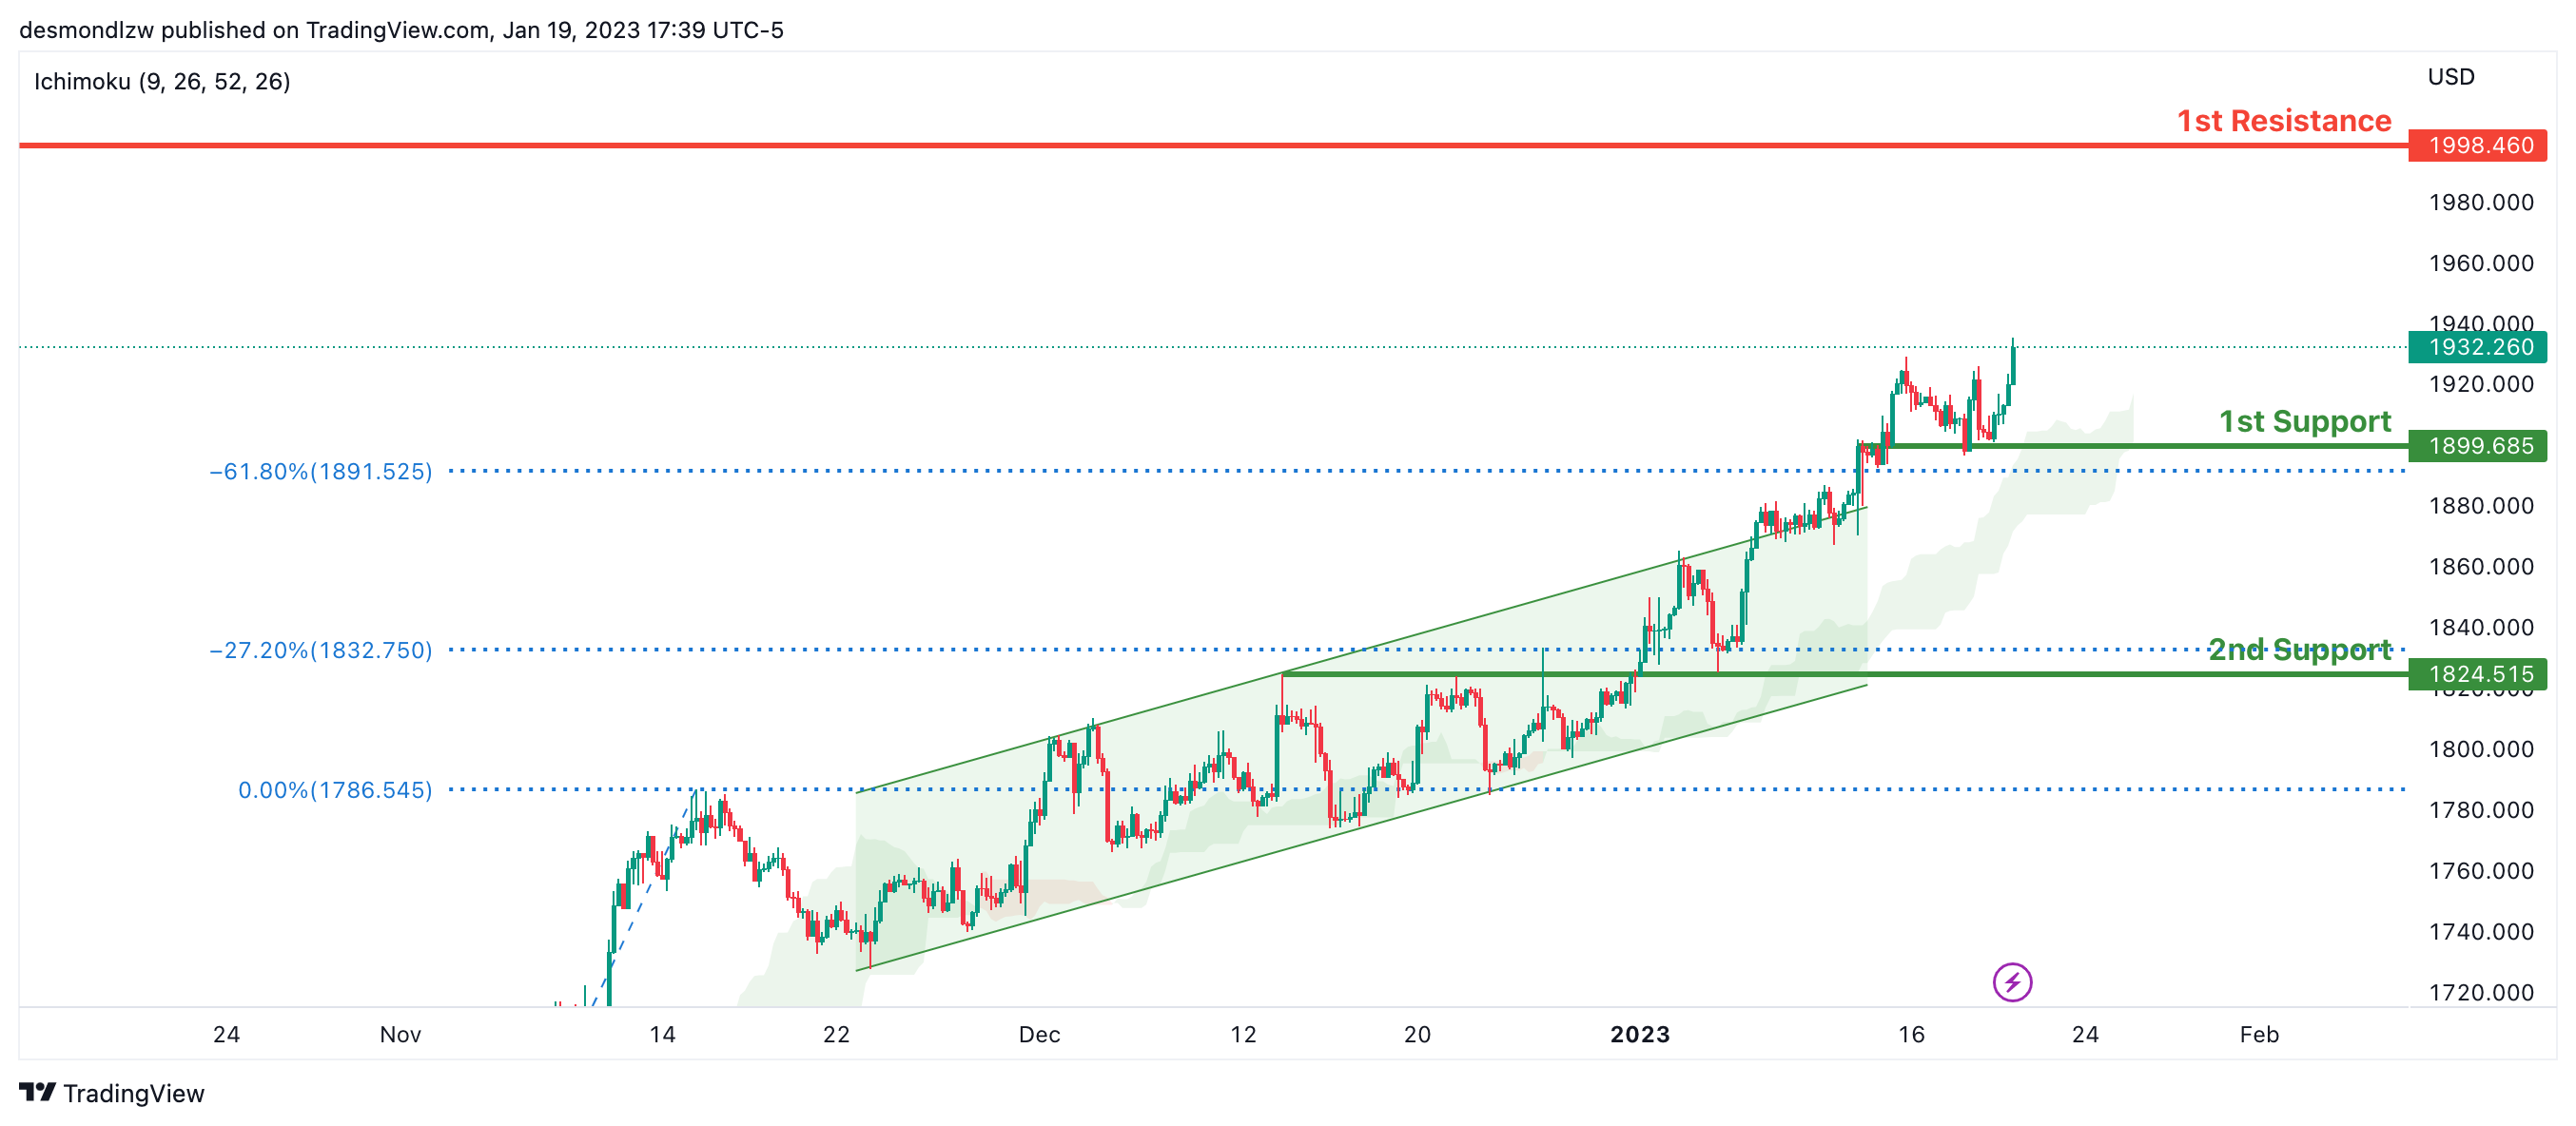
Looking at the H4 chart, my overall bias for XAUUSD is bullish due to the current price crossing above the Ichimoku cloud, indicating a bullish market. To add support to this bias, price has also broken above the bullish ascending channel. If this bullish momentum continues, expect the price to possibly continue heading towards the 1st resistance at 1998.460, where the previous swing high is. In an alternative scenario, price could possibly head back down to retest the 1st support at 1899.685 where the -61.8% Fibonacci expansion line is.
Areas of consideration:
- H4 time frame, 1st resistance at 1998.460
- H4 time frame, 1st support at 1899.685
AUD/USD:
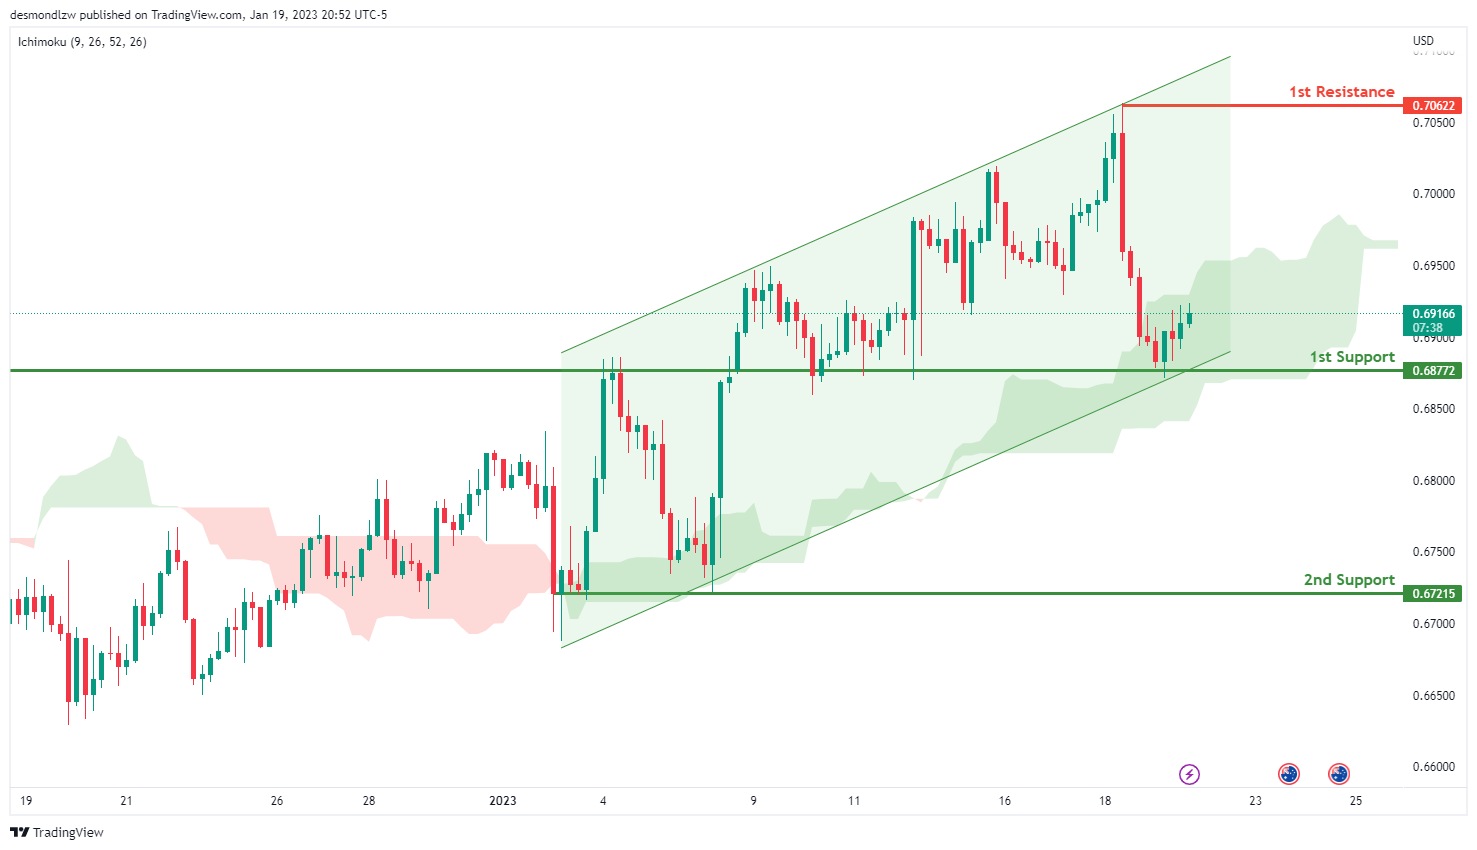
Looking at the H4 chart, we can see that the 1st support is at 0.68722 which is an overlap support. Yesterday the price is trying to break through , but did not. This shows 1st support is still very strong. With yesterday price moment, a very clear strong uptrend was created. The price is moving towards the 1st resistance is at0.67215 which is a recent swing high.
In an alternative scenario, the price may also break the 1st support line, and moving to the 2nd support line which is at 0.67215.
Areas of consideration
- H4. 1st resistance at 0.67215
- H4, 1st support at 0.68722
- H4.2nd support at 0.67215
NZD/USD:
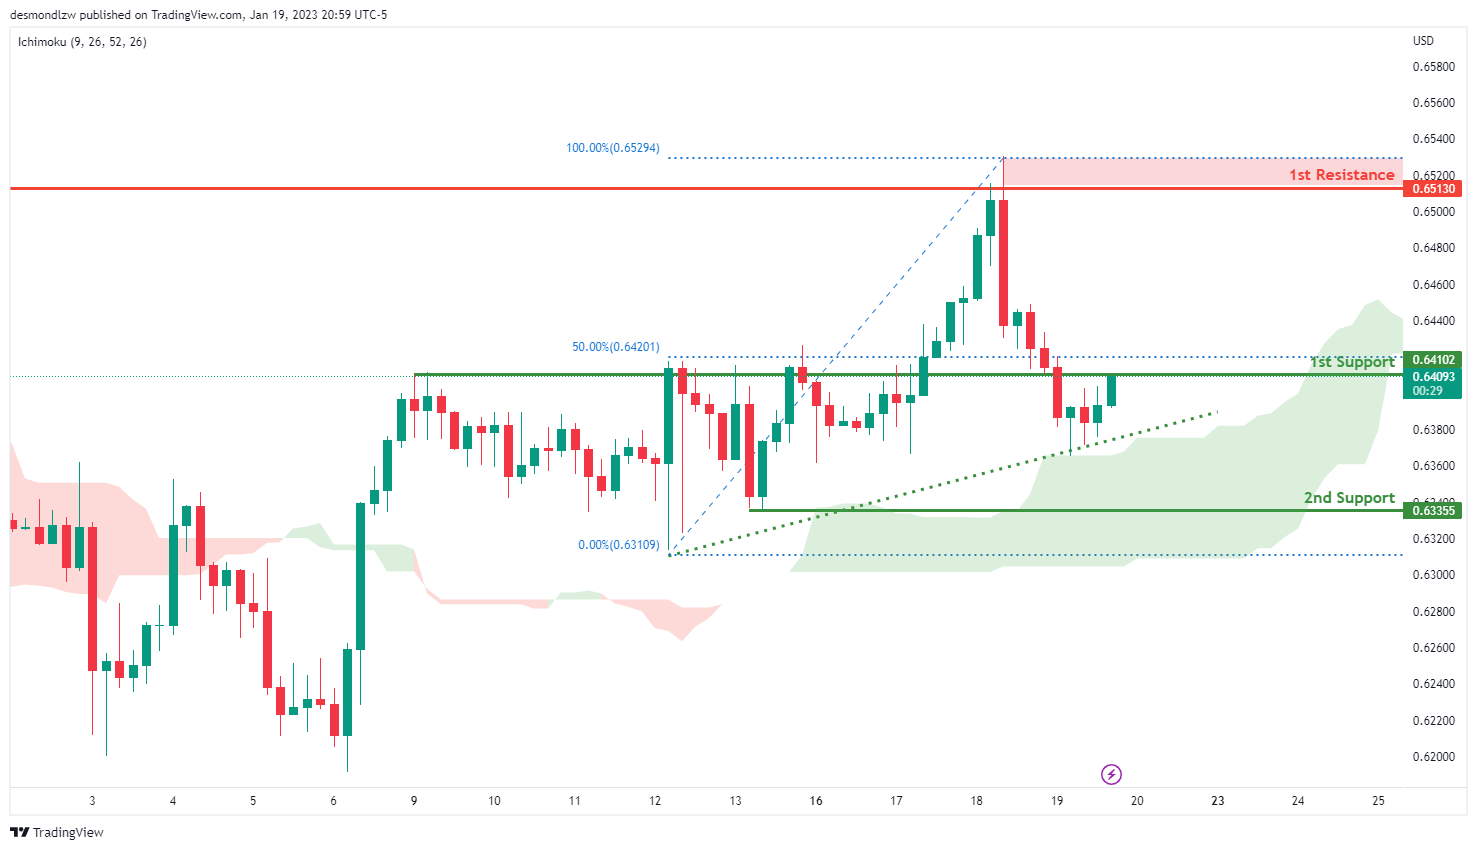
Looking at the H4 chart, we can see that the 1st support is at 0.64102 which is an overlap support where is in line with 50% Fibonacci line. If price breaks this level, we could see it drop to 2nd support is down at 0.63355. As the current price is above the Ichimoku cloud and there is an ascending trend line , which suggests the bullish momentum.
For the resistance, our 1st resistance is at 0.65130 which is a recent swing high resistance area.
Areas of consideration:
- H4 time frame, 1st resistance at 0.65130
- H4 time frame, 1st support at 0.64102
- H4 time frame, 2nd support at 0.63355
USD/CAD:
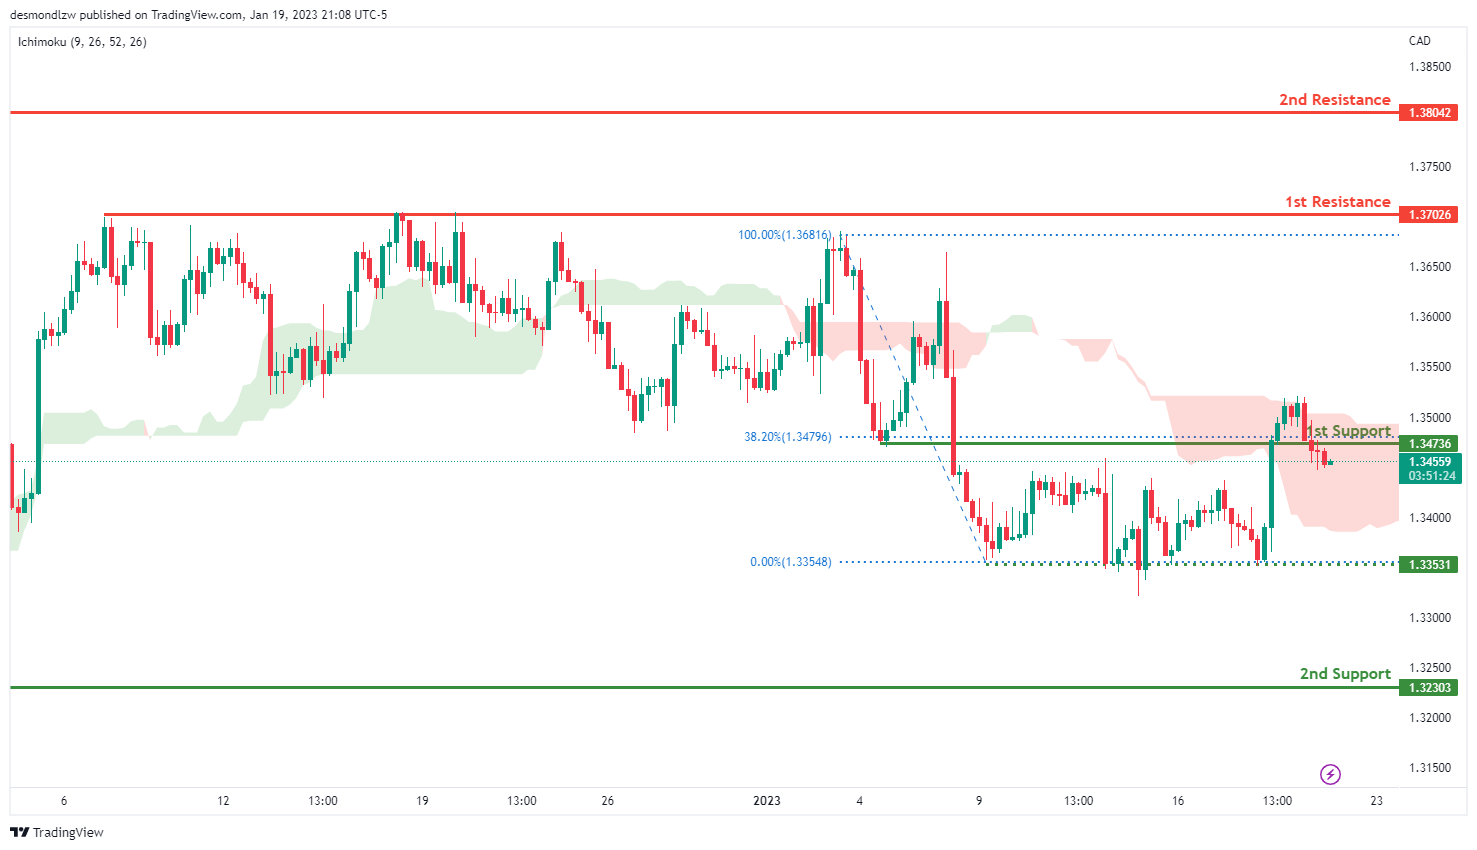
On the H4 chart, the 1st support is at 1.34736 which is an overlap support. The 1st support line also at 38.2% Fibonacci retracement. And the 2nd support 1.32303 which is the recent swing low .There is an intermediate support level at 1.33531.
In terms of resistance, the 1st resistance we can see is at 1.37026 which is the recent swing high. If the price breaks this level, it could go up to the 2nd resistance at 1.38042.
Areas of consideration:
- H4 time frame. 2nd resistance at 1.38069
- H4 time frame, 1st resistance at 1.37049
- H4 time frame, 1st support at 1.34736
- H4 time frame. Intermediate resistance at 1.33531
- H4 time frame, 2nd support at 1.32303
OIL:
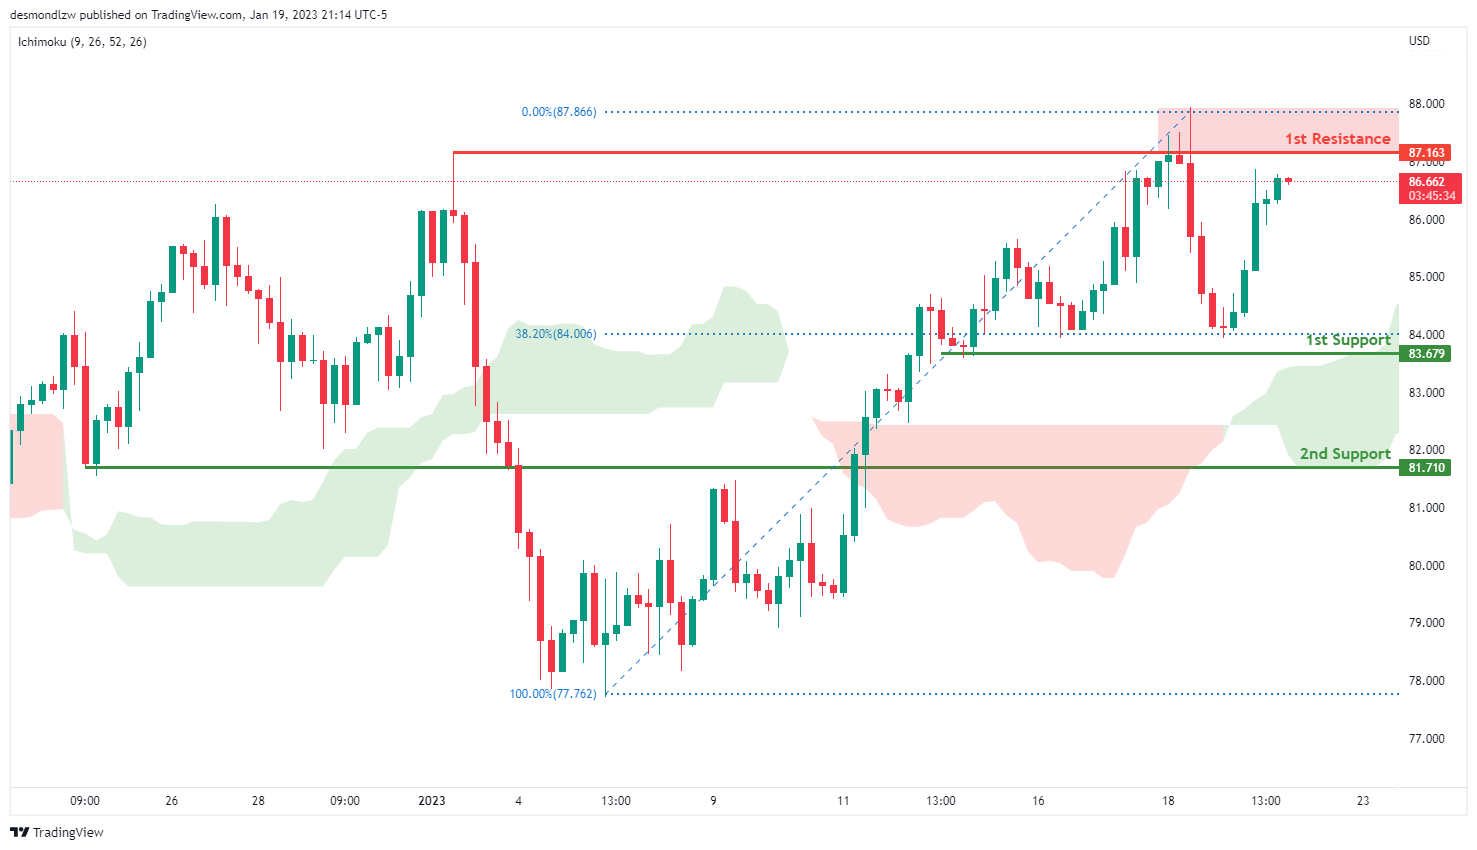
Looking at the H4 chart, we can see that the 1st resistance is at 87.163 which is an overlap area.
In terms of support, we can see our 1st support at 83.679 which is overlap support. It is also in line with 38.2% retracement. Breaking this level would trigger a further drop to our 2nd support at 81.710 /
Areas of consideration:
- H4 time frame, 1st resistance at 87.163
- H4 time frame,1st support at 83.679
- Hr time frame, 2nd support at 81.710
Dow Jones Industrial Average:
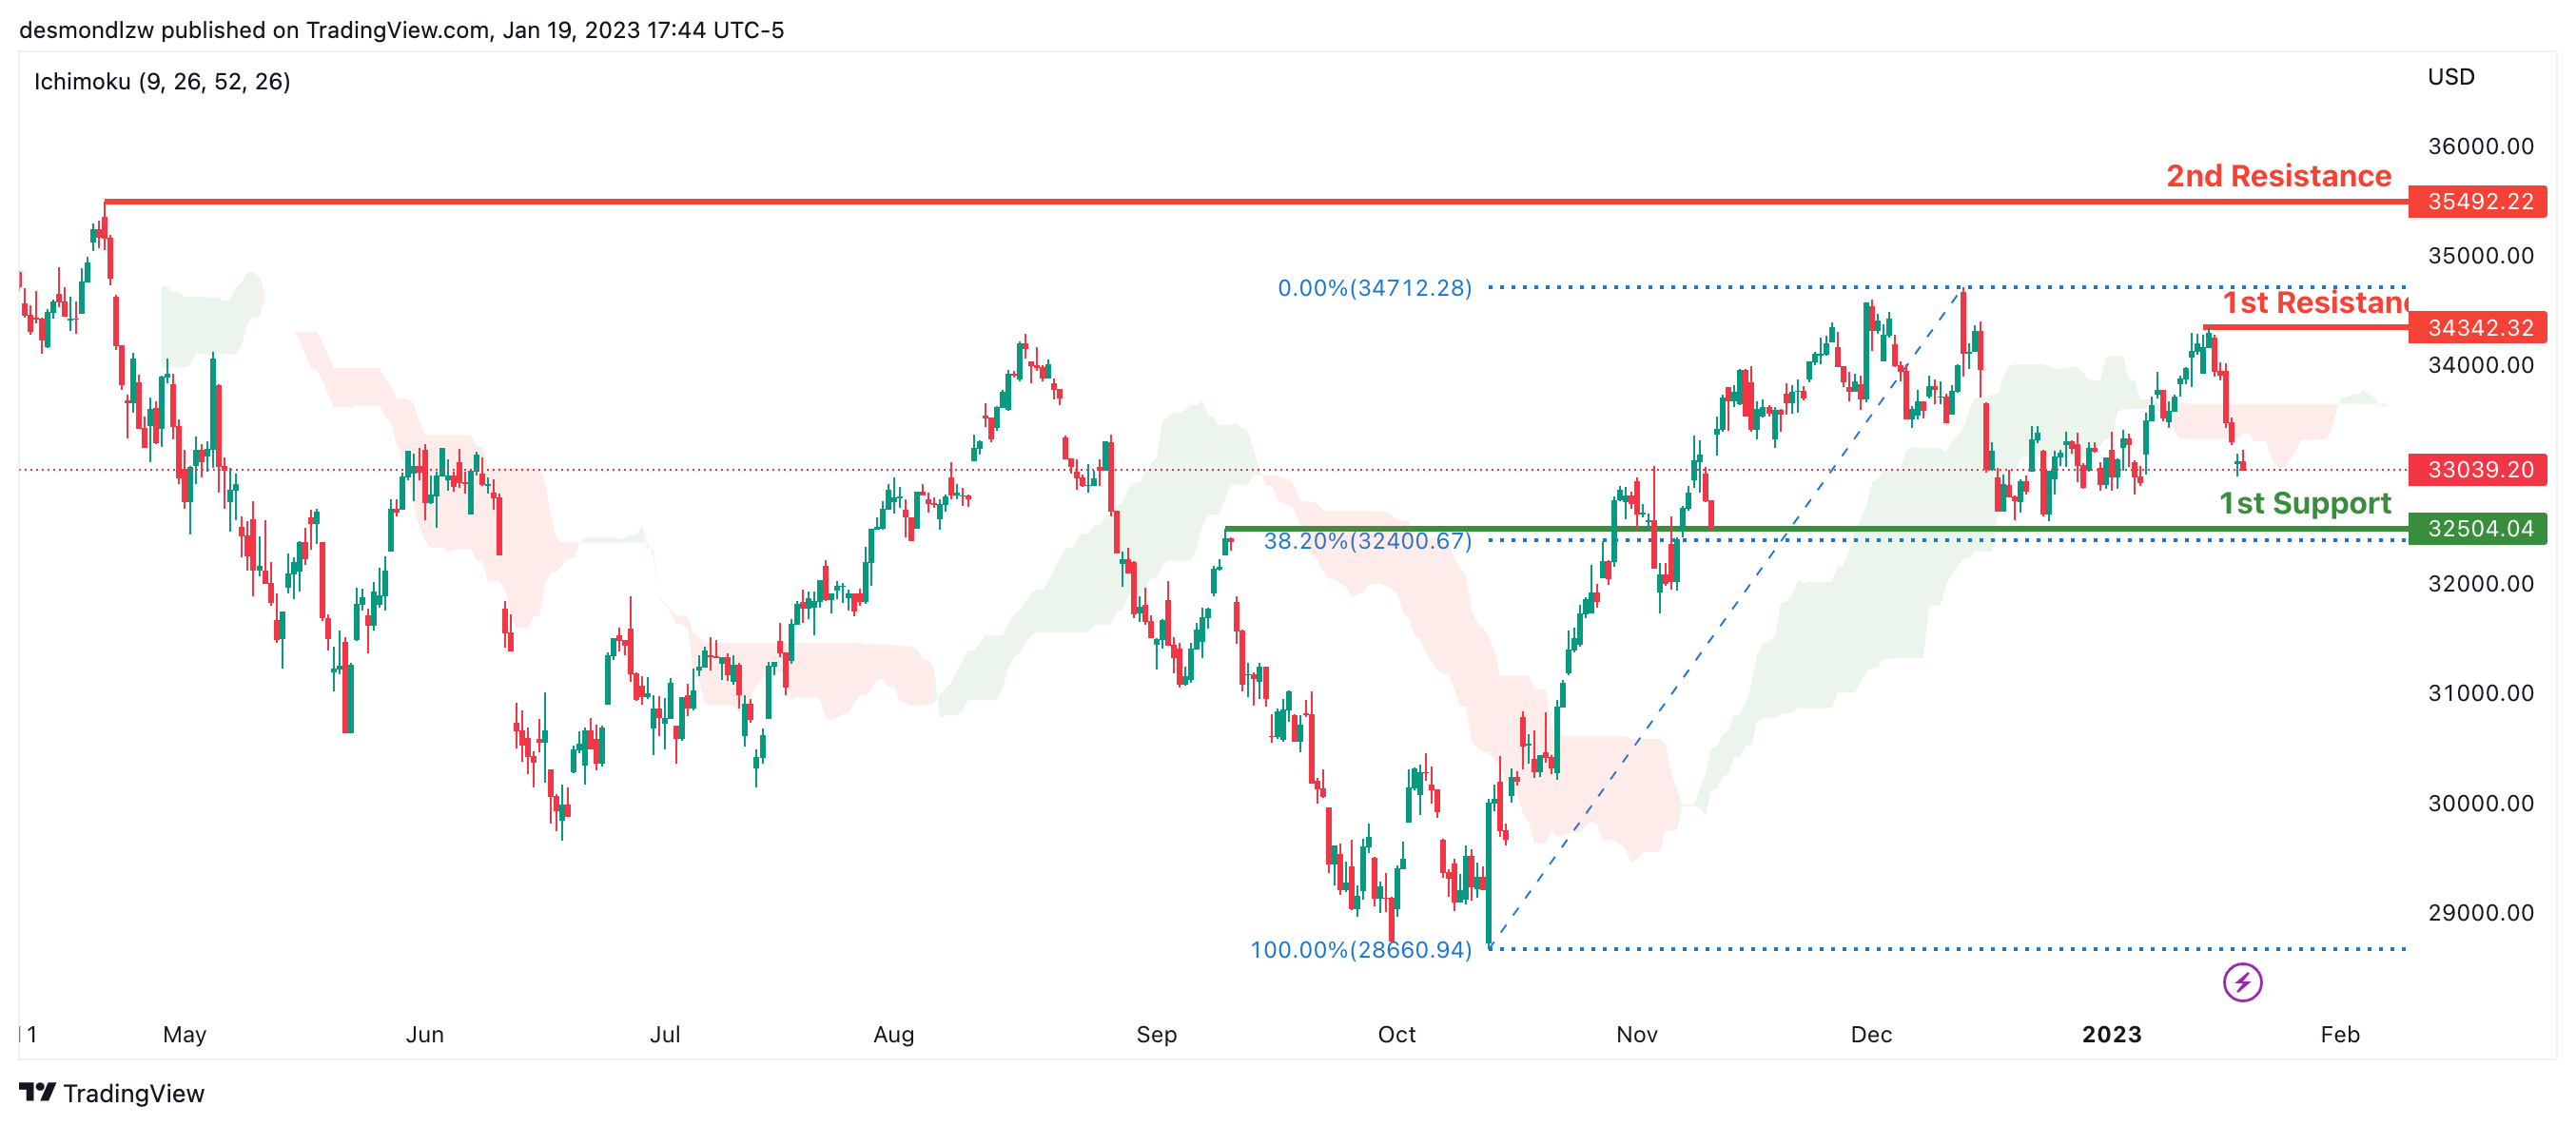
On the H4 chart, the overall bias for DJI is bullish. To add confluence to this, the price is crossing above the Ichimoku cloud which indicates a bullish market. If this bullish momentum continues, expect the price to possibly continue heading towards the 1st resistance line at 34712.28, where the recent swing high is. In an alternative scenario, price could possibly head back down towards the 1st support at 32581.97, slightly above where the 38.2% Fibonacci line is.
Areas of consideration:
- H4 time frame, 1st support at 32581.97
- H4 time frame, 1st Resistance at 34712.28
DAX:
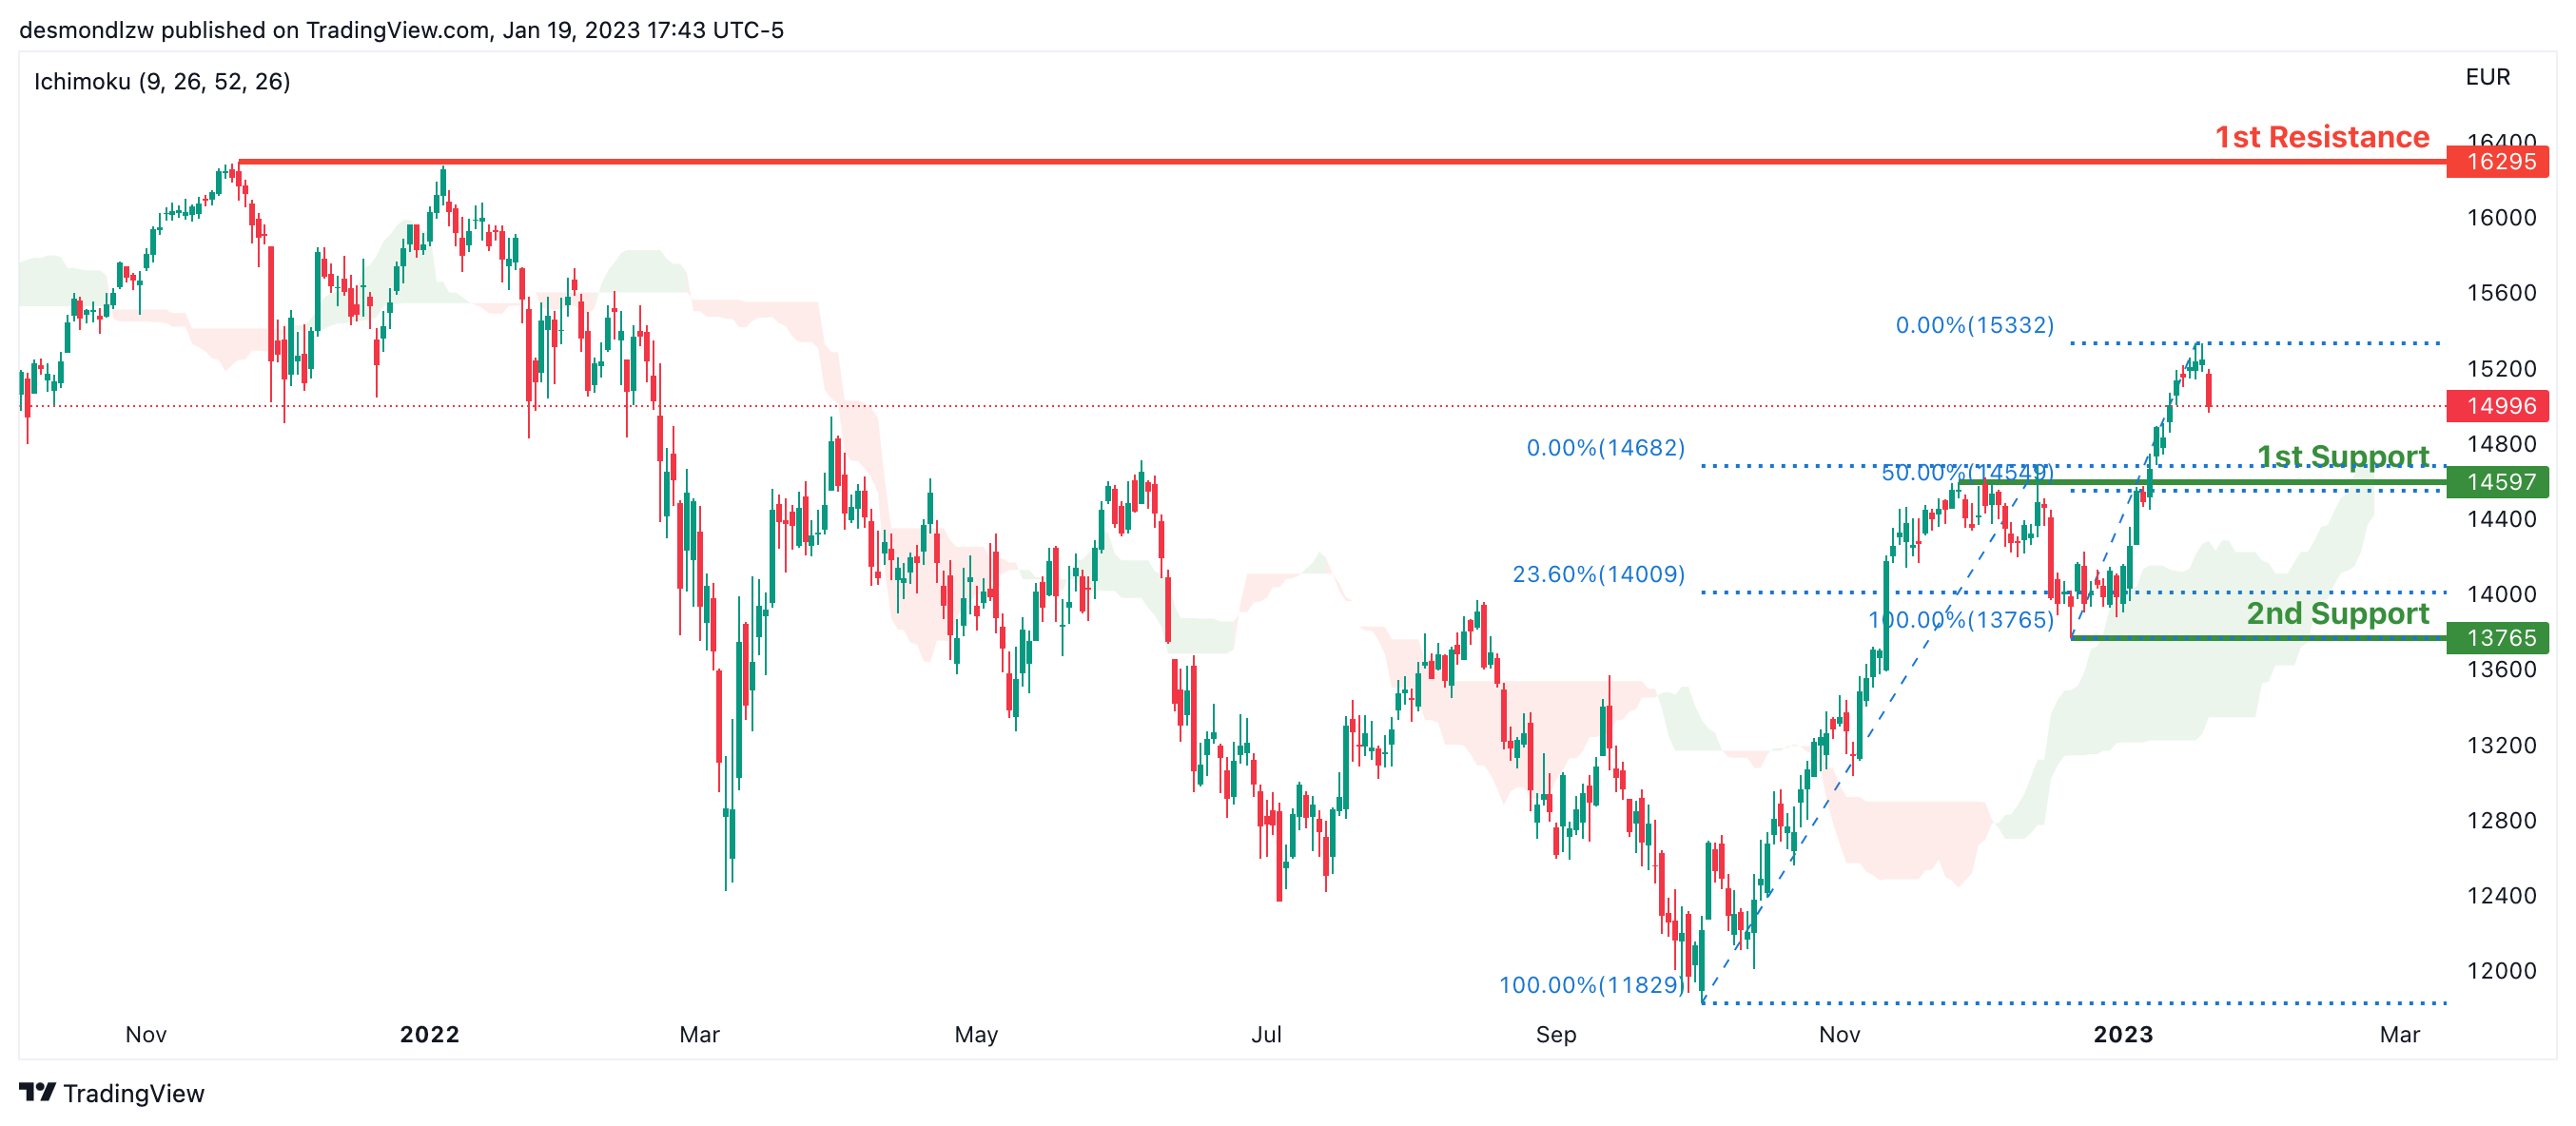
Looking at the Daily chart, my overall bias for DAX is bullish due to the current price crossing above the Ichimoku cloud, indicating a bullish market. If this bullish momentum continues, expect the price to possibly head towards the 1st resistance line at 16295, where the previous swing high is. In an alternative scenario, price could possibly head down to retest the 1st support at 14597, where the 50% Fibonacci line is.
Areas of consideration:
- H4 time frame, 1st resistance is at 16295
- H4 time frame, 1st support is at 14597
ETHUSD:
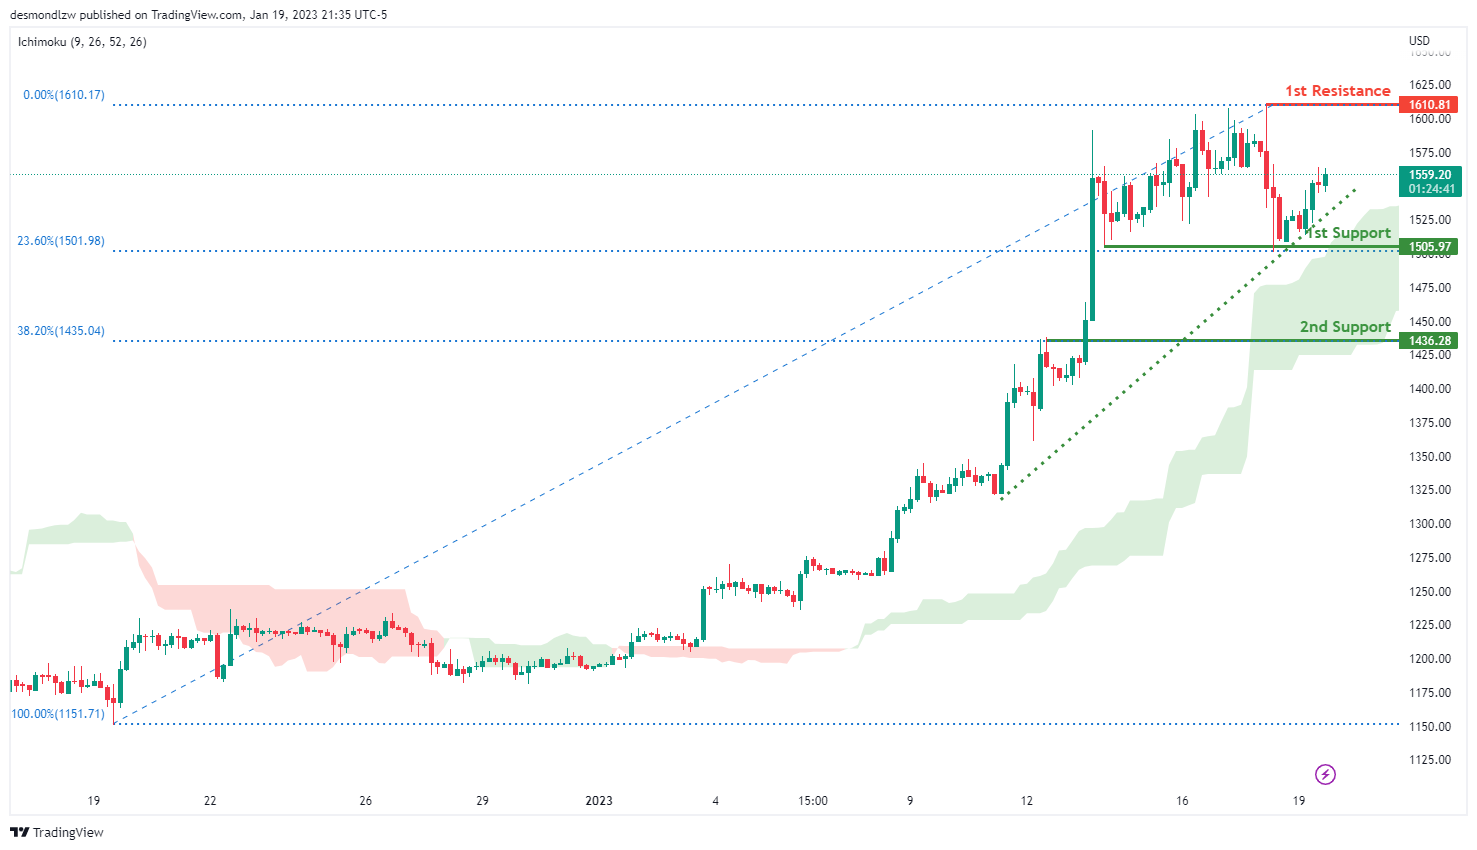
Looking at the H4 chart, my overall bias for ETHUSD is bullish due to the current price crossing above the Ichimoku cloud, indicating a bullish market. If this bullish momentum continues, expect the price move to the 1st support at 1505.97 which is recent overlap swing low. It is also in line with the 23.6% Fibonacci line And it may head to the 1st resistance at 1610.81 where the previous swing high is. In an alternative scenario, if the price break through the 1st support line, the price may further down to the 2nd support line 1433.59 where is 38.2% Fibonacci line is.
Areas of consideration:
- H4 time frame, 1st resistance of 1610.81
- H4 time frame, 1st support at 1505.97
- H4 time frame, 2nd support at 1433.59
BTCUSD:
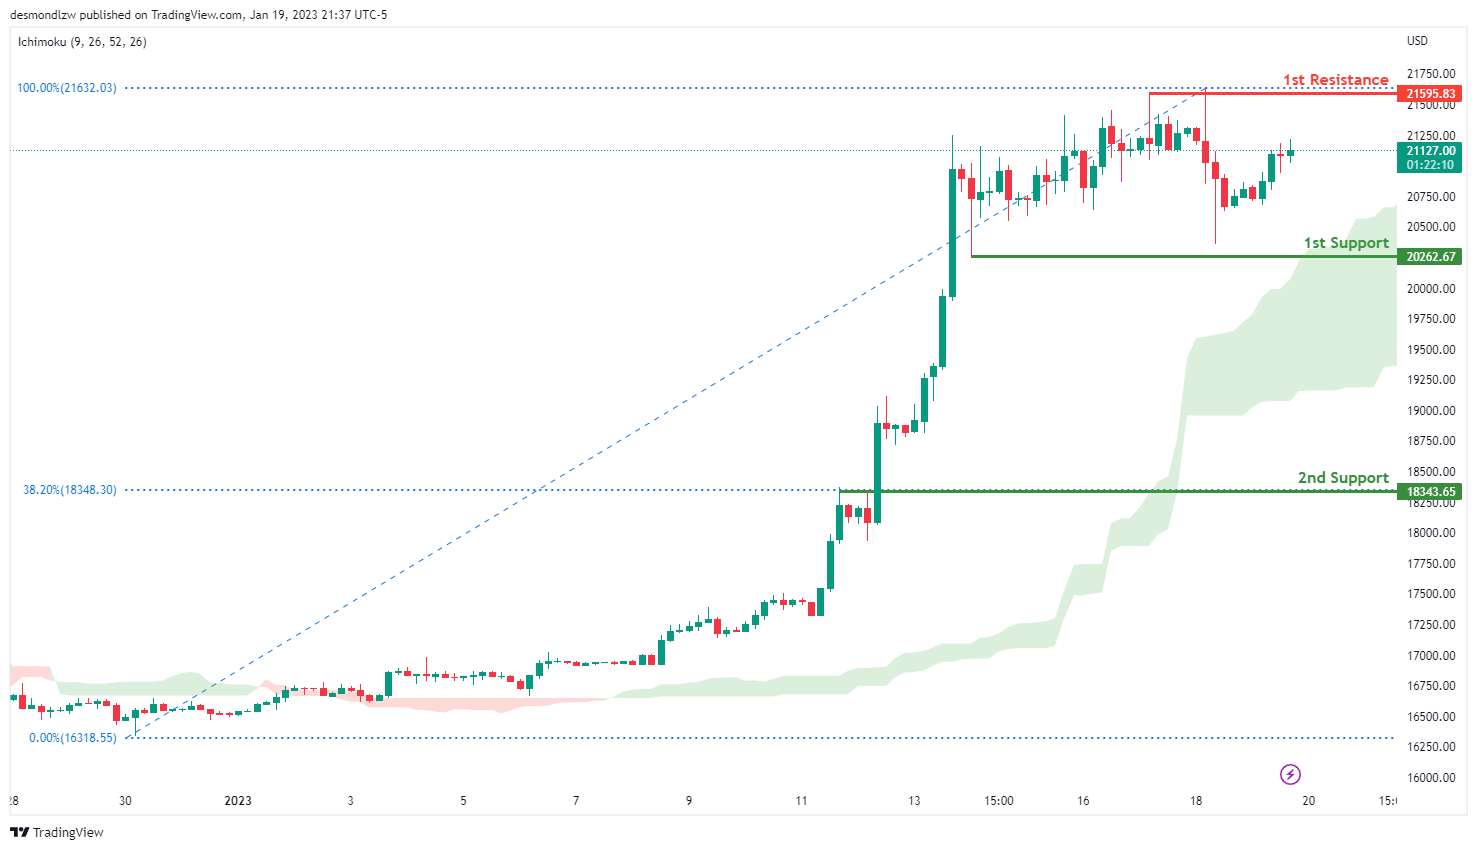
Looking at the H4 chart, my overall bias for BTCUSD is bullish due to the current price being above the Ichimoku cloud, indicating a bullish market. If this bullish momentum continues, expect the price to possibly break the 1st resistance at 21595.83 which is the recent swing high area. In an alternative scenario, the price could possibly head back down to retest the 1st support at 20262.67 .The 2nd support line is at 18343.65 where 100% Fibonacci projection and 38.2% Fibonacci rertracement are.
Areas of consideration:
- H4 time frame, 1st resistance 21595.83
- H4 time frame, 1st support at 20262.67
- H4 time frame, 2nd support at 18343.65
S&P 500:
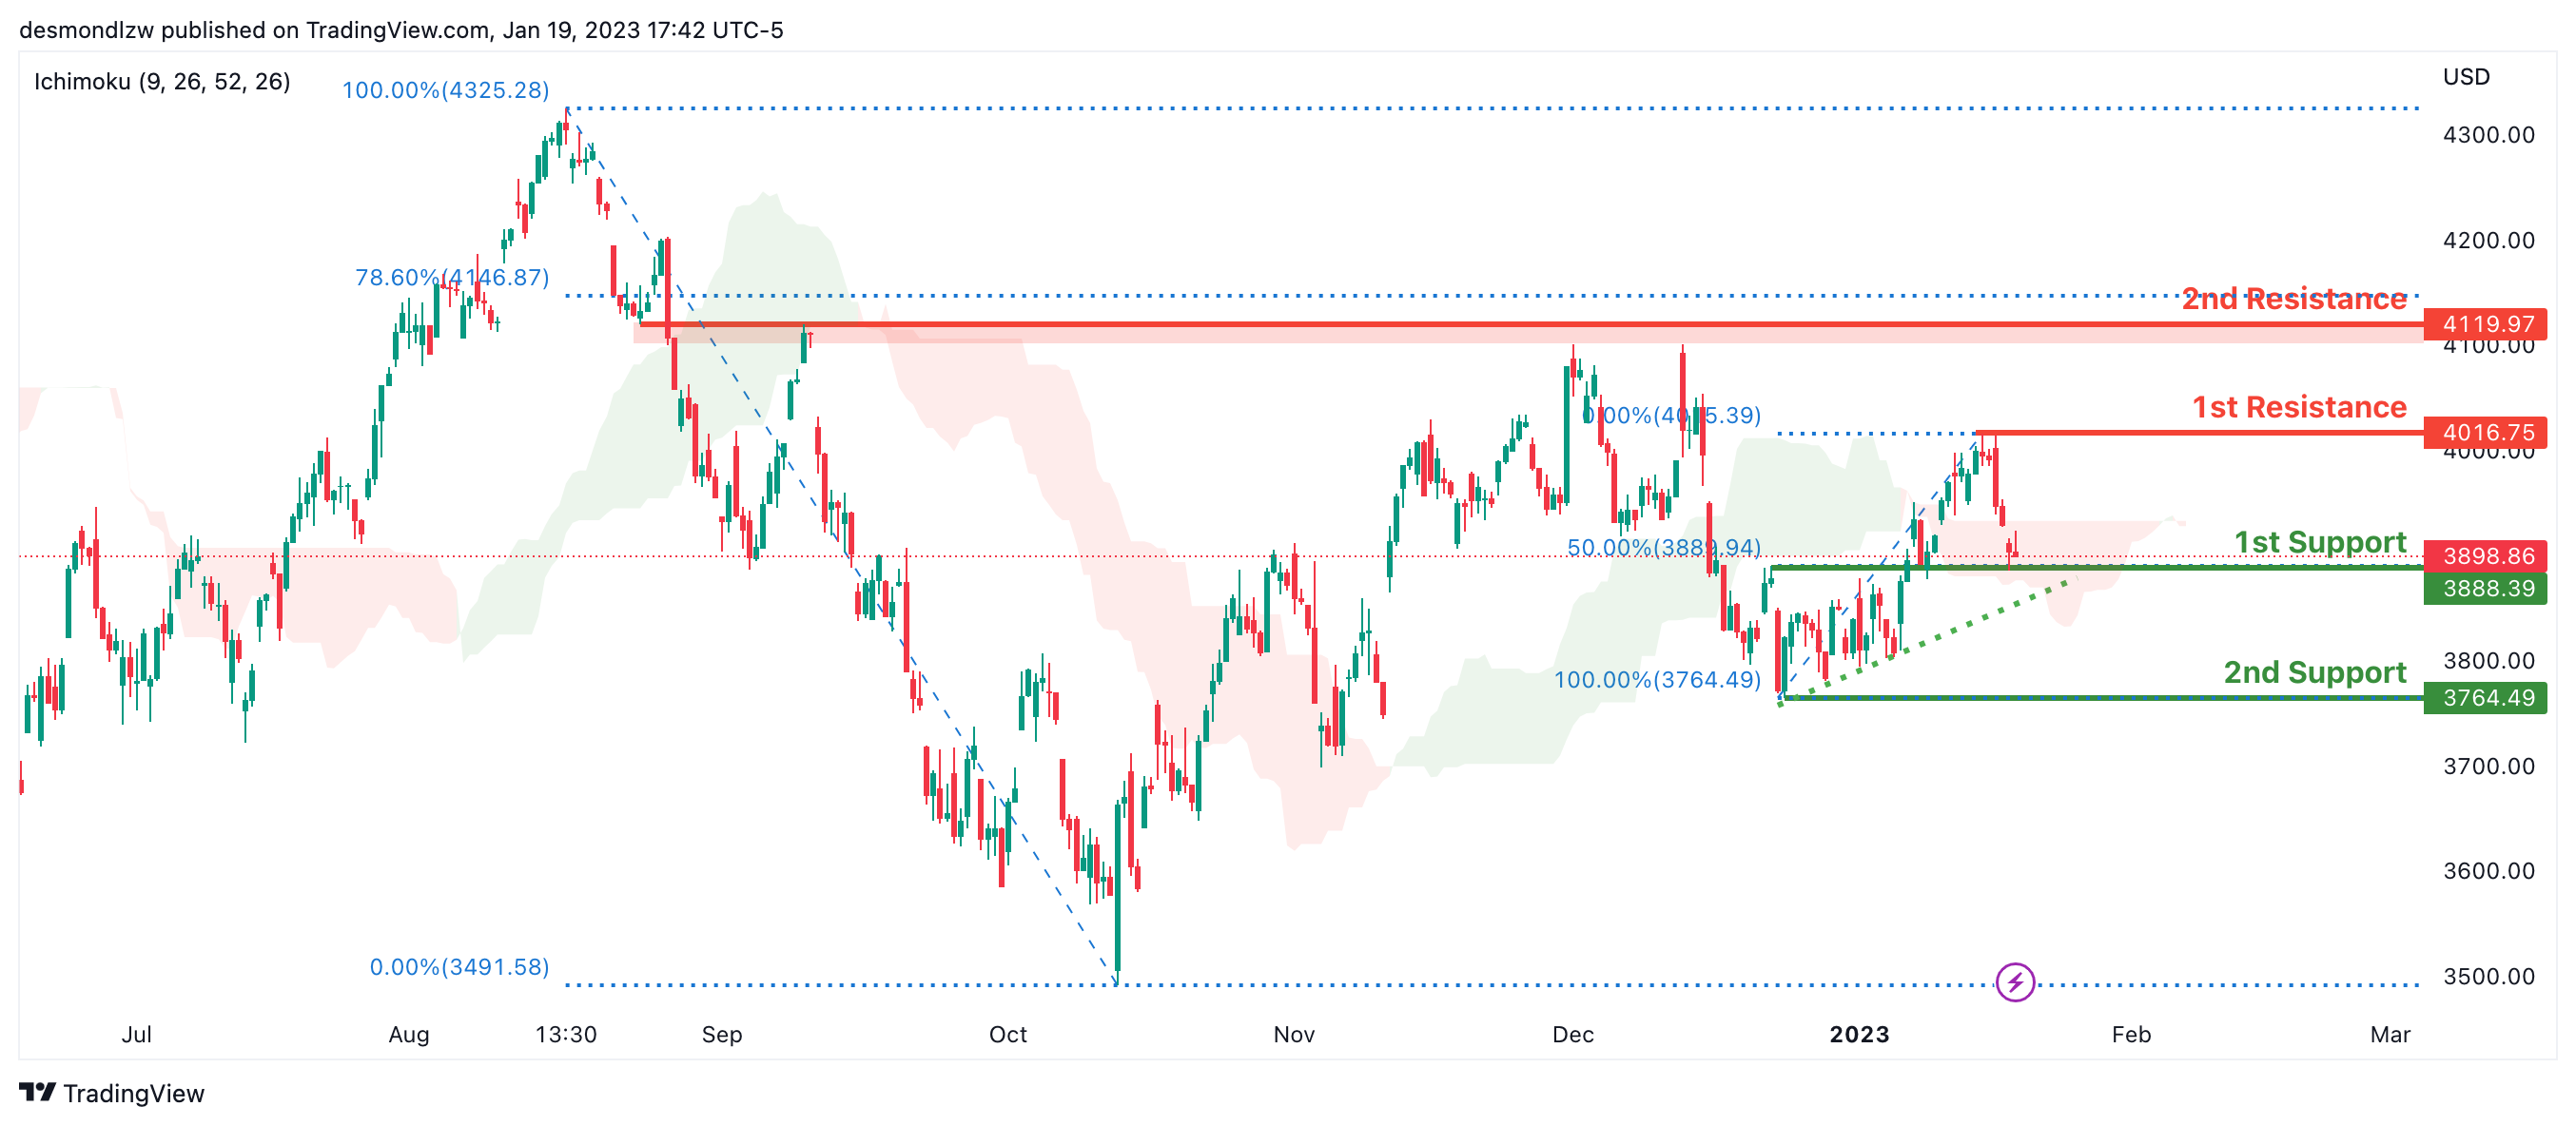
Looking at the H4 chart, my overall bias for S&P500 is bullish due to the current price being above the Ichimoku cloud, indicating a bullish market. If this bullish momentum continues, expect the price to continue heading towards the 1st resistance at 4119.97, where the 78.6% Fibonacci line is. In an alternative scenario, price could possibly head back down to break the 1st support at 3888.39, where the 50% Fibonacci line is, before heading towards the 2nd support at 3764.49, where the recent swing low is.
Areas of consideration:
- H4 time frame, 1st support at 3888.39
- H4 time frame, 2nd support at 3764.49
- H4 time frame, 1st resistance at 4119.97
USD/JPY Still At Risk of Additional Losses
Key Highlights
- USD/JPY started a fresh decline below the 130.00 zone.
- A major bearish trend line is forming with resistance near 131.00 on the 4-hours chart.
- EUR/USD could aim a fresh increase above the 1.0880 resistance.
- Bitcoin price is consolidating gains near $21,000.
USD/JPY Technical Analysis
The US Dollar started a fresh decline from well above 130.00 against the Japanese Yen. USD/JPY traded below the 129.50 support to enter a bearish zone.
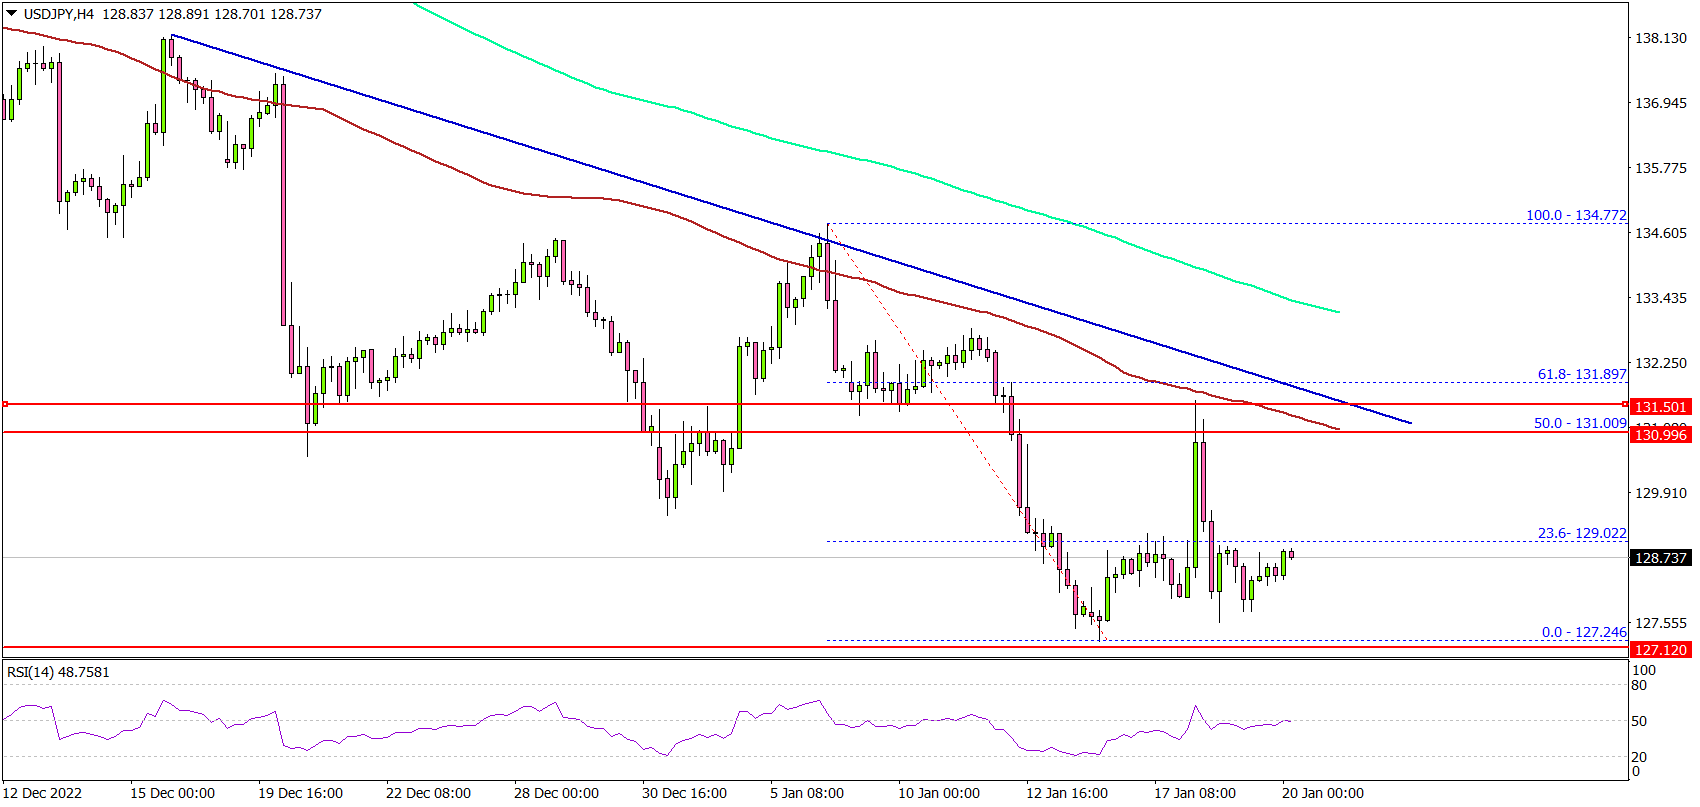
Looking at the 4-hours chart, the pair declined below the 129.20 level. It also settled below the 129.50 level, the 100 simple moving average (red, 4-hours) and the 200 simple moving average (green, 4-hours).
A low is formed near 127.24 and the pair is now consolidating losses. On the upside, an initial resistance is near the 129.00 level.
The next major resistance may perhaps be near 131.00 and the 100 simple moving average (red, 4-hours). There is also a major bearish trend line forming with resistance near 131.00 on the same chart.
A clear move above the 131.00 resistance might start a steady increase. In the stated case, USD/JPY could even surpass the 132.00 zone. The next key hurdle is near 133.50, above which the pair could climb towards the 134.80 resistance zone.
On the downside, there is a major support at 128.00. The next major support is near the 127.20 level. A downside break below the 127.20 zone might push the pair lower.
The next major support sits near the 126.50 level. Any more losses might open the doors for a move towards the 125.00 support zone.
Looking at EUR/USD, the pair is attempting an upside break above the 1.0880 and 1.0920 resistance levels.
Economic Releases
- US Existing Home Sales for Dec 2022 (MoM) - Forecast -5.4%, versus -7.7% previous.
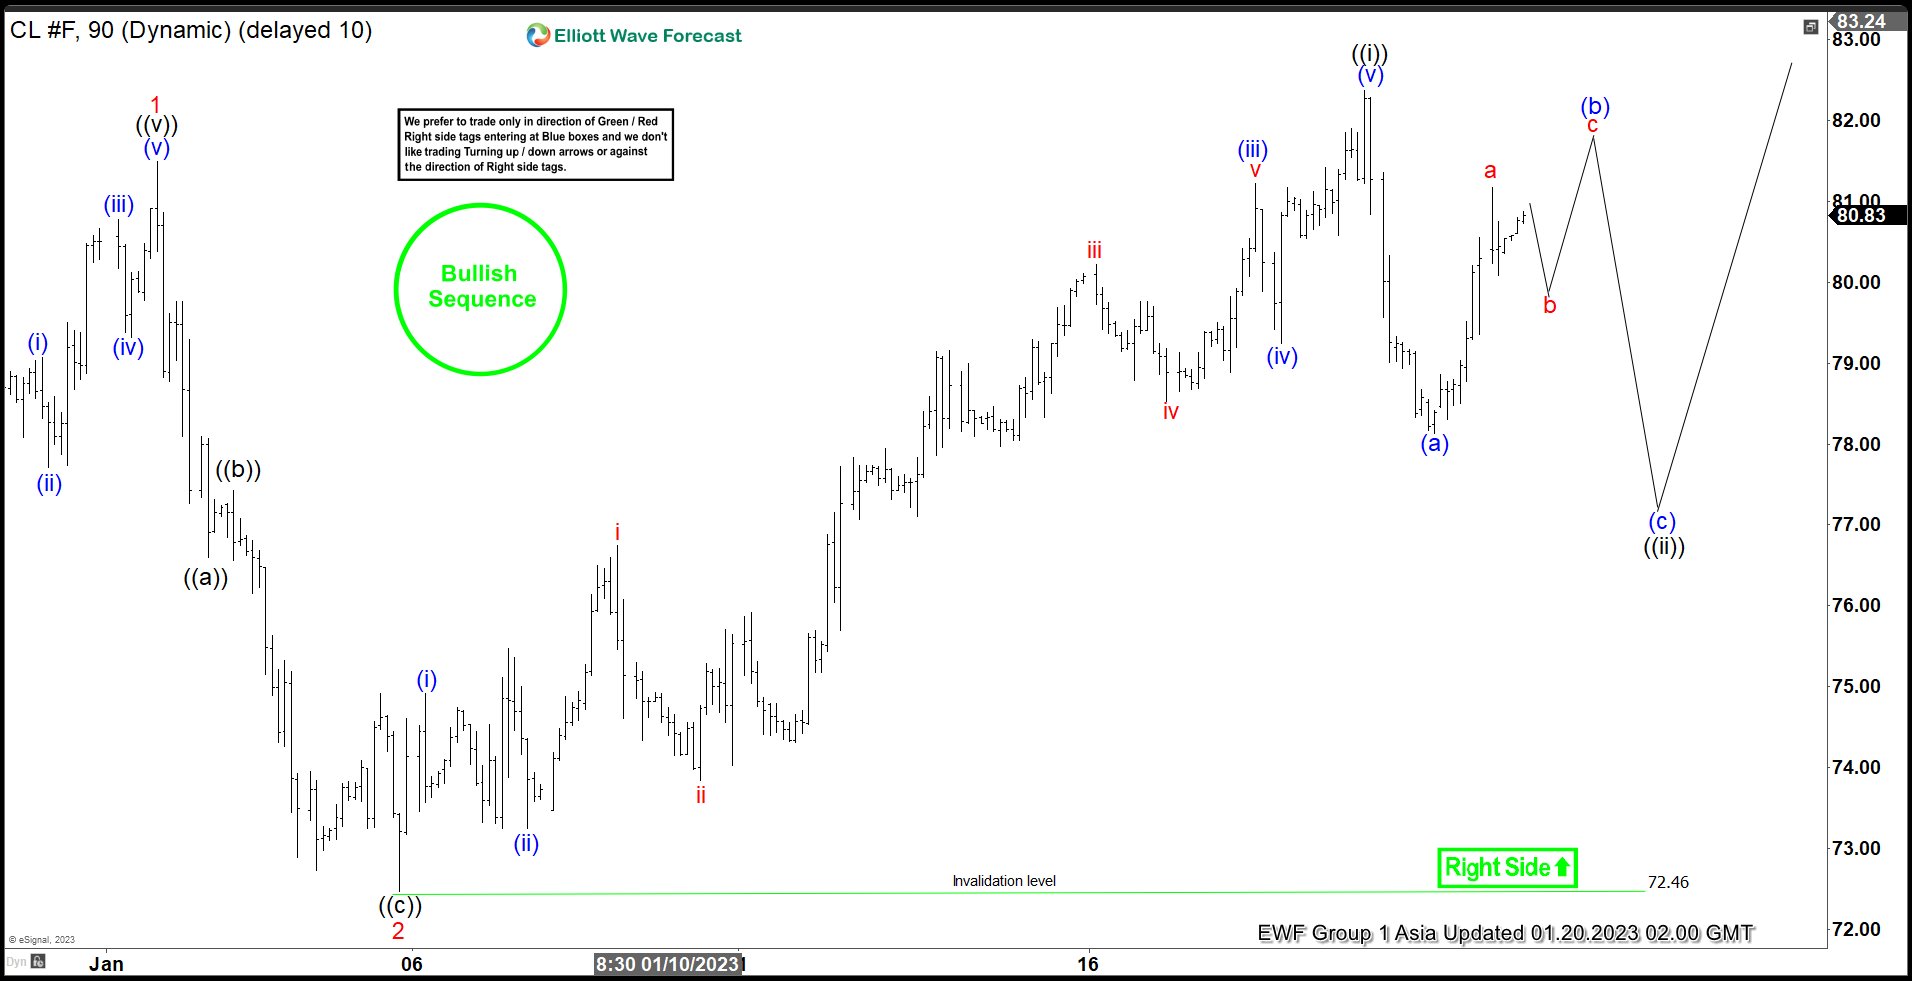
Elliott Wave Outlook Suggests Oil (CL) Should Continue Higher
Oil shows a bullish sequence from 12.10.2022 low favoring further upside. Rally from there is unfolding as a 5 waves impulse Elliott Wave structure. Up from 12.10.2022 low, wave 1 ended at 81.50 and pullback in wave 2 ended at 72.46. Internal subdivision of wave 2 took the form of a zigzag structure as the chart below shows. Down from wave 1, wave ((a)) ended at 76.6, wave ((b)) ended at 77.42, and wave ((c)) ended at 72.46. This completed wave 2 in higher degree. Wave 3 higher is in progress with internal subdivision as another impulse in lesser degree.
Up from wave 2, wave (i) ended at 74.91 and dips in wave (ii) ended at 73.25. Oil then extends higher in wave (iii) towards 81.23, and dips in wave (iv) ended at 79.25. Final leg higher wave (v) ended at 82.38 which completed wave ((i)). Wave ((ii)) pullback is in progress with internal subdivision as a zigzag structure. Down from wave ((i)), wave (a) ended at 78.13. Expect a wave (b) rally followed by another turn lower in wave (c) to complete wave ((ii)) before the rally in Oil resumes.
Oil 90 Minutes Elliott Wave Chart
Japan CPI core rose to 4% yoy in Dec, highest since 1981
Japan CPI core (all items ex-fresh food) accelerated from 3.7% yoy to 4.0% yoy in December, matched expectations. That's also the highest level in four decades since 1981. CPI core-core (all items ex-food and energy) also accelerated from 2.8% yoy to 3.0% yoy, hitting the highest level since 1991. Headline inflation rose from 3.8% yoy to 4.0% yoy.
Food prices jumped 7.4% while energy prices rose 15.2%. "The impact on CPI from higher energy prices was large in 2022 but contributions from food prices are now bigger," a government official said.
NZ BusinessNZ manufacturing unchanged at 47.2, further slippage expected in Q1
New Zealand BusinessNZ Performance of Manufacturing Index was unchanged at 47.2 in December. Looking at some details, production ticked up from 49.5 to 49.7. Employment rose from 46.9 to 48.8. New orders rose from 42.2 to 46.1. Finished stocks dropped from 55.5 to 50.1. Deliveries dropped from 49.6 to 48.4.
BNZ Senior Economist, Doug Steel stated that the latest PMI result "broadly fits with the clear decline we already expect for manufacturing GDP in Q4 with further slippage expected in Q1".