Sample Category Title
Silver Continues to Trade in a Range; Will There Be First-Mover Advantage?
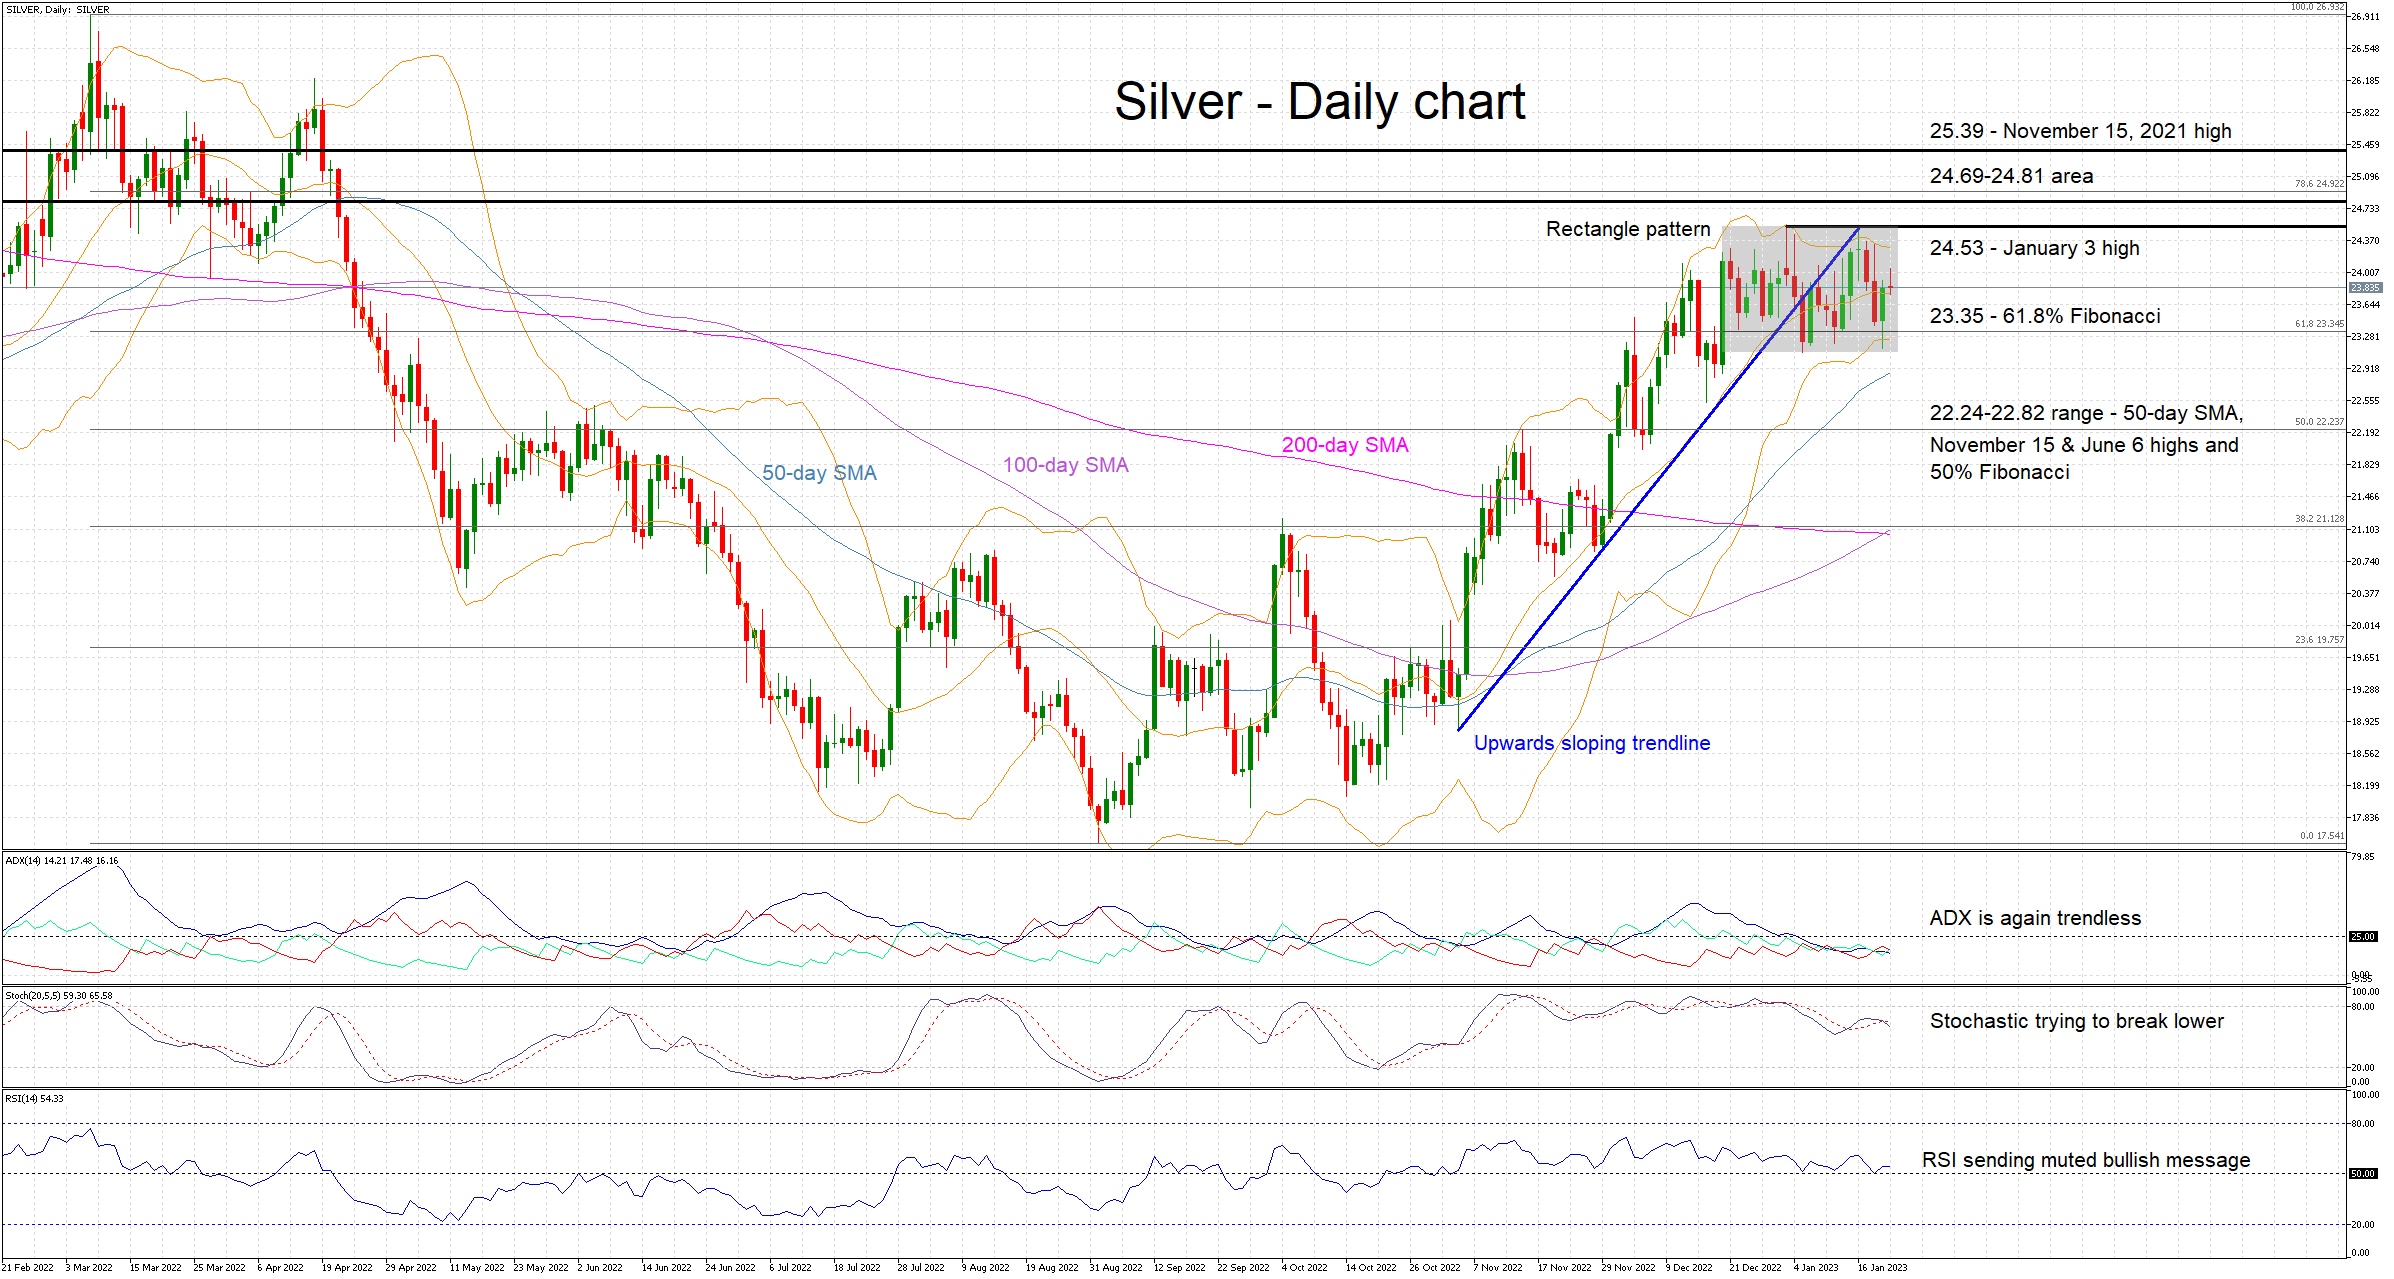
Silver continues to trade within the 23-25 well-observed range, contrary to gold’s fiery performance. This balance between buyers and sellers is reflected in the momentum indicators as both the Average Directional Movement Index (ADX) and RSI are mostly pointing to a trendless market. The stochastic oscillator is trying to stir the pot, but it needs a more decisive move to help draw meaningful conclusions.
In range-trading periods, the focus turns to "secondary" signals. In more detail, the convergence of the 100- and 200-day simple moving averages (SMAs) and the narrower Bollinger bands potentially point to an imminent move. The direction is unknown, but the rectangle pattern could offer some clues. This type of pattern favours upward breakouts, but it also experiences a high percentage of failed breakouts.
Should the bulls feel more confident, their initial target could come at the January 3 high of 24.53. The 24.69-24.81 area could then trouble the bulls, ahead of the November 15, 2021 high of 25.39.
On the other hand, the bears could face an initial obstacle at the 61.8% Fibonacci retracement of March 8 – September 1 downtrend of 23.35. Upon successfully breaking this level, they could be faced with the busier 22.24-22.82 area, crowded by the 50-day SMA, the November 15 and June 6 highs, and the 50% Fibonacci retracement.
To conclude, the present calm in the market points to an imminent “storm” with evidence slightly favouring the bulls at this juncture.
Pound Edges Lower as Retail Sales Slump
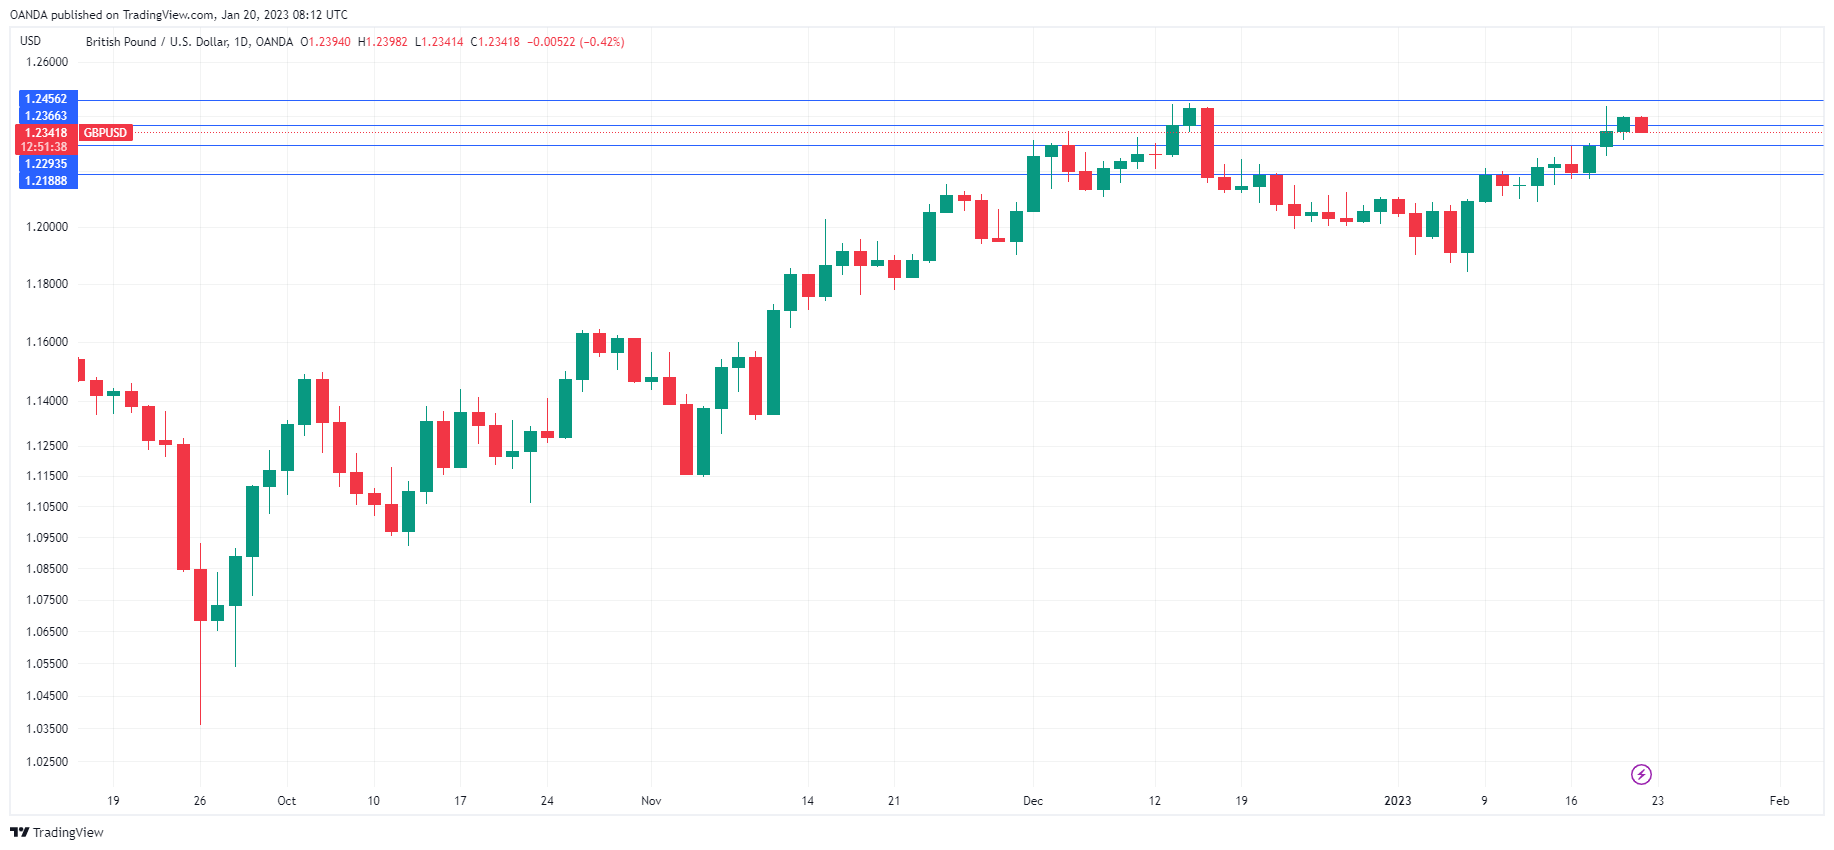
The British pound has edged lower on Friday. In the European session, GBP/USD is trading at 1.2360, down 0.27%.
Retail sales fall sharply
UK retail sales were dismal in December. The headline figure fell -1.0% m/m, missing the forecast of 0.5% and below the November read of -0.5%. The core rate declined by 1.1%, shy of the forecast of 0.4% and below the November reading of -0.3%. On an annualized basis, the numbers were downright ugly – headline retail sales came in at -5.8% and the core rate at -6.1%, which was worse than November and below the estimates.
Any hopes for a surge in spending due to Christmas were dashed, as consumers cut back due to the cost-of-living crisis. Inflation has eased a bit but remains in double digits, and consumers are expected to hold tight to the purse strings, as food and energy prices remain high and wages have been eroded by inflation. Consumer confidence remains in deep-freeze, with GfK Consumer Confidence falling to -45 in December, down from -42 in November and shy of the consensus of -40.
Weak consumer spending and confidence points to a struggling economy, but the Bank of England has little choice but to continue raising rates in order to curb inflation. This will be a slow process, with the BoE projecting that inflation will fall to 5% late in the year.
The Federal Reserve enters a 2-week blackout period after today, ahead of the rate meeting on February 1st. This means that public comments or interviews from Fed officials will be sharply curtailed. This made Fed member Brainard’s comments on Thursday all the more important. Brainard sounded hawkish, saying that rates needed to remain high even with signs that inflation was starting to ease. The Fed dot plot indicates that rates will peak at 5.1%, while the markets have priced a peak at around 4.75%. We’ll hear from Fed members Harker and Waller later today.
GBP/USD Technical
- 1.2352 is a weak resistance line, followed by 1.2455
- There is support at 1.2255 and 1.2179
GBPJPY Bounces Off Uptrend Line But Momentum is Weak
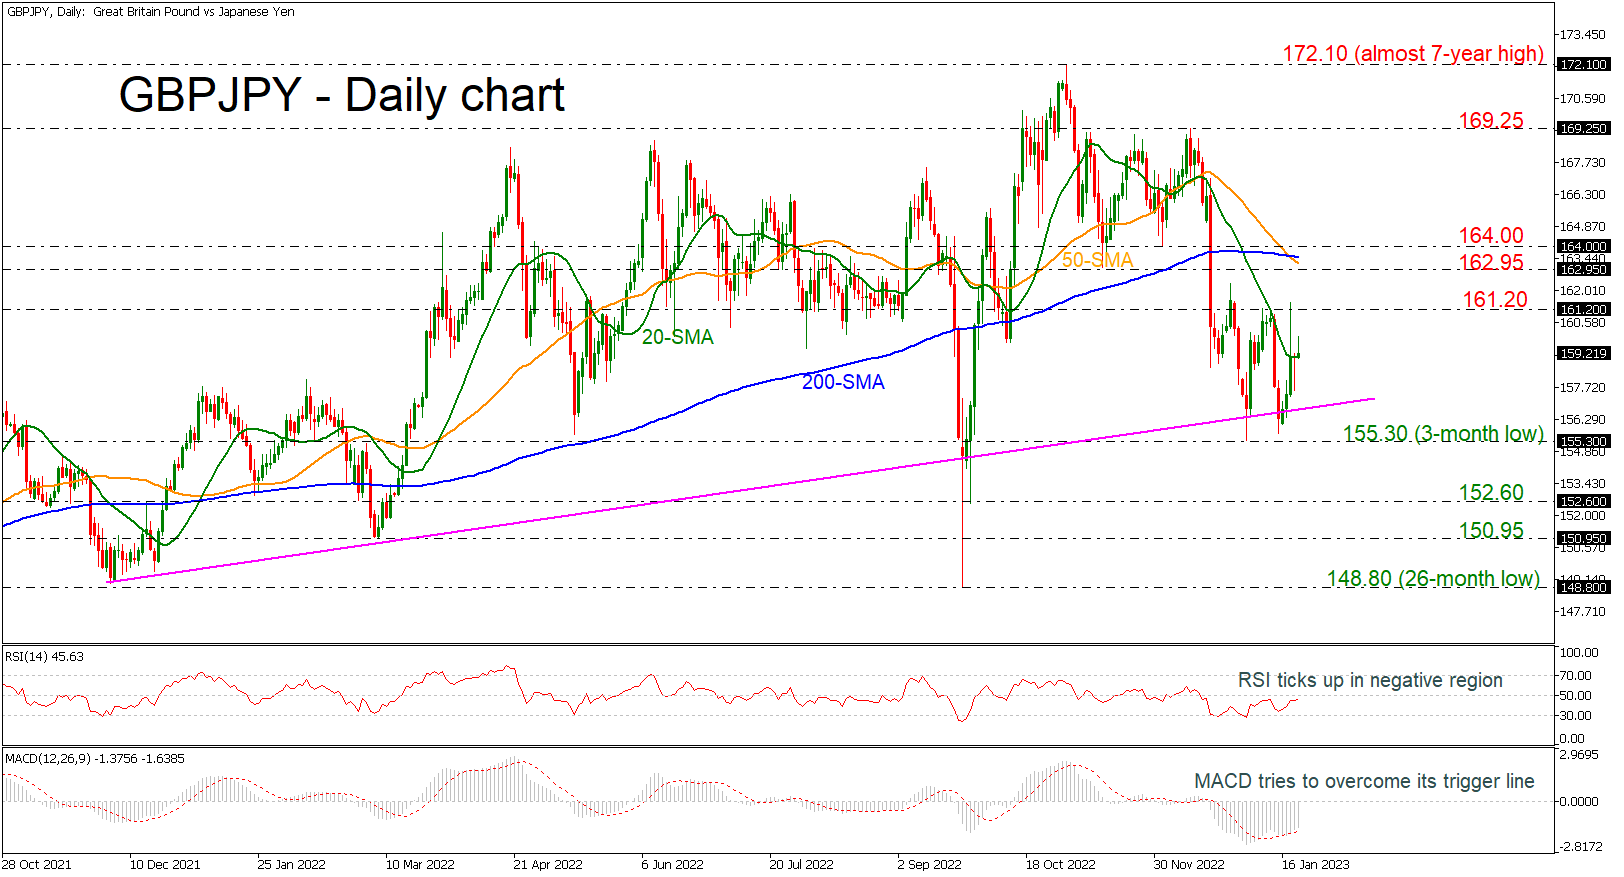
GBPJPY rebounded off the long-term ascending trend line and near the three-month low of 155.30. The price is currently trying to surpass the 20-day simple moving average (SMA) and the technical oscillators are confirming an upside movement. The RSI is ticking marginally up in the negative territory, while the MACD is surpassing its trigger line below the zero level.
Should GBPJPY make another run higher, it’s likely to meet resistance at 161.20 as this level has strongly capped prices since late December. A successful break above this key resistance area would open the way for the death cross between the 50- and the 200-day SMAs around 162.95. Above that, the pair needs to overcome another handle at 164.00.
If the soft positive momentum fails to hold and prices turn lower, the ascending trend line at 156.70 is the nearest support that could halt steeper declines. A potentially more important support, though, is the three-month trough of 155.30. If breached, it would shift the focus to the downside and prices would slip towards the 152.60 support.
In the bigger picture, GBPJPY would need to make a sustained climb above the bearish crossover in order for the short-term outlook to become convincingly bullish.
USDCAD Battles With 50-day SMA
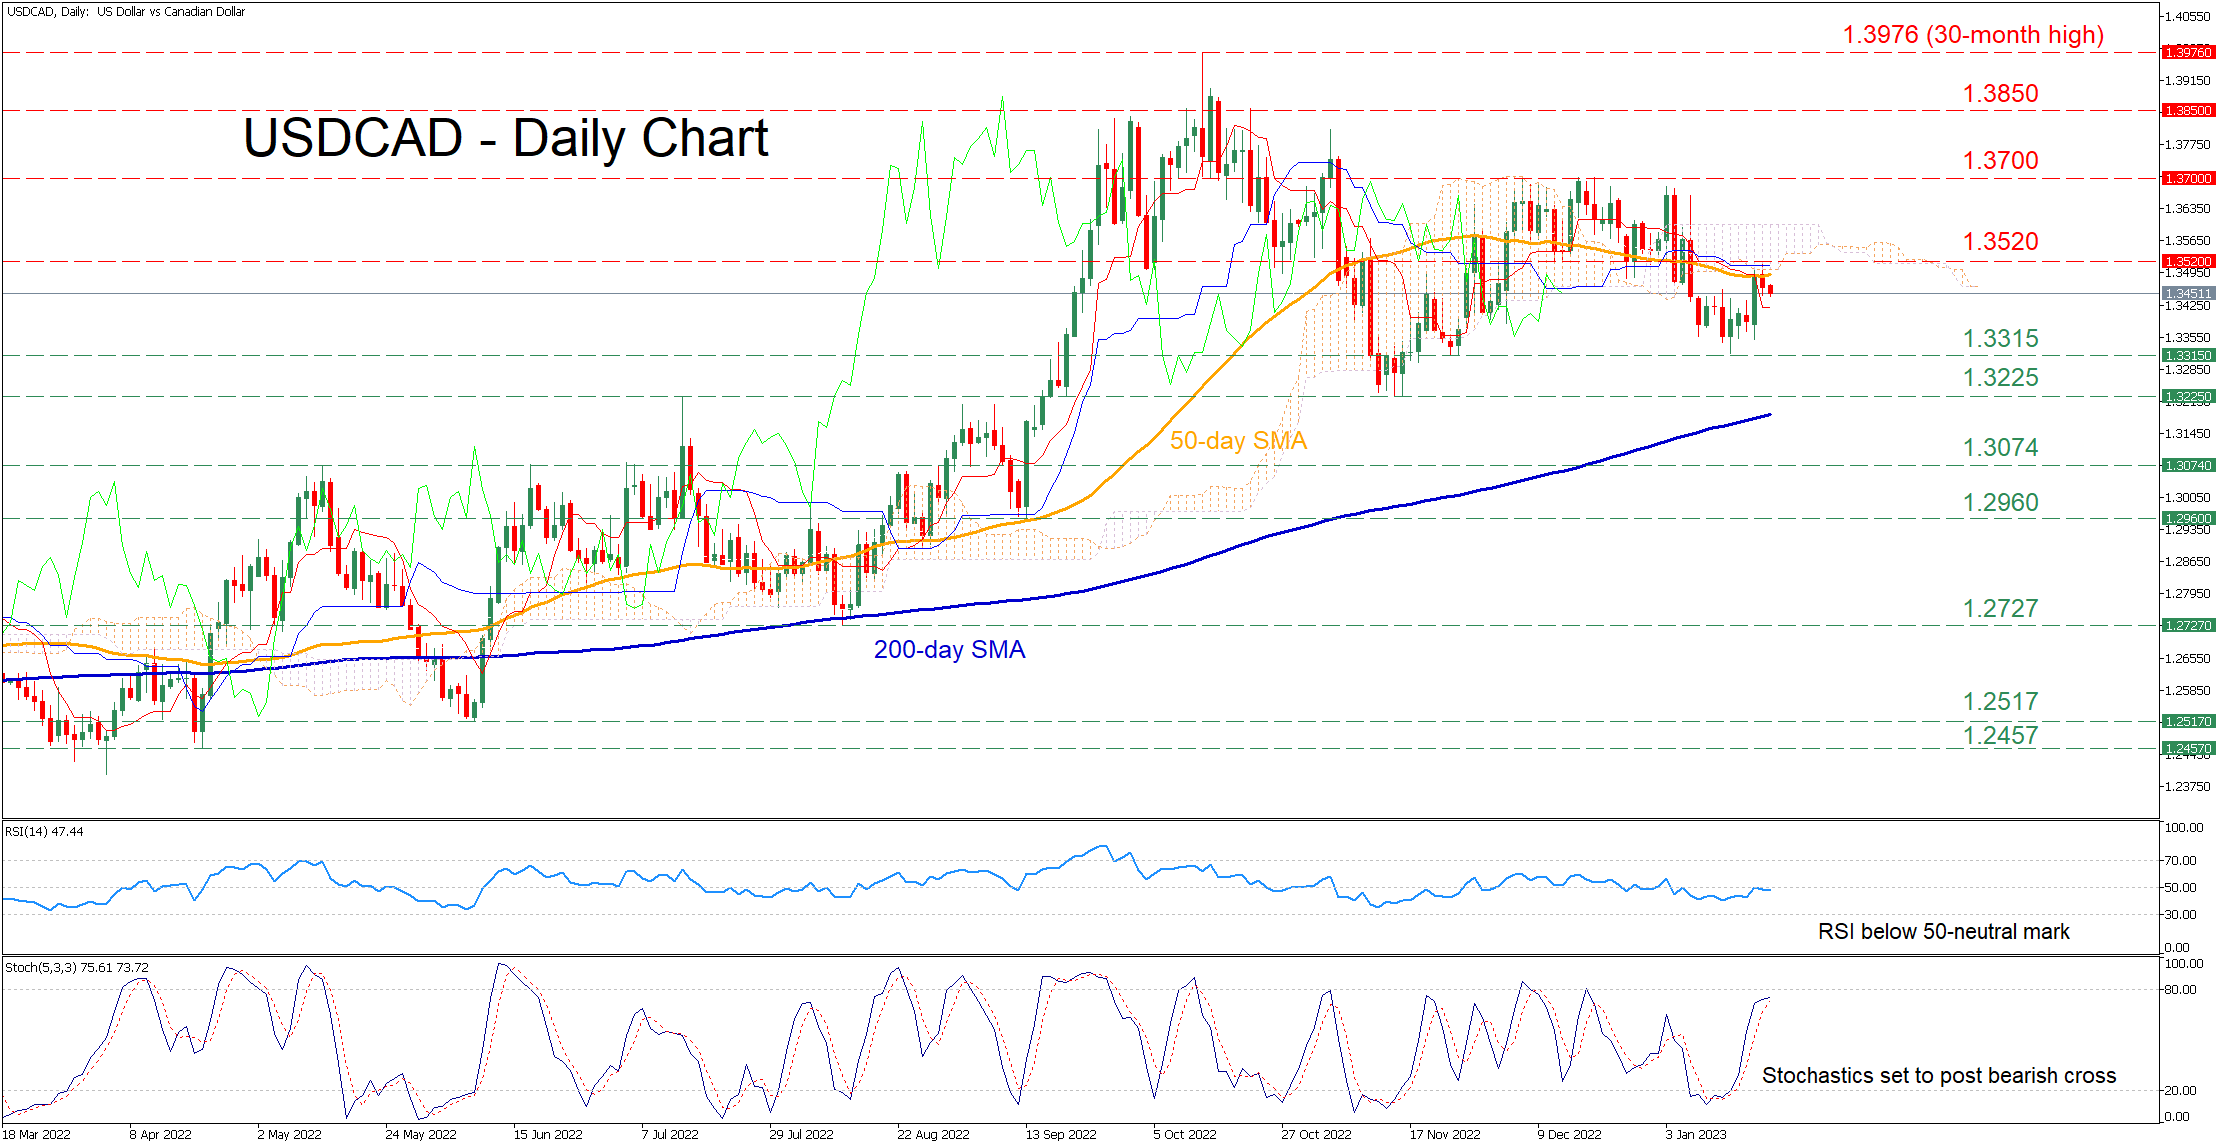
USDCAD had been in an uptrend since March, posting a fresh 30-month high of 1.3976 before experiencing a downside correction. In the short-term, the pair attempted to edge higher after breaking above its sideways pattern, but its advance got rejected at the 50-day simple moving average (SMA).
The momentum indicators currently suggest that near-term risks remain tilted to the downside. Specifically, the RSI has failed to cross above the 50-neutral mark, while the stochastic oscillator is set to post a bearish cross.
Should buying pressures persist, the recent low of 1.3315 could act as immediate support. Violating that zone, the price could test the November bottom of 1.3225. If that floor collapses, the bears may aim for 1.3074 before the 1.2960 support region comes under examination.
Alternatively, if the price manages to cross above the 50-day SMA, initial resistance could be met at the 1.3520 hurdle, which overlaps with the lower boundary of the Ichimoku cloud. Piercing through that wall, the pair might ascend towards 1.3700 or higher to challenge the 1.3850 barrier. A break above the latter could set the stage for the 30-month high of 1.3976.
In brief, USDCAD appears to be held down by the 50-day SMA. Therefore, a successful break above that zone could trigger a moderate rally to the upside.
EUR/USD Pair is Currently Consolidating Gains Near 1.0830
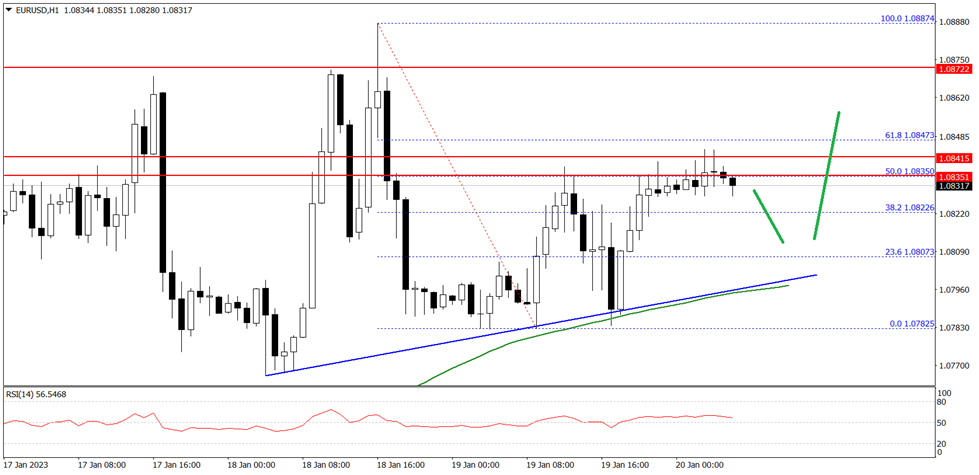
The Euro started a fresh increase from the 1.0770 zone against the US Dollar. The EUR/USD pair gained pace above the 1.0800 to move into a positive zone.
The pair even traded above the 1.0820 level and the 50 hourly simple moving average. It is currently consolidating gains near the 1.0830. An immediate resistance is near the 1.0840 level.
The first major resistance is near the 1.0850 level. A break above the 1.0850 resistance level could start another increase. In the stated case, it could rise towards the 1.0920 resistance.
Conversely, the pair might start another decline below 1.0820 on FXOpen. The next key support is near 1.0800 and a connecting bullish trend line on the hourly chart, below the pair could drop towards the 1.0770 level. Any more losses might send the pair towards the 1.0725 level in the near term.
Dow Jones 30 Breaks Support
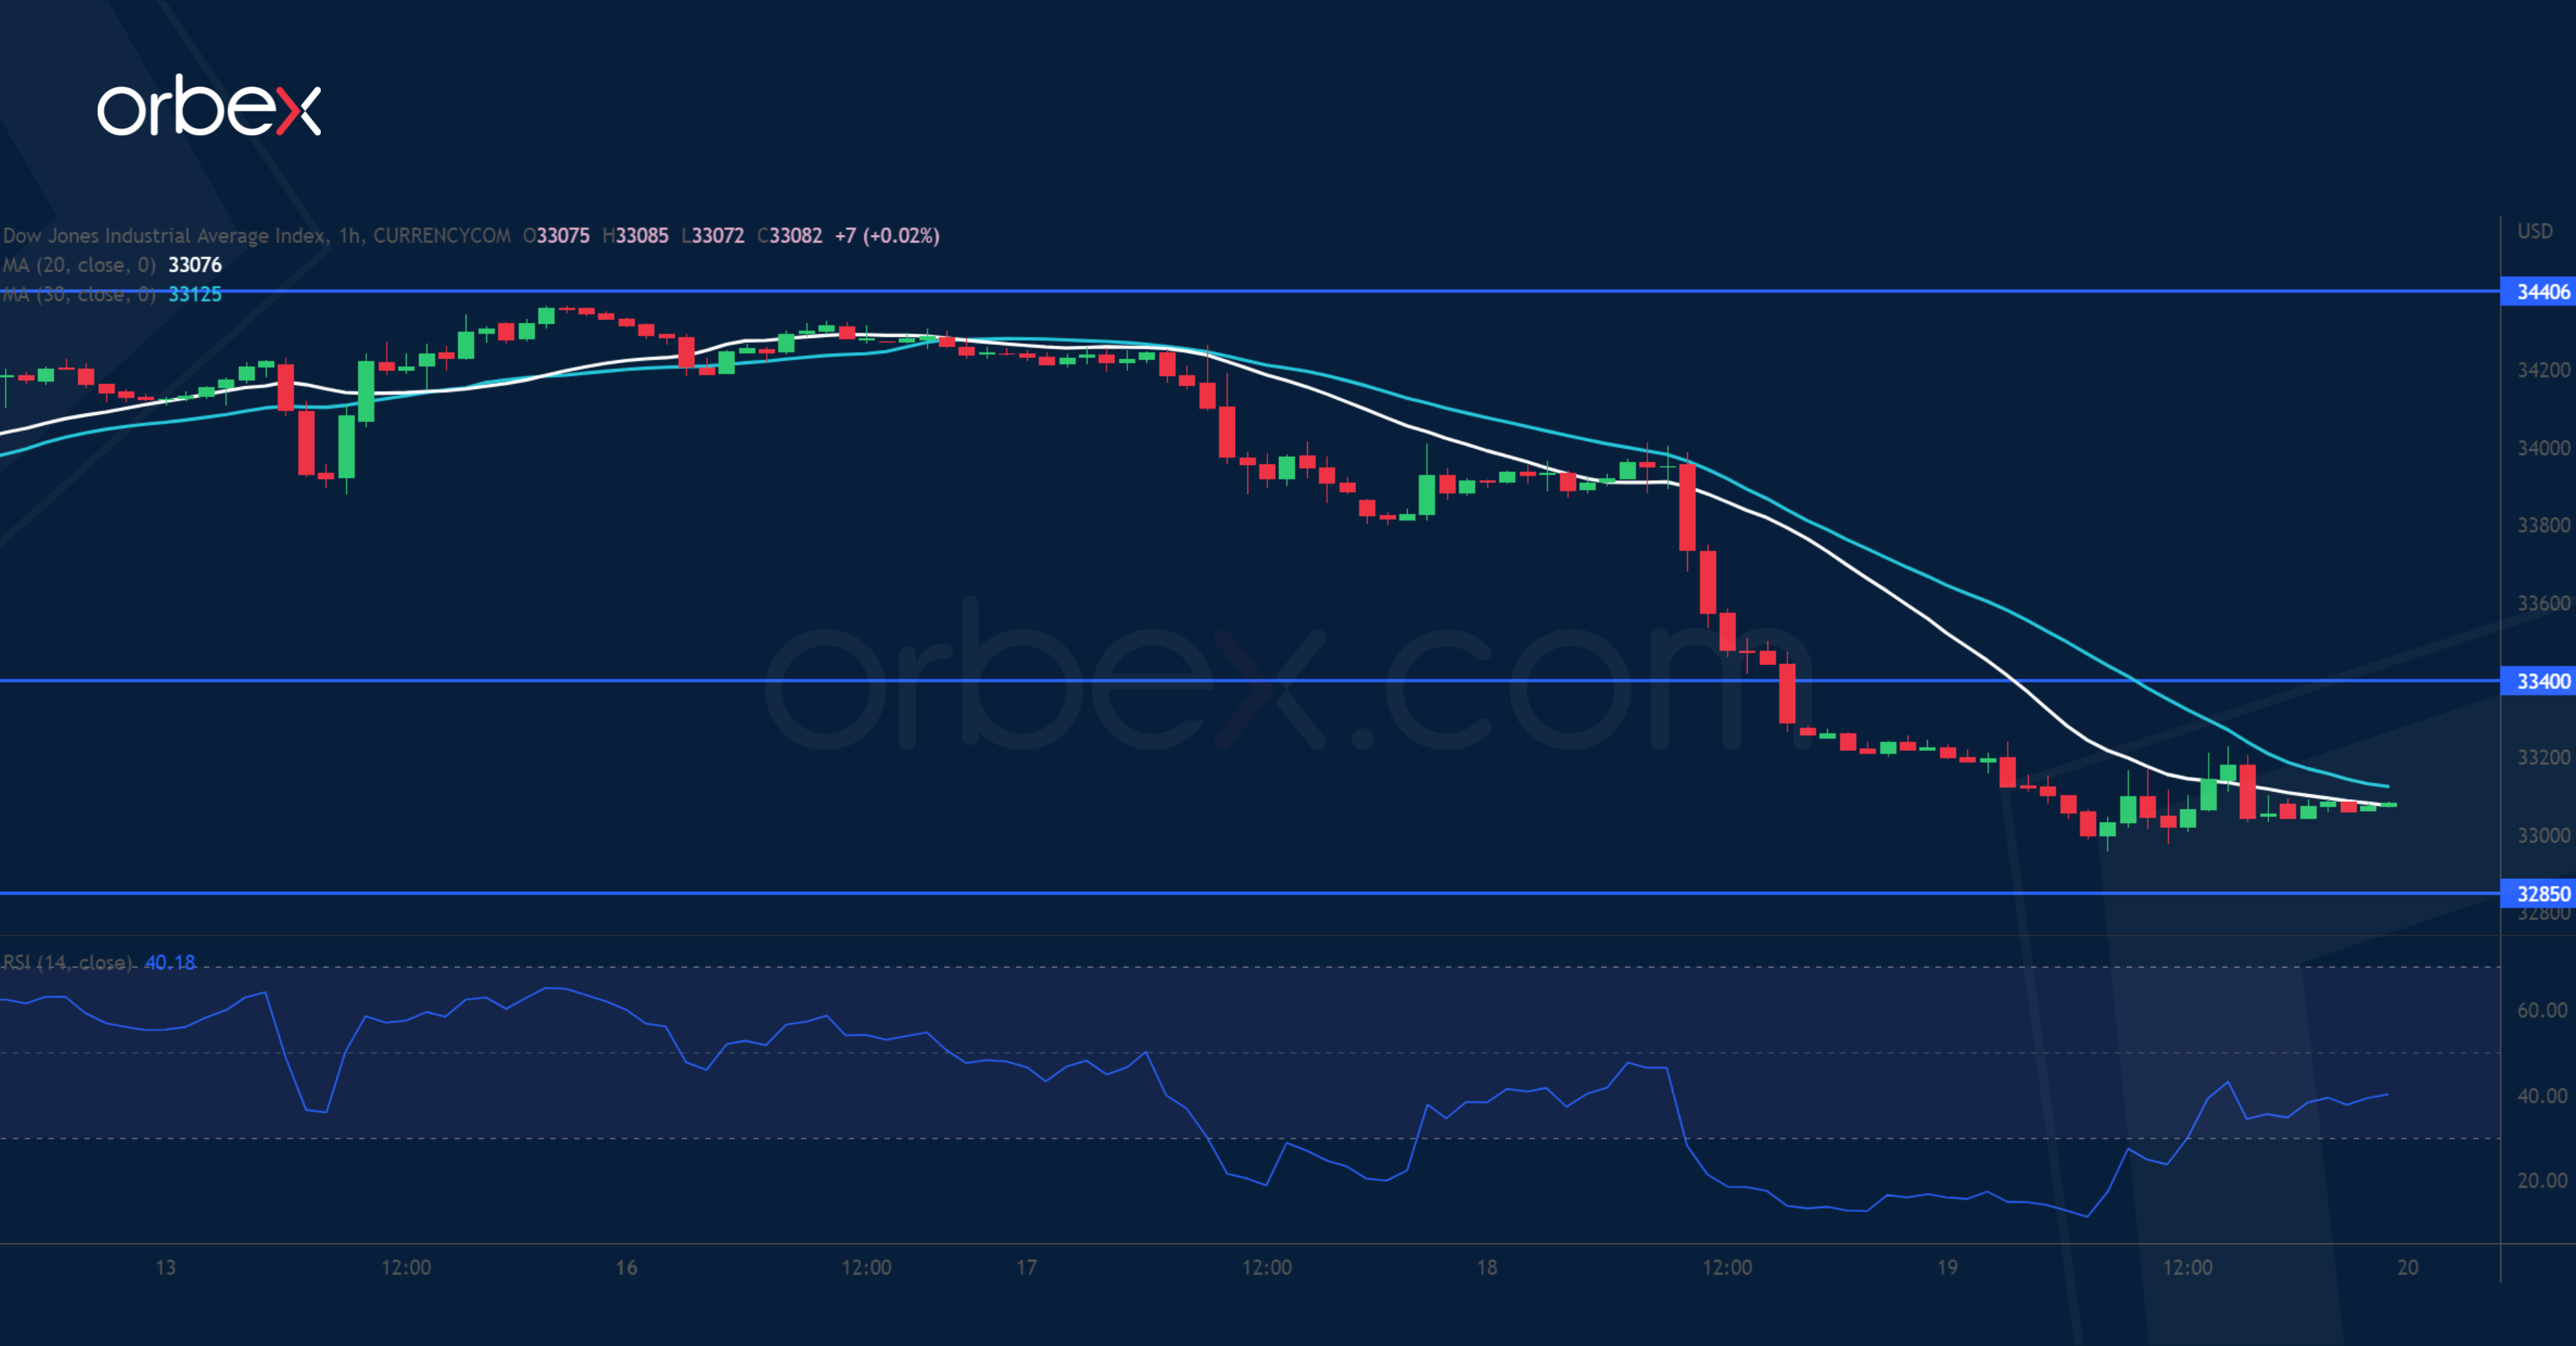
The Dow Jones 30 weakens as fewer jobless claims point to a tight US labour market. The mid-December liquidation point at 34400 has proved to be a tough level to crack. The price’s sharp reversal suggests that the bears could still have the final word. A clean cut through 33700 then 33400 has put the bulls on the defensive, with the latter becoming a fresh resistance. The index is now probing bids at the lower band of a previous consolidation at 32850. The RSI’ oversold condition may attract some bargain hunters.
US Oil Finds Support
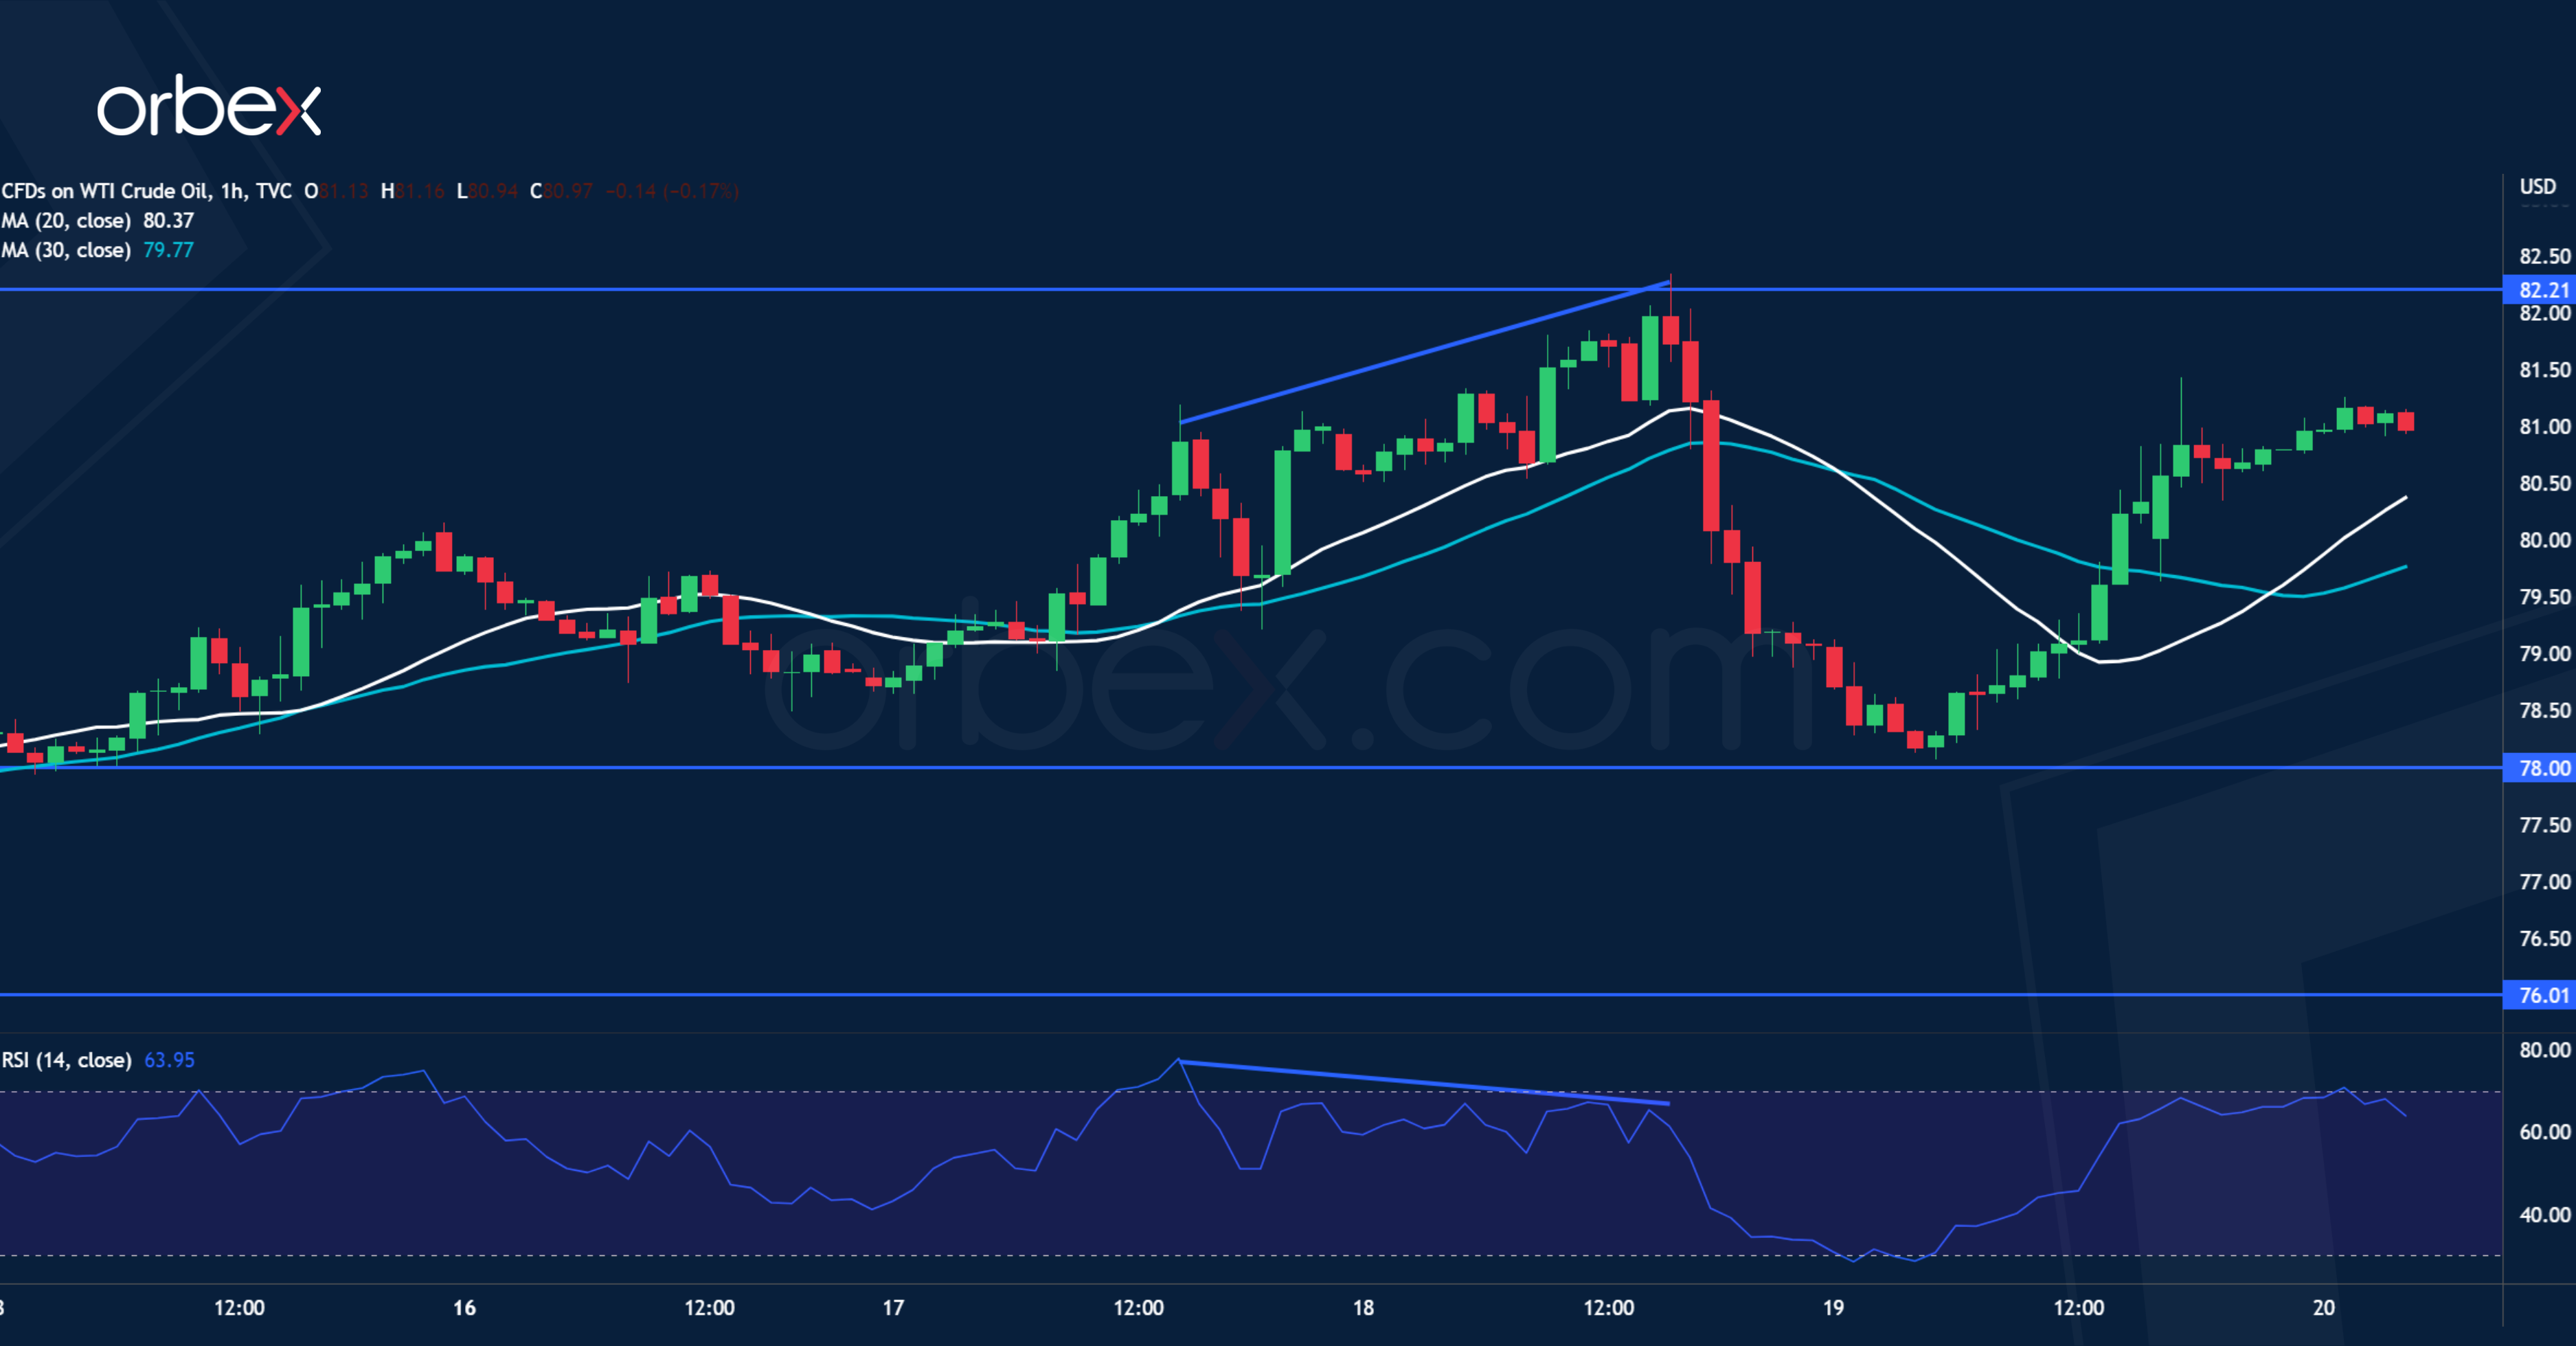
WTI crude bounced back after data showed Chinese demand rose its highest since February. A close above the previous high of 81.30 has been short-lived with the rally hitting a roadblock at 82.20, right under December’s high of 83.00. A break below 79.00 has forced leveraged buyers to bail out. Not all is lost though, this might be a correction after a bearish RSI divergence showed exhaustion on its way up. 78.00 on the 20-day moving average saw renewed interest. 76.00 would be the bulls’ second layer of defence.
AUD/USD Falls Back
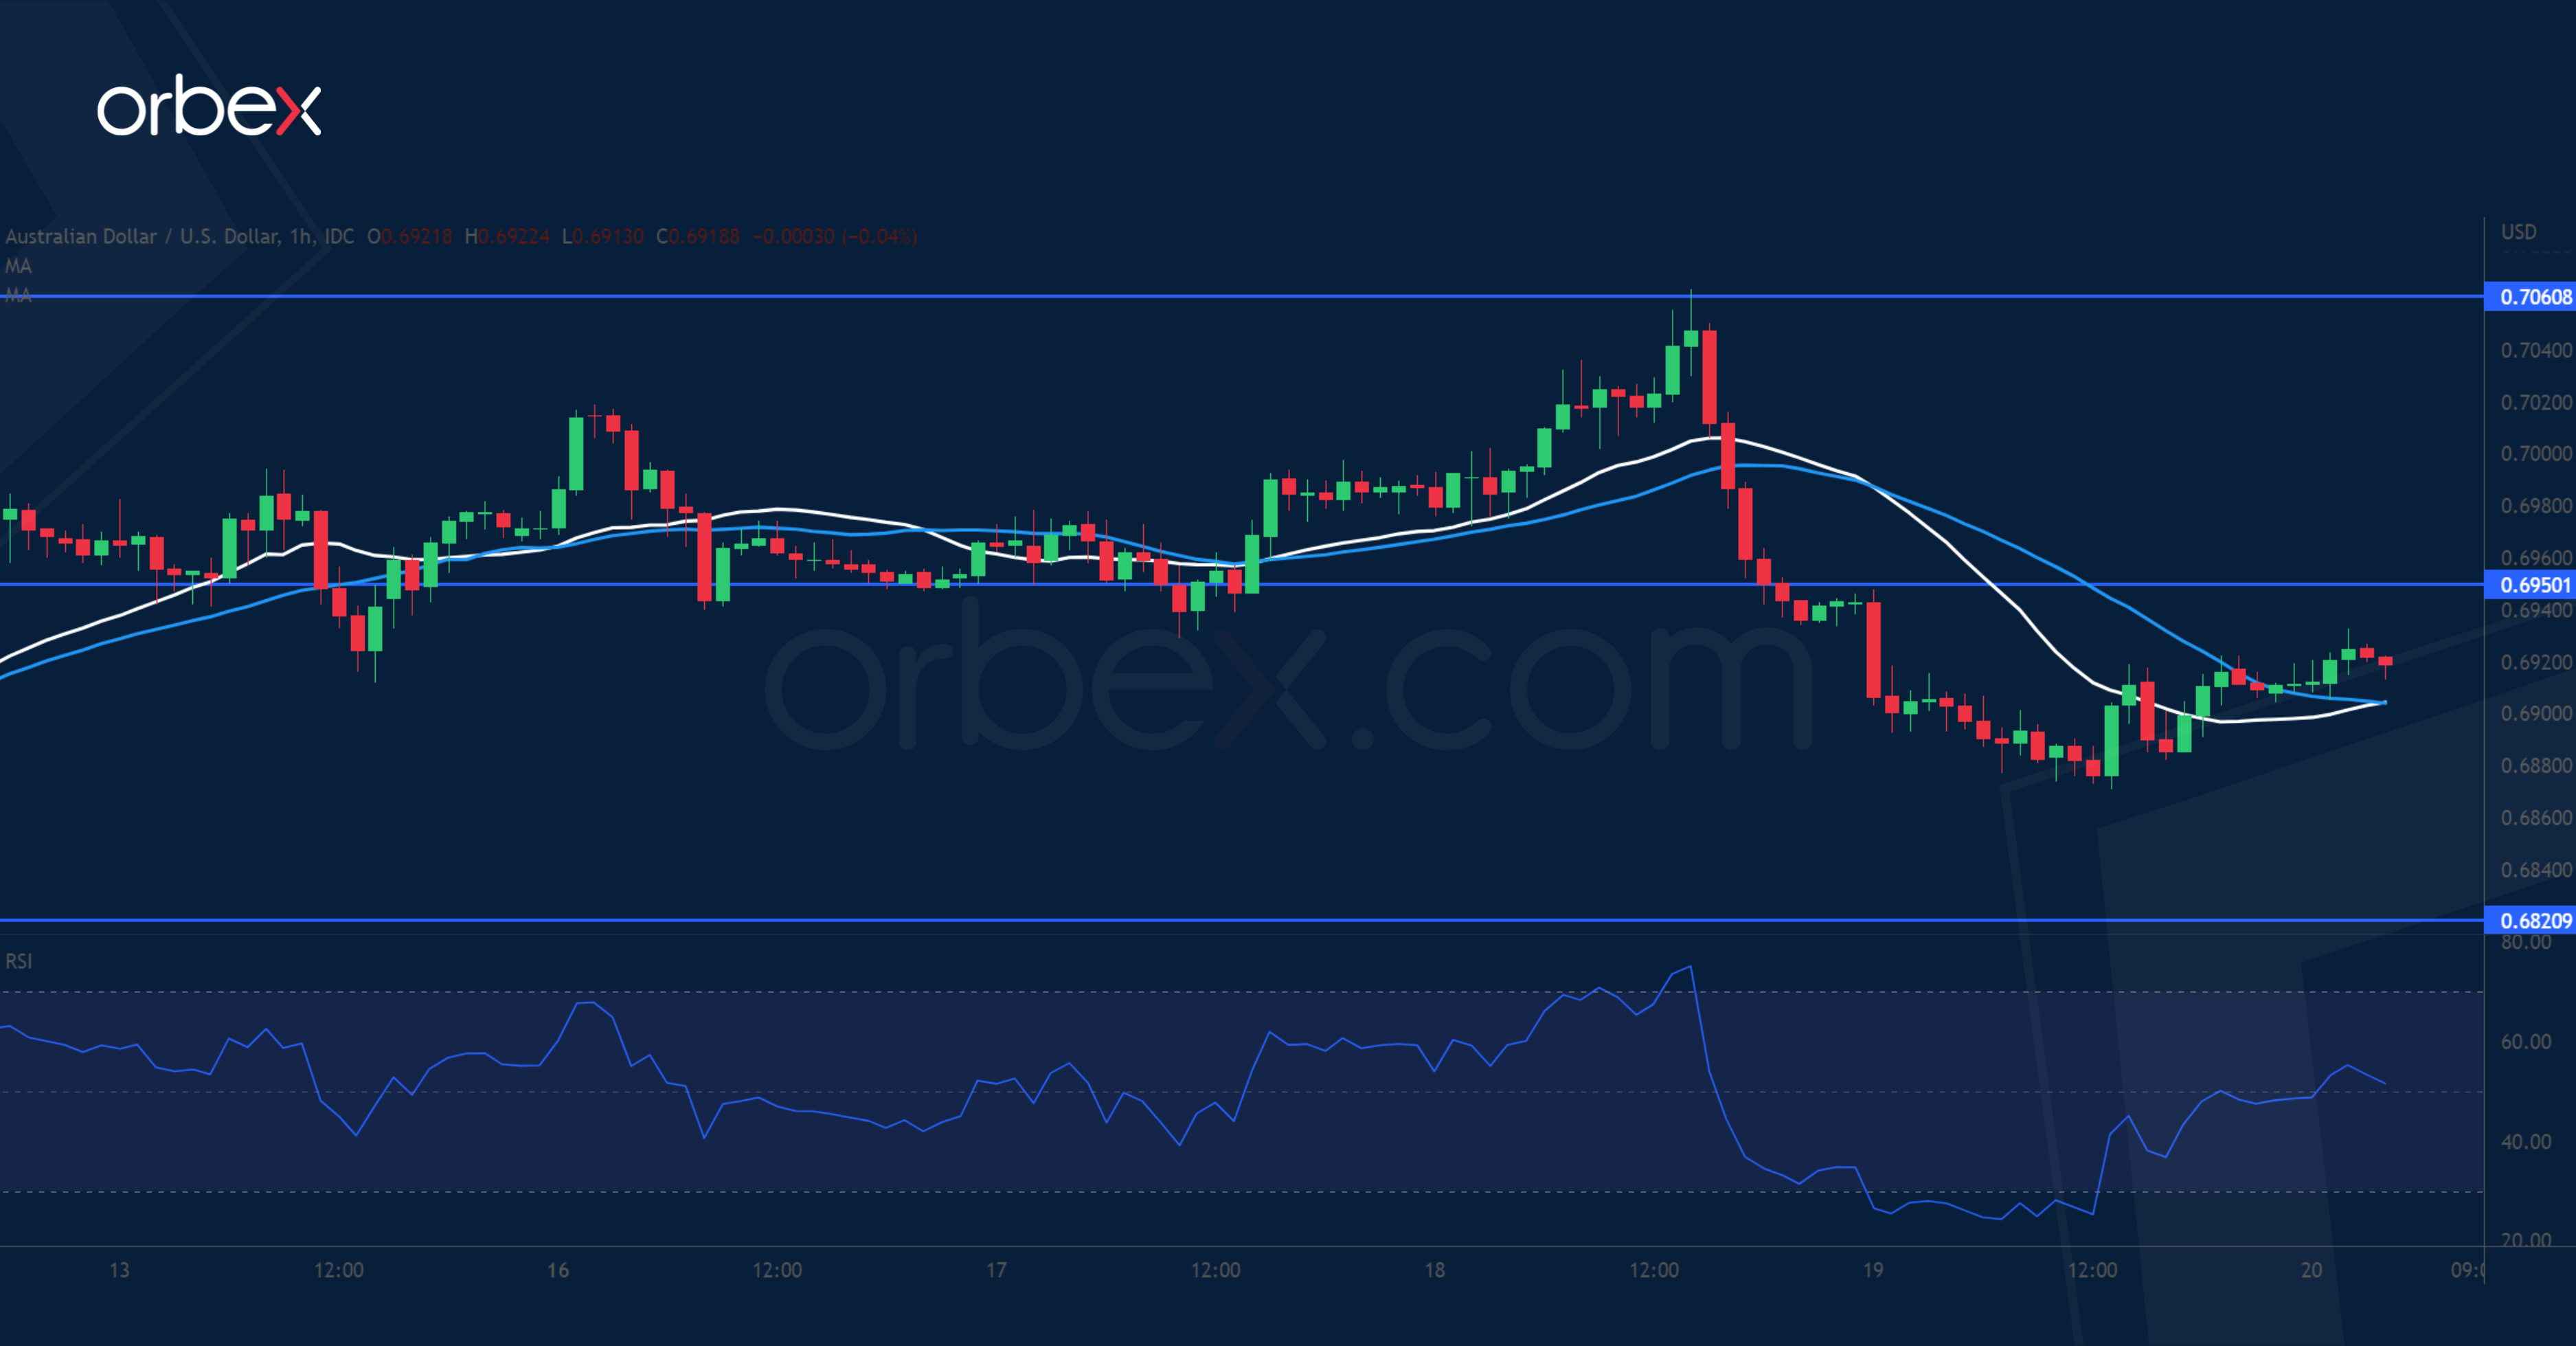
The Australian dollar softened after an uptick in December’s unemployment rate. A cut through 0.6940 has invalidated this demand zone, elbowing the bulls to the side. This left a shooting star on the daily chart, which may foreshadow a U-turn. 0.6820 near the base of a previous bullish breakout momentum sits on the 30-day moving average, making it an area of confluence. A deeper correction would test the daily low at 0.6720. On the upside, the buy side will need to push back to 0.6950 to relieve their trapped fellows first.
BoJ Clearly Removed the Sting Out of the Normalization Debate
Markets
The ECB took center stage yesterday. Several speeches from high-profile policymakers were due, including Dutch governor Knot and president Lagarde. Both stuck to the hawkish line set out at the December meeting. That message was later reinforced by the publication of that meeting’s minutes. Governors were not at all amused with market conditions having eased at that time, saying it was incompatible with bringing inflation back to target. The eventual 50 bps hike combined with strong guidance of more similar-sized hikes to come also was a clear compromise between the large number of members preferring a 75 bps move & some wanting a quicker starting QT pace and the rest of the committee. The core bond yield decline came to a halt. Bunds underperformed USTs with yields grinding 0.9 bps (30y) to 6.5 bps (2y) higher. US yields rose 3.9-4.4 bps in the 2y-5y segment and over 2 bps at the long end of the curve. Fed vice-chair Brainard held a balanced speech saying risks are becoming more two-sided, referring to cooling wages and consumer demand but stressing the need for higher rates for longer. Stock markets lost ground, especially in Europe but the dollar failed to capitalize on that. DXY barely kept the 102 barrier. EUR/USD rose back above 1.08. Sterling initially defied the risk-off again. But some profit-taking action took place when EUR/GBP hit support at 0.8721 (April 2021 correction high/June 2022 interim high).
The Japanese yen is underperforming in a risk-on session. Inflation rose to the highest in decades (see below) but the BoJ clearly removed the sting out of the normalization debate, for now at least. USD/JPY advances to above 129 and yields in the region again point downwards (10y reference yield -3.6 bps to 0.4%). China’s yuan eases a tad (USD/CNY 6.78) after the PBOC, with today’s injection included, flushed the local market with a record amount of short-term cash this week ahead of the Lunar NY holidays next week. NY Fed Williams sided with the rest of the colleagues arguing for further tightening in order to get sufficiently restrictive rates. US yields this morning add a few more bps.
It’s the final day at the WEF in Davos today. It’s again packed with central bank speeches though we don’t expect them to hold any additional information. Their message is clear and it’s up to markets to either embrace or keep ignoring it. We’ve seen core bond yields bottoming yesterday but it is all very preliminary. And recent evidence has shown that it doesn’t take much (usually one bad data release) to thwart the process, especially in the US. The 10y yield over there should take out 3.50% asap and preferably the 3.58/63% area soon thereafter to flip the technical picture but that’s more than a day’s work. It’s also a prerequisite for the dollar to sustainably recover (through interest rate support and risk aversion). UK retail sales end the data-heavy week on a disappointing note. (Core) retail turnover in December dropped 1(.1)% m/m to be 5.8% (6.1%) lower y/y. The numbers defied a hoped-for rebound after already declining in November. It’s a conflicting element for the Bank of England after a solid labour market report and still-double digit inflation earlier this week. Sterling extended an early fall. EUR/GBP rises to 0.876.
News Headlines
Japanese national inflation accelerated for both the headline and the core (ex. fresh food) reading gauge to 4% Y/Y, respectively up from 3.8% Y/Y and 3.7% Y/Y. The headline figure hit this barrier for the first time since 1991. For the core measure we have to go back to December 1981. The even narrower index which filters energy as well, increased from 2.8% Y/Y to 3% Y/Y. The inflation data add to (market) pressure on the Bank of Japan to take a next step in its monetary policy normalization process. They unexpectedly increased the tolerance band around the 0% YCC target for the 10-yr yield from 25 bps to 50 bps at the end of December, but refrained from taking a next step at Wednesday’s policy meeting with governor Kuroda sticking to his line that inflation is mainly driven by the higher cost of energy. Kuroda’s term ends after the next, March, policy meeting with some expecting the BoJ’s U-turn under a new governor in April.
UK GfK consumer confidence unexpectedly fell from -42 to -45 in January. It continues hovering near all-time lows (-49 Sept2022). Details showed a deterioration in all sub-components apart from “personal finances next 12 months” (-27 from -29). “Climate for major purchases” and “Saving Intentions” showed the biggest declines, dropping 6 points to respectively 14 and -40.
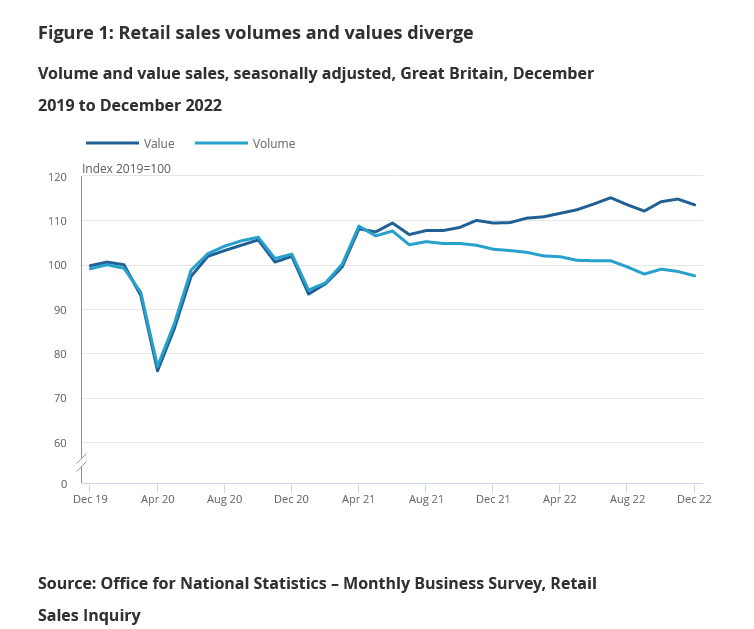
UK retail sales volume down -1.0% mom in Dec, value down -1.2% mom
UK retail sales volume declined -1.0% mom in December, much worse than expectation of 0.4% mom. Ex-fuel sales dropped -1.1% mom, below expectation of 0.4% mom. Sales value decreased -1.2% mom while ex-fuel sales value declined -1.0% mom.
Between 2021 and 2022, retail sales volume fell by -3.0%, "as the lifting of restrictions on hospitality led to a return to eating out, and rising prices and the cost of living affected sales volumes."