Sample Category Title
Technical Outlook and Review
USD/JPY:
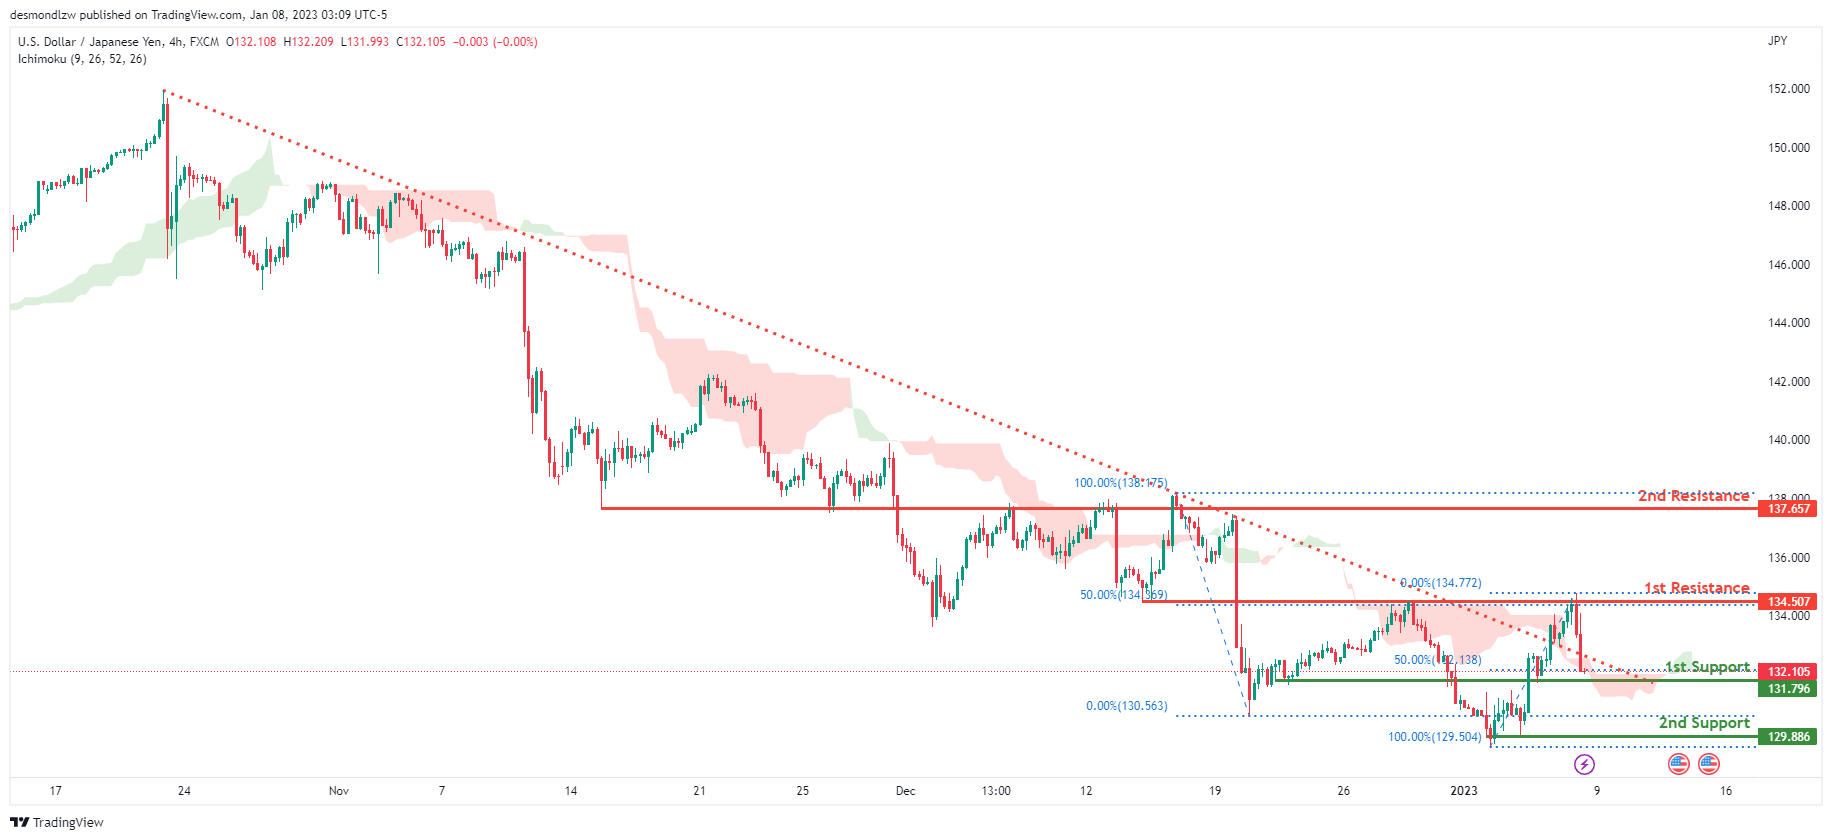
Looking at the H4 chart, my overall bias for USDJPY is bearish due to the current price being below the Ichimoku cloud, indicating a bearish market. To add support to this bias, price has also broken back into the descending trendline.If this bearish momentum continues, expect price to possibly break the 1st support at 131.796, where the 50% Fibonacci line is, before heading towards the 2nd support at 129.886, where the previous swing low is. In an alternate scenario, price could possibly head back up towards the 1st resistance level at 134.528, where the 50% Fibonacci line is.
Areas of consideration:
- H4 time frame, 1st resistance at 134.528
- H4 time frame, 2nd resistance at 137.657
- H4 time frame, 1st support at 131.796
- H4 time frame, 2nd support at 129.886
DXY:
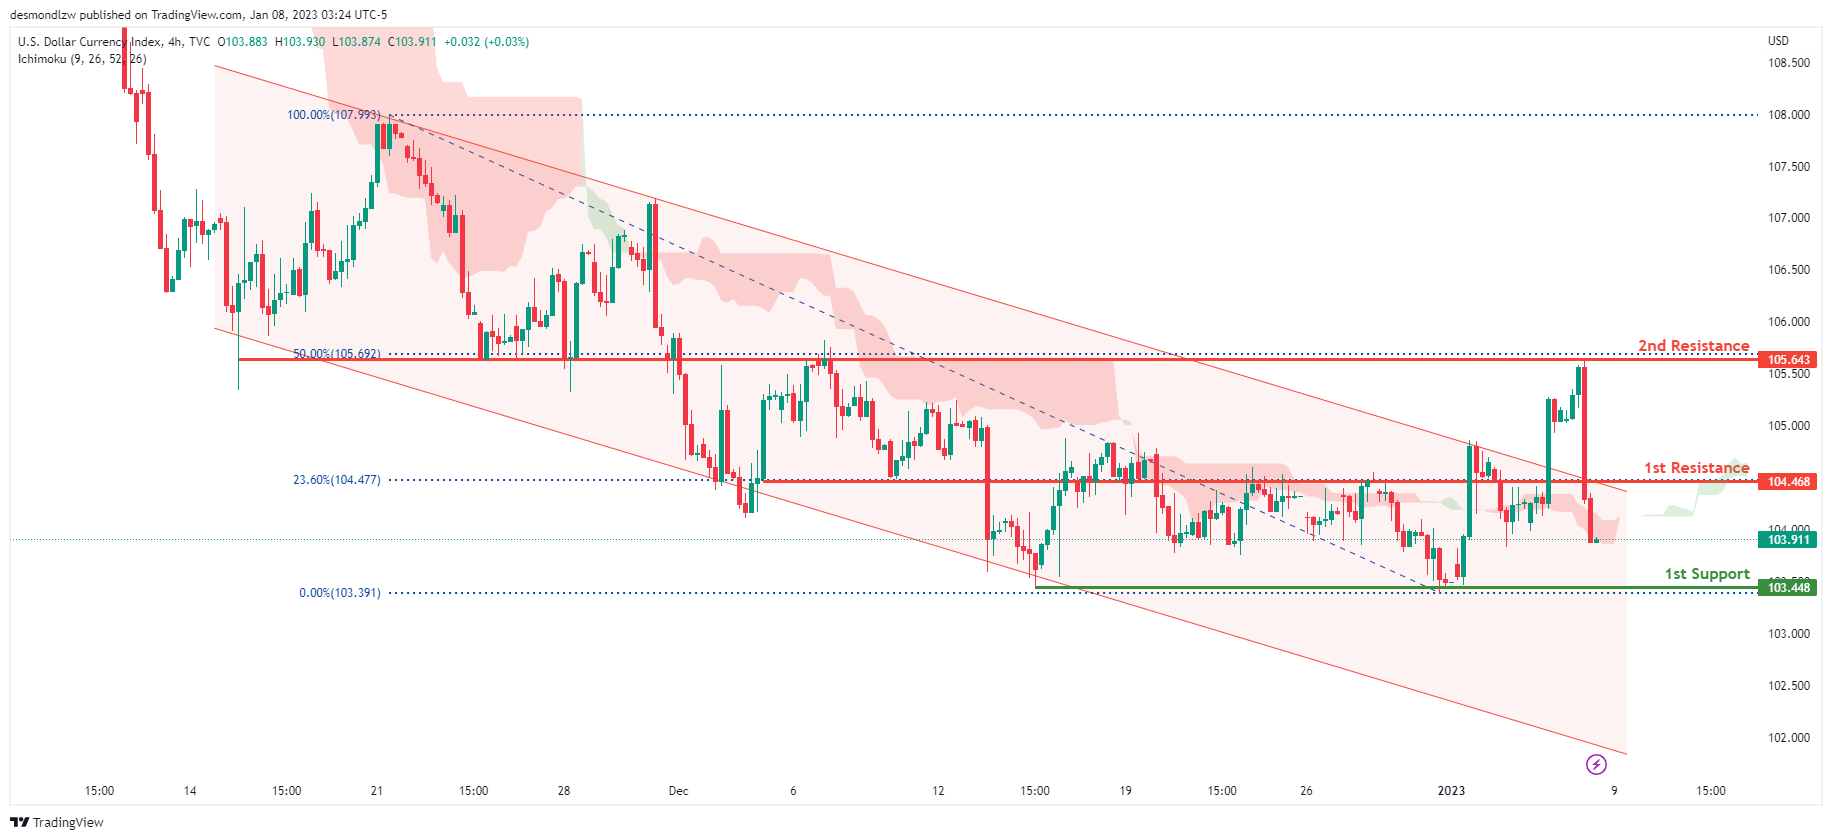
Looking at the H4 chart, my overall bias for DXY is bearish due to the current price being below the Ichimoku cloud, indicating a bearish market. To add confluence to this, price is broken back down within the descending channel which indicates a bearish market. If this bearish momentum continues, expect the price to possibly continue heading towards the 1st support at 103.448, where the previous lows and liquidity hotspots are. In an alternative scenario, price could head back up to retest the 1st resistance at 104.468, where the 23.6% Fibonacci line is.
Areas of consideration:
- H4 time frame, 1st resistance at 104.468
- H4 time frame, 1st support at 103.448
EUR/USD:
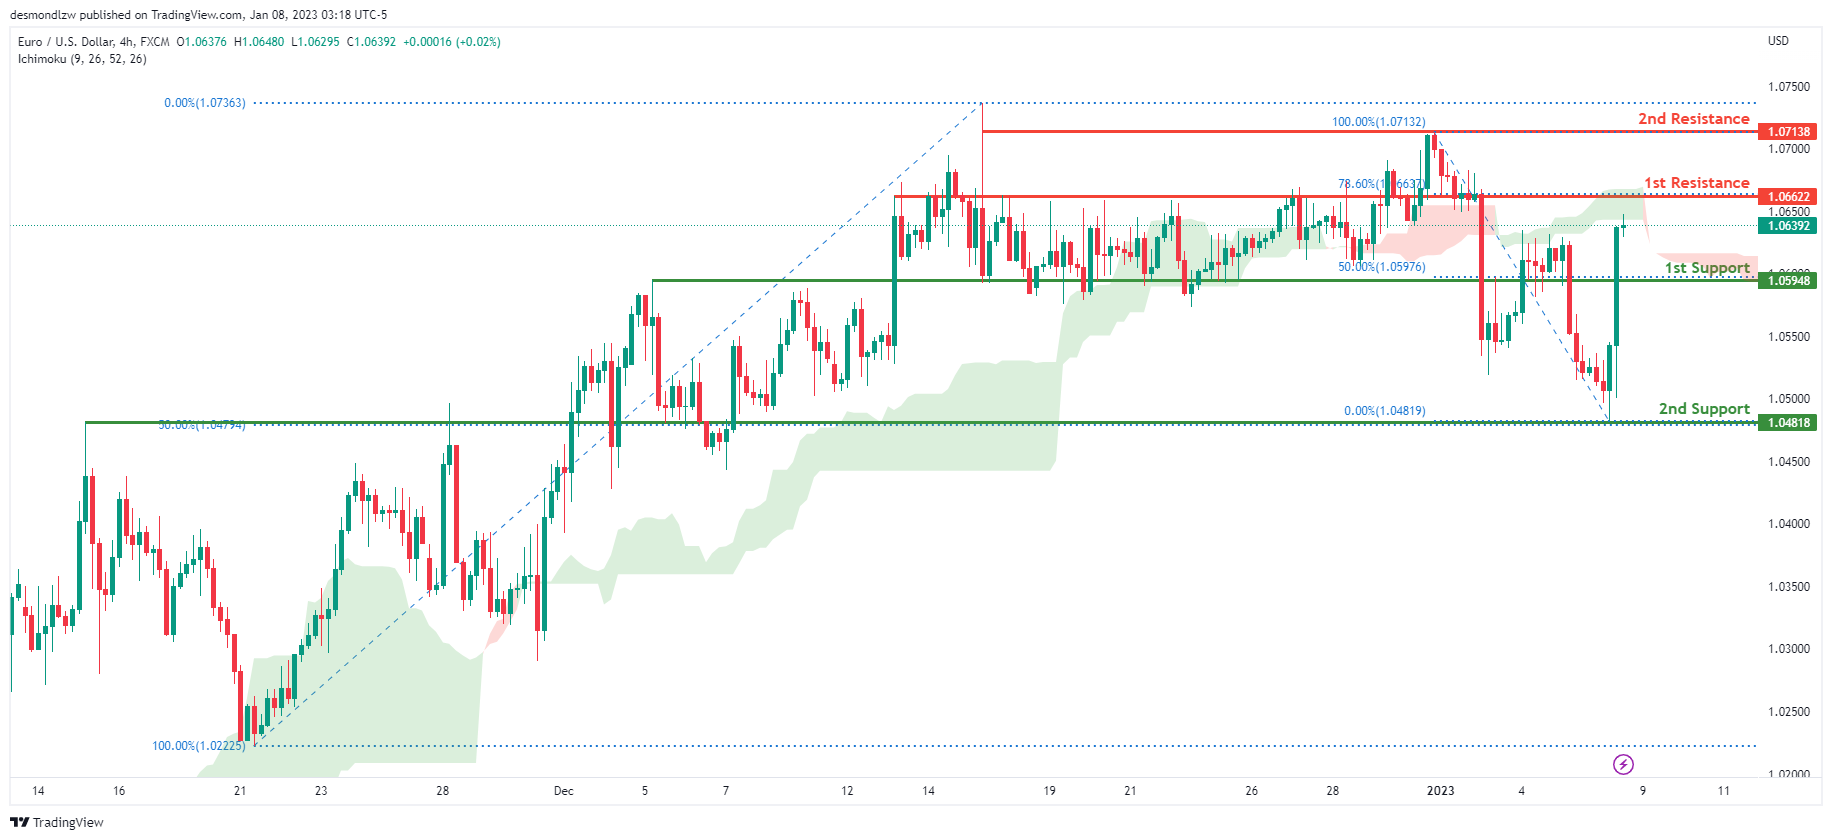
Looking at the H4 chart, my overall bias for EURUSD is bullish due to the current price attempting to cross above the Ichimoku cloud, indicating a possible shift to bullish market structure. If this bullish momentum continues, expect the price to possibly break the 1st resistance at 1.06622, where the 78.6% Fibonacci line is, before heading towards the 2nd resistance at 1.07138, where the previous high and liquidity hotspots are. In an alternate scenario, price could possibly head back down to retest the 1st support level at 1.05948, where the 50% Fibonacci line is.
Areas of consideration :
- H4 1st resistance at 1.06622
- H4 2nd resistance at 1.07138
- H4 1st support at 1.05948
GBP/USD:
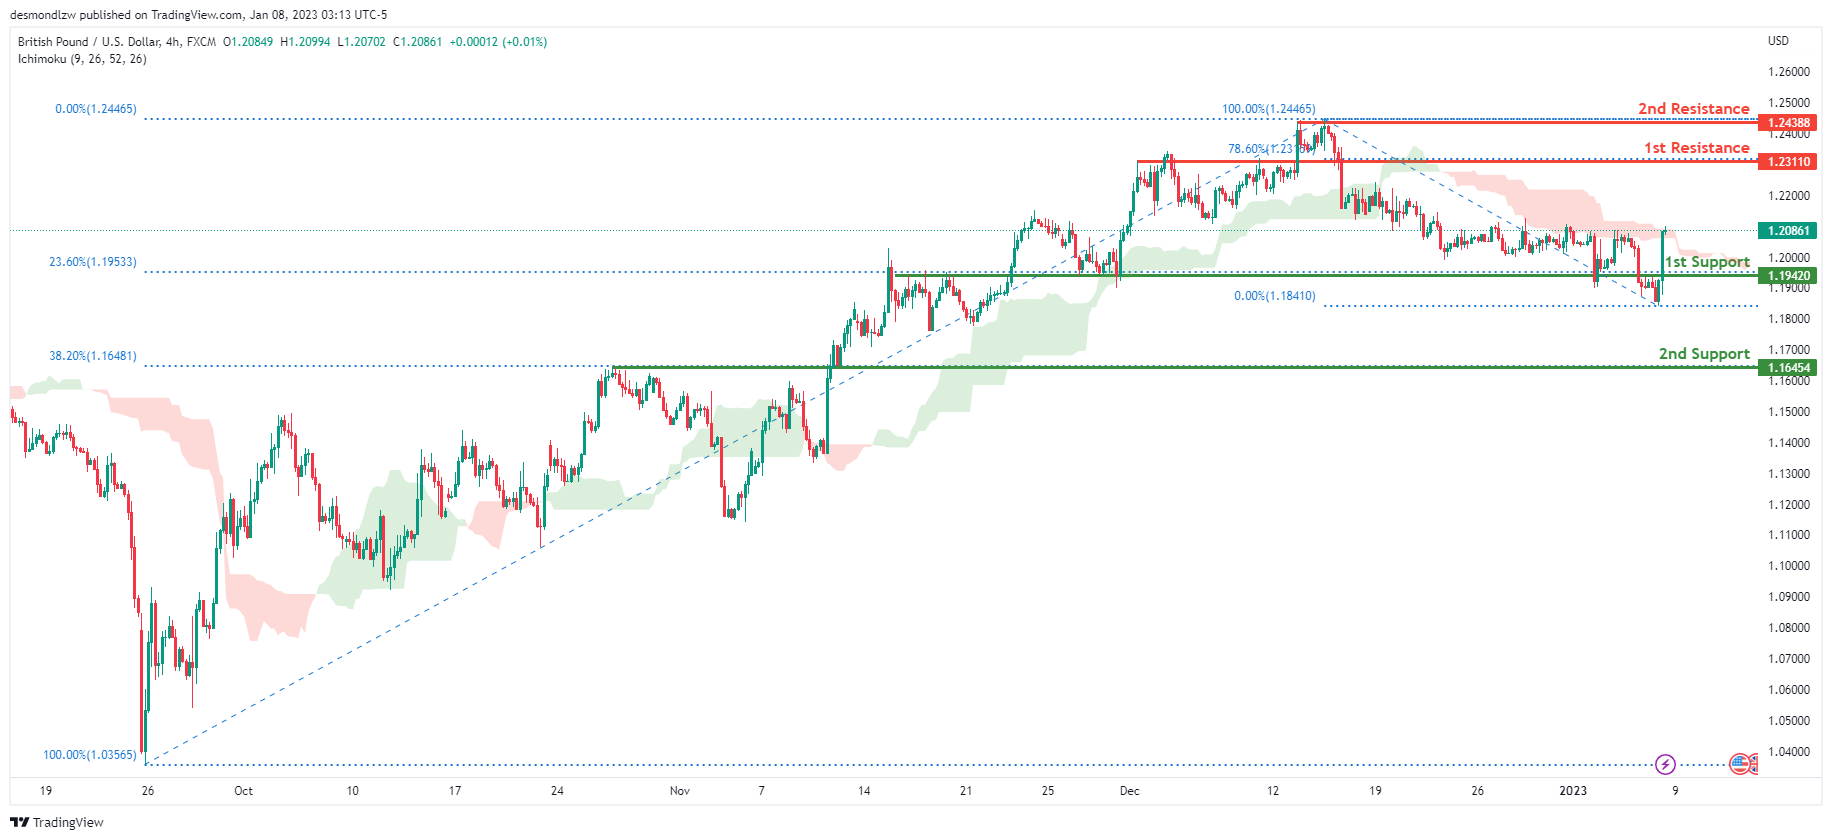
Looking at the H4 chart, my overall bias for GBPUSD is bullish due to the current price being above the Ichimoku cloud, indicating a bullish market. If this bullish momentum continues, expect price to possibly continue heading towards the 1st resistance line at 1.23110, where the 78.6% Fibonacci line is. In an alternate scenario, price could possibly head back down towards the 1st support at 1.19420, where the 23.6% Fibonacci line is
Areas of consideration:
- H4 1st resistance at 1.23110
- H4 1st support at 1.19420
USD/CHF:
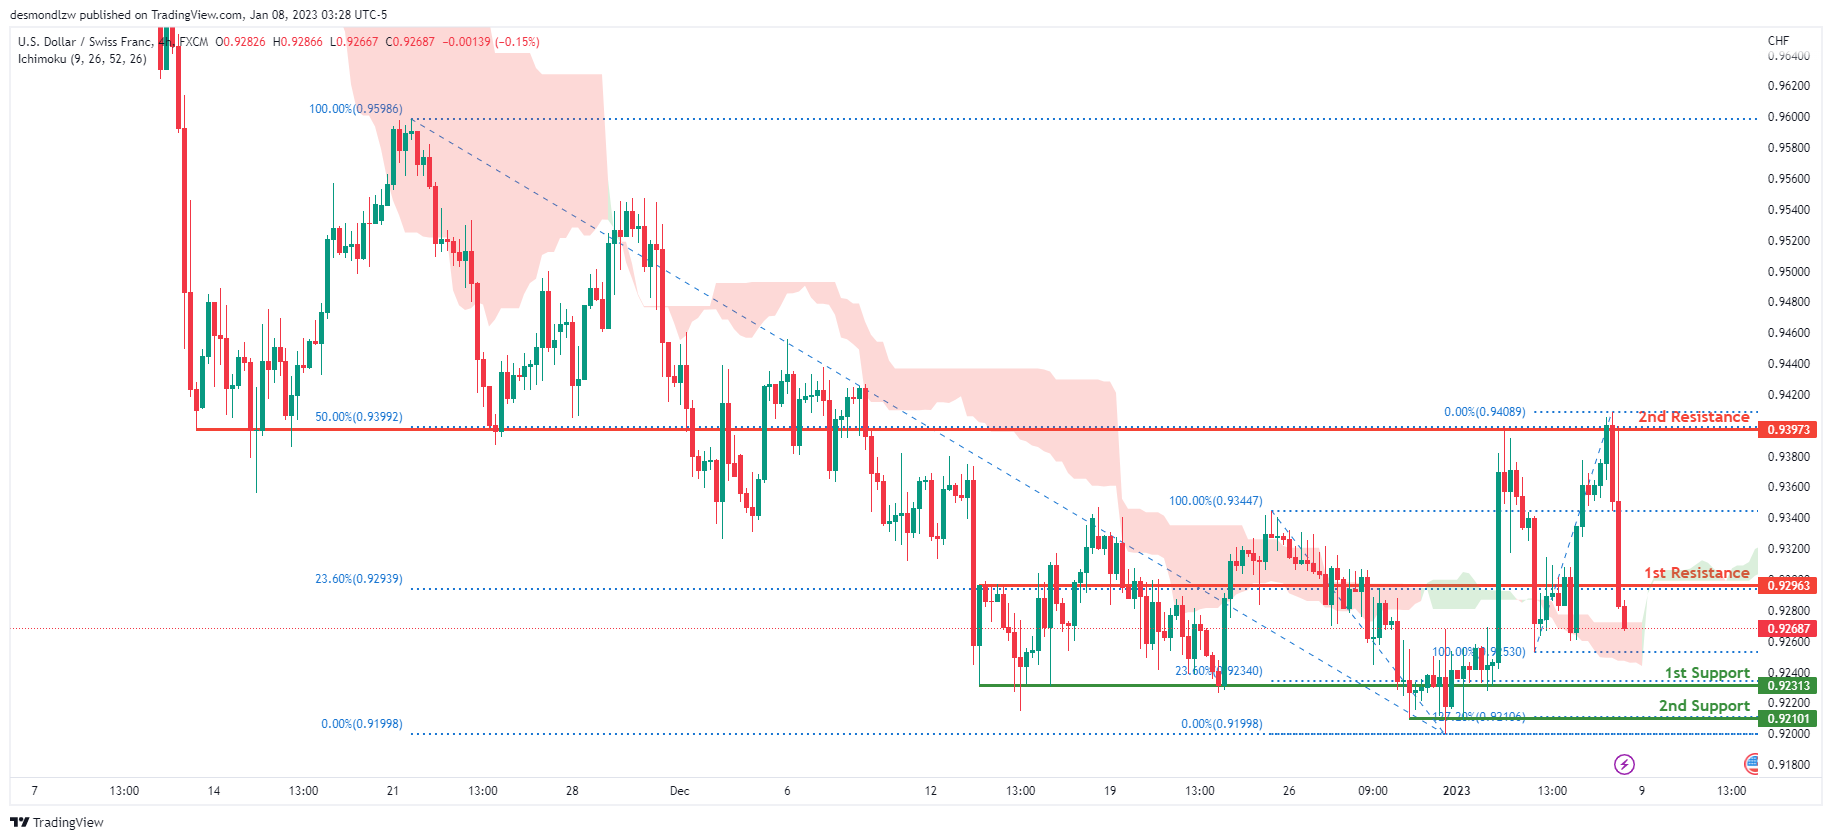
Looking at the H4 chart, my overall bias for USDCHF is bearish due to the current price being below the Ichimoku cloud, indicating a bearish market. If the current bearish trend continues, expect the price to head towards the 1st support at 0.92313, where the 23.6% Fibonacci line is. In an alternative scenario, price could possibly head back up to retest the 1st resistance at 0.92963, where the 23.6% Fibonacci line is.
Areas of consideration
- H4 1st support at 0.92313
- H4 1st resistance at 0.92963
XAU/USD (GOLD):
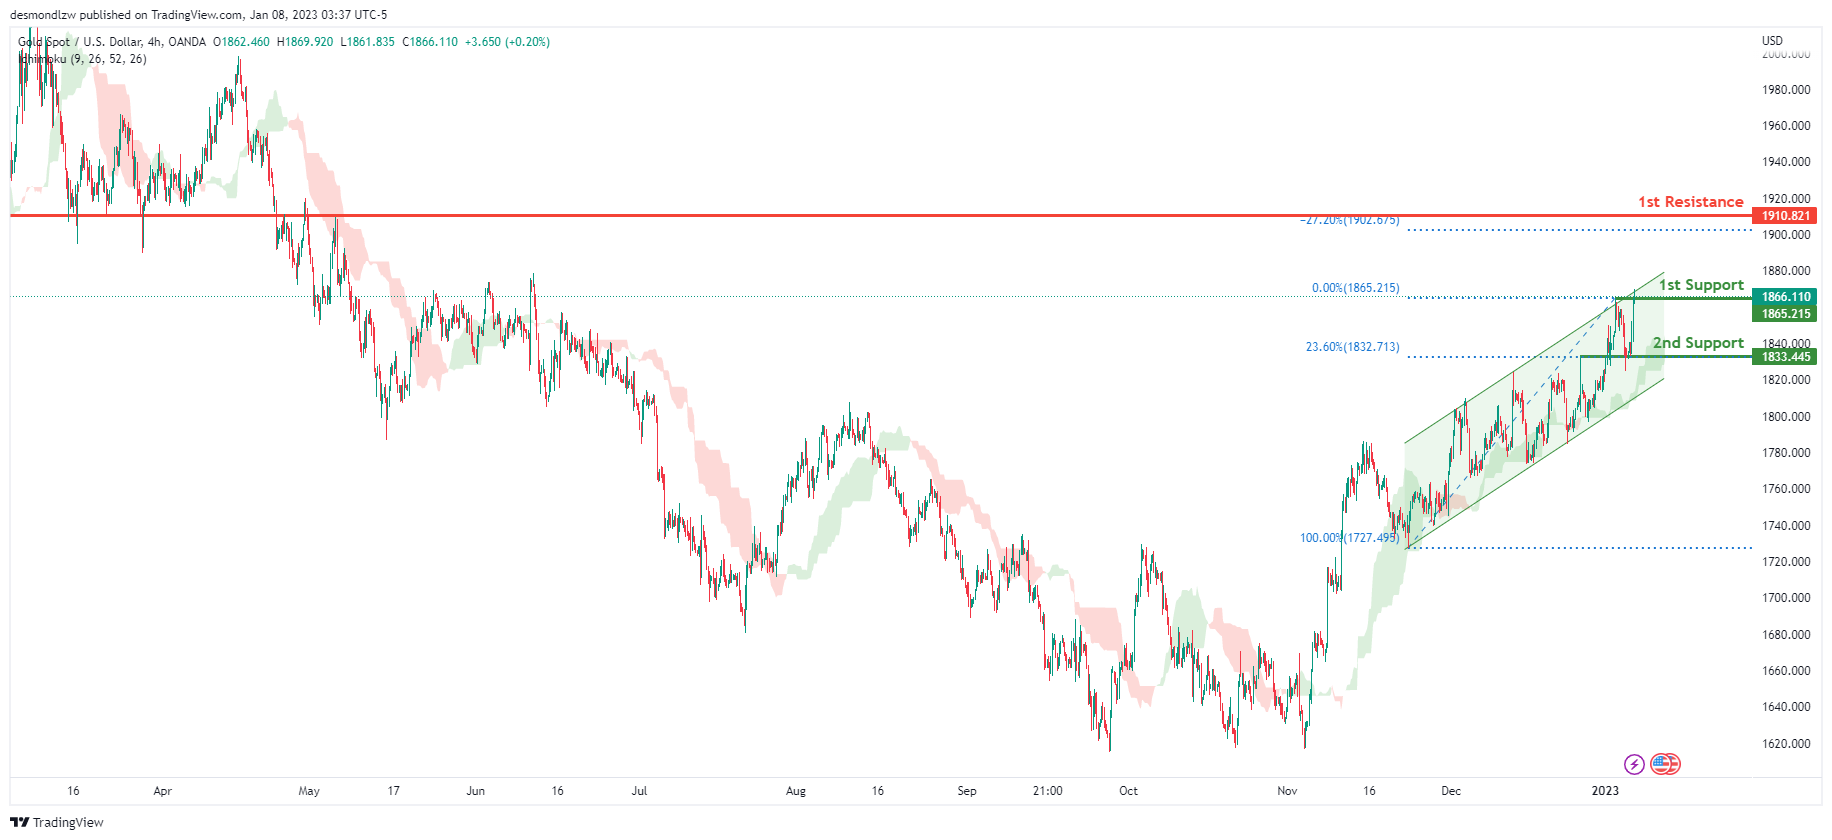
Looking at the H4 chart, my overall bias for XAUUSD is bullish due to the current price crossing above the Ichimoku cloud, indicating a bullish market. To add support to this bias, price is also within a bullish ascending channel. If this bullish momentum continues, expect the price to possibly continue heading towards the 1st resistance at 1910.821 where the -27.2% Fibonacci expansion line is. In an alternative scenario, price could possibly head back down breaking the 1st support at 1833.445, where the 23.6% Fibonacci line is, before heading towards the 2nd support at 1833.445, where the 23.6% Fibonacci line is.
Areas of consideration:
- H4 time frame, 1st resistance at 1910.821
- H4 time frame, 1st support at 1810.010
- H4 time frame, 2nd support at 1833.445
AUD/USD:
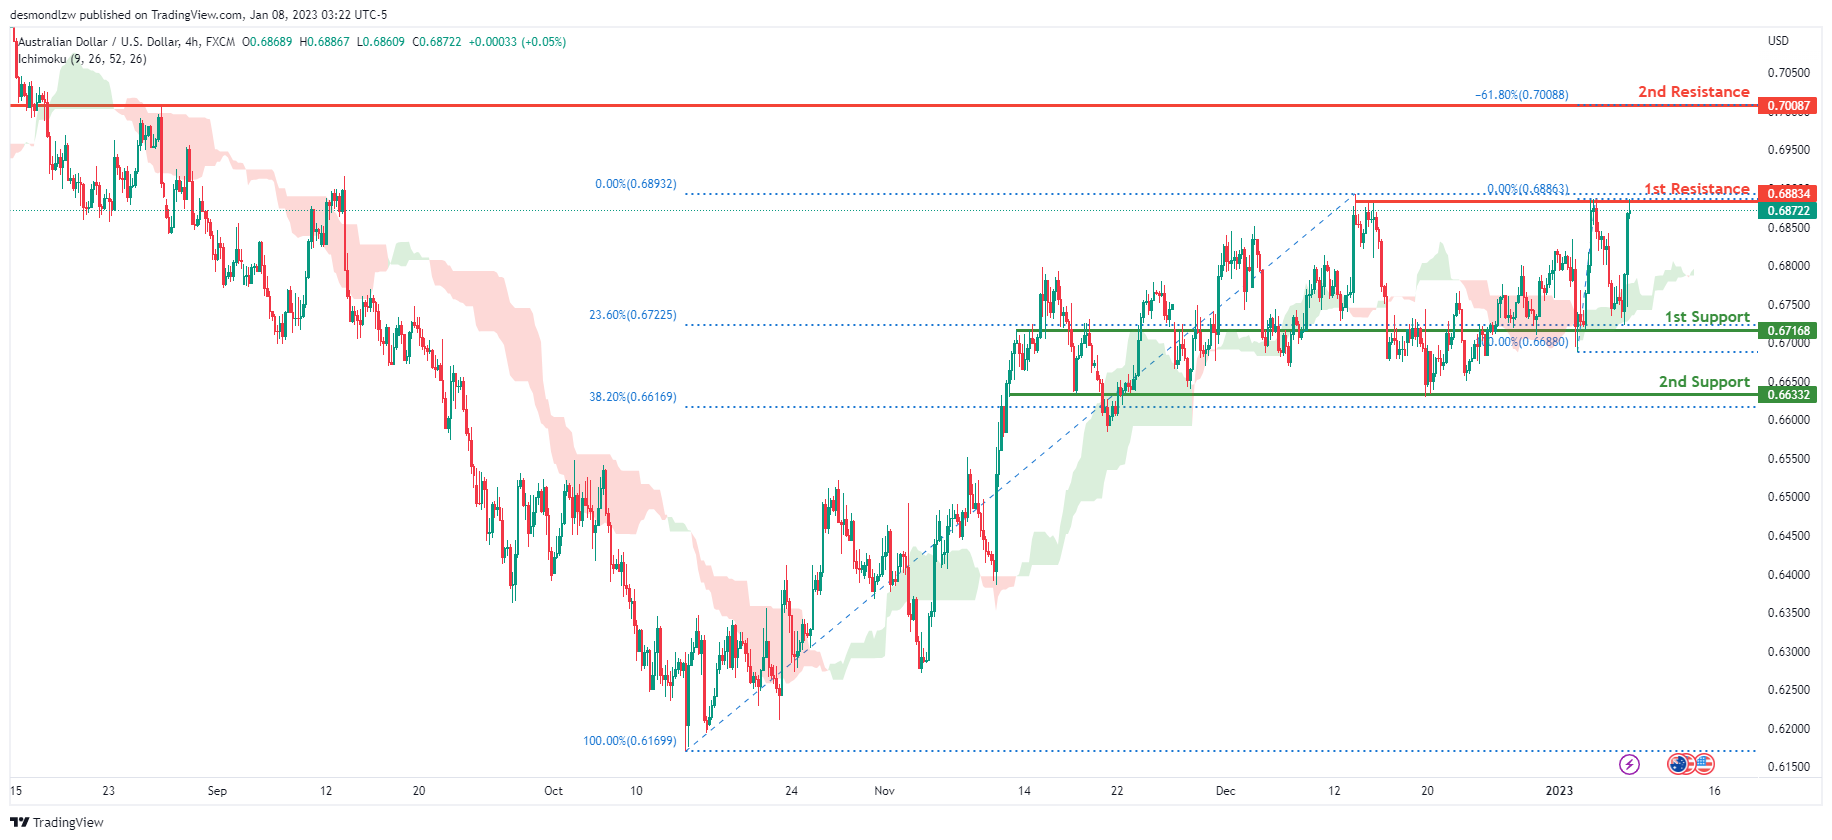
Looking at the H4 chart, my overall bias for AUDUSD is bullish due to the current price being above the Ichimoku cloud, indicating a bullish market. If this bullish momentum continues, expect the price to possibly break the 1st resistance at 0.68834, where the recent swing high is, before heading towards the 2nd resistance at 0.70087, where the -61.8% Fibonacci expansion line is. In an alternative scenario, price could possibly head back down breaking the 1st support at 0.67168, where the 23.6% Fibonacci line is, before heading towards the 2nd support at 0.66332, where the 38.2% Fibonacci line is.
Areas of consideration
- H4, 1st resistance at 0.68932
- H4, 2nd resistance at 0.70087
- H4, 1st support at 0.67168
- H4, 2nd support at 0.66332
NZD/USD:
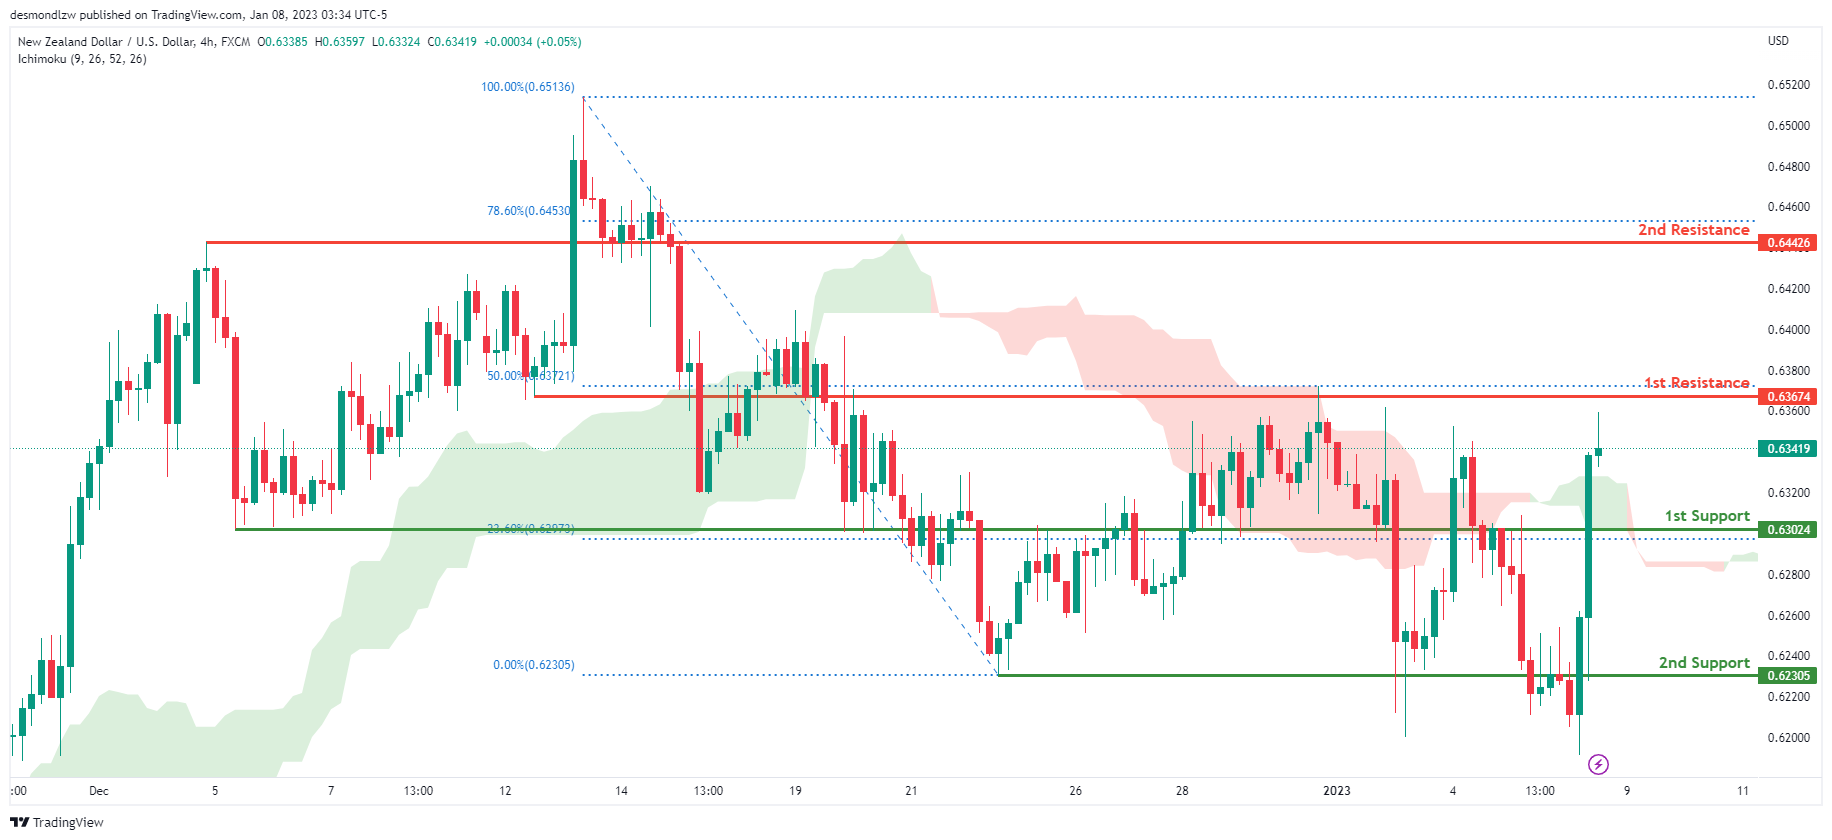
Looking at the H4 chart, my overall bias for NZDUSD is bullish due to the current price being above the Ichimoku cloud, indicating a bullish market. If this bullish momentum continues, expect price to possibly continue heading towards the 1st resistance at 0.63674, where the 50% Fibonacci line is. In an alternate scenario, price could possibly head back down to retest the 1st support at 0.63024, where the 23.6% Fibonacci line is
Areas of consideration:
- H4 time frame, 1st resistance at 0.63674
- H4 time frame, 1st support at 0.63024
USD/CAD:
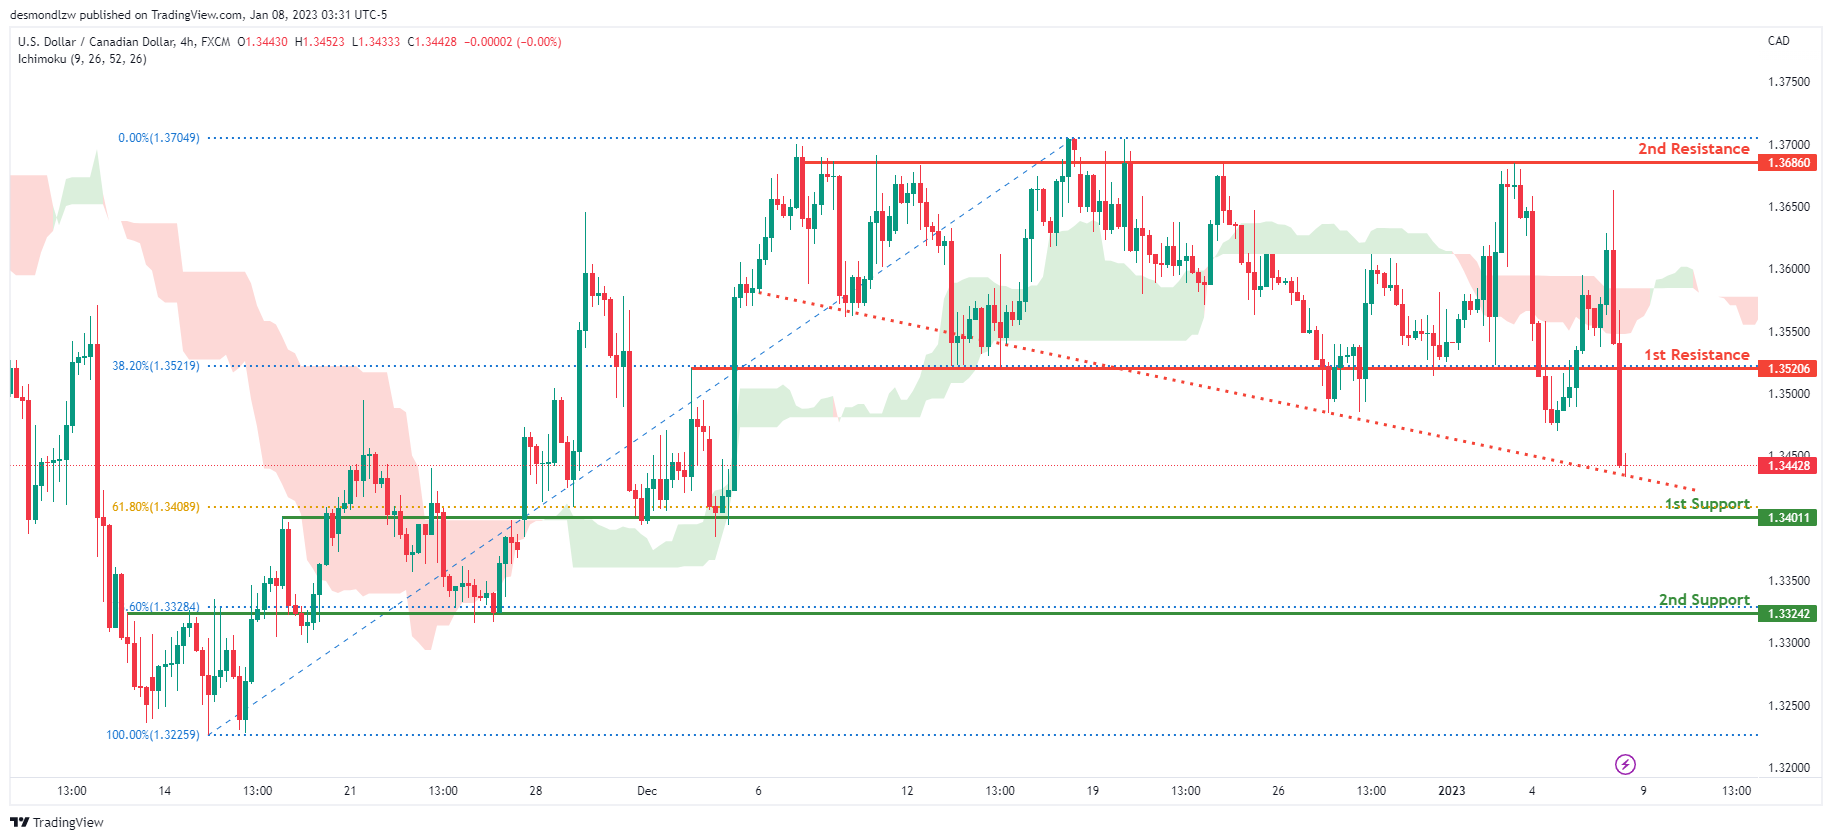
On the H4 chart, the overall bias for USDCAD is bearish. To add confluence to this, the price is below the Ichimoku cloud which indicates a bearish market. To add support to this bias, price is also along a descending trendline. If this bearish momentum continues, expect the price to possibly head towards the 1st support at 1.34011, where the 61.8% Fibonacci line is. In an alternative scenario, price could head back up to retest the 1st resistance at 1.35206, where the 38.2% Fibonacci line is.
Areas of consideration:
- H4 time frame, 1st resistance at 1.35206
- H4 time frame, 1st support at 1.34011
OIL:
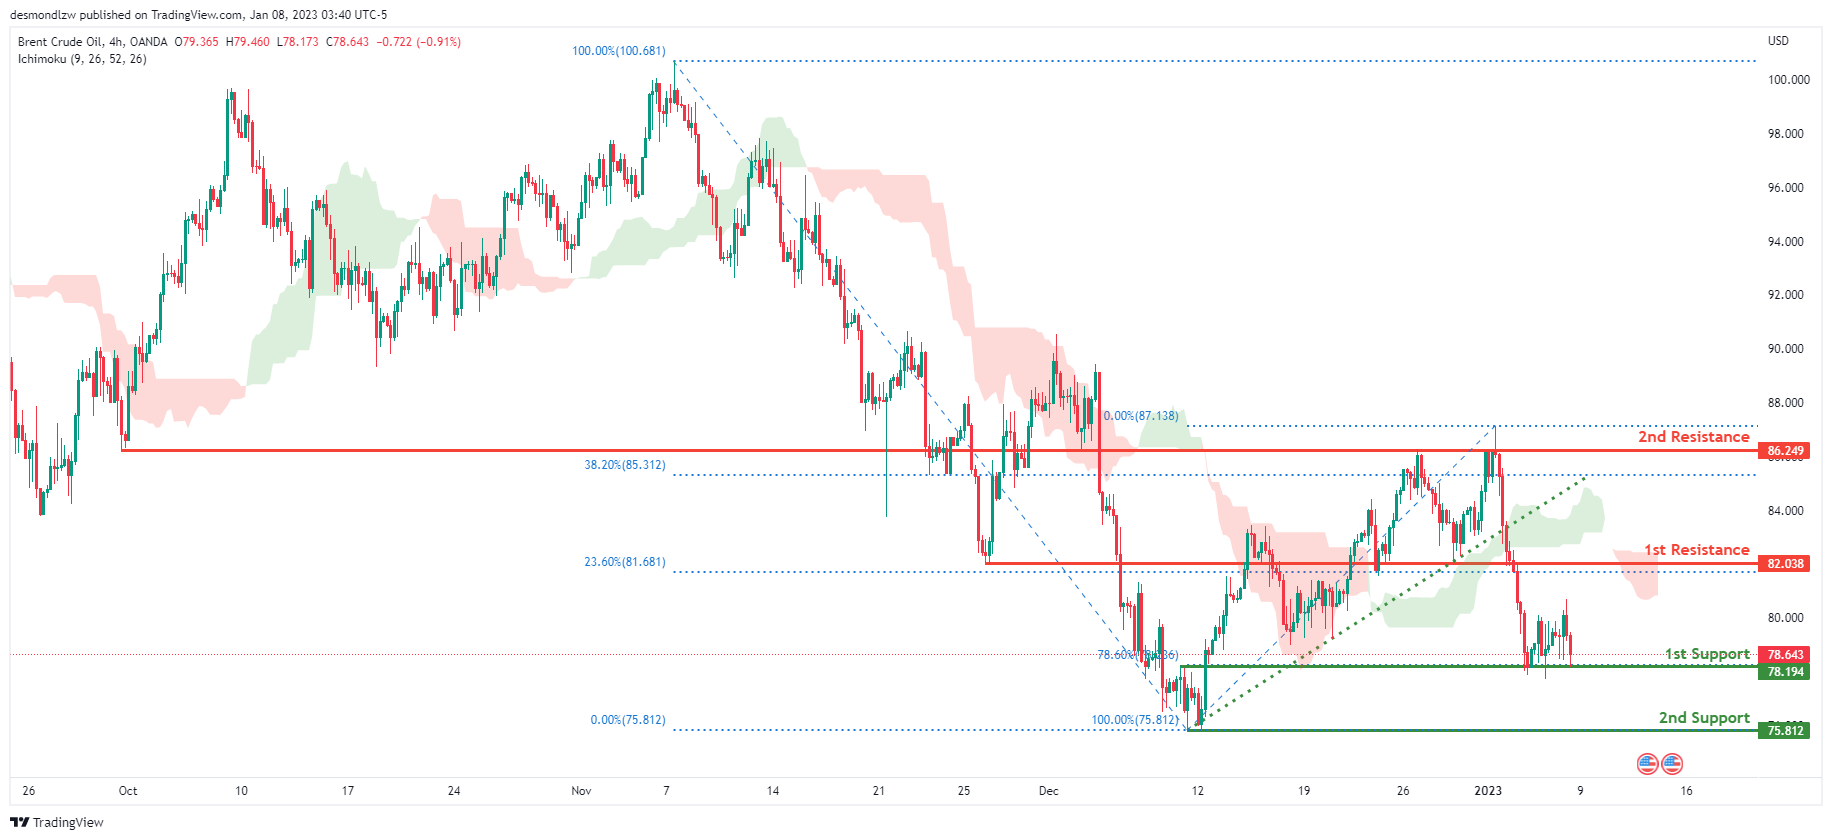
Looking at the H4 chart, my overall bias for BCOUSD is bearish due to the current price crossing below the Ichimoku cloud, indicating a bearish market. Adding more confluence to this bias, price has also broken the ascending trend line. If this bearish momentum continues, expect the price to possibly break the 1st support at 78.194, where the 78.6% Fibonacci line is before heading towards the 2nd support at 75.812, where the previous swing low is. In an alternate scenario, price could possibly head back up to retest the 1st resistance at 82.038, where the 23.6% Fibonacci line is
Areas of consideration:
- H4 time frame, 1st resistance at 82.038
- H4 time frame, 1st support at 78.194
- H4 time frame, 2nd support at 75.812
Dow Jones Industrial Average:
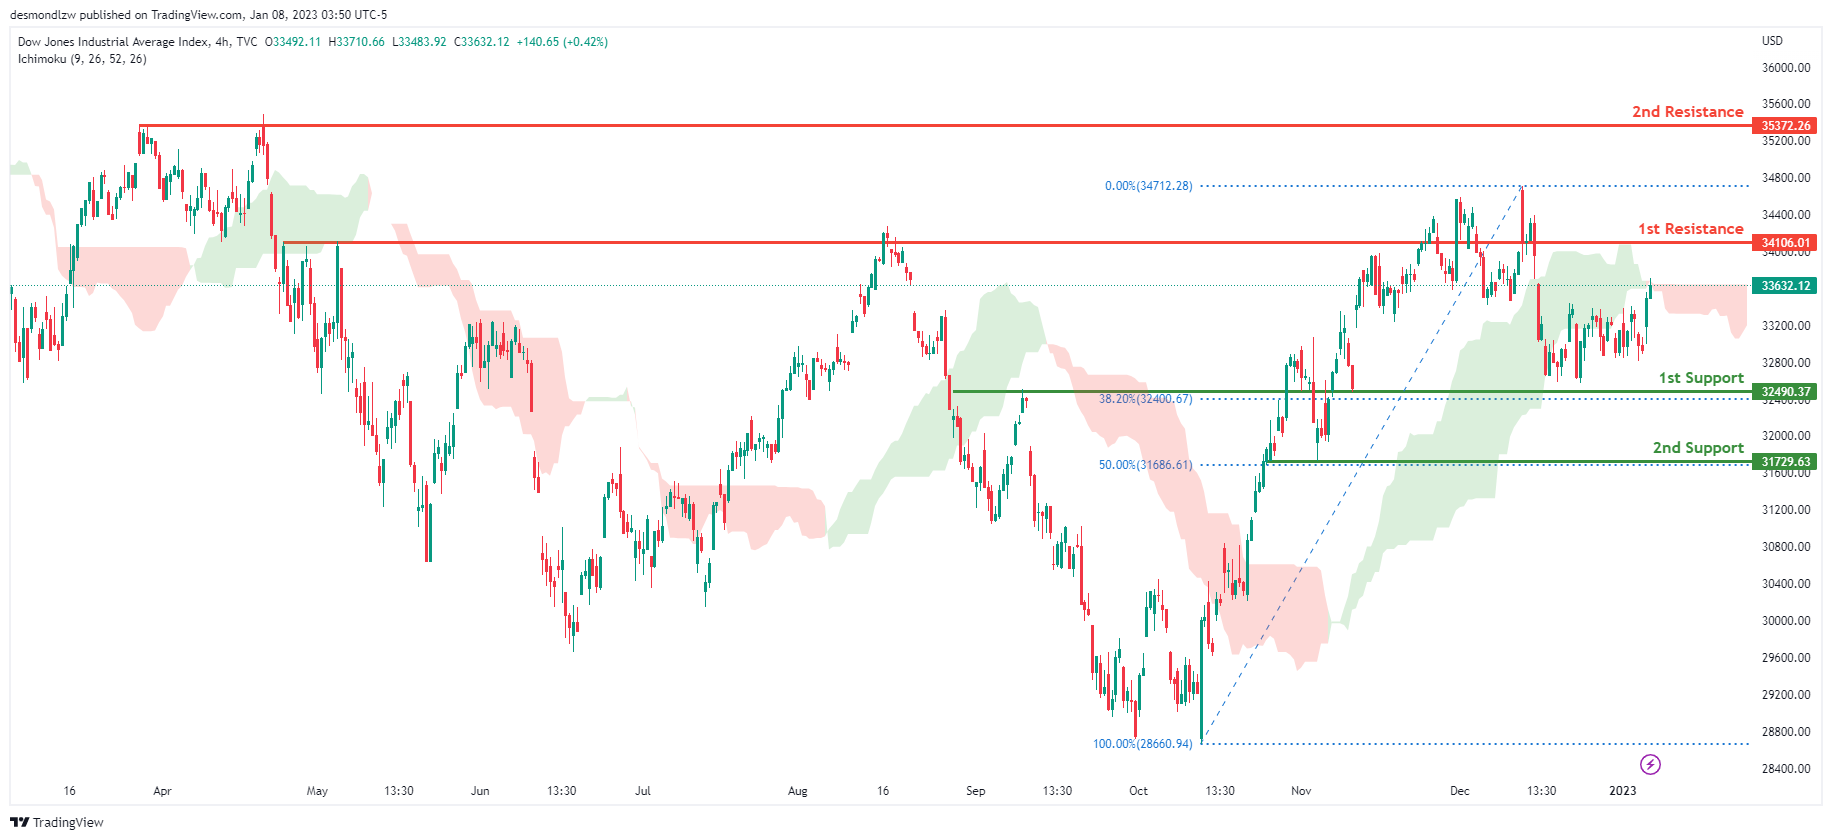
On the H4 chart, the overall bias for DJI is bearish. To add confluence to this, the price is crossing below the Ichimoku cloud which indicates a bearish market. If this bearish momentum continues, expect the price to head back down towards the 1st support at 32490.37, where the 61.8% Fibonacci line is. In an alternative scenario, price could possibly break the 1st resistance line at 34106.01, where the previous swing high is before heading towards the 2nd resistance line at 35492.22, where the previous swing high is.
Areas of consideration:
- H4 time frame, 1st support at 32490.37
- H4 time frame, 1st Resistance at 34106.01
- H4 time frame, 2nd Resistance at 35492.22
DAX:
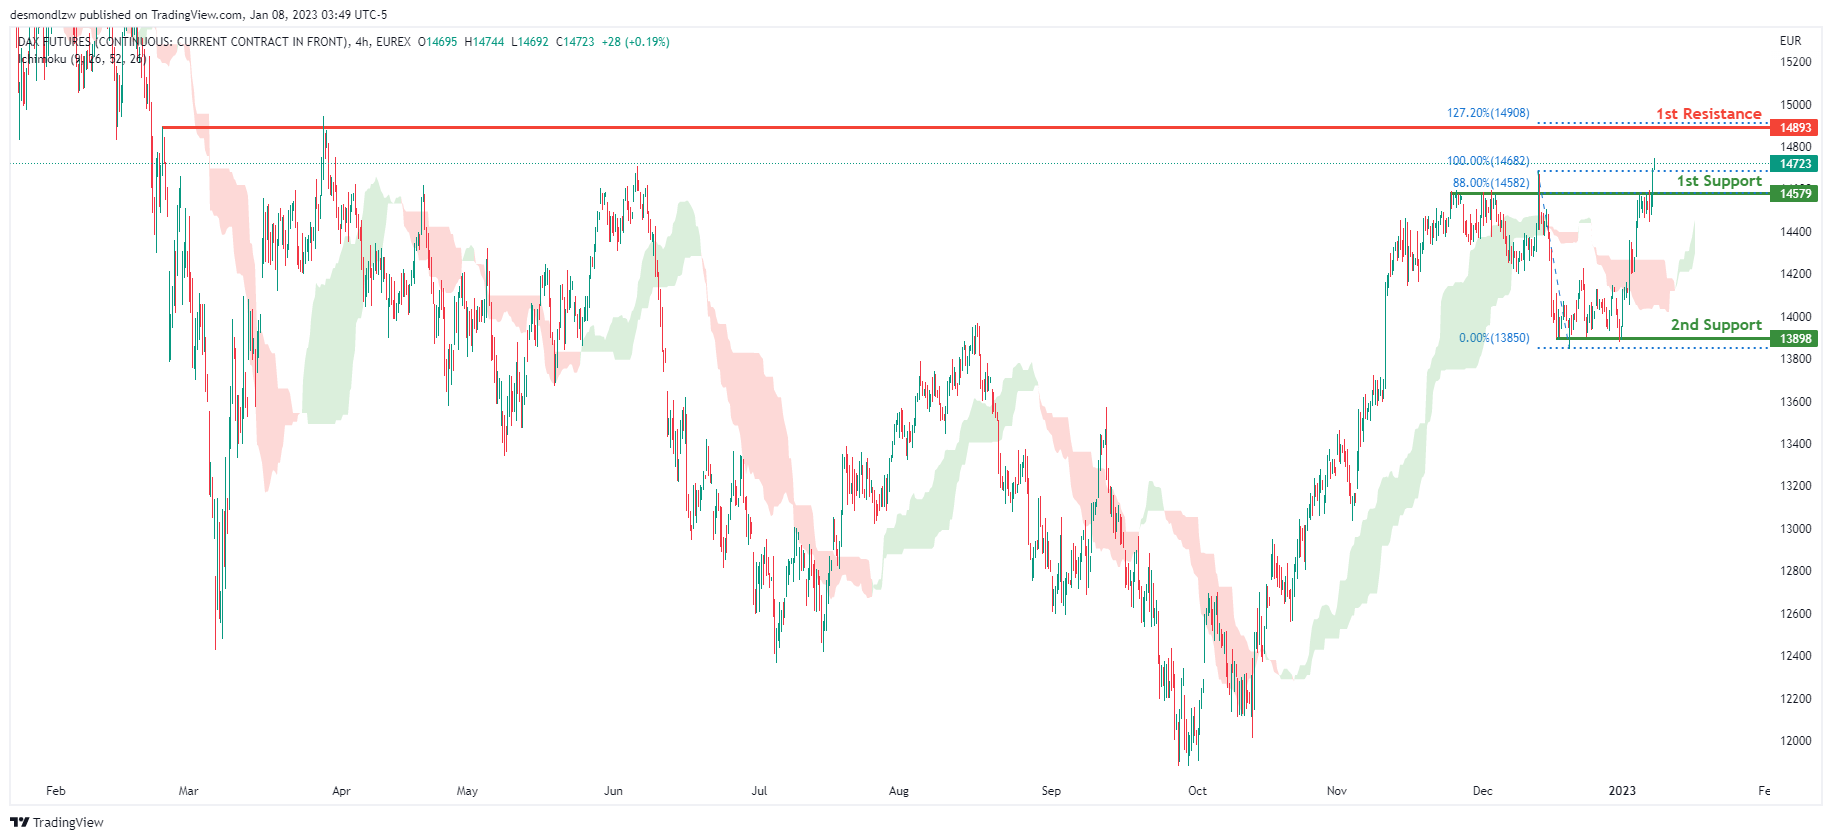
Looking at the H4 chart, my overall bias for DAX is bullish due to the current price crossing above the Ichimoku cloud, indicating a bullish market. If this bullish momentum continues, expect the price to possibly head towards the 1st resistance line at 14893, where the 127.2% Fibonacci extension line is. In an alternative scenario, price could possibly head down to retest the 1st support at 14579, where the 88% Fibonacci line is.
Areas of consideration:
- H4 time frame, 1st resistance is at 14893
- H4 time frame, 1st support is at 14579
ETHUSD:
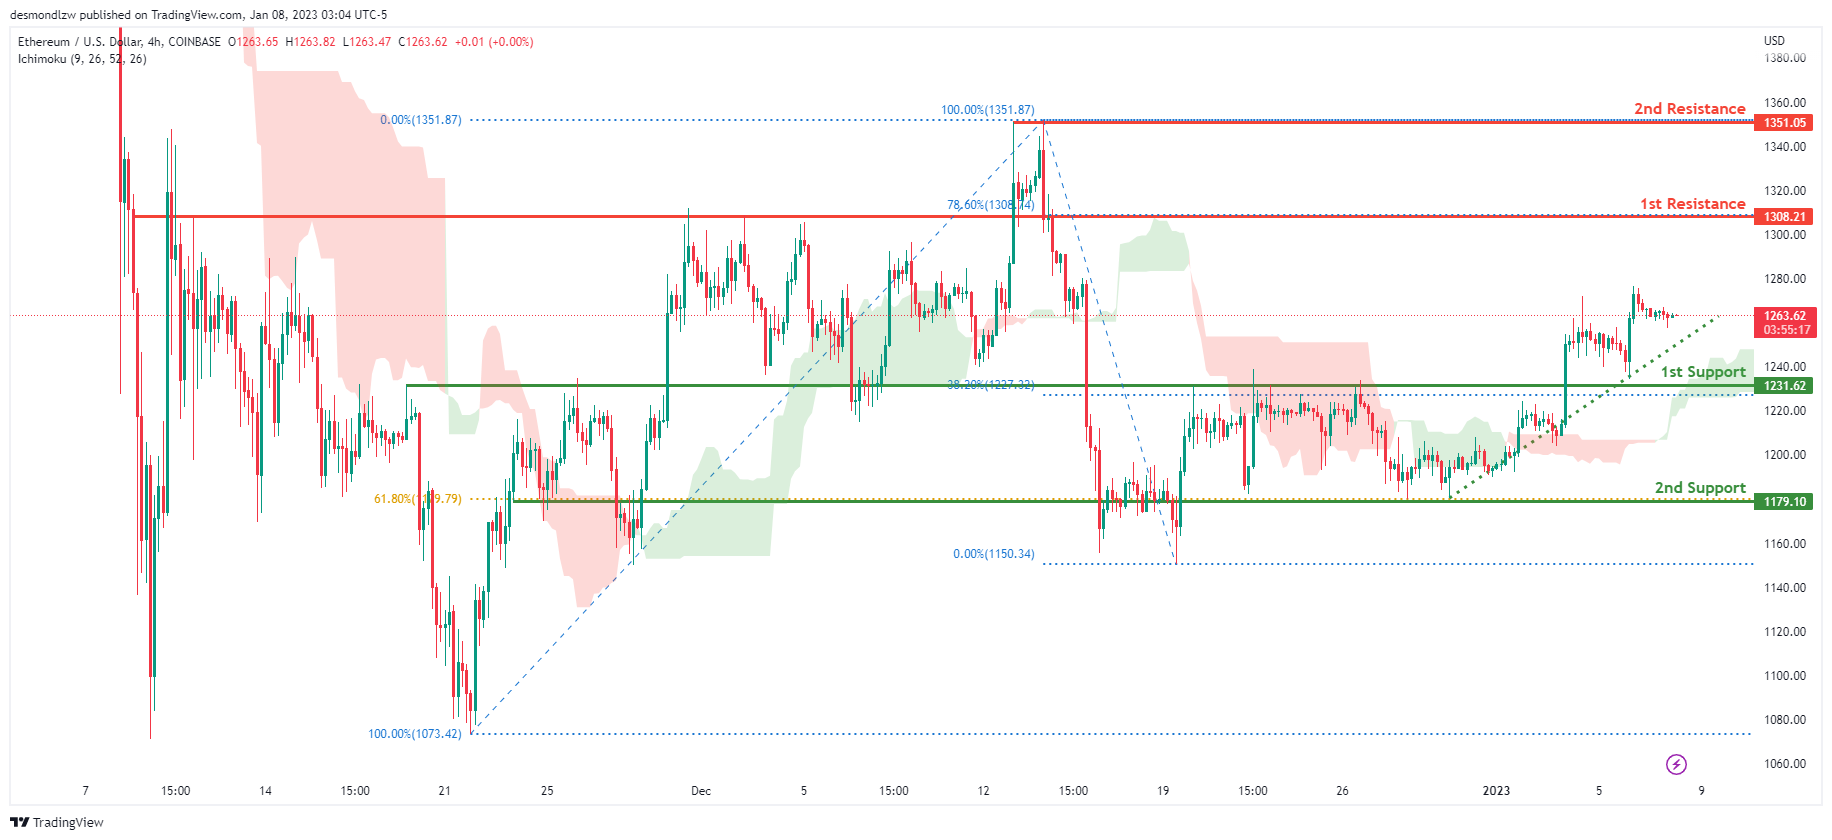
Looking at the H4 chart, my overall bias for ETHUSD is bullish due to the current price crossing above the Ichimoku cloud, indicating a bullish market. To add support to this bias, price is also climbing along an ascending trendline. If this bullish momentum continues, expect the price to head towards the 1st resistance at 1308.21, where the 78.6% Fibonacci line is. In an alternative scenario, price could head back down to retest the 1st support at 1231.62, where the 38.2% Fibonacci line is.
Areas of consideration:
- H4 time frame, 1st resistance of 1308.21
- H4 time frame, 1st support at 1231.62
BTCUSD:
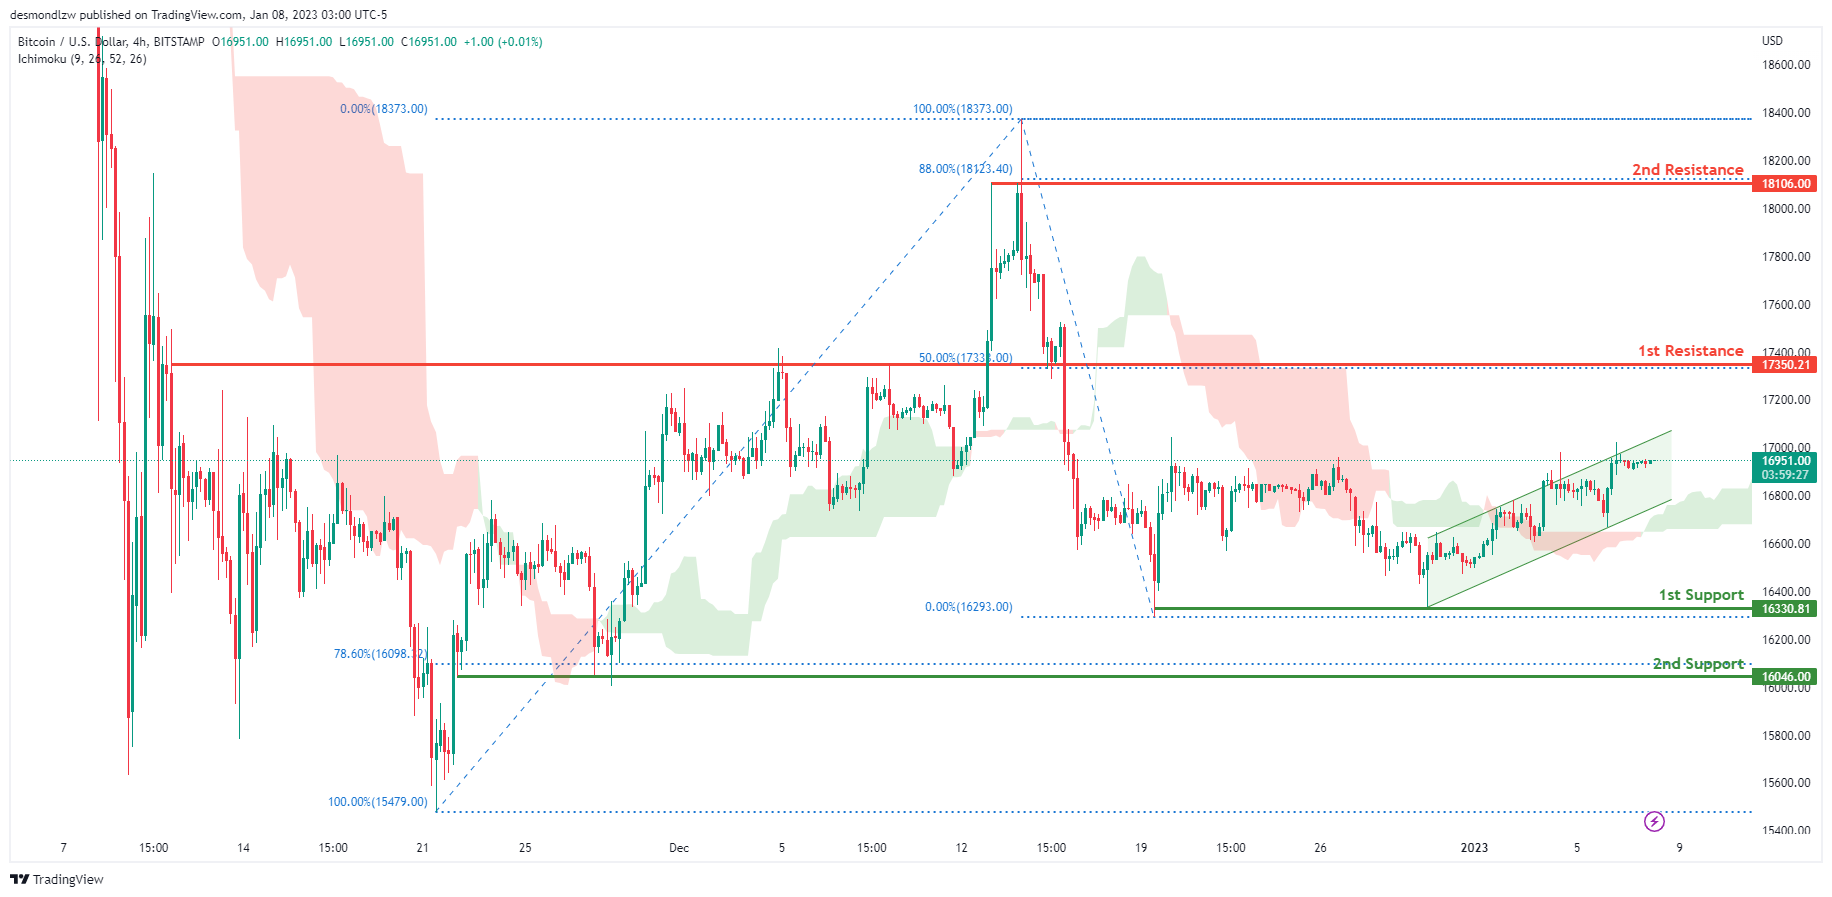
Looking at the H4 chart, my overall bias for BTCUSD is bullish due to the current price being above the Ichimoku cloud, indicating a bullish market. To add support to this bias, price is also within a bullish ascending channel. If this bullish momentum continues, expect the price to possibly continue heading towards the 1st resistance at 17350.21, where the 50% Fibonacci line is. In an alternative scenario, price could possibly head back down towards the 1st support at 16330.81, where the recent low and liquidity hotspot are.
Areas of consideration:
- H4 time frame, 1st resistance 17350.21
- H4 time frame, 1st support at 16330.81
S&P 500:
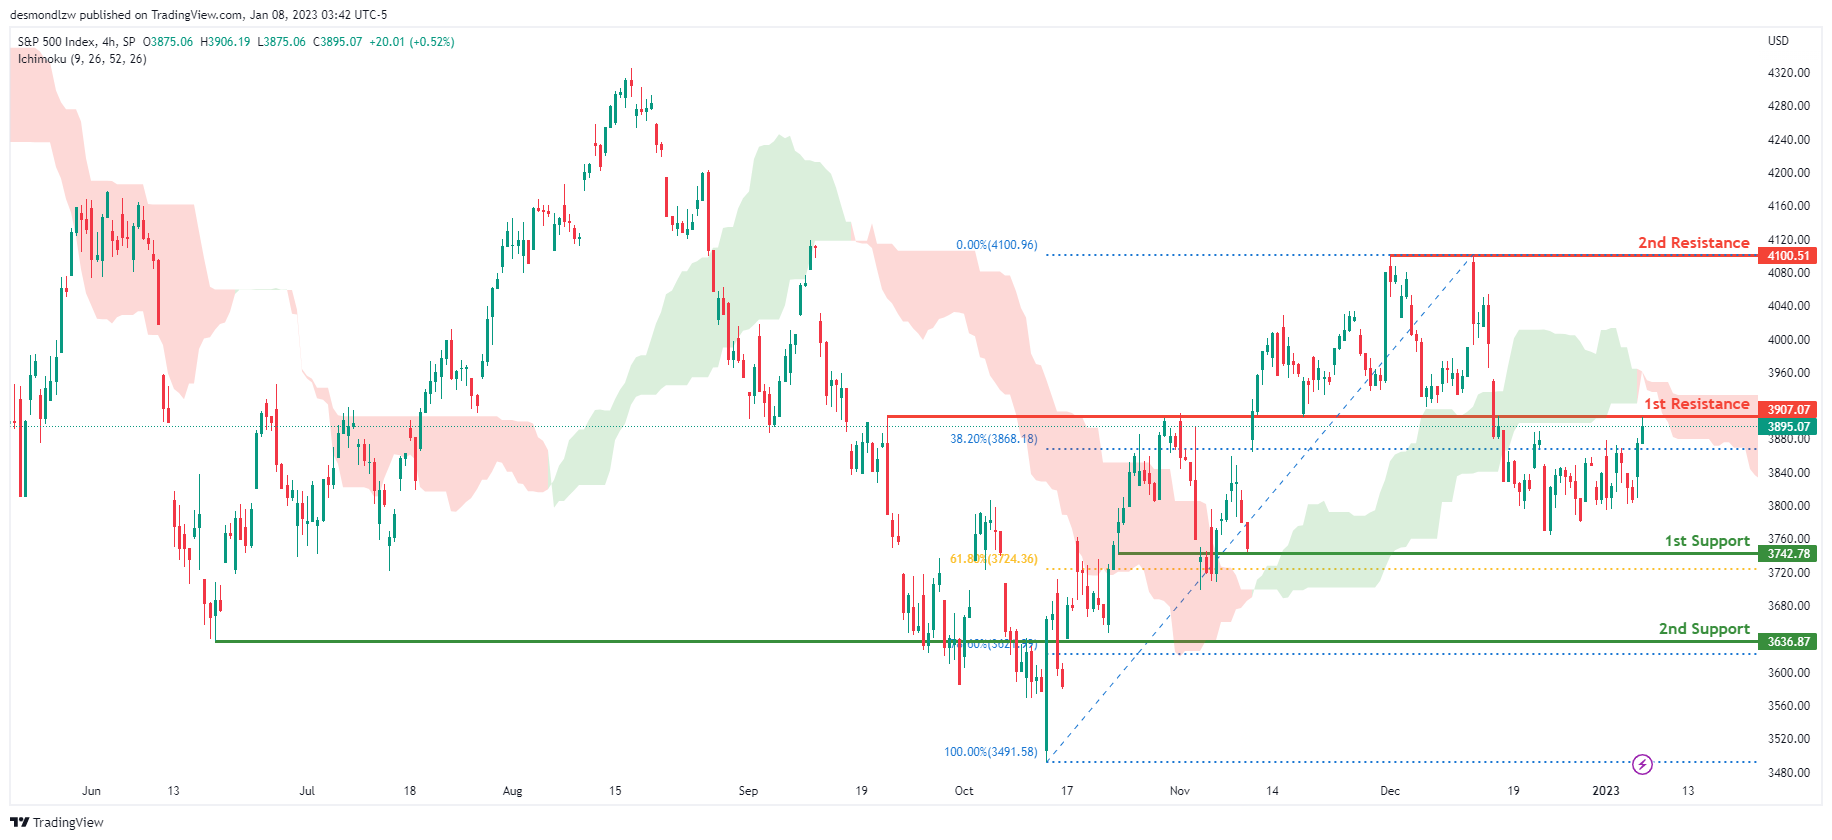
Looking at the H4 chart, my overall bias for S&P500 is bearish due to the current price being below the Ichimoku cloud, indicating a bearish market. If this bearish momentum continues, expect the price to continue heading towards the 1st support at 3742.78, where the 61.8% Fibonacci line is. In an alternative scenario, price could possibly head back up to retest the 1st resistance at 3907.07, where the 38.2% Fibonacci line is.
Areas of consideration:
- H4 time frame, 1st support at 3742.78
- H4 time frame, 1st resistance at 3907.07
EUR/USD Could Rally If It Clears This Hurdle
Key Highlights
- EUR/USD is eyeing an upside break above the 1.0700 resistance.
- A connecting bearish trend line is forming with resistance near 1.0710 on the 4-hours chart.
- GBP/USD is aiming a fresh increase above the 1.2200 level.
- The Euro Zone Unemployment Rate could remain at 6.5% in Nov 2022.
EUR/USD Technical Analysis
The Euro corrected lower below the 1.0550 level against the US Dollar. EUR/USD tested the 1.0480 zone and recently started a fresh increase.
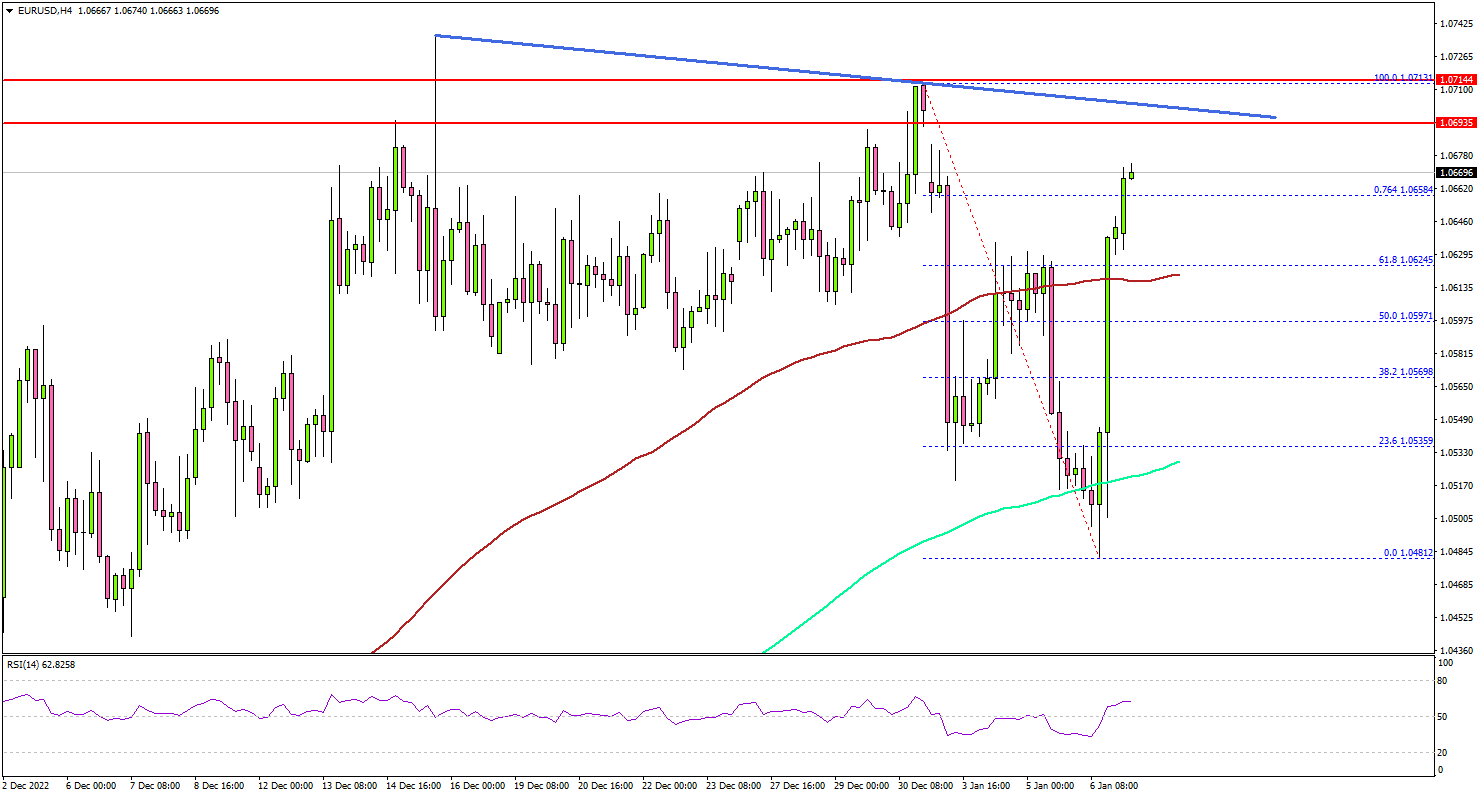
Looking at the 4-hours chart, the pair traded as low as 1.0481 and climbed higher. There was a move above the 1.0550 and 1.0600 resistance levels. The bulls were able to push the pair above the 50% Fib retracement level of the downward move from the 1.0713 swing high to 1.0481 low.
The pair is now trading above the 1.0620 level, the 100 simple moving average (red, 4-hours), and the 200 simple moving average (green, 4-hours).
On the upside, an initial resistance is near the 1.0700 level. There is also a connecting bearish trend line forming with resistance near 1.0710 on the on the same chart. The next major resistance may perhaps be near 1.0720.
A clear move above the 1.0720 resistance might start a steady increase. In the stated case, EUR/USD might start a steady increase. In the stated case, the pair could rise towards the 1.0800 level.
On the downside, there is a key support at 1.0620 and the 100 simple moving average (red, 4-hours). The main support is now forming near the 1.0550 level. A downside break below the 1.0550 zone might push the pair lower.
The next major support sits near the 1.0500 level. Any more losses might open the doors for a move towards the 1.0450 support zone.
Looking at GBP/USD, the pair is rising steadily and there are chances of a move above the 1.2200 resistance zone in the coming sessions.
Economic Releases
- Euro Zone Unemployment Rate for Nov 2022 - Forecast 6.5%, versus 6.5% previous.
- Euro Zone Sentix Investor Confidence for Jan 2022 - Forecast -11.1, versus -21 previous.
Yuan surges as China reopens, HSI higher
Asian markets are trading higher (Japan is on holiday), following last week's rally in global markets. Expectations on slower Fed tightening is a factor supporting risk-on sentiment. Meanwhile, China is finally reopening borders, allowing opened sea and land crossings with Hong Kong and ended a requirement for incoming travellers to quarantine. The Chinese Yuan also rises to the highest level since August.
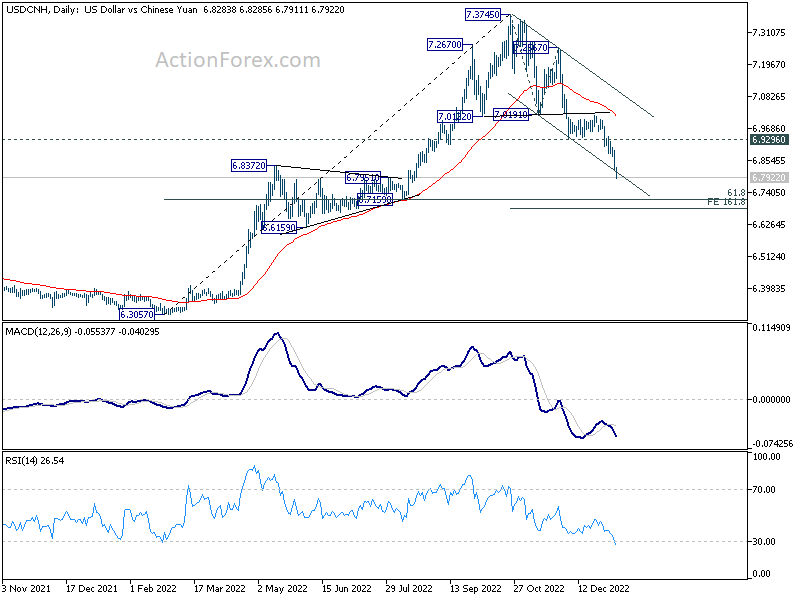
USD/CNH's chart displayed a text-book head and shoulder top development, with recovery capped by the neckline, followed by accelerated downside movement. With break of the medium term channel support, the fall from 7.3745 should be a down trend of the same scale as the rise from 6.3057. Outlook will now stay bearish as long as 6.9296 support turned resistance holds. Next target should be 161.8% projection of 7.3745 to 7.0191 from 7.2567 at 6.6817.
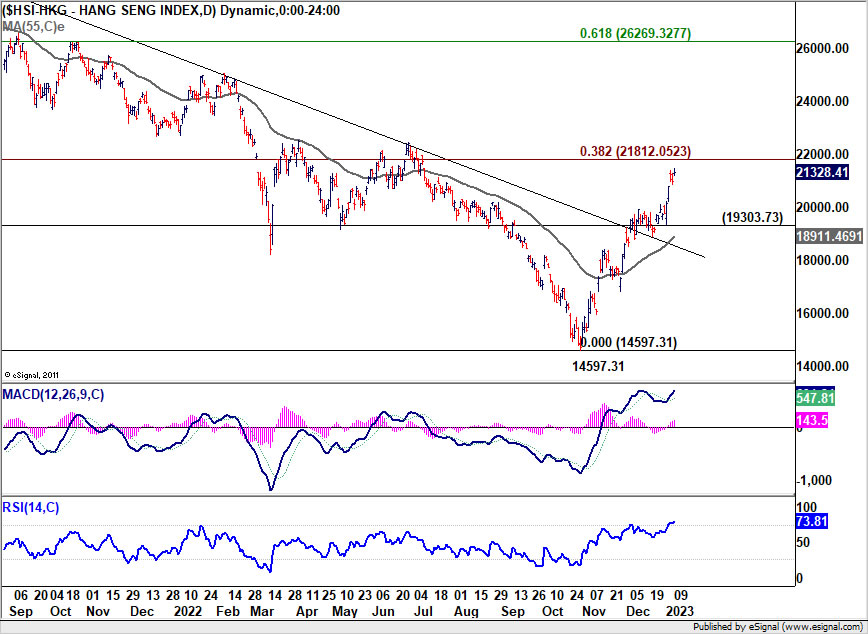
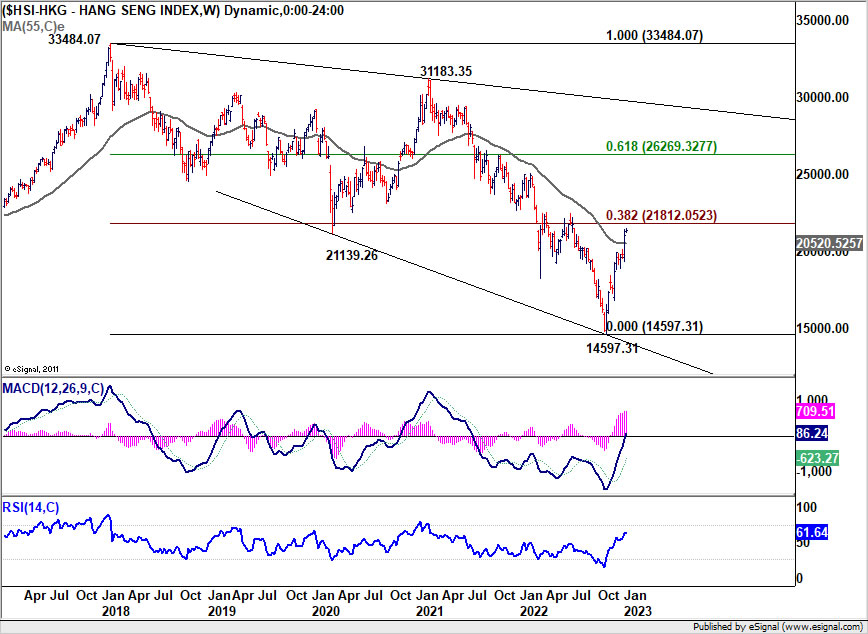
Hong Kong HSI is now extending the rally from 14597.31, but will soon face an important fibonacci level at 21812.05, 38.2% retracement of 33484.07 (2018 high) to 14597.31 (2022 low). Sustained break there will argue that it's already reversing the five-year bear market. Nevertheless, rejection from there, followed by break of 19303.73 support will maintain medium term bearishness for down trend resumption at a later stage.
BoE Mann: Energy caps allow reorientation of spending, and higher inflation elsewhere
BoE MPC member Catherine Mann "The caps on energy prices allow the reorientation of spending to the rest of the consumption basket and thus potentially higher inflation than otherwise would be the case in all those other products... That's something we look at carefully."
"What's going to happen when the caps are removed?" she asked. "Will inflation kind of bounce back? What will the energy prices be at that time? We don't know."
Mann was a hawk who voted for a 75bps rate hike at the December meeting. At the meeting, BoE decided to hike by 50bps in a 6-3 vote, with two members voted for no change.
CHFJPY Selling The Rallies After Elliott Wave Double Three
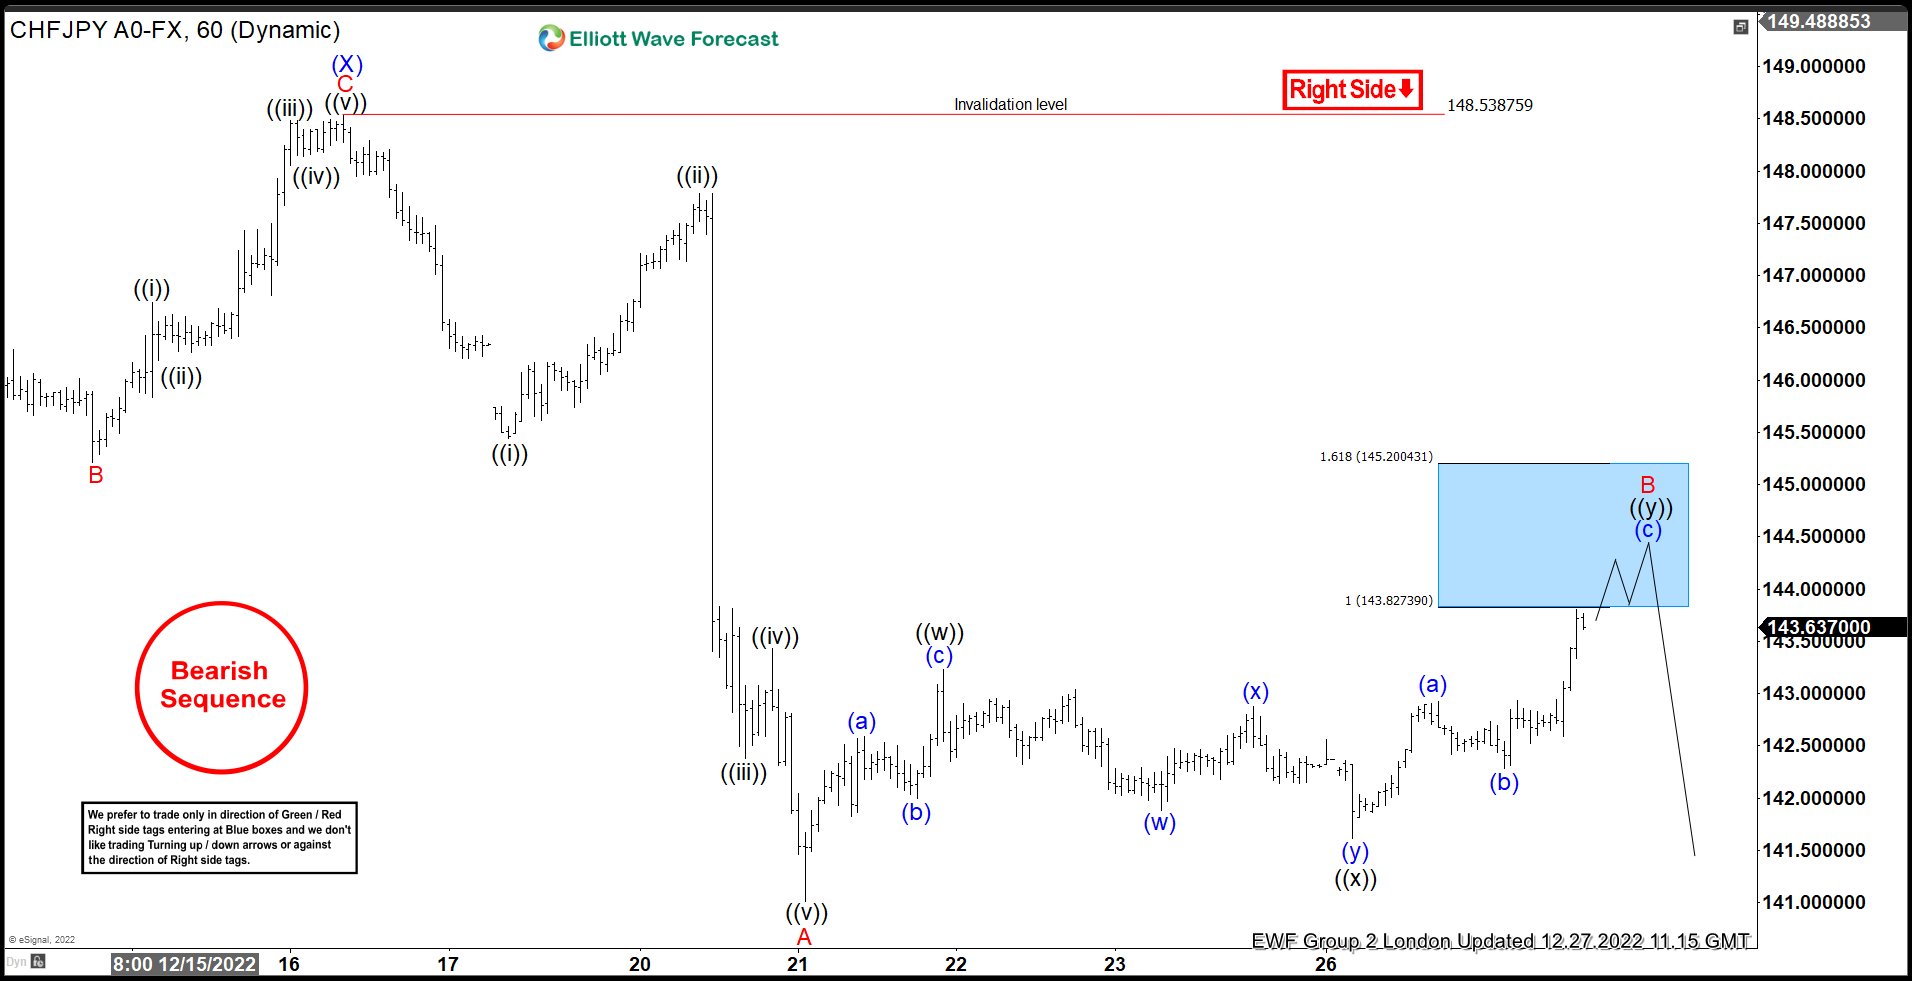
Hello fellow traders. In this technical article we’re going to take a look at the Elliott Wave charts charts of CHFJPY published in members area of the website. Recently the pair made short term recovery against the 148.53 8 peak that has unfolded as Elliott Wave Double Three Pattern. It made clear 7 swings from the lows and completed at the Blue Box ( selling zone) . In further text we’re going to explain the Elliott Wave pattern and trading setup
Before we take a look at the real market example, let’s explain Elliott Wave Double Three pattern.
Elliott Wave Double Three Pattern
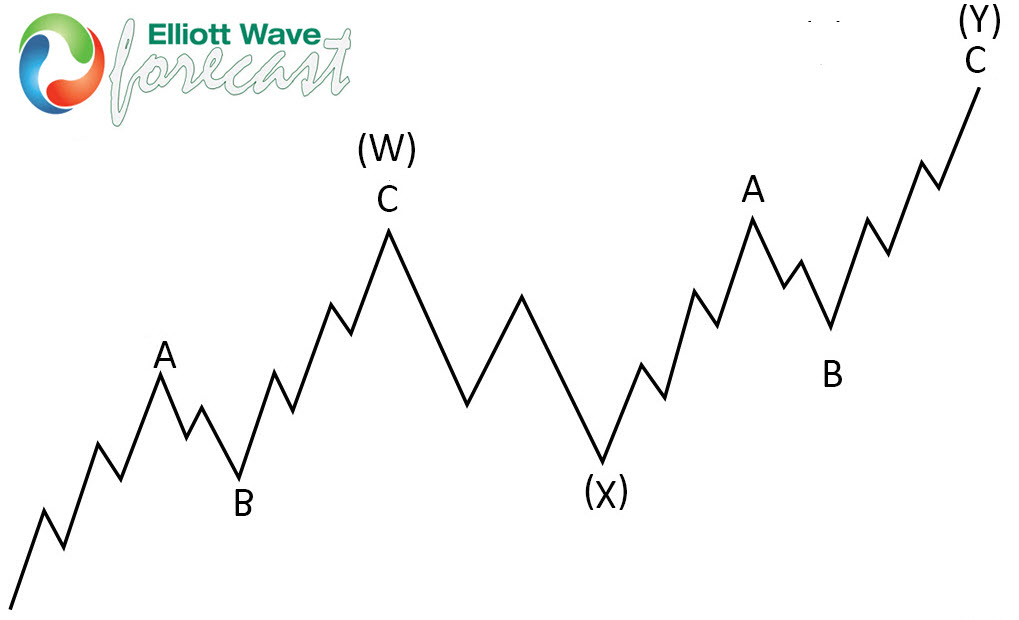
Double three is the common pattern in the market , also known as 7 swing structure. It’s a reliable pattern which is giving us good trading entries with clearly defined invalidation levels.
The picture below presents what Elliott Wave Double Three pattern looks like. It has (W),(X),(Y) labeling and 3,3,3 inner structure, which means all of these 3 legs are corrective sequences. Each (W) and (Y) are made of 3 swings , they’re having A,B,C structure in lower degree, or alternatively they can have W,X,Y labeling.
CHFJPY 1h Hour Elliott Wave Analysis 12.27.2022
CHFJPY is giving us B red recovery against the 148.538 peak. Correction is unfolding as Elliott Wave Double Three Pattern with ((w))((x))((y)) black inner labeling. We can see that each leg has corrective sequences. Price structure already shows 7 swings and the pair is reaching extreme zone : 143.82-145.20. That area is marked as a Blue Box on the chart and that is our selling zone. At the marked area buyers should be ideally taking profits and sellers can appear again. Consequently , we expect to see reaction from the marked area. From mentioned zone we can get either decline toward new lows or larger 3 waves pull back at least. Once pull back reaches 50 Fibs against the ((x)) black low, we will make short position risk free ( put SL at BE) and take partial profits. Break of 1.618 fib extension: 145.2 would invalidated the trade.
CHFJPY 1h Hour Elliott Wave Analysis 1.3.2023
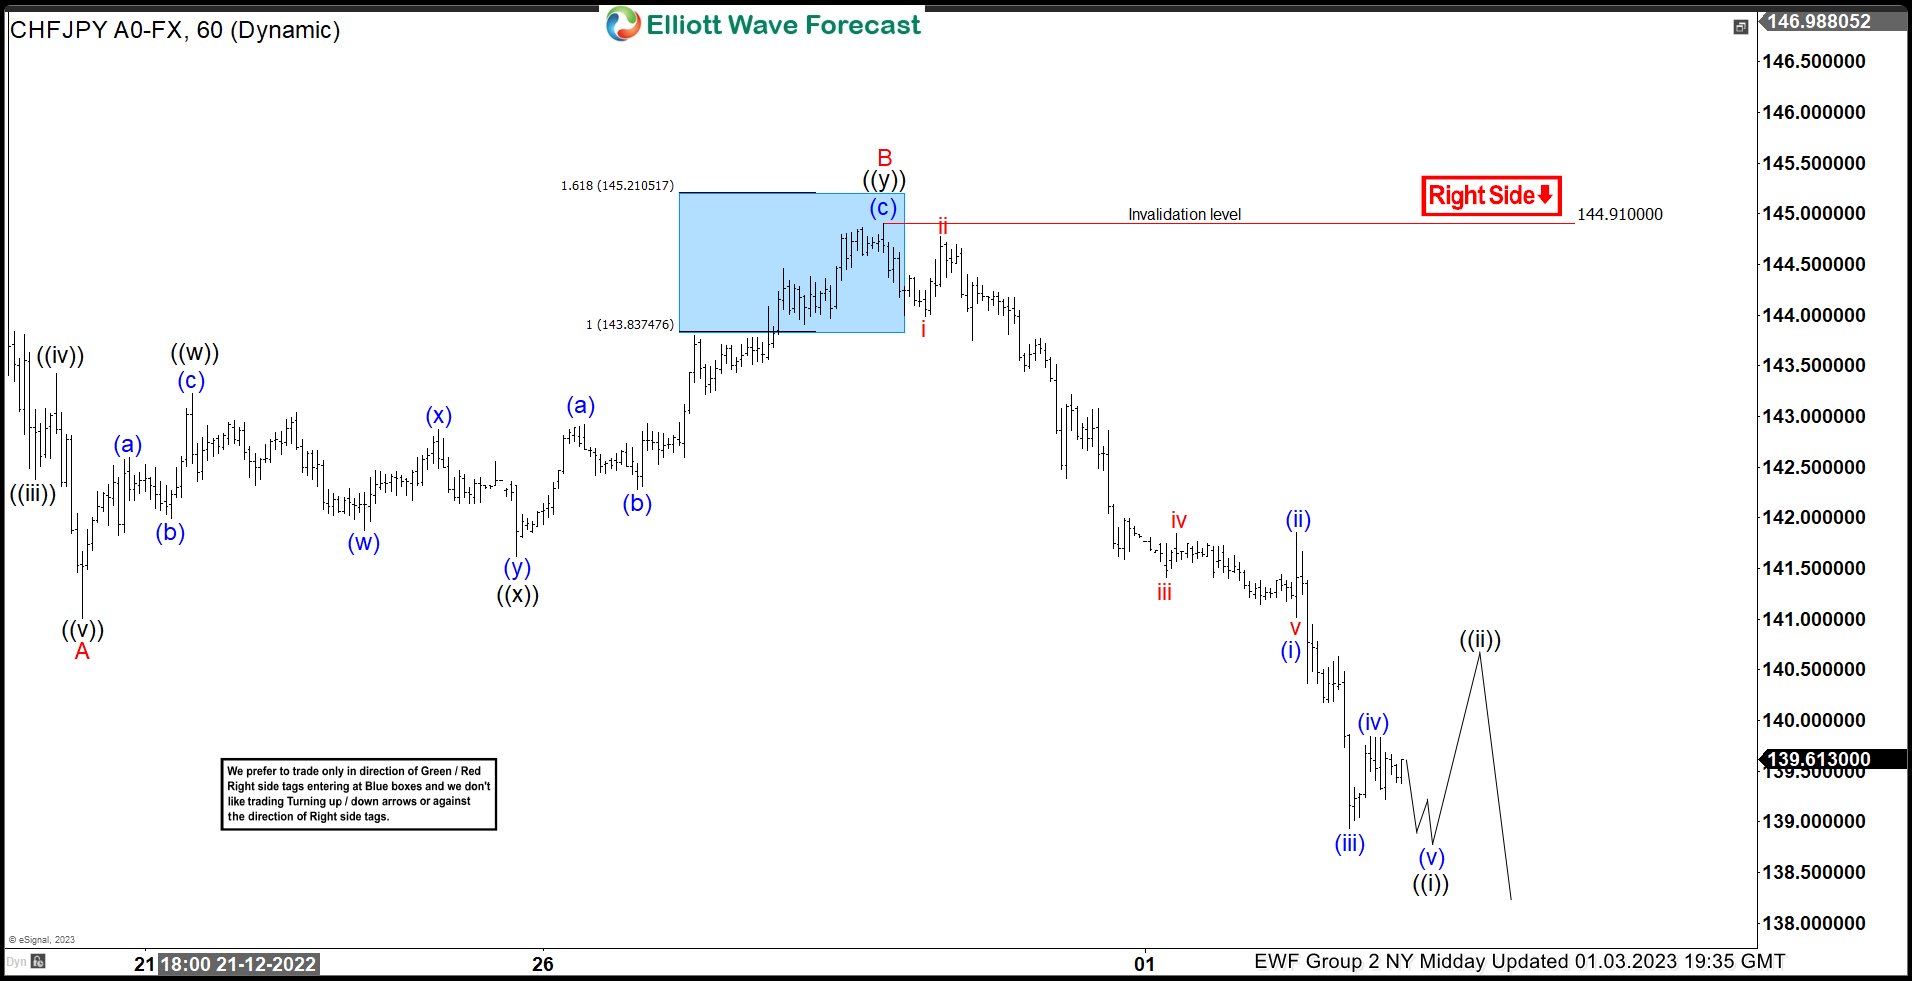
The pair found sellers right at the blue box and made decline from there toward new lows. As a result, members who took short trades mad positions risk free . ( Put SL at BE) and took partial profits. At this stage we see the pair remains bearish against the 144.91 pivot. Decline from the peak looks to be unfolding as 5 waves. As soon as the cycle completes we expect to see correction against the 144.91 peak. As far as the price stays above that level, and that pivot holds more downside can be seen in the pair once expected bounce completes.
Summary 1/9 – 1/13
Monday, Jan 9, 2023
| GMT | Ccy | Events | Consensus | Previous |
|---|---|---|---|---|
| 00:30 | AUD | Building Permits M/M Nov | 0.10% | -6.00% |
| 06:45 | CHF | Unemployment Rate Dec | 2.10% | 2.00% |
| 07:00 | EUR | Germany Industrial Production M/M Nov | 0.20% | -0.10% |
| 07:45 | EUR | France Trade Balance (EUR) Nov | -11.3B | -12.2B |
| 08:00 | CHF | Foreign Currency Reserves (CHF) Dec | 790B | |
| 09:00 | EUR | Italy Unemployment Nov | 7.80% | 7.80% |
| 09:30 | EUR | Eurozone Sentix Investor Confidence (Jan) | -17 | -21 |
| 10:00 | EUR | Unemployment Rate Nov | 6.50% | 6.50% |
| 13:30 | CAD | Building Permits M/M Nov | 0.40% | -1.40% |
| 23:30 | JPY | Tokyo CPI Core Y/Y Dec | 3.80% | 3.60% |
| 23:30 | JPY | Household Spending Y/Y Nov | 0.60% | 1.20% |
| GMT | Ccy | Events | |
|---|---|---|---|
| 00:30 | AUD | Building Permits M/M Nov | |
| Forecast: 0.10% | Previous: -6.00% | ||
| 06:45 | CHF | Unemployment Rate Dec | |
| Forecast: 2.10% | Previous: 2.00% | ||
| 07:00 | EUR | Germany Industrial Production M/M Nov | |
| Forecast: 0.20% | Previous: -0.10% | ||
| 07:45 | EUR | France Trade Balance (EUR) Nov | |
| Forecast: -11.3B | Previous: -12.2B | ||
| 08:00 | CHF | Foreign Currency Reserves (CHF) Dec | |
| Forecast: | Previous: 790B | ||
| 09:00 | EUR | Italy Unemployment Nov | |
| Forecast: 7.80% | Previous: 7.80% | ||
| 09:30 | EUR | Eurozone Sentix Investor Confidence (Jan) | |
| Forecast: -17 | Previous: -21 | ||
| 10:00 | EUR | Unemployment Rate Nov | |
| Forecast: 6.50% | Previous: 6.50% | ||
| 13:30 | CAD | Building Permits M/M Nov | |
| Forecast: 0.40% | Previous: -1.40% | ||
| 23:30 | JPY | Tokyo CPI Core Y/Y Dec | |
| Forecast: 3.80% | Previous: 3.60% | ||
| 23:30 | JPY | Household Spending Y/Y Nov | |
| Forecast: 0.60% | Previous: 1.20% | ||
Tuesday, Jan 10, 2023
| GMT | Ccy | Events | Consensus | Previous |
|---|---|---|---|---|
| 00:01 | GBP | BRC Like-For-Like Retail Sales Y/Y Dec | 4.10% | |
| 07:45 | EUR | France Industrial Output M/M Nov | 0.90% | -2.60% |
| 11:00 | USD | NFIB Business Optimism Index Dec | 91.6 | 91.9 |
| 15:00 | USD | Wholesale Inventories Nov F | 1.00% | 1.00% |
| GMT | Ccy | Events | |
|---|---|---|---|
| 00:01 | GBP | BRC Like-For-Like Retail Sales Y/Y Dec | |
| Forecast: | Previous: 4.10% | ||
| 07:45 | EUR | France Industrial Output M/M Nov | |
| Forecast: 0.90% | Previous: -2.60% | ||
| 11:00 | USD | NFIB Business Optimism Index Dec | |
| Forecast: 91.6 | Previous: 91.9 | ||
| 15:00 | USD | Wholesale Inventories Nov F | |
| Forecast: 1.00% | Previous: 1.00% | ||
Wednesday, Jan 11, 2023
| GMT | Ccy | Events | Consensus | Previous |
|---|---|---|---|---|
| 00:30 | AUD | Retail Sales M/M Nov | 0.70% | -0.20% |
| 00:30 | AUD | CPI Y/Y Nov | 6.90% | |
| 05:00 | JPY | Leading Economic Index Nov P | 98.8 | 98.6 |
| 09:00 | EUR | Italy Retail Sales M/M Nov | 0.20% | -0.40% |
| 15:30 | USD | Crude Oil Inventories | 1.7M | |
| 21:45 | NZD | Building Permits M/M Nov | -10.70% | |
| 23:50 | JPY | Bank Lending Y/Y Dec | 2.80% | 2.70% |
| 23:50 | JPY | Current Account (JPY) Nov | 0.65T | -0.61T |
| GMT | Ccy | Events | |
|---|---|---|---|
| 00:30 | AUD | Retail Sales M/M Nov | |
| Forecast: 0.70% | Previous: -0.20% | ||
| 00:30 | AUD | CPI Y/Y Nov | |
| Forecast: | Previous: 6.90% | ||
| 05:00 | JPY | Leading Economic Index Nov P | |
| Forecast: 98.8 | Previous: 98.6 | ||
| 09:00 | EUR | Italy Retail Sales M/M Nov | |
| Forecast: 0.20% | Previous: -0.40% | ||
| 15:30 | USD | Crude Oil Inventories | |
| Forecast: | Previous: 1.7M | ||
| 21:45 | NZD | Building Permits M/M Nov | |
| Forecast: | Previous: -10.70% | ||
| 23:50 | JPY | Bank Lending Y/Y Dec | |
| Forecast: 2.80% | Previous: 2.70% | ||
| 23:50 | JPY | Current Account (JPY) Nov | |
| Forecast: 0.65T | Previous: -0.61T | ||
Thursday, Jan 12, 2023
| GMT | Ccy | Events | Consensus | Previous |
|---|---|---|---|---|
| 00:30 | AUD | Trade Balance (AUD) Nov | 11.30B | 12.22B |
| 01:30 | CNY | CPI Y/Y Dec | 1.80% | 1.60% |
| 01:30 | CNY | PPI Y/Y Dec | -0.10% | -1.30% |
| 05:00 | JPY | Eco Watchers Survey: Current Dec | 48.1 | |
| 09:00 | EUR | ECB Economic Bulletin | ||
| 13:30 | USD | Initial Jobless Claims (Jan 6) | 210K | 204K |
| 13:30 | USD | CPI M/M Dec | 0.00% | 0.10% |
| 13:30 | USD | CPI Y/Y Dec | 7.00% | 7.10% |
| 13:30 | USD | CPI Core M/M Dec | 0.30% | 0.20% |
| 13:30 | USD | CPI Core Y/Y Dec | 6.00% | |
| 15:30 | USD | Natural Gas Storage | -221B | |
| 23:50 | JPY | Money Supply M2+CD Y/Y Dec | 3.30% | 3.10% |
| GMT | Ccy | Events | |
|---|---|---|---|
| 00:30 | AUD | Trade Balance (AUD) Nov | |
| Forecast: 11.30B | Previous: 12.22B | ||
| 01:30 | CNY | CPI Y/Y Dec | |
| Forecast: 1.80% | Previous: 1.60% | ||
| 01:30 | CNY | PPI Y/Y Dec | |
| Forecast: -0.10% | Previous: -1.30% | ||
| 05:00 | JPY | Eco Watchers Survey: Current Dec | |
| Forecast: | Previous: 48.1 | ||
| 09:00 | EUR | ECB Economic Bulletin | |
| Forecast: | Previous: | ||
| 13:30 | USD | Initial Jobless Claims (Jan 6) | |
| Forecast: 210K | Previous: 204K | ||
| 13:30 | USD | CPI M/M Dec | |
| Forecast: 0.00% | Previous: 0.10% | ||
| 13:30 | USD | CPI Y/Y Dec | |
| Forecast: 7.00% | Previous: 7.10% | ||
| 13:30 | USD | CPI Core M/M Dec | |
| Forecast: 0.30% | Previous: 0.20% | ||
| 13:30 | USD | CPI Core Y/Y Dec | |
| Forecast: | Previous: 6.00% | ||
| 15:30 | USD | Natural Gas Storage | |
| Forecast: | Previous: -221B | ||
| 23:50 | JPY | Money Supply M2+CD Y/Y Dec | |
| Forecast: 3.30% | Previous: 3.10% | ||
Friday, Jan 13, 2023
| GMT | Ccy | Events | Consensus | Previous |
|---|---|---|---|---|
| 07:00 | GBP | GDP M/M Nov | -0.30% | 0.50% |
| 07:00 | GBP | Index of Services 3M/3M Nov | -0.40% | -0.10% |
| 07:00 | GBP | Manufacturing Production M/M Nov | -0.20% | 0.70% |
| 07:00 | GBP | Manufacturing Production Y/Y Nov | -5.20% | -4.60% |
| 07:00 | GBP | Industrial Production Y/Y Nov | -2.80% | -2.40% |
| 07:00 | GBP | Industrial Production M/M Nov | -0.10% | 0.00% |
| 07:00 | GBP | Goods Trade Balance (GBP) Nov | -14.9B | -14.5B |
| 09:00 | EUR | Italy Industrial Output M/M Nov | 0.40% | -1.00% |
| 10:00 | EUR | Trade Balance (EUR) Nov | -20.0B | -28.3B |
| 10:00 | EUR | Eurozone Industrial Production M/M Nov | 0.60% | -2.00% |
| 12:00 | GBP | NIESR GDP Estimate (3M) Dec | -0.30% | |
| 13:30 | USD | Import Price Index M/M Dec | -0.90% | -0.60% |
| 15:00 | USD | Michigan Consumer Sentiment Index Jan P | 61.6 | 59.7 |
| GMT | Ccy | Events | |
|---|---|---|---|
| 07:00 | GBP | GDP M/M Nov | |
| Forecast: -0.30% | Previous: 0.50% | ||
| 07:00 | GBP | Index of Services 3M/3M Nov | |
| Forecast: -0.40% | Previous: -0.10% | ||
| 07:00 | GBP | Manufacturing Production M/M Nov | |
| Forecast: -0.20% | Previous: 0.70% | ||
| 07:00 | GBP | Manufacturing Production Y/Y Nov | |
| Forecast: -5.20% | Previous: -4.60% | ||
| 07:00 | GBP | Industrial Production Y/Y Nov | |
| Forecast: -2.80% | Previous: -2.40% | ||
| 07:00 | GBP | Industrial Production M/M Nov | |
| Forecast: -0.10% | Previous: 0.00% | ||
| 07:00 | GBP | Goods Trade Balance (GBP) Nov | |
| Forecast: -14.9B | Previous: -14.5B | ||
| 09:00 | EUR | Italy Industrial Output M/M Nov | |
| Forecast: 0.40% | Previous: -1.00% | ||
| 10:00 | EUR | Trade Balance (EUR) Nov | |
| Forecast: -20.0B | Previous: -28.3B | ||
| 10:00 | EUR | Eurozone Industrial Production M/M Nov | |
| Forecast: 0.60% | Previous: -2.00% | ||
| 12:00 | GBP | NIESR GDP Estimate (3M) Dec | |
| Forecast: | Previous: -0.30% | ||
| 13:30 | USD | Import Price Index M/M Dec | |
| Forecast: -0.90% | Previous: -0.60% | ||
| 15:00 | USD | Michigan Consumer Sentiment Index Jan P | |
| Forecast: 61.6 | Previous: 59.7 | ||
Dollar Selling Re-emerged on Surprisingly Positive Risk Sentiment
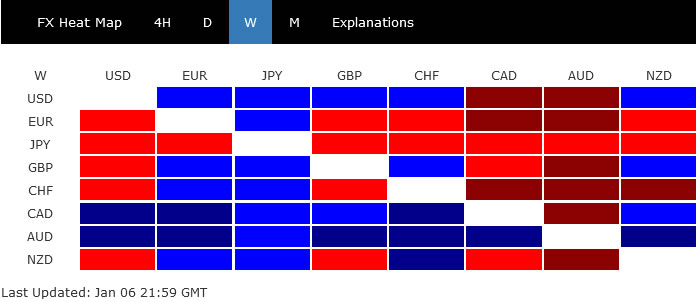
Risk sentiment was surprisingly positive in the first week of the year. The stock markets ended on a high note after slowing wage growth in the US and faster cooling in Eurozone inflation. After some flip-flopping, Dollar selling re-emerged in the last session. It might take a week or two more to confirm the overall sentiment. If risk-on sentiment is too persist, the greenback would likely be pressured ahead.
Overall, Yen was the worst performer of the week, followed by Euro and then Dollar. Aussie was the strongest one on risk sentiment, and rumor of easing trade restriction by China. Canadian Dollar was second best as support by its own strong job data. Others ended mixed.
Dow rose as bad news became good news
Apparently, bad news is now good news for the markets. In the US, traders initially hesitated to act on stronger than expected non-farm payroll growth, even though unemployment rate also dropped back to five-decade lows. Slower than expected wages growth was the factor pulling traders back. Then, investors cheered the worse than expected ISM services data which indicated contraction and hit the worst level since 2009.
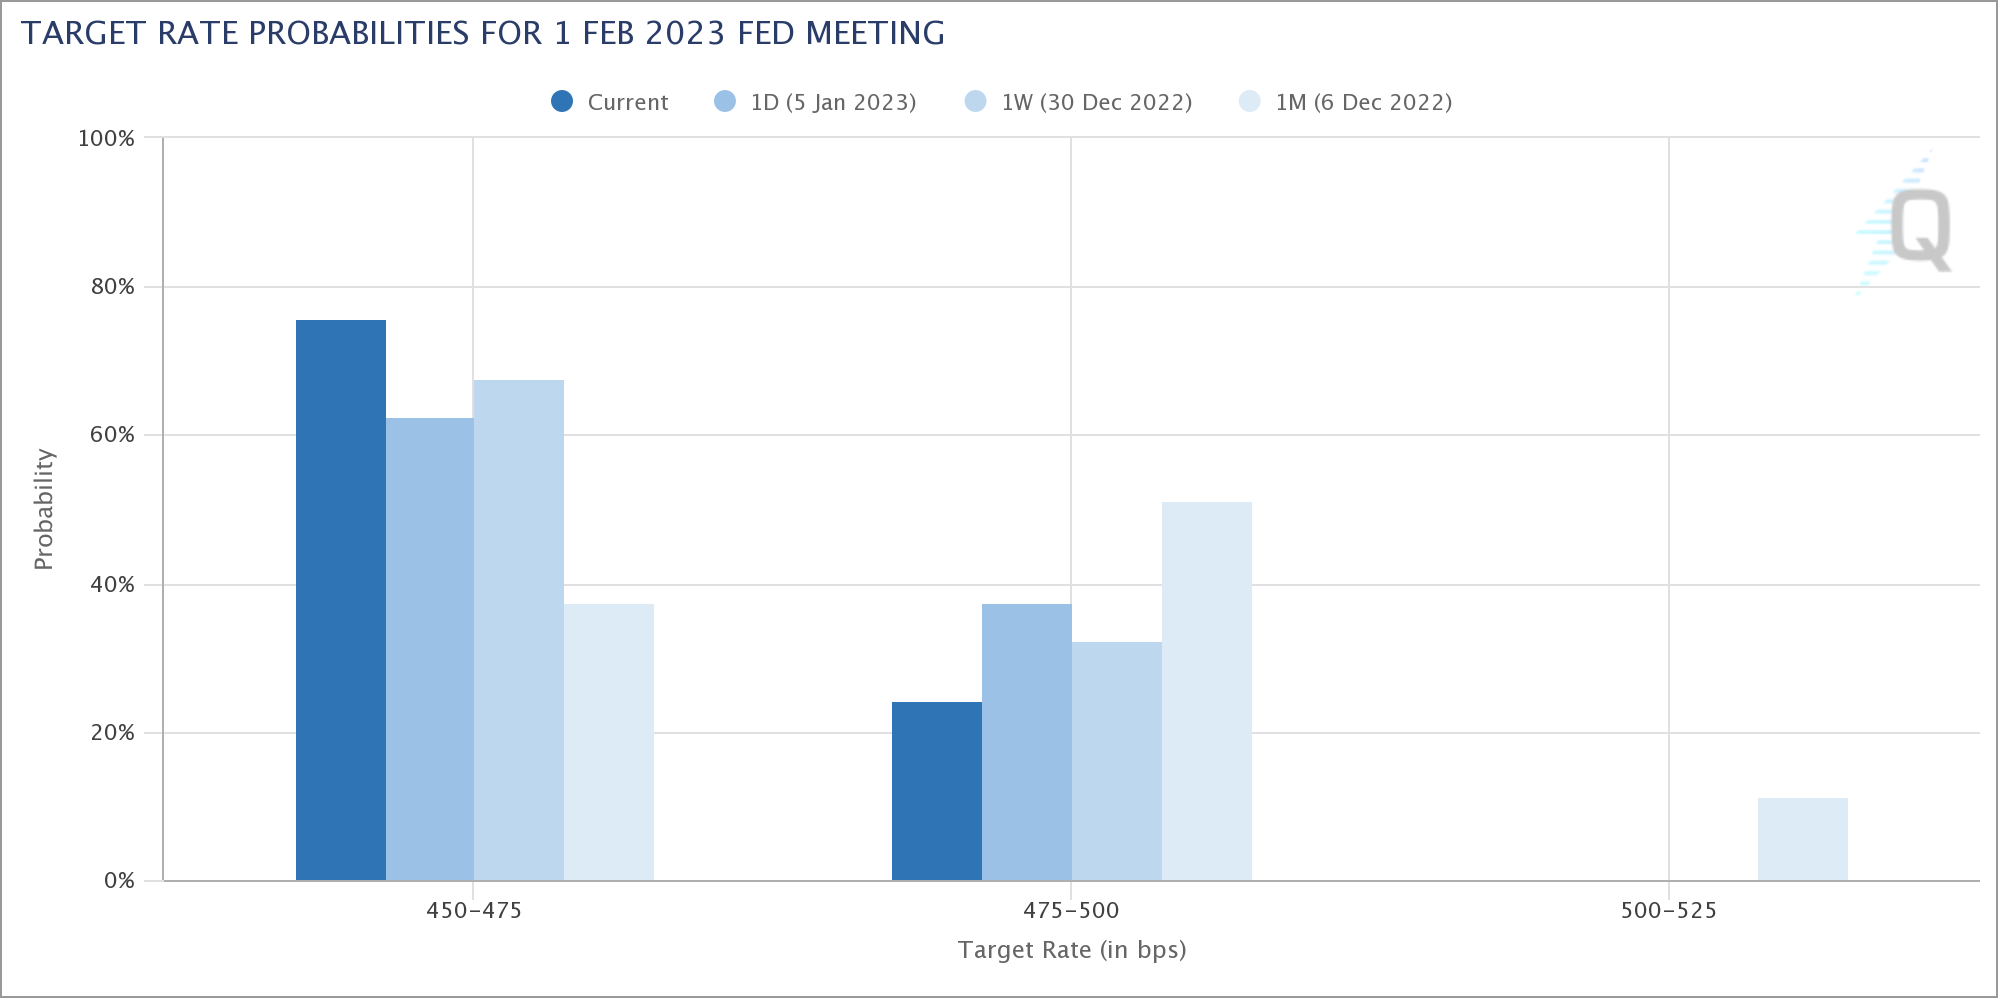
The net result could be slower tightening by Fed ahead, with possibility of a lower than 5% terminal rate. Indeed, fed fund futures are now pricing in 76% chance of just a 25bps hike at the February 1 FOMC meeting, up from 37% a month ago. But of course, there is still another set of inflation data before the meeting, and thus, the expectations could still change.
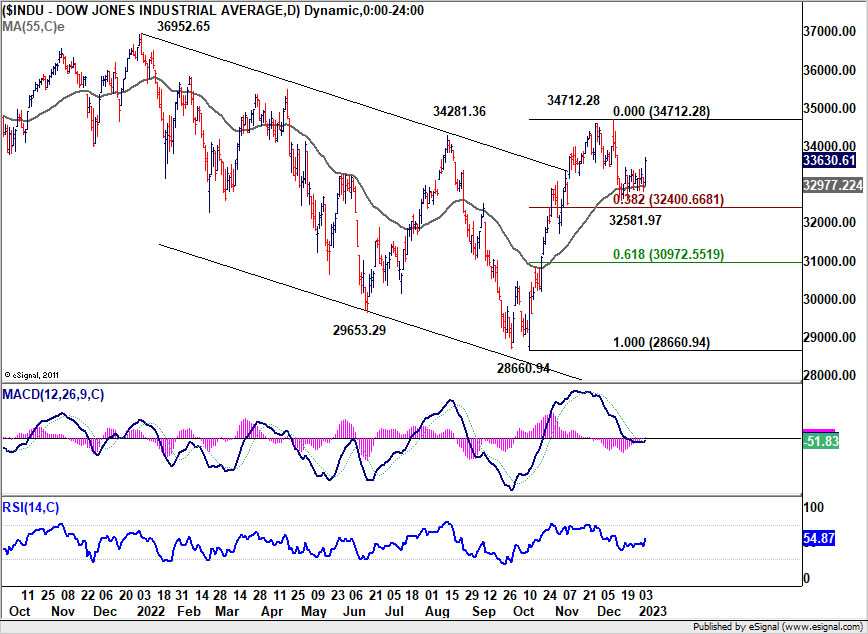
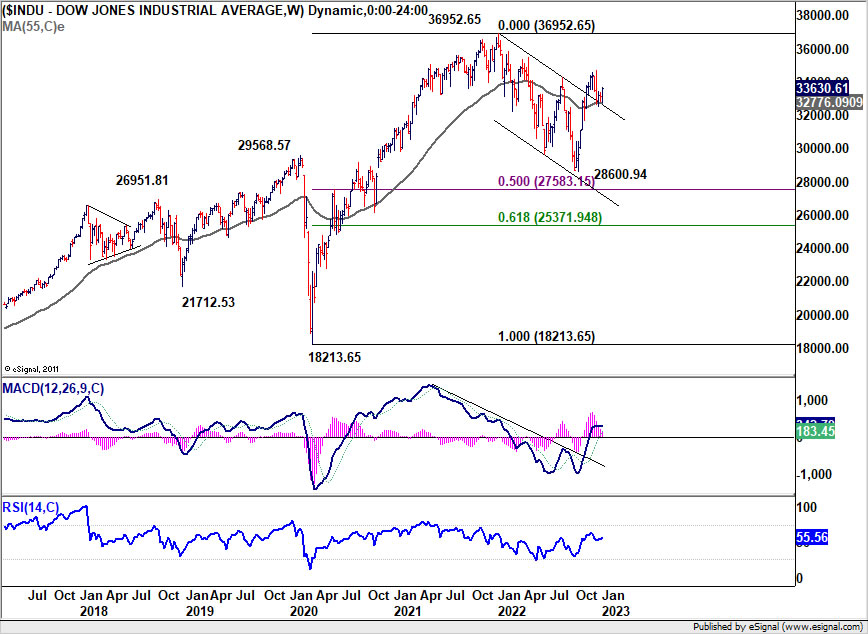
Anyways, DOW closed up 700.53 pts or 2.13% on Friday. Pull back from 34712.28 might have completed at 32581.97, after drawing support from 55 day EMA, as well ass 55 week EMA. Further rebound is now in favor in the near term for retesting 34712.28 high. It's still early to call for upside breakout. But even if the corrective pattern would extend with another fall leg, the range could be set already by 38.2% retracement of 28660.94 to 34712.28 at 32400.66.
FTSE hit 3-year high, DAX ready for upside breakout
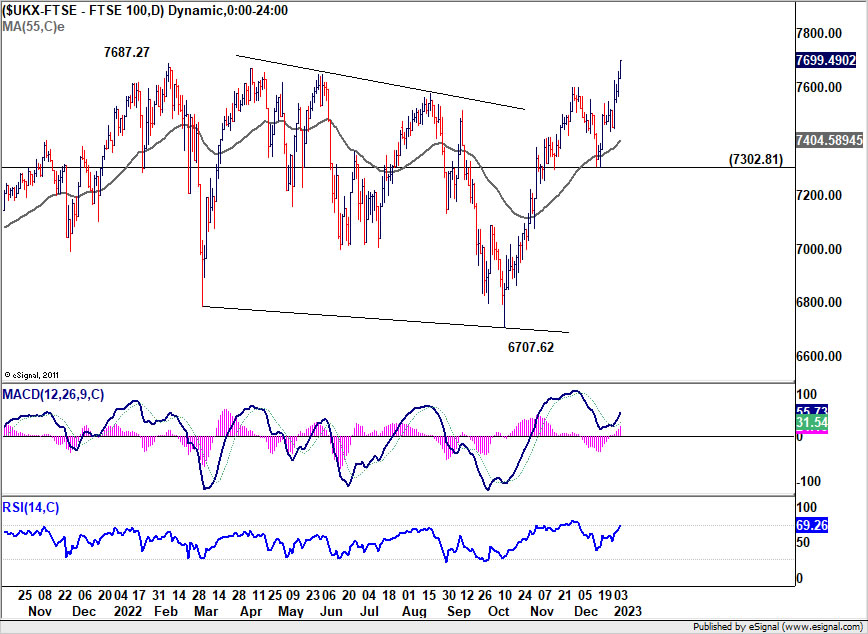
Meanwhile, it should be emphasized that risk-on sentiment was seen in Europe too. FTSE 100 has indeed closed at a 3-year high, with boost from ONS data that UK gas prices fell -20% in the final week of December. Meanwhile, Halifax reported that house prices fell -2.5% in Q4, the worst decline since 2009. Home construction activity fell at the sharpest rate since May 2020.
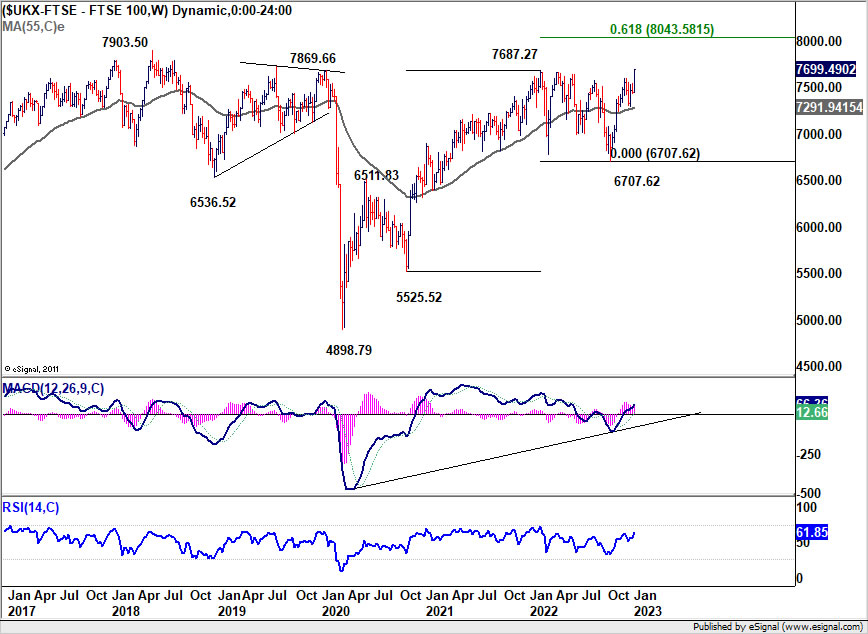
For the near term, outlook in FTSE will remain bullish as long as 7302.81 support holds. It's probably now heading through record high at 7903.50 to 61.8% projection of 5525.52 to 7687.27 from 6707.62 at 8043.58.
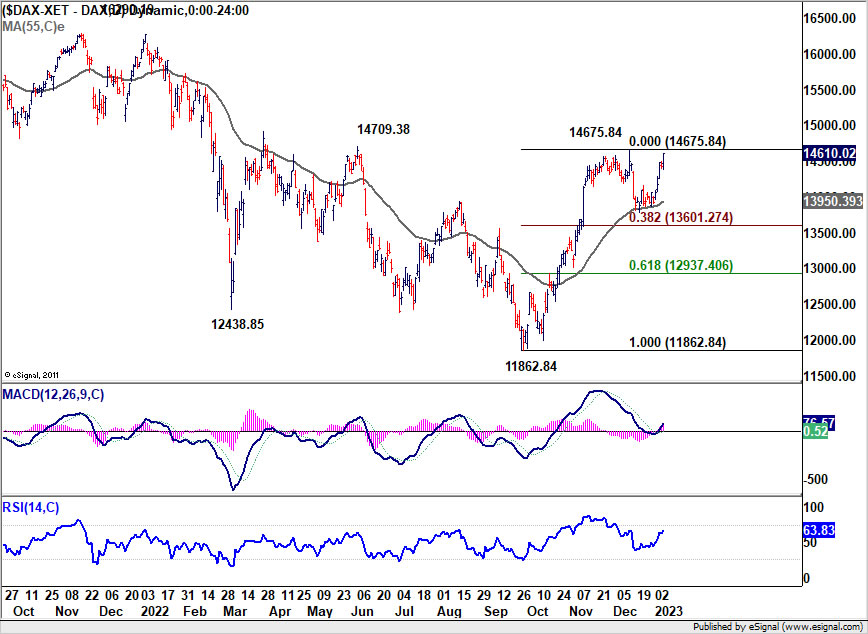
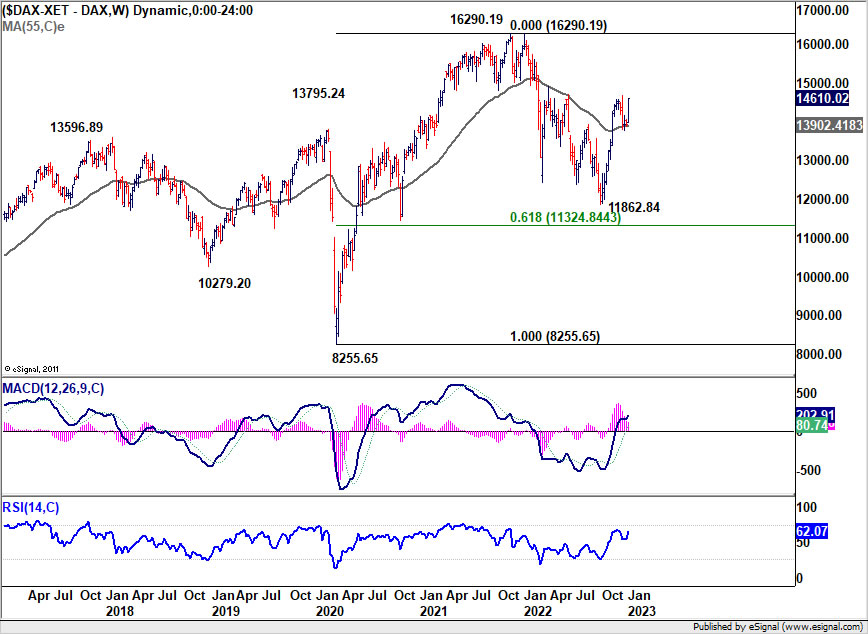
DAX also closed strongly last week, with help from Eurozone CPI data, which indicated quicker than expected slowing in headline consumer inflation. DAX drew notable support from 55 day EMA and 55 week EMA, which are bullish signs. Immediate focus is now on 14675.84 resistance. Sustained break there will resume whole rally from 11862.84 towards 16290.19 high.
Dollar index recovery capped, slim chance for a bounce
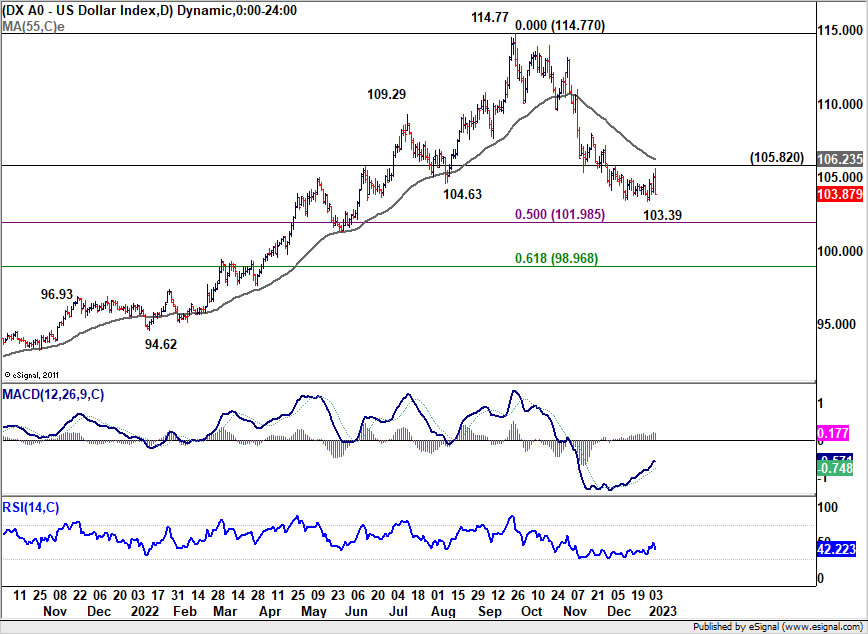
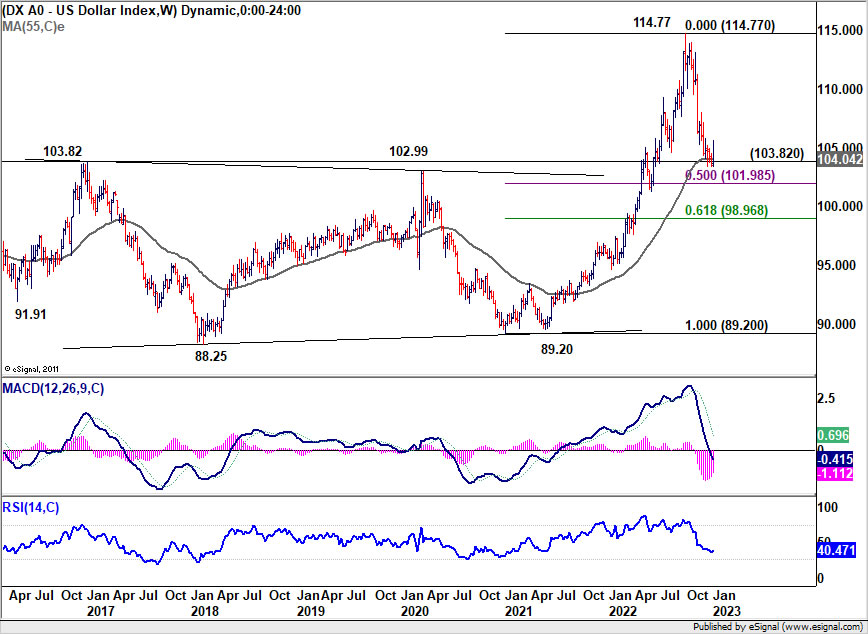
Dollar index's recovery last week was capped below 105.82 resistance, as well as 55 day EMA (now at 106.23). The condition for a near term bullish reversal is there, with DXY pressing 55 week EMA (now at 104.04), as well as 102.99/103.82 long term support zone. However, if risk on sentiment is going to persist, or even intensify, there is little chance for a sustainable bounce in DXY.
Indeed, break of 103.39 will resume the fall from 114.77 to 50% retracement of 89.20 to 114.77 at 101.98, or further, before bottoming. On the other hand, break of 105.82, followed by sustained trading above 55 day EMA, will turn near term outlook bullish for a stronger rebound.
Gold resumed near term rally, heading to 1900
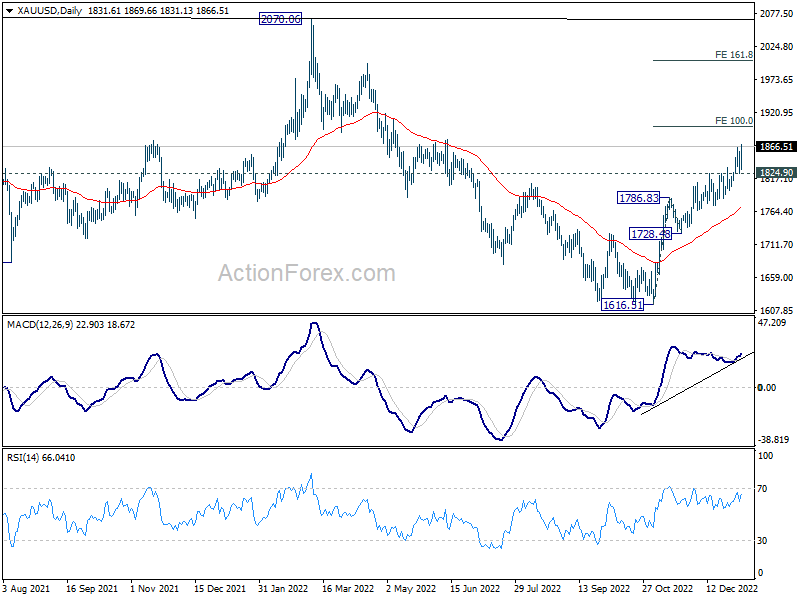
Dollar's sluggishness was accompanied by rally resumption in Gold last week. For the near term outlook will stay bullish as long as 1824.90 support holds. Next target is 100% projection of 1616.51 to 1786.63 from 1728.48 at 1898.80. Firm break there could prompt upside acceleration towards 161.8% projection at 2004.05.
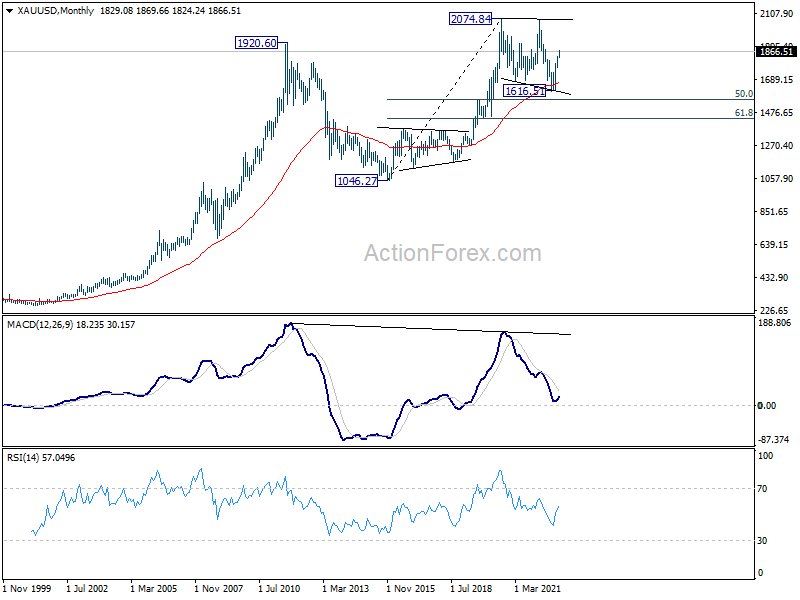
Also, it should be noted that long term consolidation pattern from 2074.84 (2020 high) could have completed with three waves down to 1616.51, after drawing support from 55 month EMA. If that's the case, retest of 2074.84 would be seen in the medium term. That could correspond to more downside in Dollar.
EUR/USD Weekly Outlook
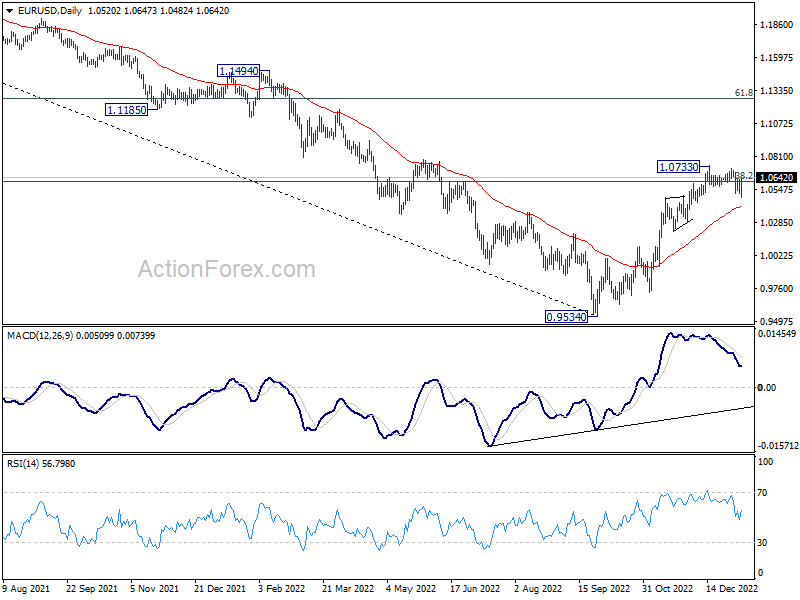
EUR/USD dropped to 1.0482 last week as consolidation from 1.0733 extended. But downside was contained by 1.0481 resistance support. Initial bias stays neutral this week first. On the upside, firm break of 1.0733 will resume whole rally from 0.9534. Nevertheless, sustained break of 1.0481 will extend the correction to 1.0289 support and below.
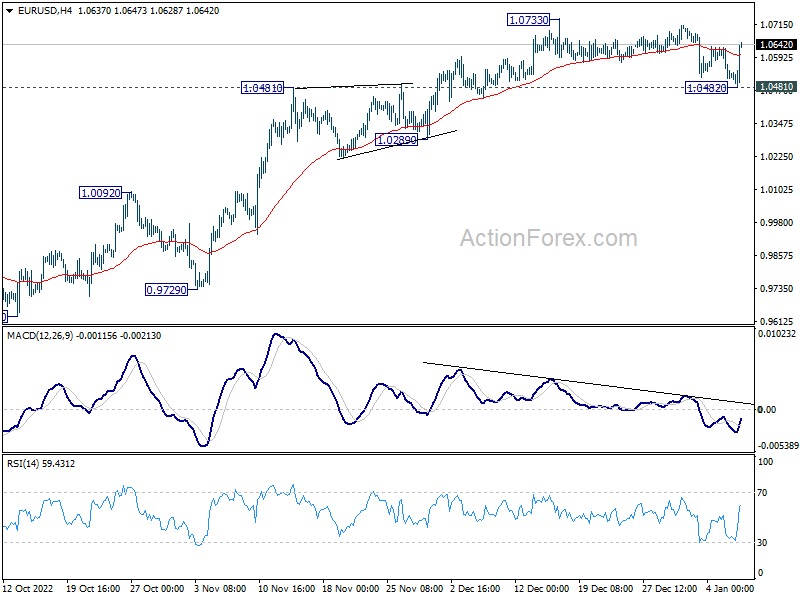
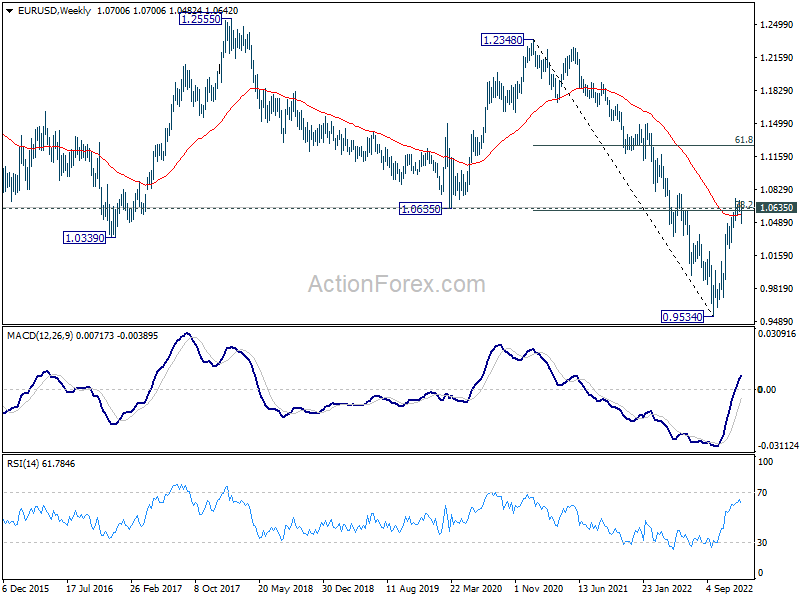
In the bigger picture, focus stays on 38.2% retracement of 1.2348 (2021 high) to 0.9534 at 1.0609. Rejection by 1.0609 will suggest that price actions from 0.9534 medium term bottom are developing into a corrective pattern. Thus, medium bearishness is retained for another fall through 0.9534 at a later stage. However, sustained break of 1.0609 will raise the chance of trend reversal and target 61.8% retracement at 1.1273.
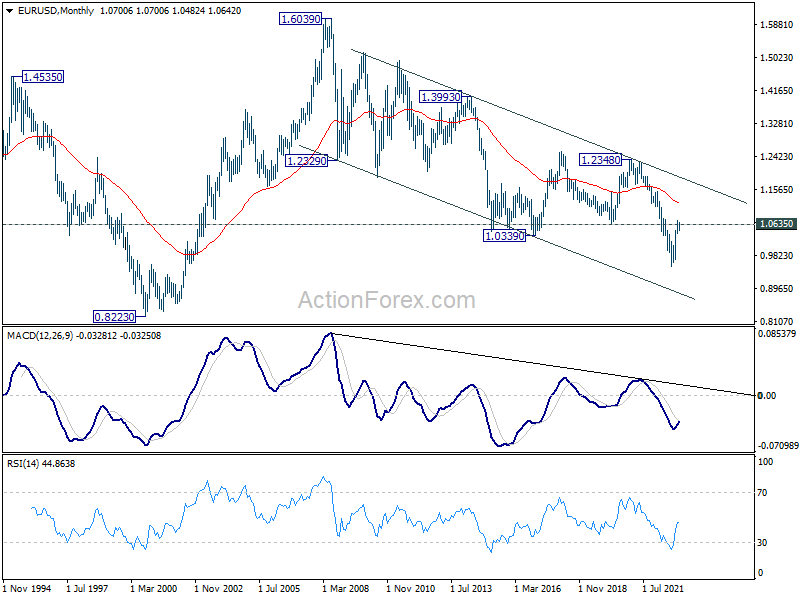
In the long term picture, as long as 1.0635 support turned resistance holds (2020 low), long term down trend from 1.6039 (2008) could still extend through 0.9534 at a later stage. However, sustained break of 1.0635 will confirm bottoming and at least turn long term outlook neutral.
EUR/USD Weekly Outlook
EUR/USD dropped to 1.0482 last week as consolidation from 1.0733 extended. But downside was contained by 1.0481 resistance support. Initial bias stays neutral this week first. On the upside, firm break of 1.0733 will resume whole rally from 0.9534. Nevertheless, sustained break of 1.0481 will extend the correction to 1.0289 support and below.
In the bigger picture, focus stays on 38.2% retracement of 1.2348 (2021 high) to 0.9534 at 1.0609. Rejection by 1.0609 will suggest that price actions from 0.9534 medium term bottom are developing into a corrective pattern. Thus, medium bearishness is retained for another fall through 0.9534 at a later stage. However, sustained break of 1.0609 will raise the chance of trend reversal and target 61.8% retracement at 1.1273.
In the long term picture, as long as 1.0635 support turned resistance holds (2020 low), long term down trend from 1.6039 (2008) could still extend through 0.9534 at a later stage. However, sustained break of 1.0635 will confirm bottoming and at least turn long term outlook neutral.
USD/JPY Weekly Outlook
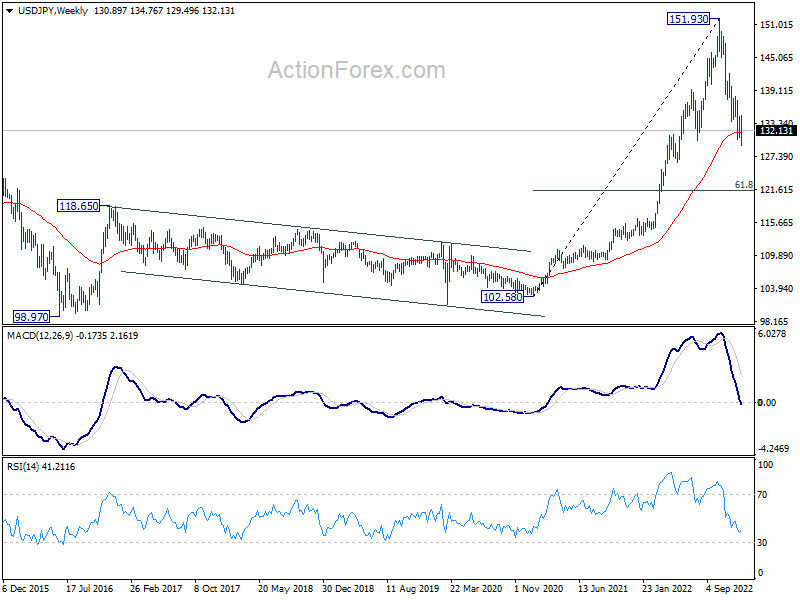
USD/JPY rebounded after dipping to 129.49 last week, but failed to break through 134.49 resistance decisively. Initial bias remains neutral this week first. On the upside, firm break of 134.49 should confirm short term bottoming, and bring stronger rise to 138.16 cluster resistance (38.2% retracement of 151.93 to 129.49 at 138.06). However, break of 129.49 will resume the whole decline from 151.93 instead.
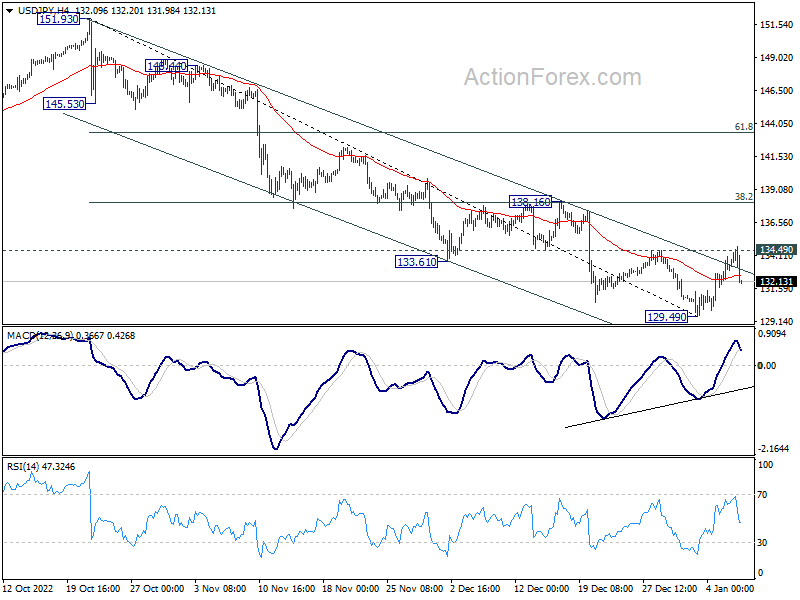
In the bigger picture, a medium term top was in place at 151.93. Sustained trading below 55 week EMA (now at 131.73) would raise the chance of bearish trend reversal. Deeper fall would be seen to 61.8% retracement of 102.58 to 151.93 at 121.43. This will now remain the favored case as long as 55 day EMA (now at 137.08) holds.
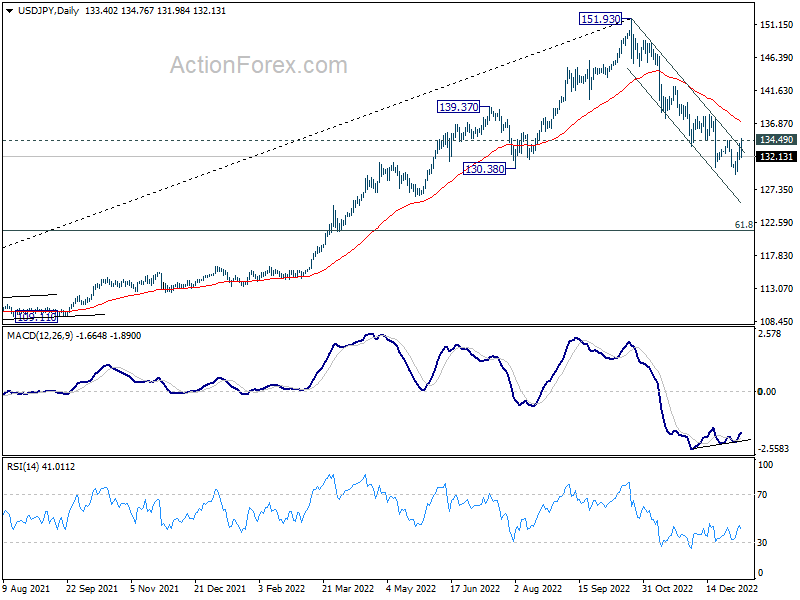
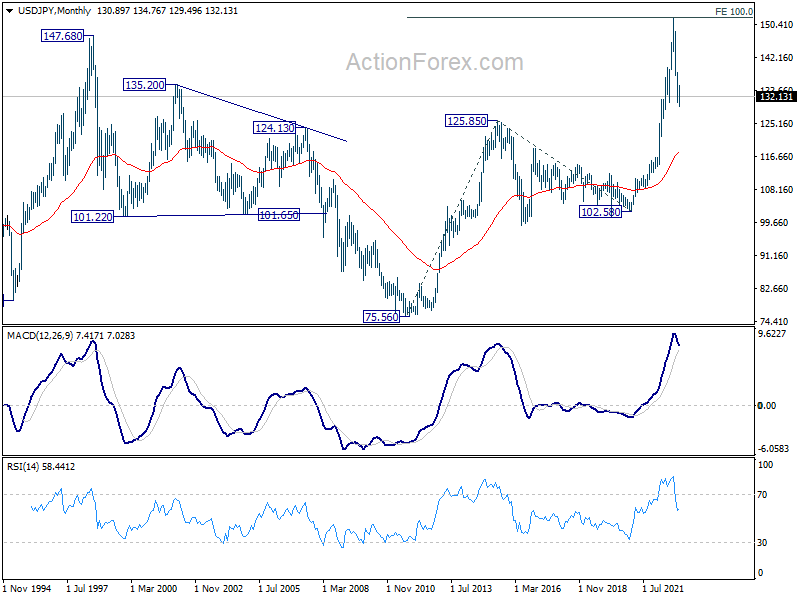
In the long term picture, rise from 102.58, as part of the up trend from 75.56 (2011 low) was put to a halt at 151.93, just ahead of 100% projection of 75.56 to 125.85 from 102.58 at 152.87. There is no clear sign of long term reversal yet. Such up trend is expected to resume at a later stage, as long as 125.85 resistance turned support holds.