Sample Category Title
GBP/USD: Sterling Extends Advance on Growing Expectations for More Dovish Fed
Cable continues to benefit from rising expectations for more dovish Fed after US labor data on Friday added to signals that the central bank would further ease the pace of policy tightening, increasing the possibility for 25 basis points hike in the next meeting and lowering expectations for 0.5% hike.
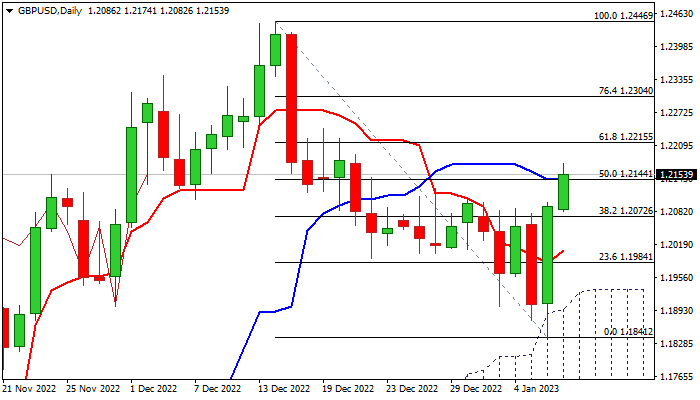
Sterling rallied 1.6% on Friday, after US labor data added to a risk sentiment, making the biggest daily rally since Nov 10, with formation of bullish engulfing pattern on a daily chart, generating initial bullish signal.
Monday’s extension hit the highest since Dec 21 and broke through Fibo barrier at 1.2144 (50% retracement of 1.2446/1.1841), signaling formation of a higher low at 1.1841, after the pullback from Dec 14 high (1.2446) was contained by rising thick daily cloud.
Improving daily studies (momentum is about to break into positive territory and moving averages returned to bullish setup) underpin near-term action, which looks for a daily close above broken Fibo level (1.2144) to keep bulls intact for further retracement of 1.2446/1.1814 pullback.
Next pivots lay at 1.2215 (Fibo 61.8%) and 1.2304 (Fibo 76.4%) violation of which would expose key barrier at 1.2446.
Extended dips should find ground above 1.2100 zone (last week’s multiple highs) to maintain bullish bias.
Res: 1.2174; 1.2215; 1.2241; 1.2304.
Sup: 1.2100; 1.2072; 1.2044; 1.2012.
ECB: Wage growth over the next few quarters very strong
In an economic bulletin article, ECB said, "Looking ahead, wage growth over the next few quarters is expected to be very strong compared with historical patterns."
"This reflects robust labour markets that so far have not been substantially affected by the slowing of the economy, increases in national minimum wages and some catch-up between wages and high rates of inflation."
"Beyond the near term, the expected economic slowdown in the euro area and uncertainty about the economic outlook are likely to put downward pressure on wage growth."
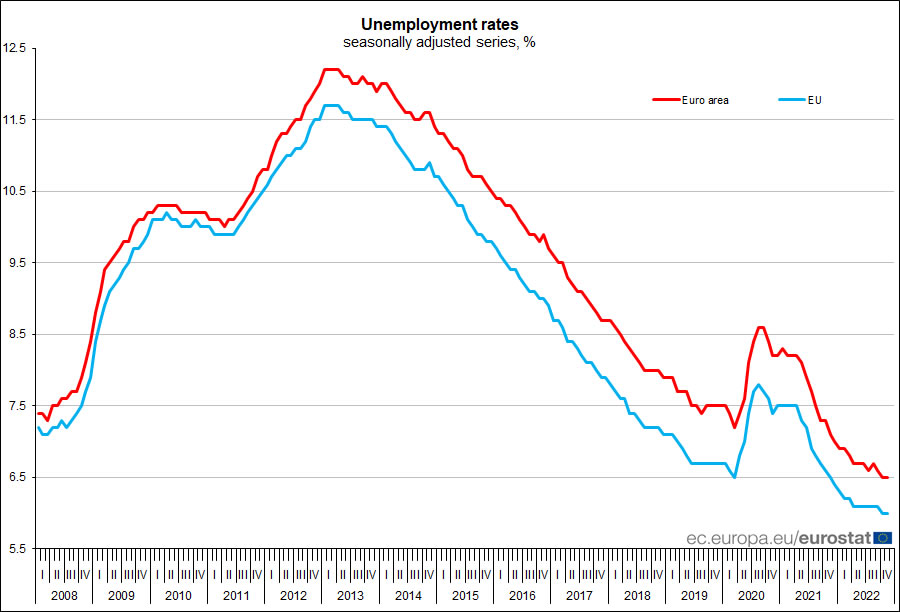
Eurozone unemployment rate unchanged at 6.5% in Nov, EU at 6.0%
Eurozone unemployment rate was unchanged at 6.5% in November. EU unemployment rate was unchanged at 6.0%.
Eurostat estimates that 12.950m men and women in the EU, of whom 10.849m in the Eurozone, were unemployed in November 2022. Compared with October 2022, unemployment increased by 10k in the EU and decreased -by 2k in the Eurozone.
Eurozone Sentix rose to -17.5, sharp economic downturn off the table
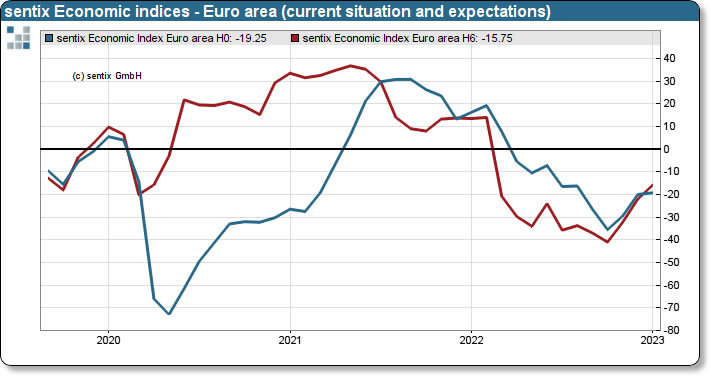
Eurozone Sentix Investor Confidence improved from -21 to -17.5 in January, slightly below expectation of -17.0. That's nonetheless the highest since June 2022. Current Situation Index rose from -20.0 to -19.3, highest since last August. Expectations rose from -22.0 to -15.8, highest since last February.
Sentix said: "Investors are still assuming a recession, but it is expected to be much milder. The sharp economic downturn, which was expected by the majority of investors by October 2022, is therefore off the table (for now)...a
"Overall, the economic environment remains challenging. The latest increases should not be misinterpreted as a general turnaround. The risks of recession remain."
Weekly Waves: EUR/USD, GBP/USD and NGAS
- EUR/USD has reached a critical spot, which will determine whether the long-term outlook remains bearish or whether the trend will switch to bullish.
- The GBP/USD is showing strong bullish price action as well. The strong monthly candlesticks are indicating that the Cable could go higher before finding resistance.
- The NGAS chart has made a strong downtrend continuation - as we expected in our regular Elliott Wave updates on NGAS in 2022.
Our weekly Elliott Wave analysis reviews the EUR/USD daily chart, the GBP/USD monthly chart, and the NGAS daily chart.
EUR/USD downtrend in serious danger of reversal
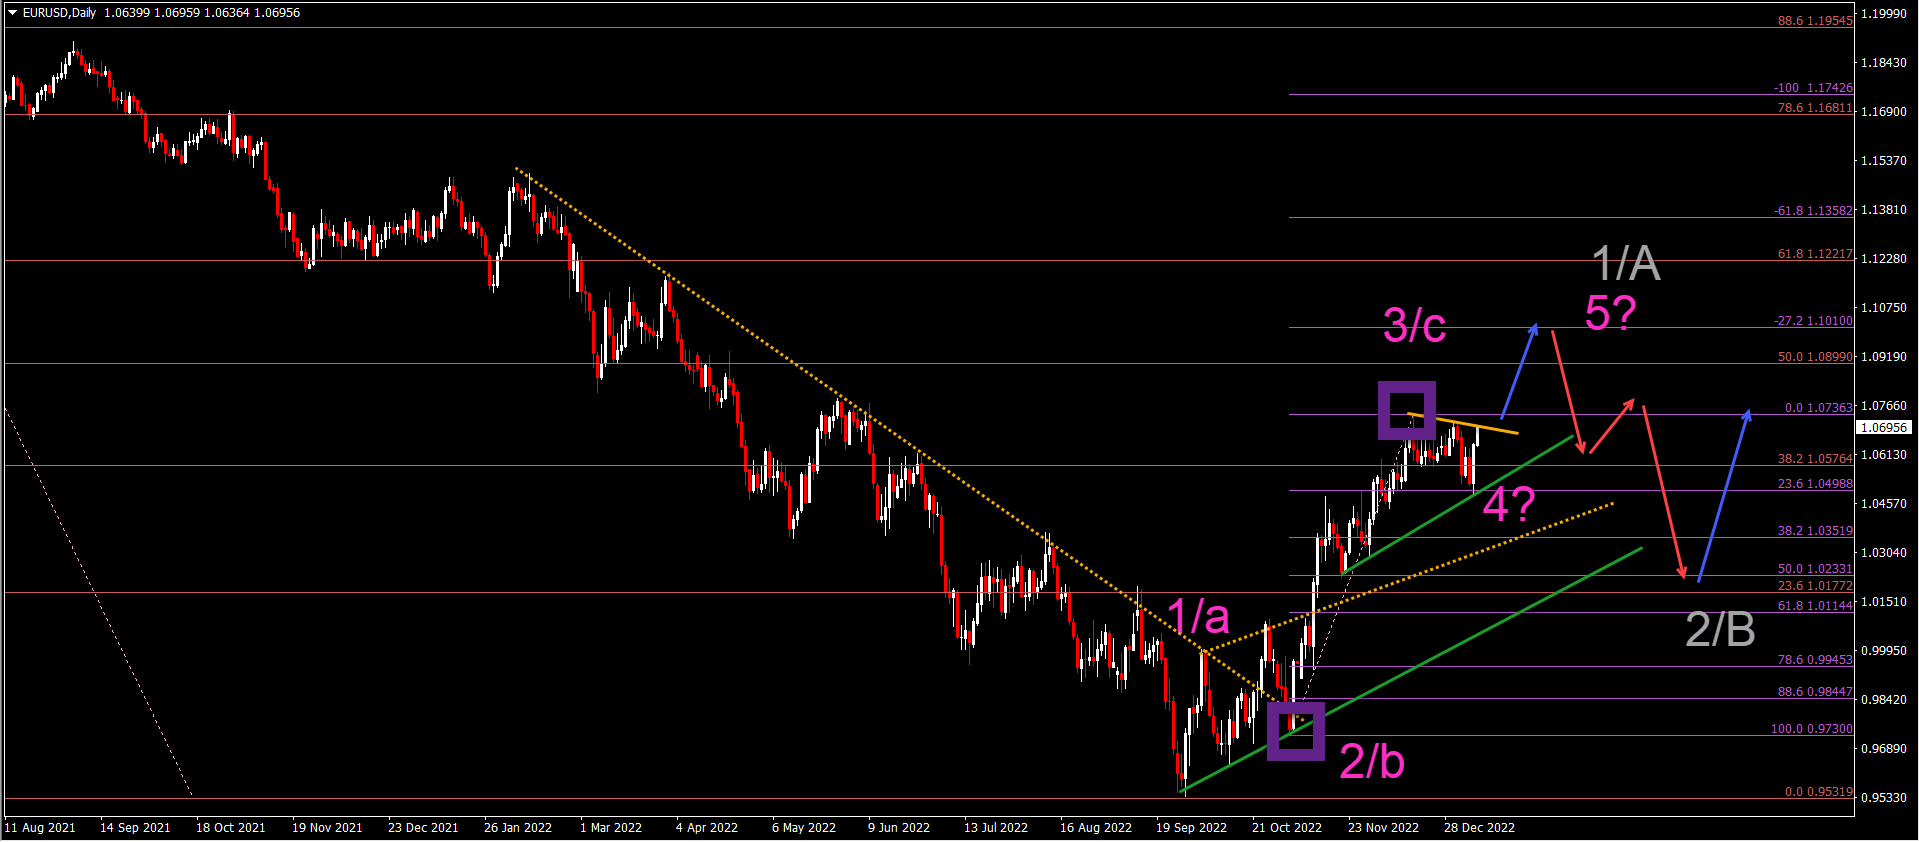
The EUR/USD has reached a critical spot, which will determine whether the long-term outlook remains bearish or whether the trend will switch to bullish:
- The EUR/USD is testing the key 38.2%-50% Fibonacci resistance zone (purple levels).
- But the bullish price action is surprisingly strong and impulsive, which indicates a potential wave 3 (pink).
- Until now we have labeled the bullish price swing as a wave C (pink), but the shallow corrective price action is indicating a wave 4 (pink) pattern.
- The shallow price action is because price has bounced at the 23.6% Fibonacci support level of the purple price swing.
- A bullish breakout (blue arrow) above the resistance (orange) could confirm a wave 5 (pink) of a larger wave A or 1 (gray).
- A breakout below the 38.2% Fibonacci support level (purple) of the wave 3 could indicate that the ABC (pink) correction is valid (not the 12345).
- If the price action does break north, then it could indicate the pause or end of a long-term downtrend and a larger bullish correction or uptrend.
GBP/USD bears losing control of the trend
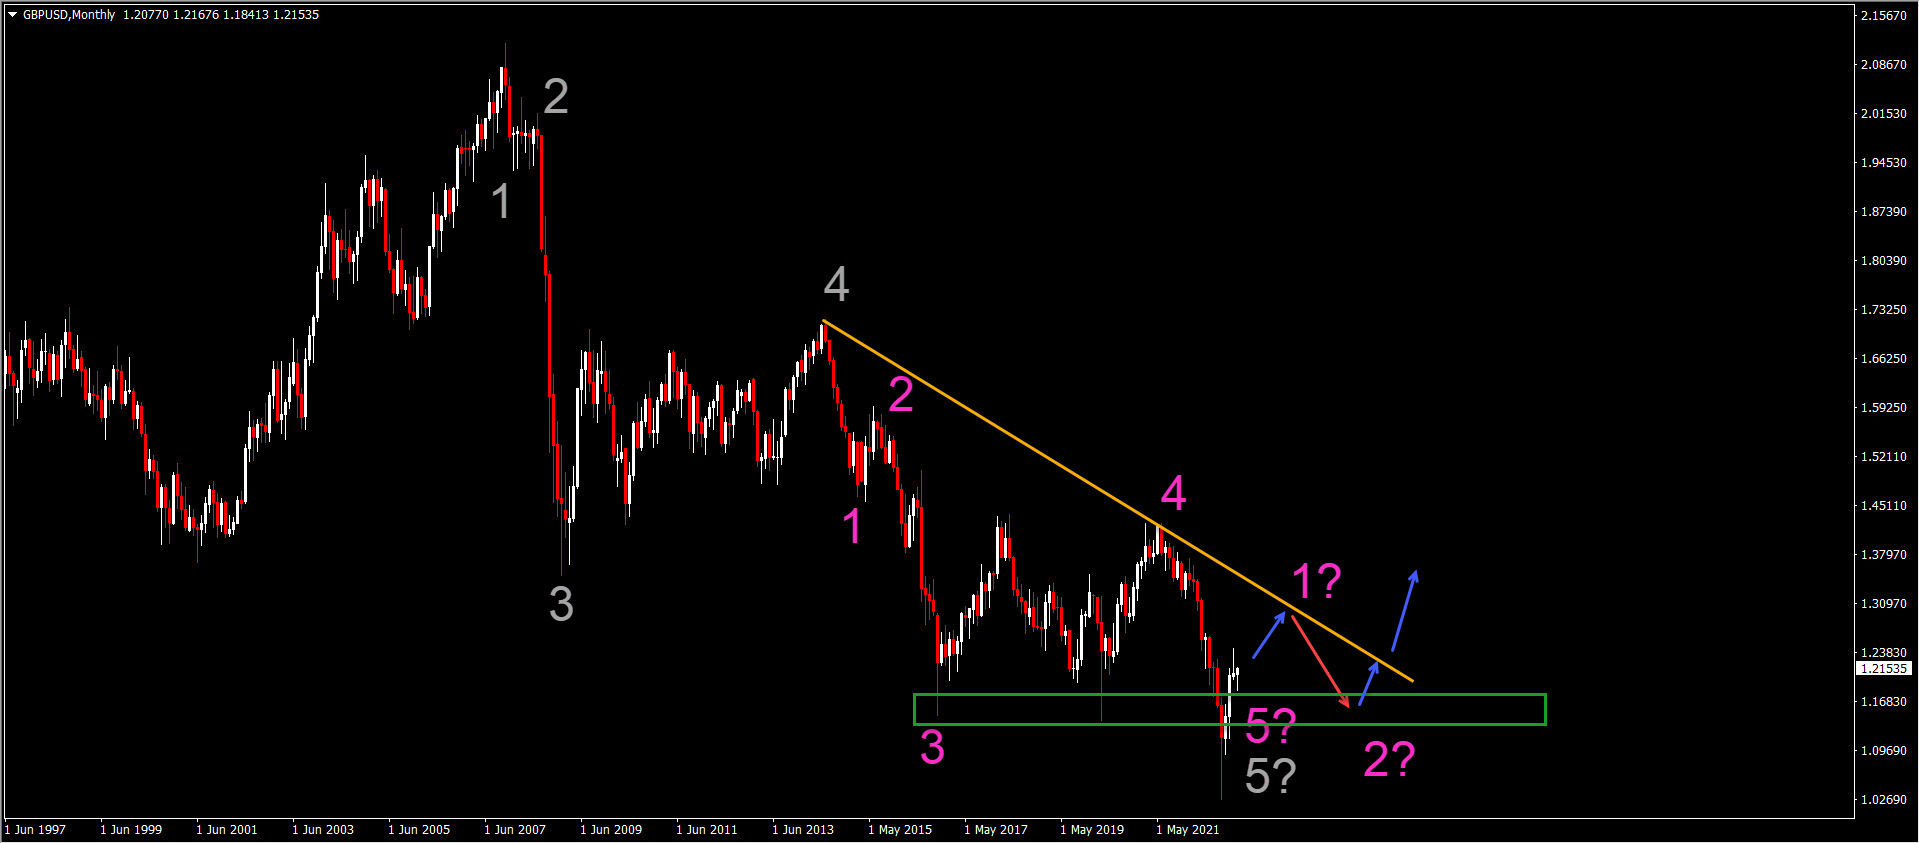
The GBP/USD is showing strong bullish price action as well. The strong monthly candlesticks are indicating that the Cable could go higher before finding resistance (orange line):
- The GBP/USD Elliott Wave count has remained bearish since the decline started at the top where wave 4 (pink) has ended.
- But the bullish price action followed by the weak bearish reaction could indicate that the downtrend might be finished.
- In that case, the lower low could complete a wave 5 (pink) of a wave 5 (gray).
- Another bullish push higher could confirm a wave 1 (pink), after which we expect a bearish wave 2 (pink).
- The support zone (green box) is expected at the previous lows, which could create a long-term inverted head and shoulders reversal chart pattern.
- The bearish outlook could remain intact if price action is able to break below the 1.17 support zone.
NGAS falls down quickly in bearish impulse
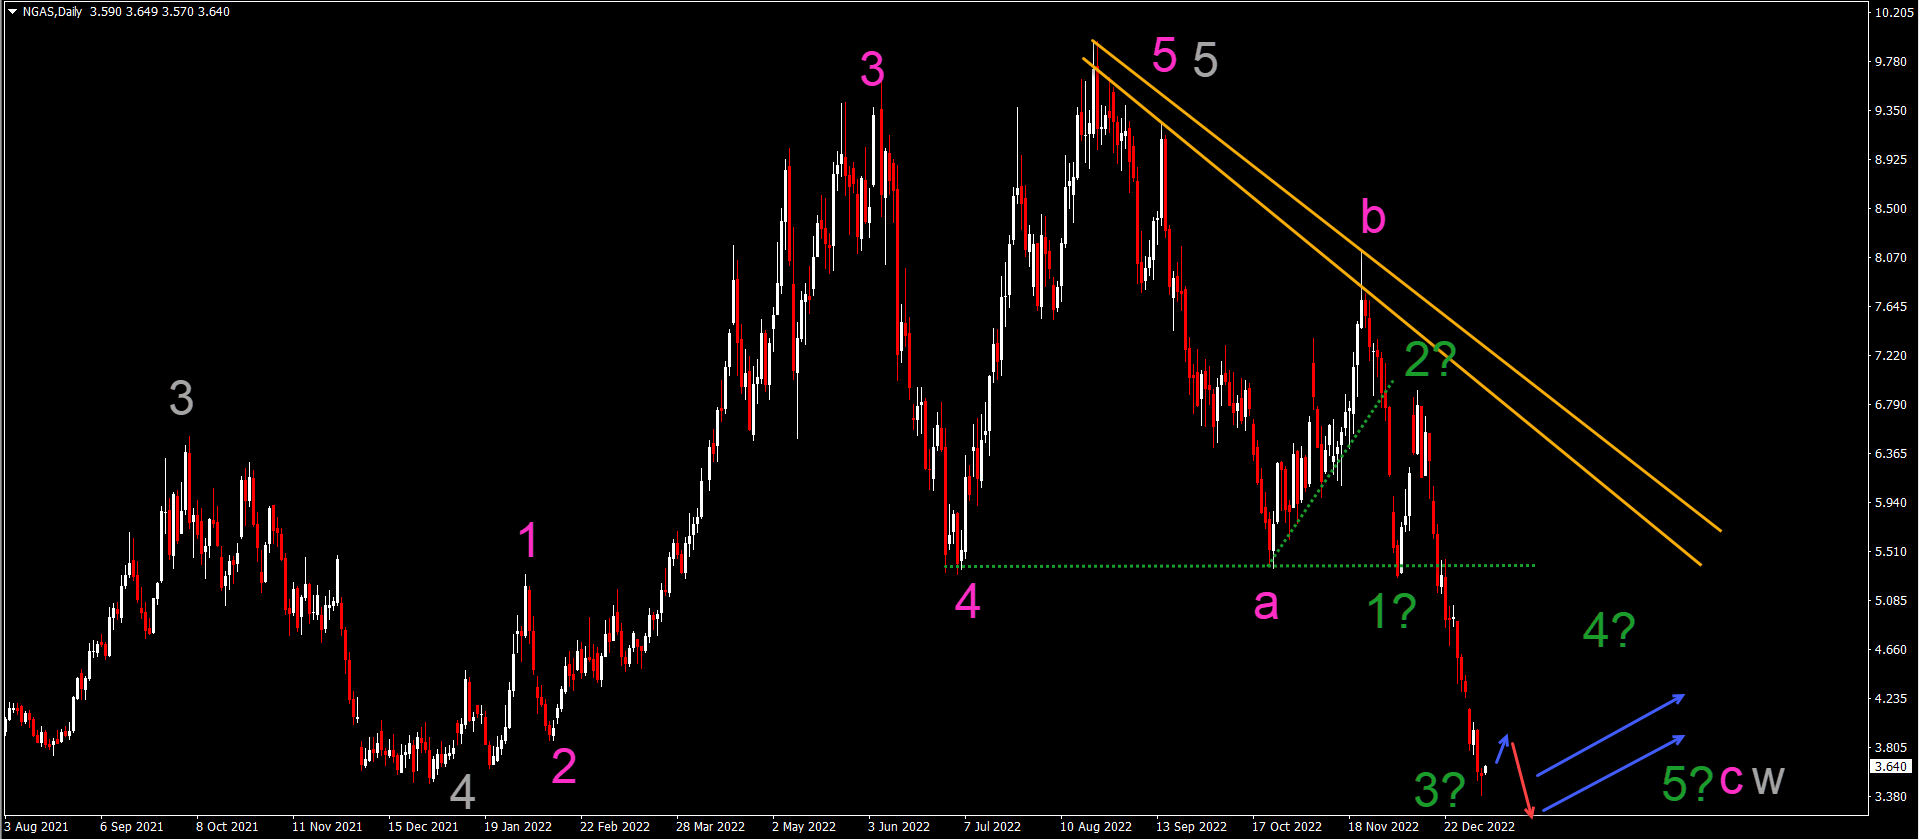
The NGAS chart has made a strong downtrend continuation - as we expected in our regular Elliott Wave updates on NGAS in 2022:
- The NGAS chart’s downtrend is expected to be a wave 3 (green) because of the strong impulsive decline.
- The wave 3 (green) could continue lower. A small retracement (blue arrow) could follow up with another bearish swing lower (red arrow) before the wave 3 (green) is finished.
- Eventually once the wave 3 (green) is completed, a larger bullish correction should emerge within a wave 4 (green).
- Usually waves 4 are complex and lengthy, but eventually a new push lower within the wave 5 (green) of wave C (pink) of a potential wave W (gray).
The analysis has been done with the indicators and template from the SWAT method simple wave analysis and trading. For more daily technical and wave analysis and updates, sign-up to our newsletter
USD/CAD: Double Zigzag Likely to Complete Near 1.403
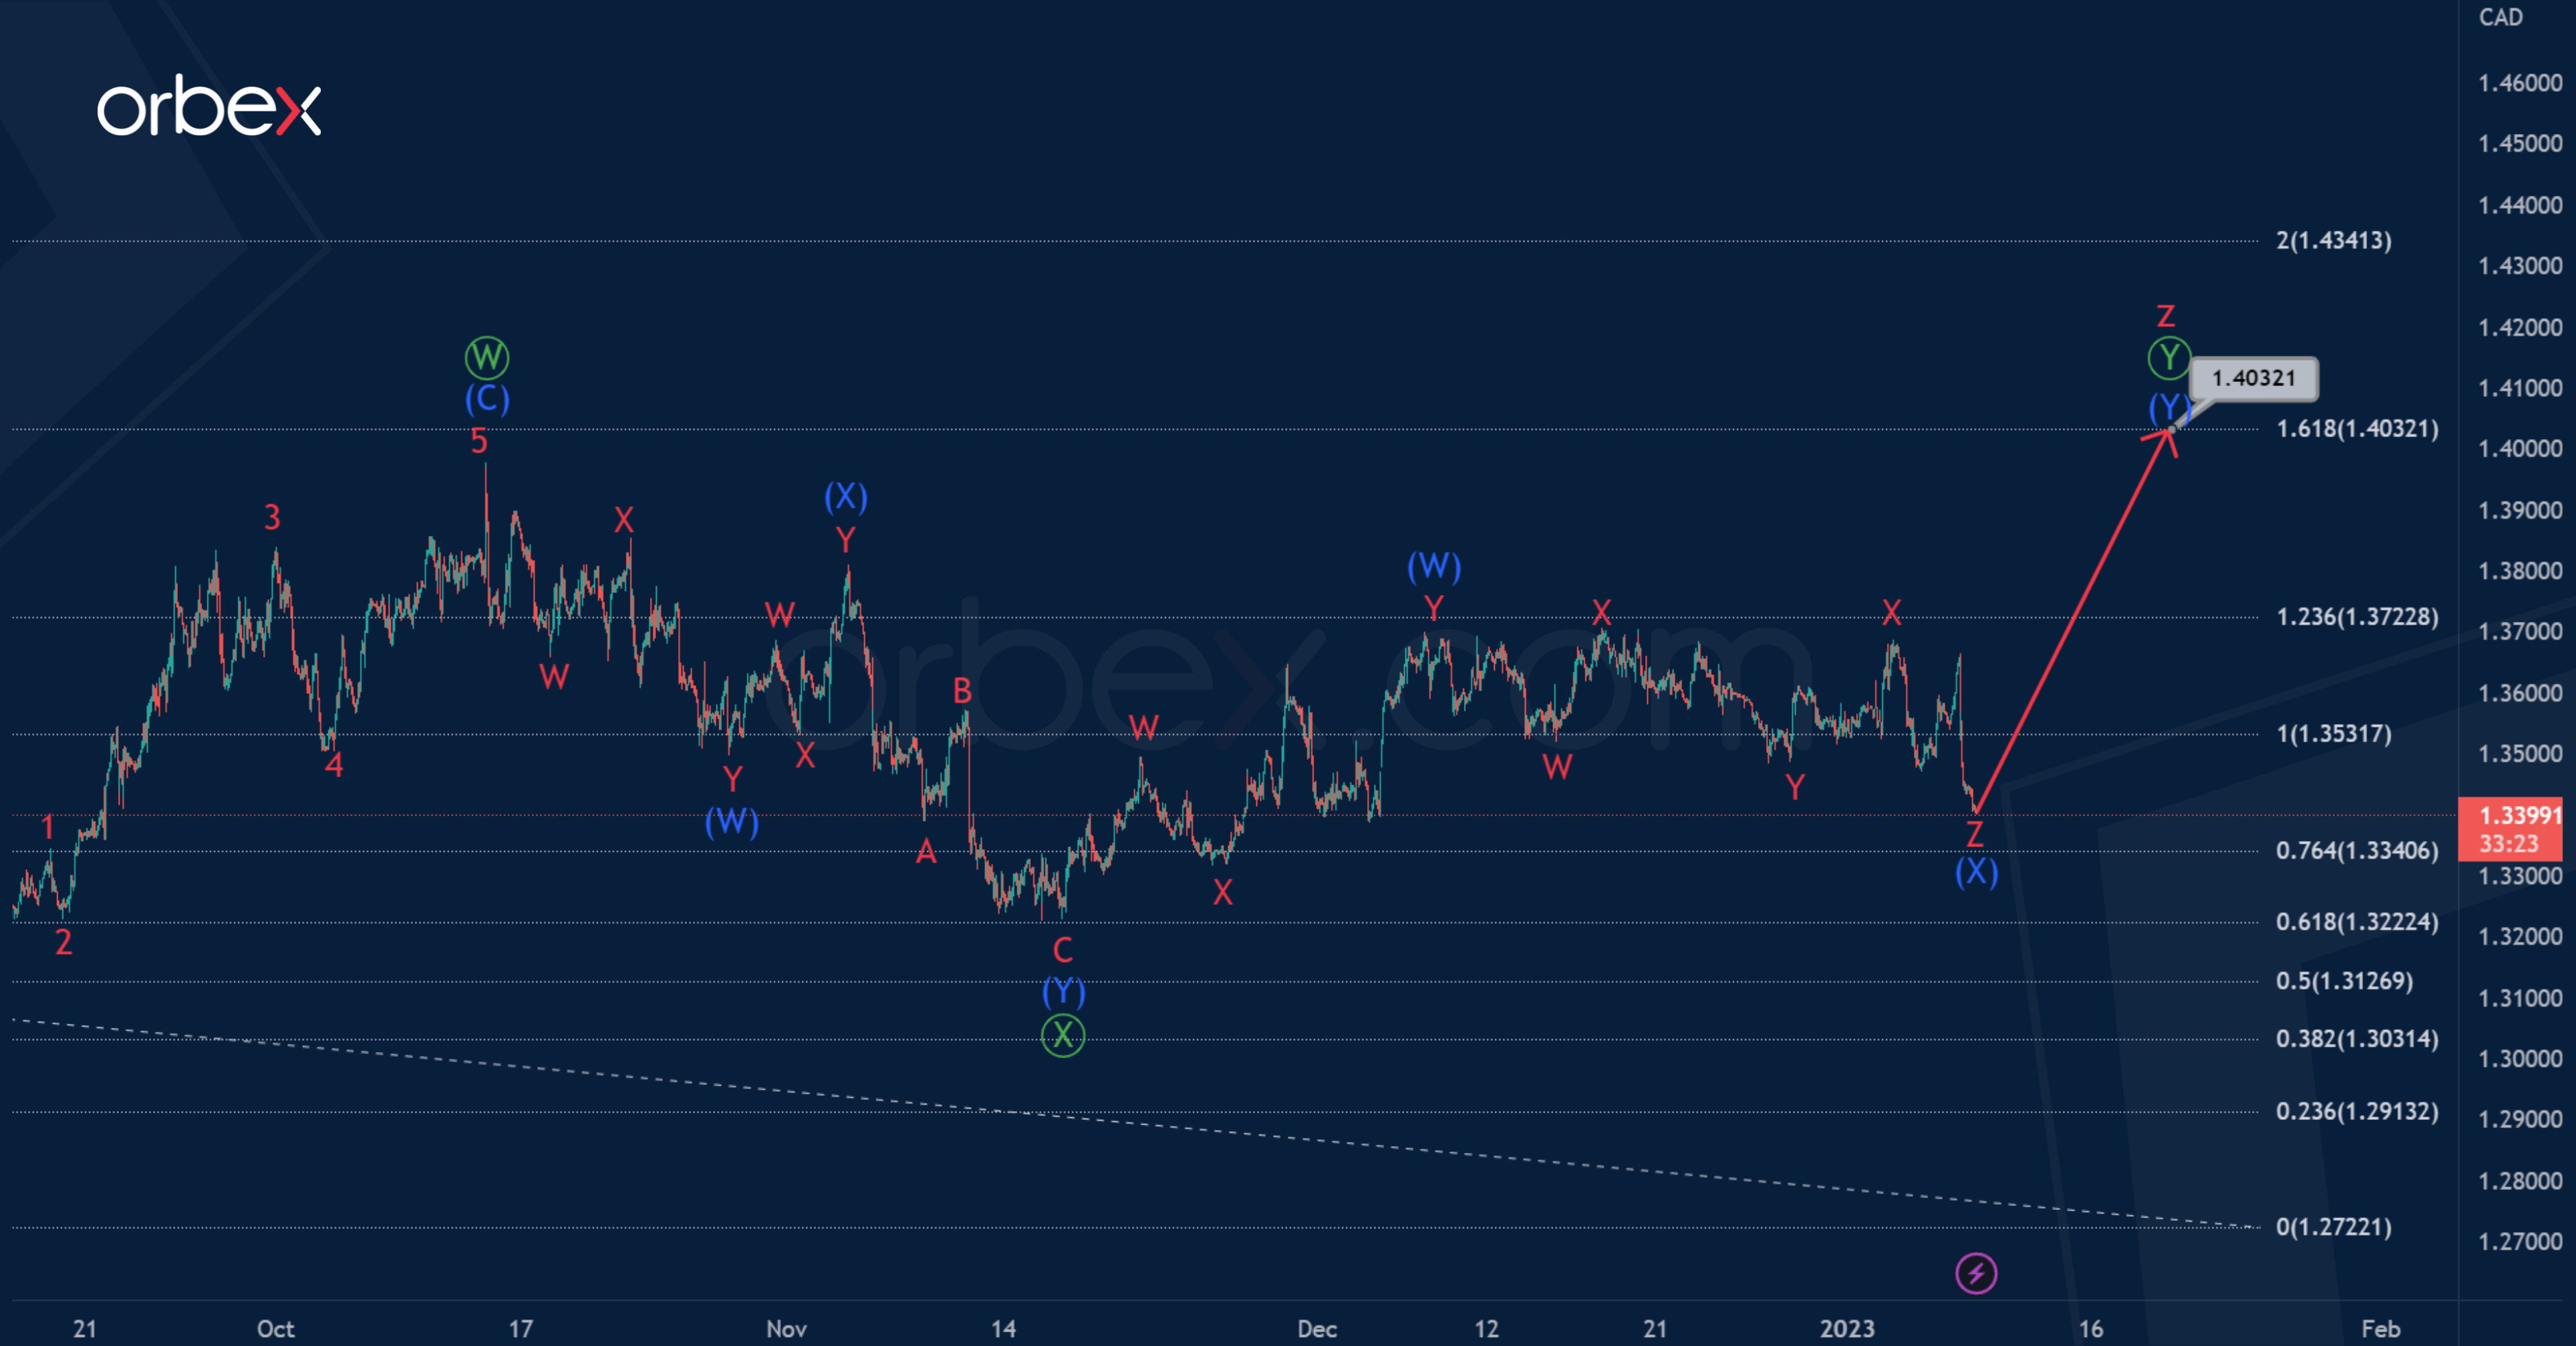
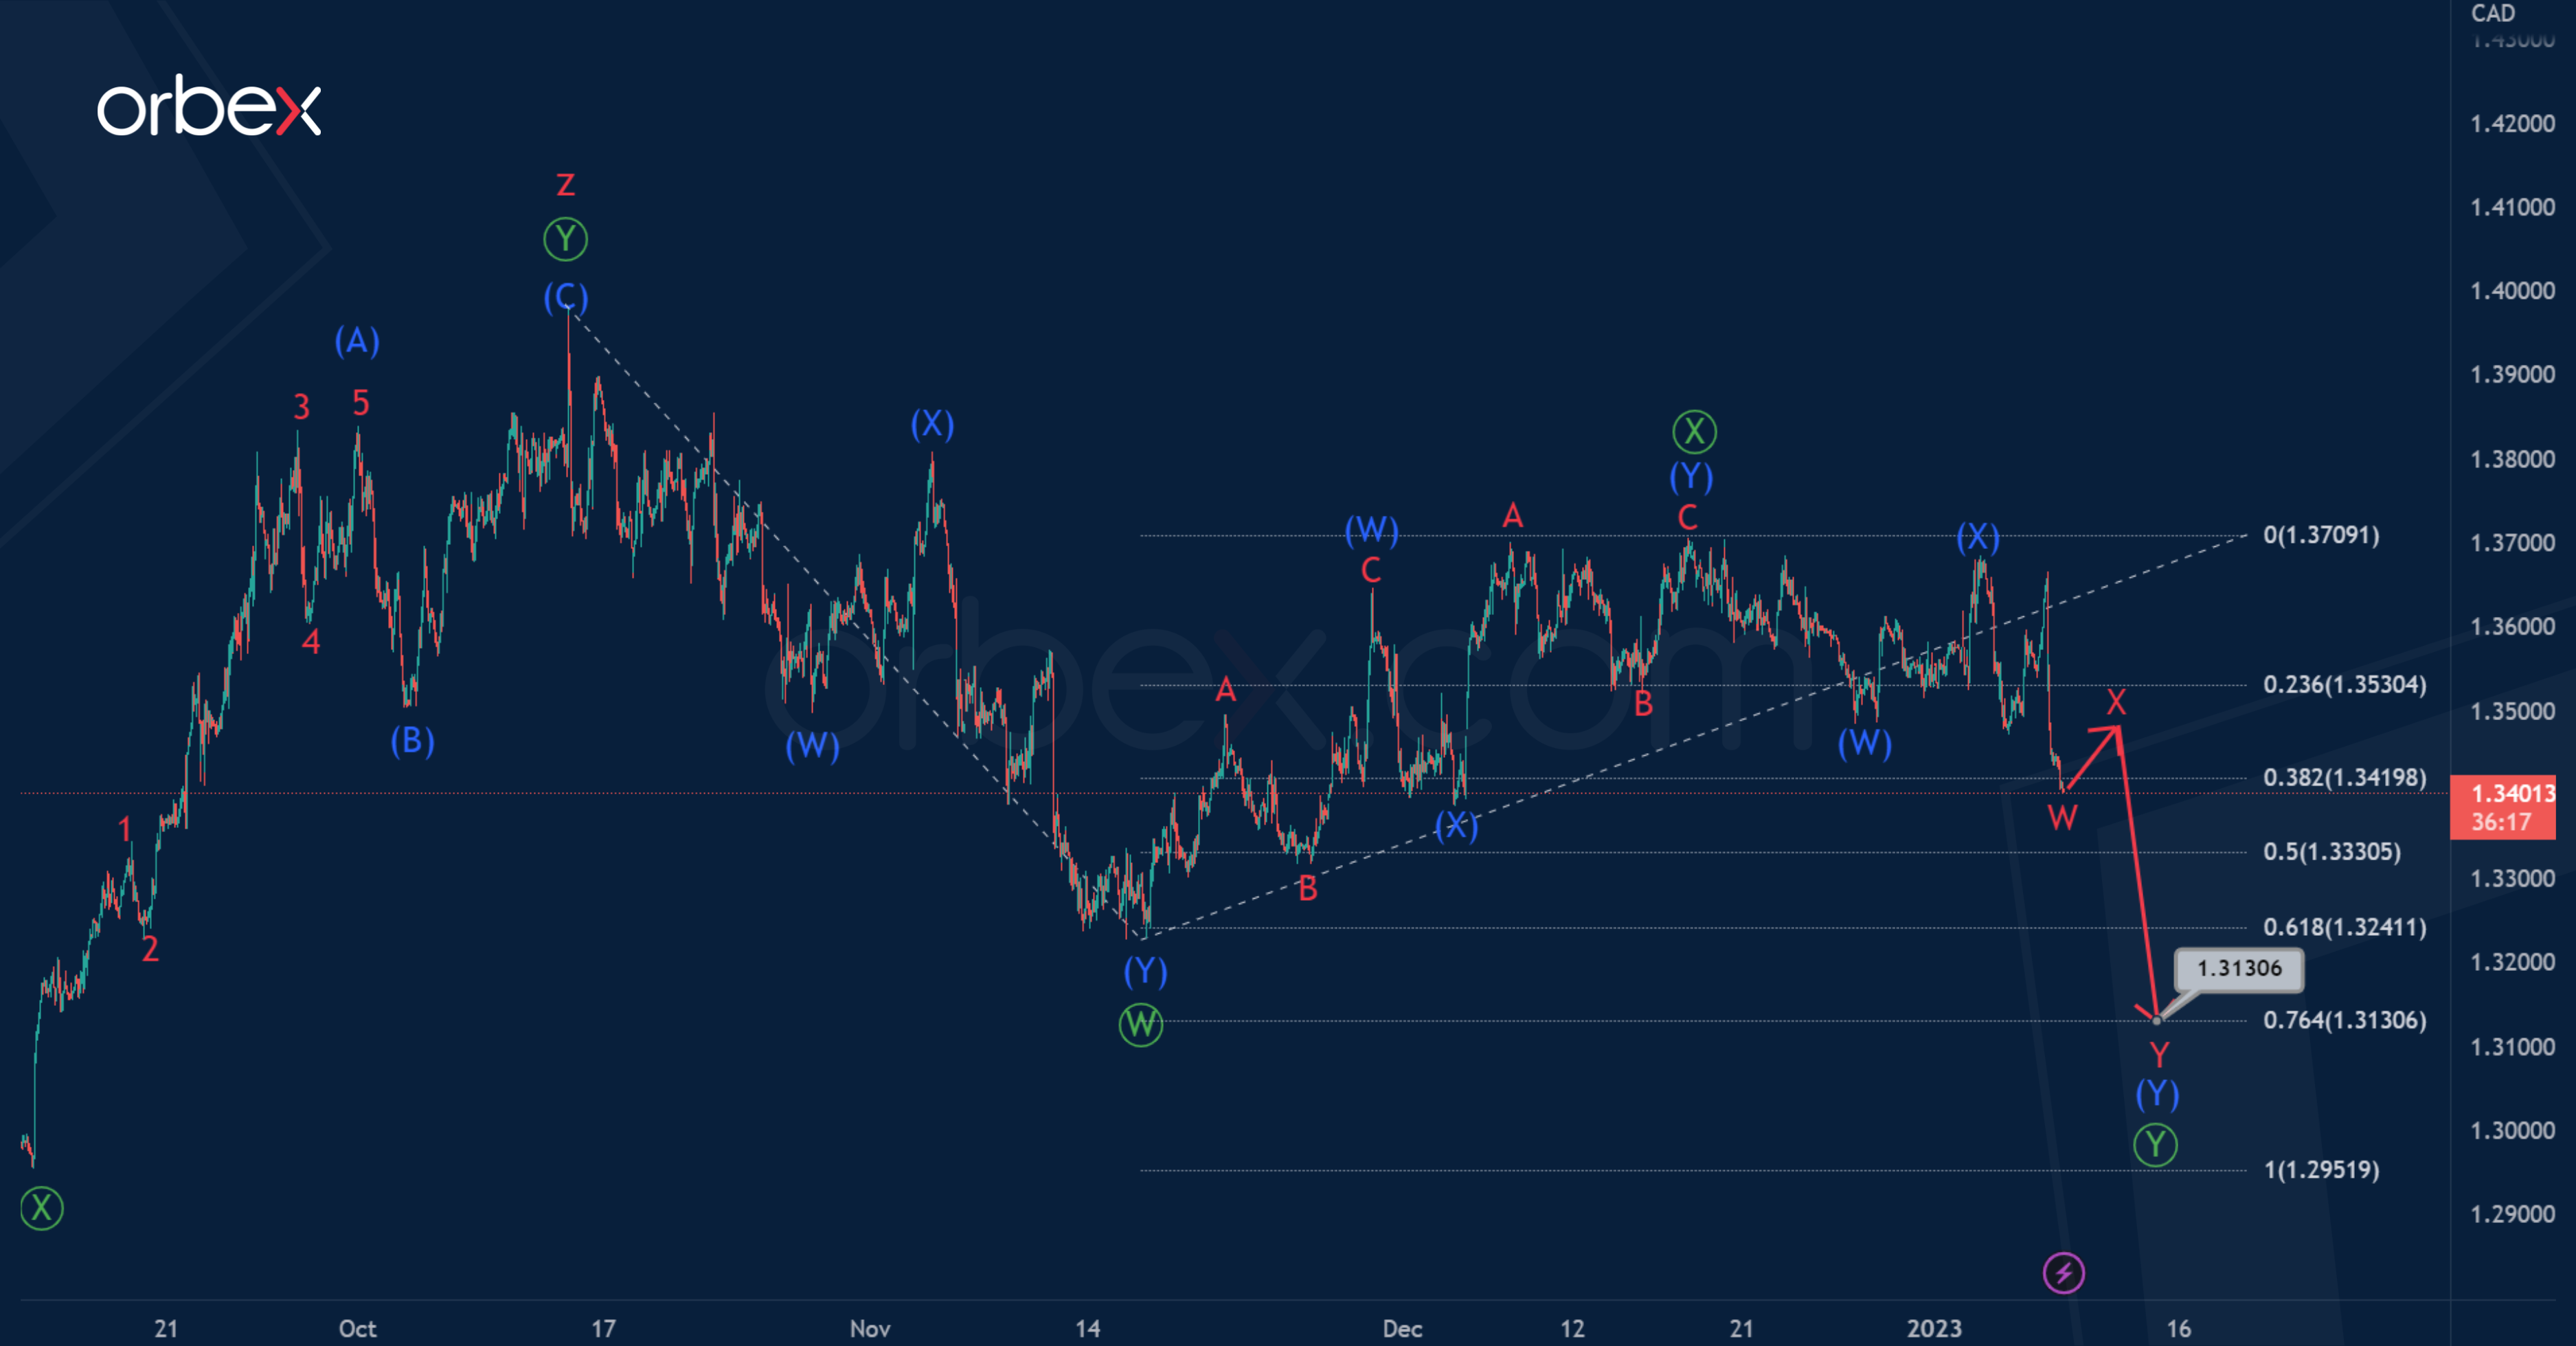
On the current USDCAD chart, we see the internal structure of a large correction pattern similar to a cycle triple zigzag w-x-y-x-z.
Perhaps the first four parts of this construction are fully completed, and now the final actionary leg is being built – the sub-wave z. Apparently, the wave z takes the form of a primary double zigzag Ⓦ-Ⓧ-Ⓨ, where the sub-waves Ⓦ-Ⓧ are formed.
Thus, at the moment it is possible that the last actionary primary wave Ⓨ is under construction.
It may end in the form of a double zigzag (W)-(X)-(Y) near 1.403. At that level, cycle wave z will be at 161.8% of cycle wave y
According to an alternative, the formation of a cycle triple zigzag could be fully completed. Therefore, now the initial part of a new bearish trend can be built.
We assume the construction of a primary double zigzag Ⓦ-Ⓧ-Ⓨ, which is the beginning in a larger correction pattern.
It is likely that the primary waves Ⓦ-Ⓧ-Ⓨ are already over.
In the near future, we can expect a continuation of the bearish primary wave Ⓨ, which may take the form of a double zigzag (W)-(X)-(Y) and end near 1.313. At that level, it will be at 76.4% of primary wave Ⓦ.
EUR/USD: Fresh Advance Signals an End of a Shallow Correction
The Euro rises further in Asian/early European trading on Monday, lifted by renewed risk sentiment, which deflates the dollar, as markets expect that the Fed would further ease the pace of rate hikes in the next policy meeting.
The single currency rose almost 1.2% on Friday, after US labor report showed that US labor market is not as tight as initially estimated that adds to the notion of further easing of the pace of Fed policy tightening.
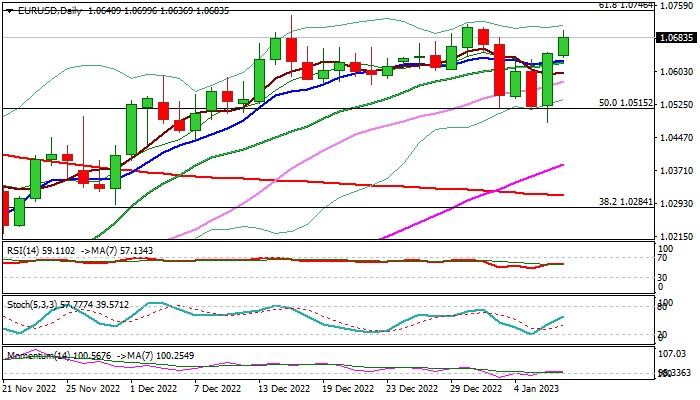
Friday’s bullish engulfing pattern underpinned recovery, with today’s rally through pivotal barrier at 1.0625 (converged 10/20DMA’s) further firmed the structure and signal that shallow 1.0713/1.0483 correction might be over.
Daily chart studies show 14-d momentum returned to positive territory and Stochastic/RSI are heading north that supports the action, which needs a clear break of pivotal Fibo barrier at 0.7046 (61.8% of 1.1494/0.9535) and a lower top of May 30 (1.0786) to signal continuation of a broader recovery from 0.9535 (2022 low of Sep 28).
Fresh bulls are expected to remain intact while near-term action stays above 1.0625 (converged 10/20DMA’s).
Res: 1.0711; 1.0736; 1.0746; 1.0786.
Sup: 1.0625; 1.0579; 1.0515; 1.0483.
AUD/USD: Break of Key Barriers Signals Further Advance
The Australian dollar keeps strong bullish stance and hits five-month high in early Monday, in extension to Friday’s 1.8% advance.
Renewed risk appetite lifted Aussie, with fresh rally in stocks during the Asian session on Monday, adding to positive sentiment.
Traders also focus on Thursday’s release of US Dec inflation report, hoping that consumer prices will continue easing, as sharp increase in interest rates during last year starts to impact high inflation, with numbers at / below expectations to contribute to expectations for 25 basis points hike on Fed’s next meeting.
Such scenario would further deflate the US dollar and give fresh boost to Aussie’s recovery from 0.6170 (2022 low, posted on Oct 13).
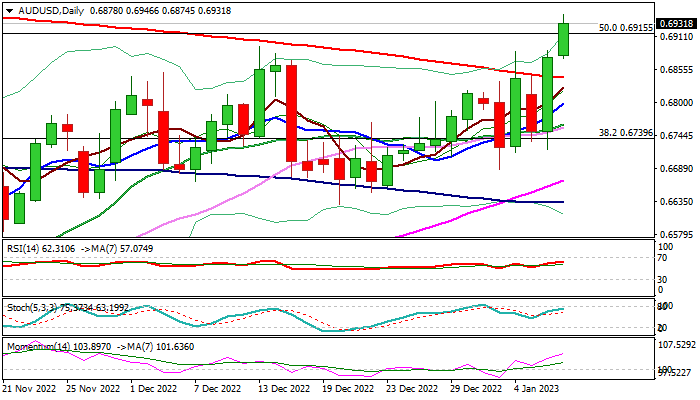
Daily studies remain in full bullish setup, with additional positive signals seen from weekly close above 200DMA (0.6844).
Today’s break through 0.6915 (50% retracement of 0.7661/0.6170 descend) opens way towards psychological 0.70 barrier and 0.7076/91 (weekly cloud base / Fibo 61.8%).
Broken Fibo barrier reverted to initial support at 0.6915, followed by 0.6886 (Jan 4/6 tops) and 200DMA, which should contain extended dips and keep bulls in play.
Res: 0.6946; 0.7000; 0.7076; 0.7091.
Sup: 0.6915; 0.6886; 0.6841; 0.6798.
Gold Builds Bullish Trend; Tests Familiar Resistance
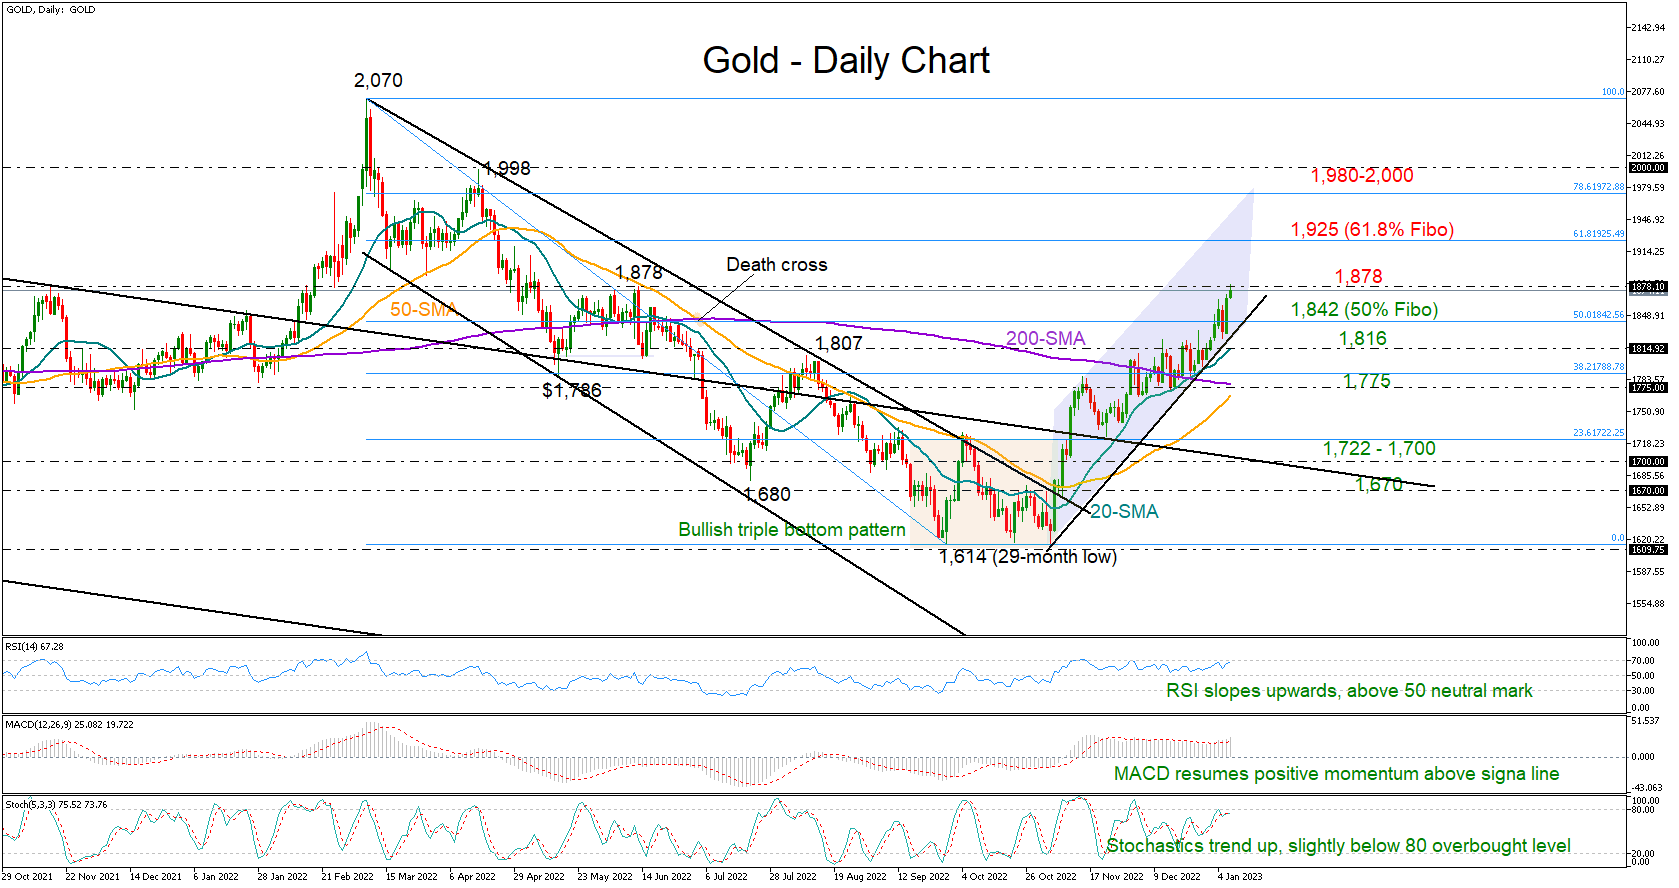
Gold bulls achieved another milestone last week, successfully retracing half of the March-September downtrend to stretch to a new five-month high of 1,879 on Monday.
Some caution could develop at this phase as the price is currently trading around a key constraining zone, which rejected the rally in 2011 and capped bullish actions several times over the past two years. Yet there are a couple of encouraging signals that could still secure buying positions and send the precious metal higher. Firstly, the bullish crosses between the simple moving averages (SMAs) are endorsing the clear positive trend in the short-term picture. Although close to overbought levels, the RSI and the stochastics have yet to show any convincing signs of weakness, while the MACD has resumed its positive momentum above its red signal line.
If the bulls claim the 1,878 bar and close above 1,900, the door will open for the 61.8% Fibonacci retracement of the 2,070–1,614 downtrend at 1,925. Running higher, the focus will immediately shift to the 1,980–2000 region, where upside pressures faded in April. Another victory here could easily prompt a rally towards the 2,070 record high.
Alternatively, a flip backwards could stall somewhere between the 50% Fibonacci level of 1,842 and the 20-day SMA at 1,816. If downside pressures dominate, the decline could next pause near the 200- and 50-day SMAs, which are currently converging around 1,775. A step lower is expected to press the price aggressively to the 23.6% Fibonacci zone of 1,722 and then to the 1,700 psychological mark.
All in all, gold has the foundation to boost its uptrend in the coming sessions, though some consolidation around the important resistance of 1,878 cannot be ruled out.
EURUSD Jumps Higher in Ascending Channel
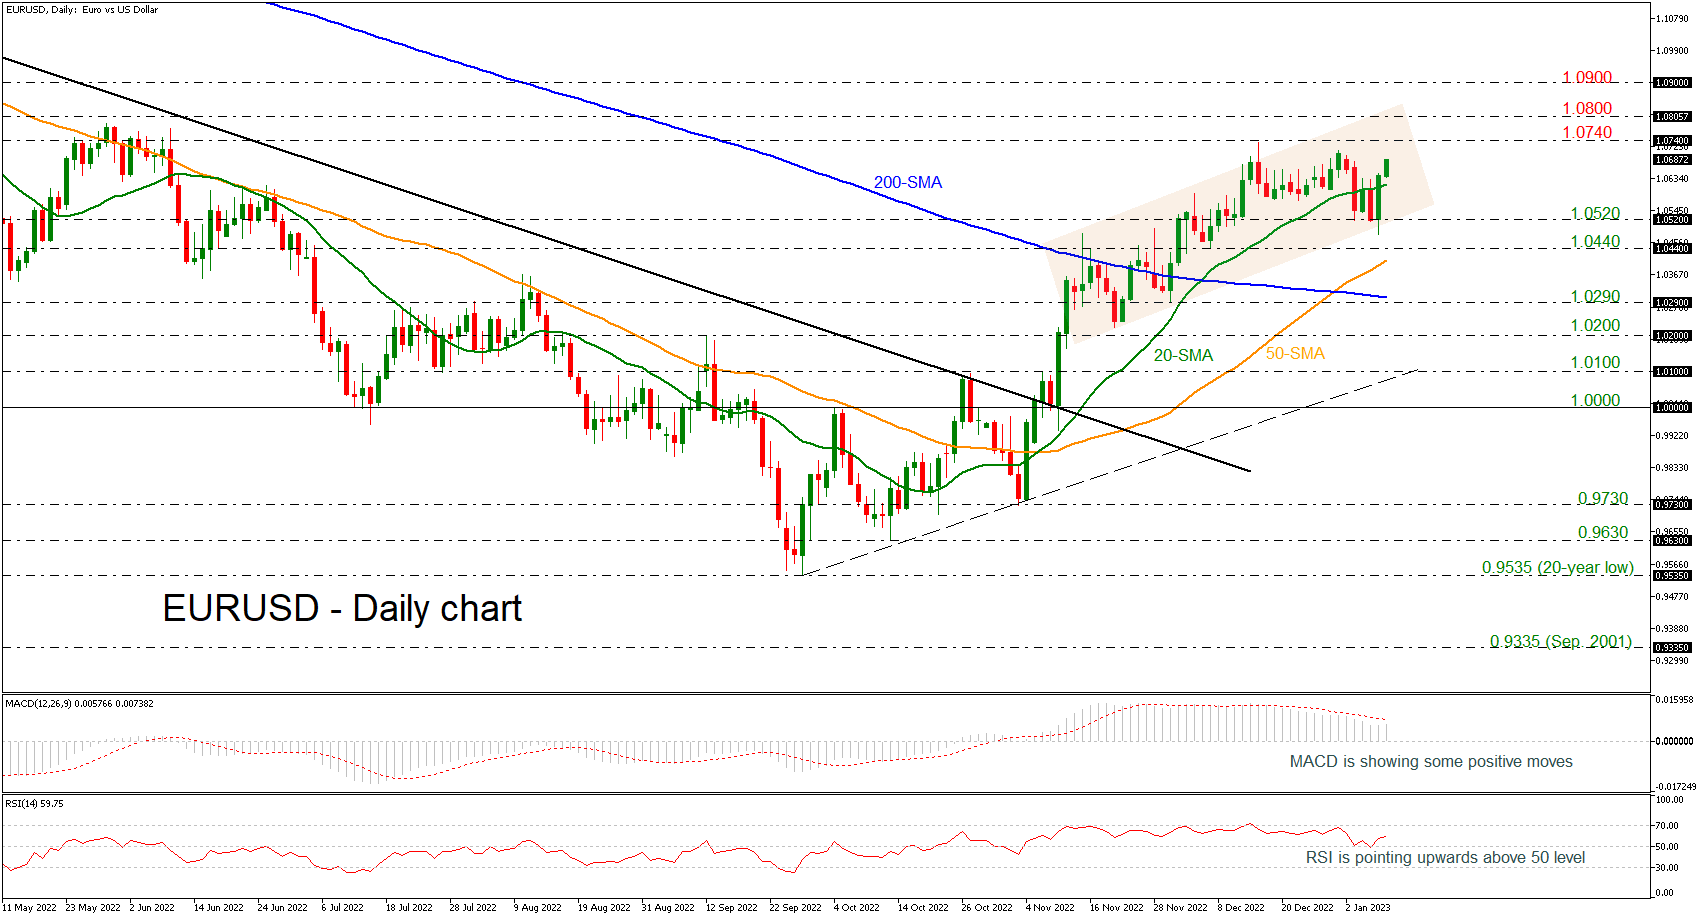
EURUSD recorded a stunning rally last week, adding more than 2% so far and approaching the 1.0700 psychological mark, holding within the upward sloping channel. The technical indicators suggest that the market could be boosted a little bit more in the short term.
The RSI is currently increasing positive momentum above its neutral threshold of 50, while the MACD is gaining ground in the bullish area, remaining beneath its trigger line. Both are hinting that the next move in prices could be on the upside rather than on the downside.
An extension to the upside and above the 1.0740 resistance could meet a restrictive region between the 1.0800 round number and the 1.0900 handle, while even higher, steeper increases could also touch the 1.1180 barrier, registered in March 2022.
On the other hand, if the pair weakens, the 1.0520 barrier could provide immediate support ahead of the 1.0440 line. Even lower, the 50-day simple moving average (SMA) at 1.0407 could attract greater attention as any leg lower could worsen the market’s bearish outlook, opening the way towards the 200-day SMA near the 1.0290 support.
To summarize, EURUSD looks bullish in the short-and medium-term timeframes and only a close beneath the 200-day SMA may change this outlook.