

Sample Category Title
Technical Outlook and Review
USD/JPY:
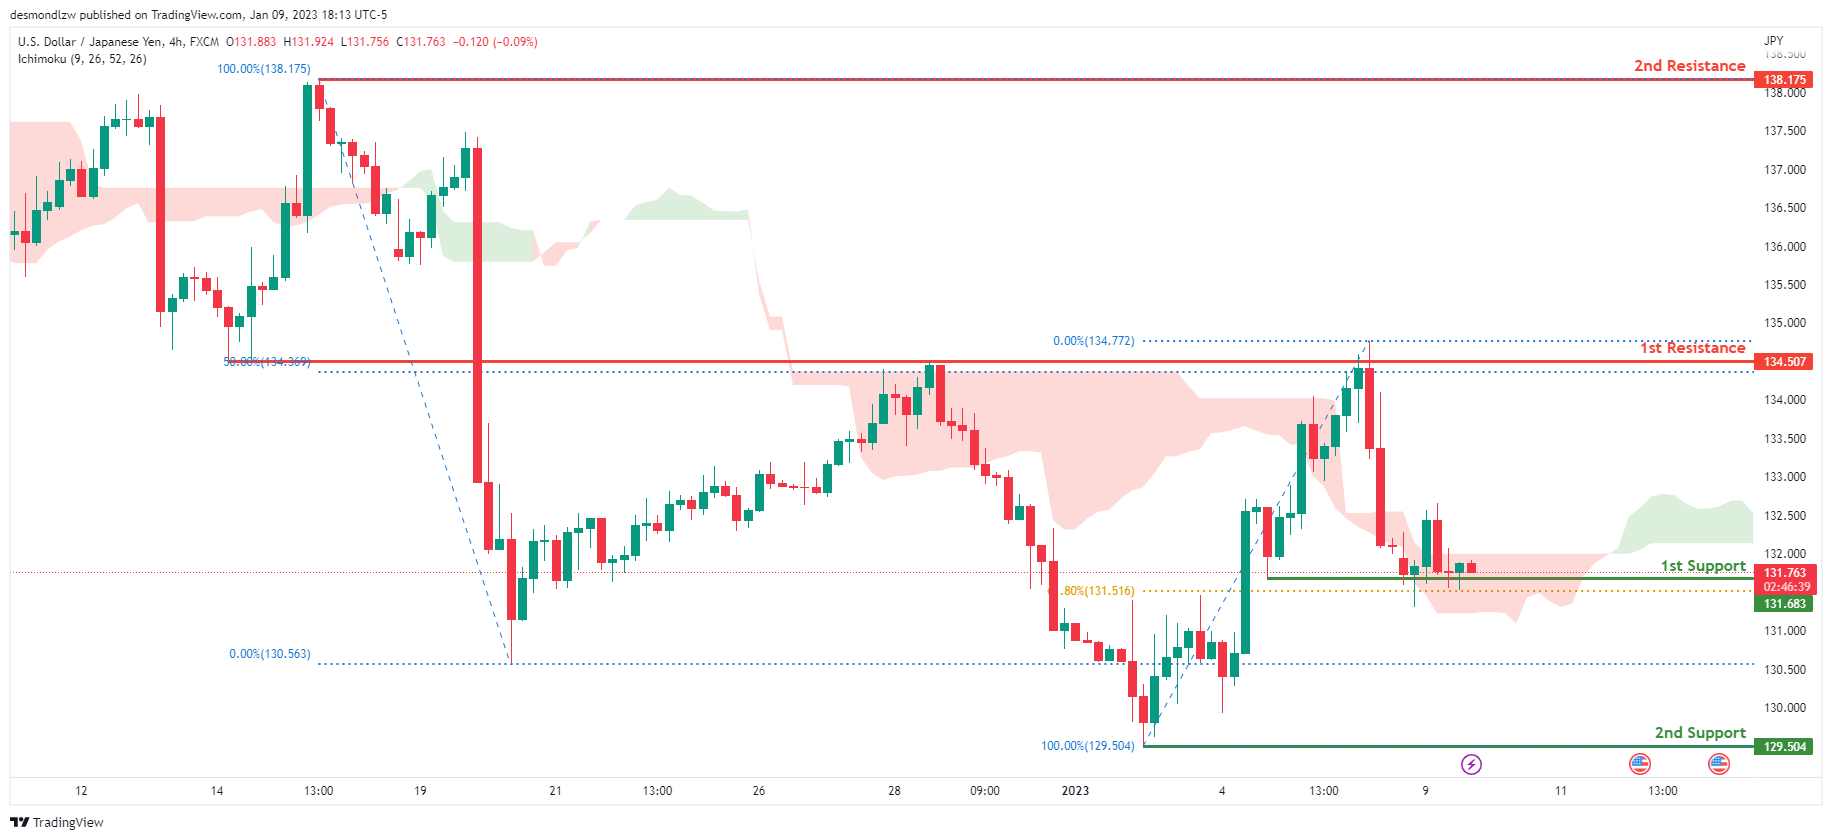
Looking at the H4 chart, my overall bias for USDJPY is bearish due to the current price being below the Ichimoku cloud, indicating a bearish market. If this bearish momentum continues, expect price to possibly break the 1st support at 131.683, where the 61.8% Fibonacci line is, before heading towards the 2nd support at 129.504, where the previous swing low is. In an alternate scenario, price could possibly head back up towards the 1st resistance level at 134.507, where the 50% Fibonacci line is.
Areas of consideration:
- H4 time frame, 1st resistance at 134.507
- H4 time frame, 1st support at 131.683
- H4 time frame, 2nd support at 129.504
DXY:
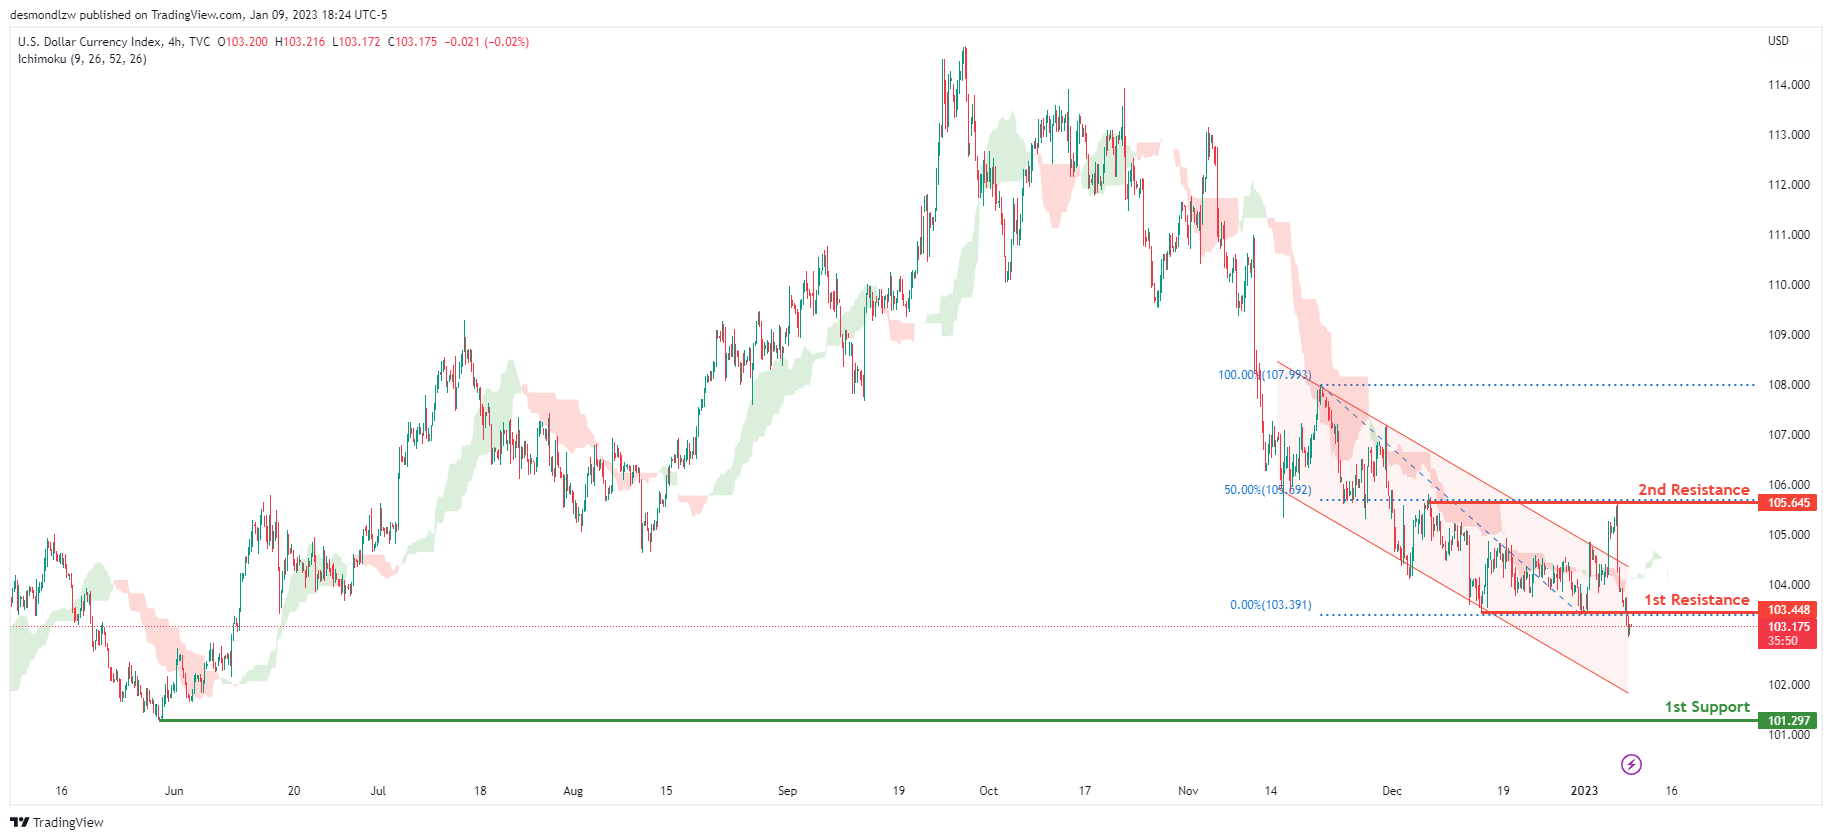
Looking at the H4 chart, my overall bias for DXY is bearish due to the current price being below the Ichimoku cloud, indicating a bearish market. To add confluence to this, price is within the descending channel which indicates a bearish market. If this bearish momentum continues, expect the price to possibly continue heading towards the 1st support at 101.297, where the previous lows and liquidity hotspots are. In an alternative scenario, price could head back up to retest the 1st resistance at 103.448, where the previous low is.
Areas of consideration:
- H4 time frame, 1st resistance at 103.448
- H4 time frame, 1st support at 101.297
EUR/USD:
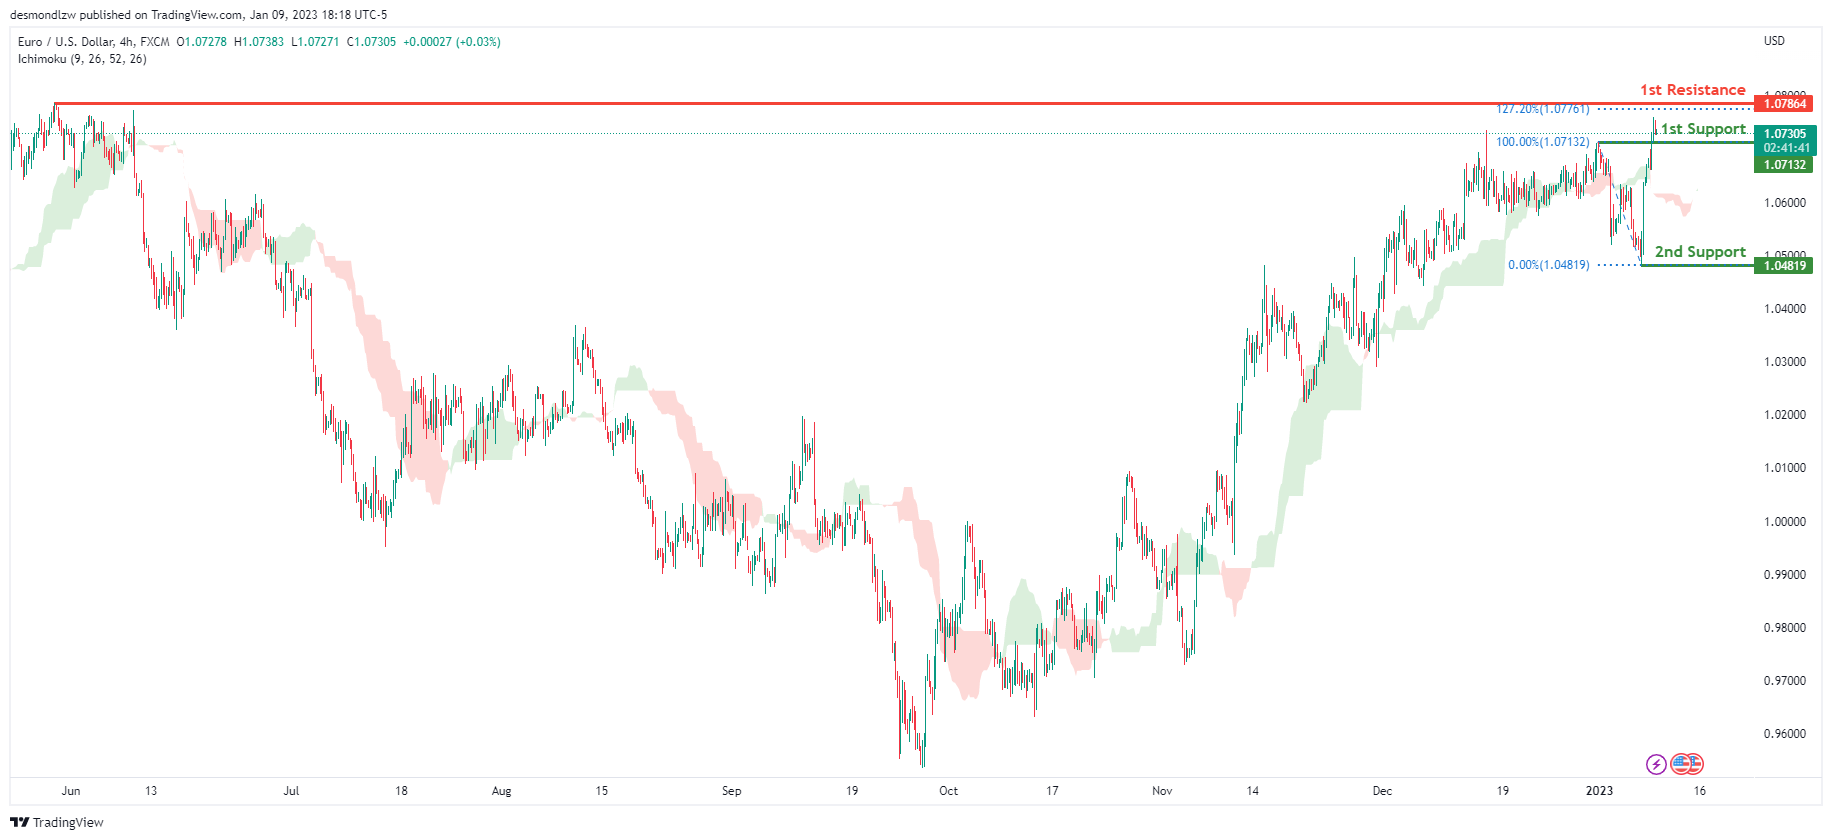
Looking at the H4 chart, my overall bias for EURUSD is bullish due to the current price being above the Ichimoku cloud, indicating a bullish market structure. If this bullish momentum continues, expect the price to possibly continue heading towards the 1st resistance at 1.07864, where the previous swing high is. In an alternate scenario, price could possibly head back down to retest the 1st support level at 1.07132, where the previous swing high is.
Areas of consideration :
- H4 1st resistance at 1.07864
- H4 1st support at 1.07132
GBP/USD:
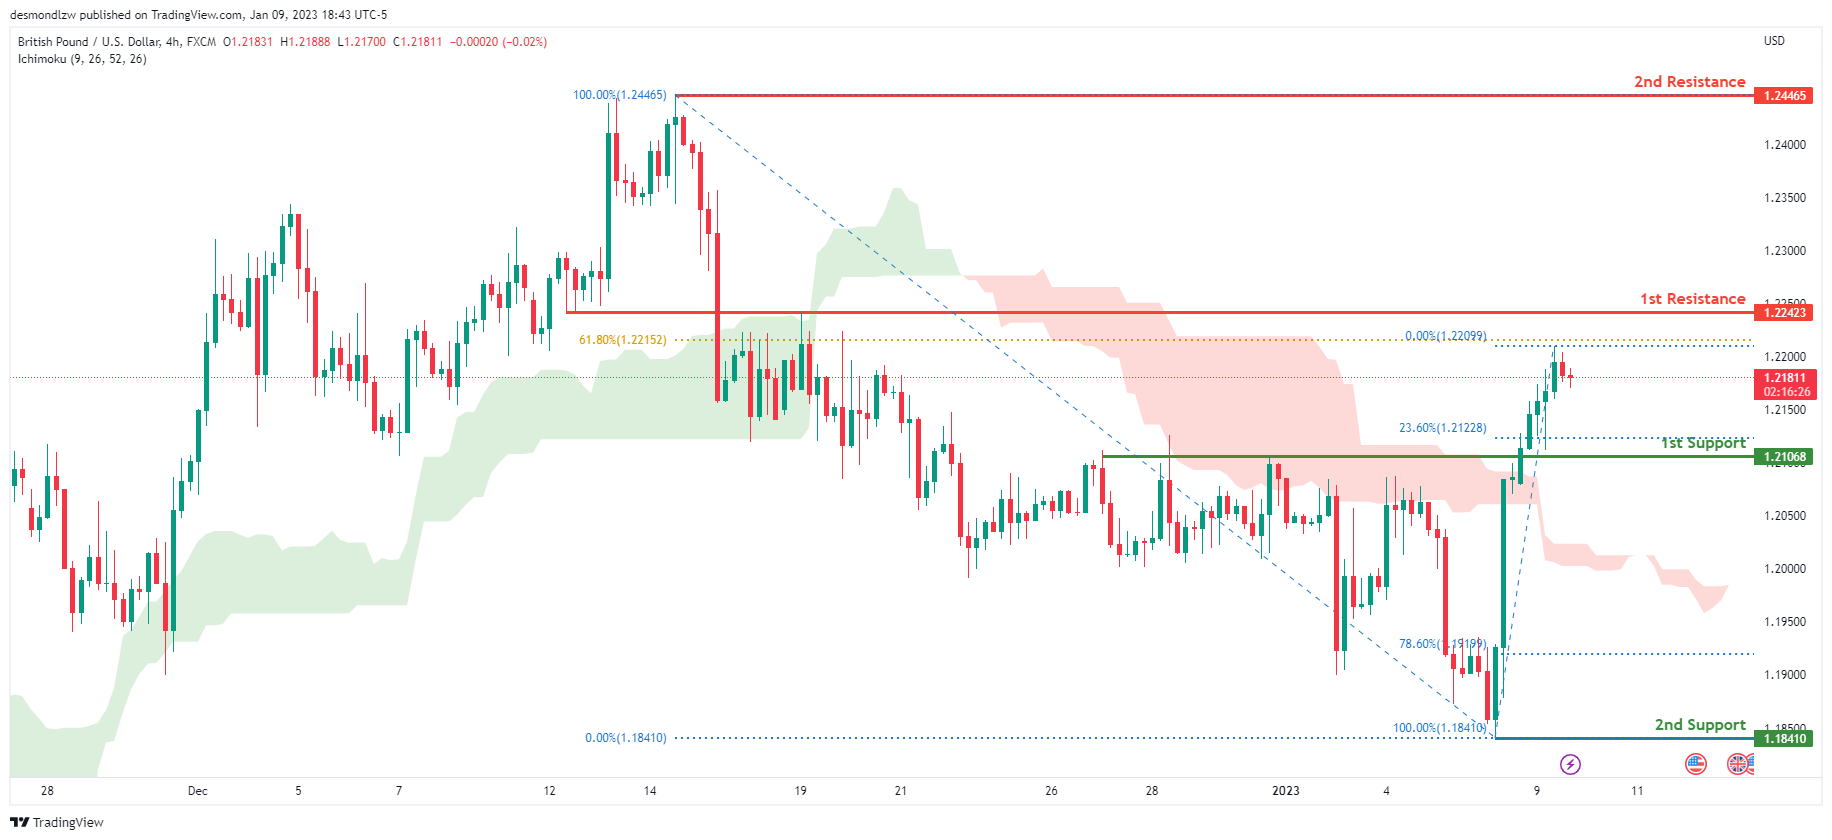
Looking at the H4 chart, my overall bias for GBPUSD is bullish due to the current price being above the Ichimoku cloud, indicating a bullish market. If this bullish momentum continues, expect price to possibly continue heading towards the 1st resistance line at 1.22423, slightly above where the 61.8% Fibonacci line is. In an alternate scenario, price could possibly head back down towards the 1st support at 1.21068, where the 23.6% Fibonacci line is
Areas of consideration:
- H4 1st resistance at 1.22423
- H4 1st support at 1.21068
USD/CHF:
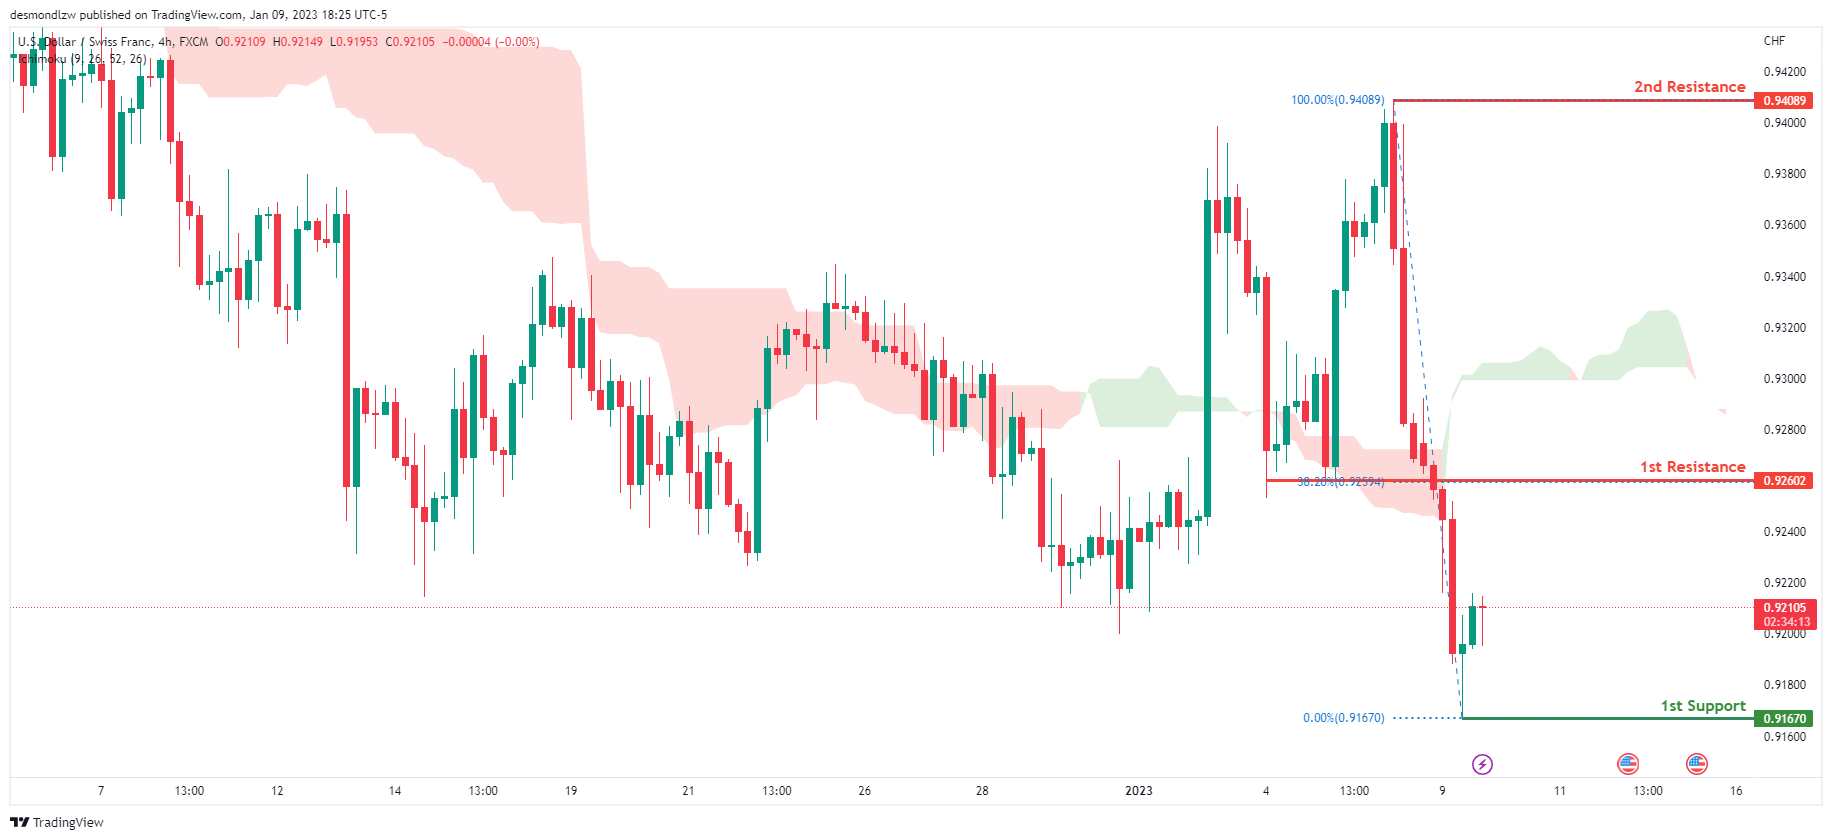
Looking at the H4 chart, my overall bias for USDCHF is bearish due to the current price being below the Ichimoku cloud, indicating a bearish market. If the current bearish trend continues, expect the price to head towards the 1st support at 0.91670, where the recent low is. In an alternative scenario, price could possibly head back up to retest the 1st resistance at 0.92602, where the 38.2% Fibonacci line is.
Areas of consideration
- H4 1st support at 0.91670
- H4 1st resistance at 0.92602
XAU/USD (GOLD):
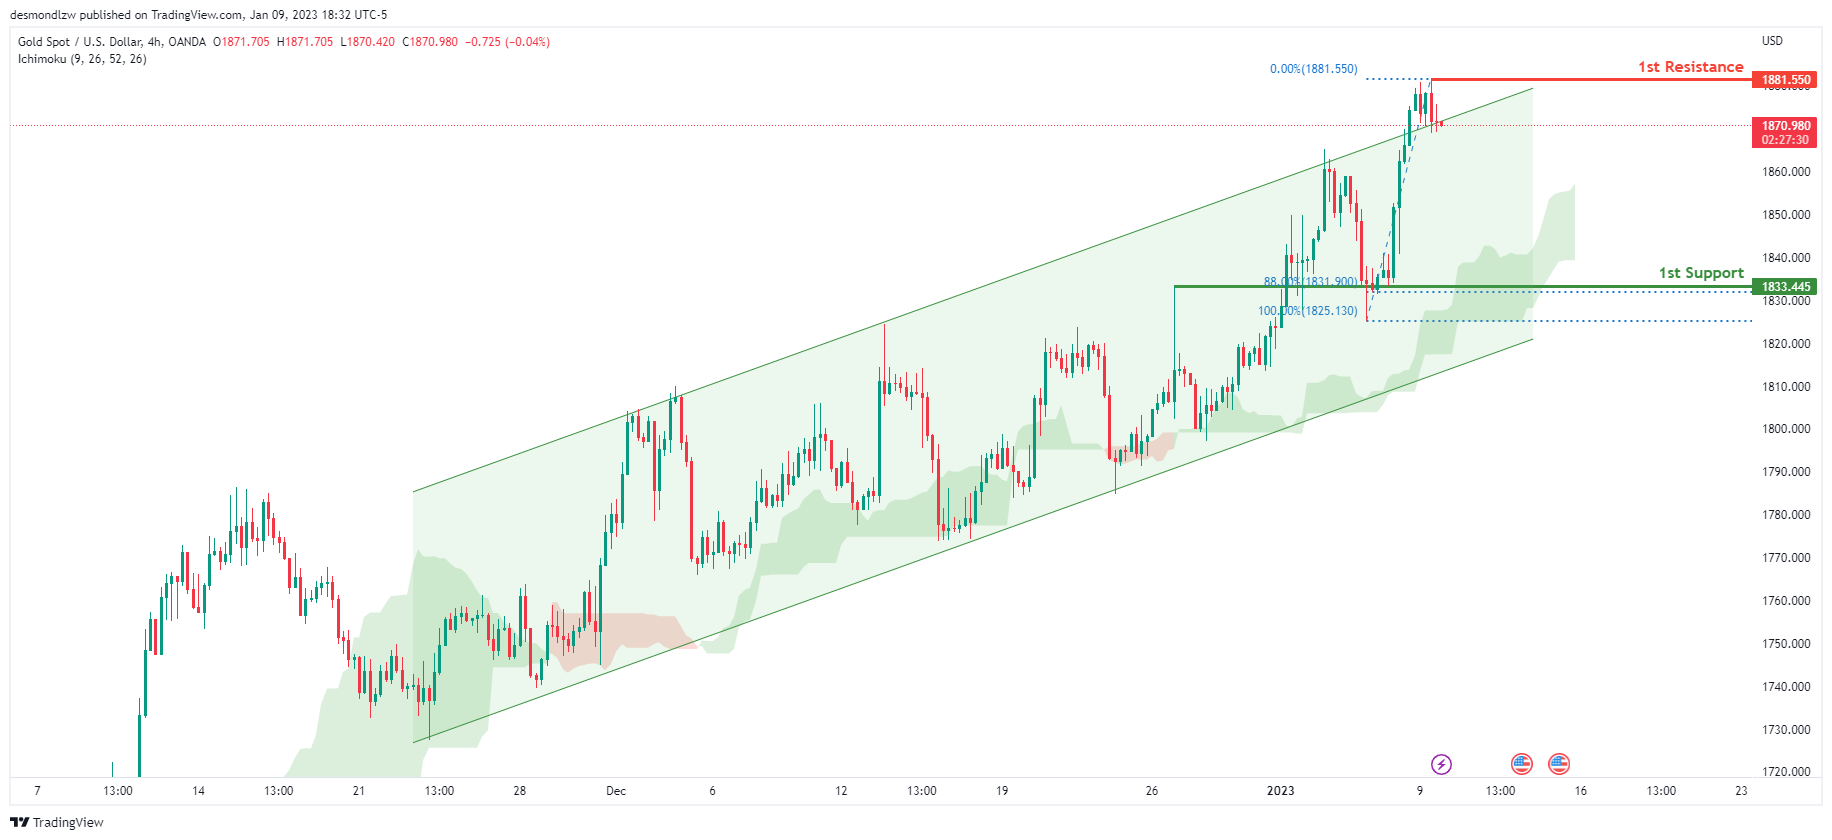
Looking at the H4 chart, my overall bias for XAUUSD is bullish due to the current price crossing above the Ichimoku cloud, indicating a bullish market. To add support to this bias, price is also within a bullish ascending channel. If this bullish momentum continues, expect the price to possibly continue heading towards the 1st resistance at 1881.550 where the recent high is. In an alternative scenario, price could possibly head back down towards the 1st support at 1833.445, where the 88% Fibonacci line is.
Areas of consideration:
- H4 time frame, 1st resistance at 1881.550
- H4 time frame, 1st support at 1833.445
- H4 time frame, 2nd support at 1833.445
AUD/USD:
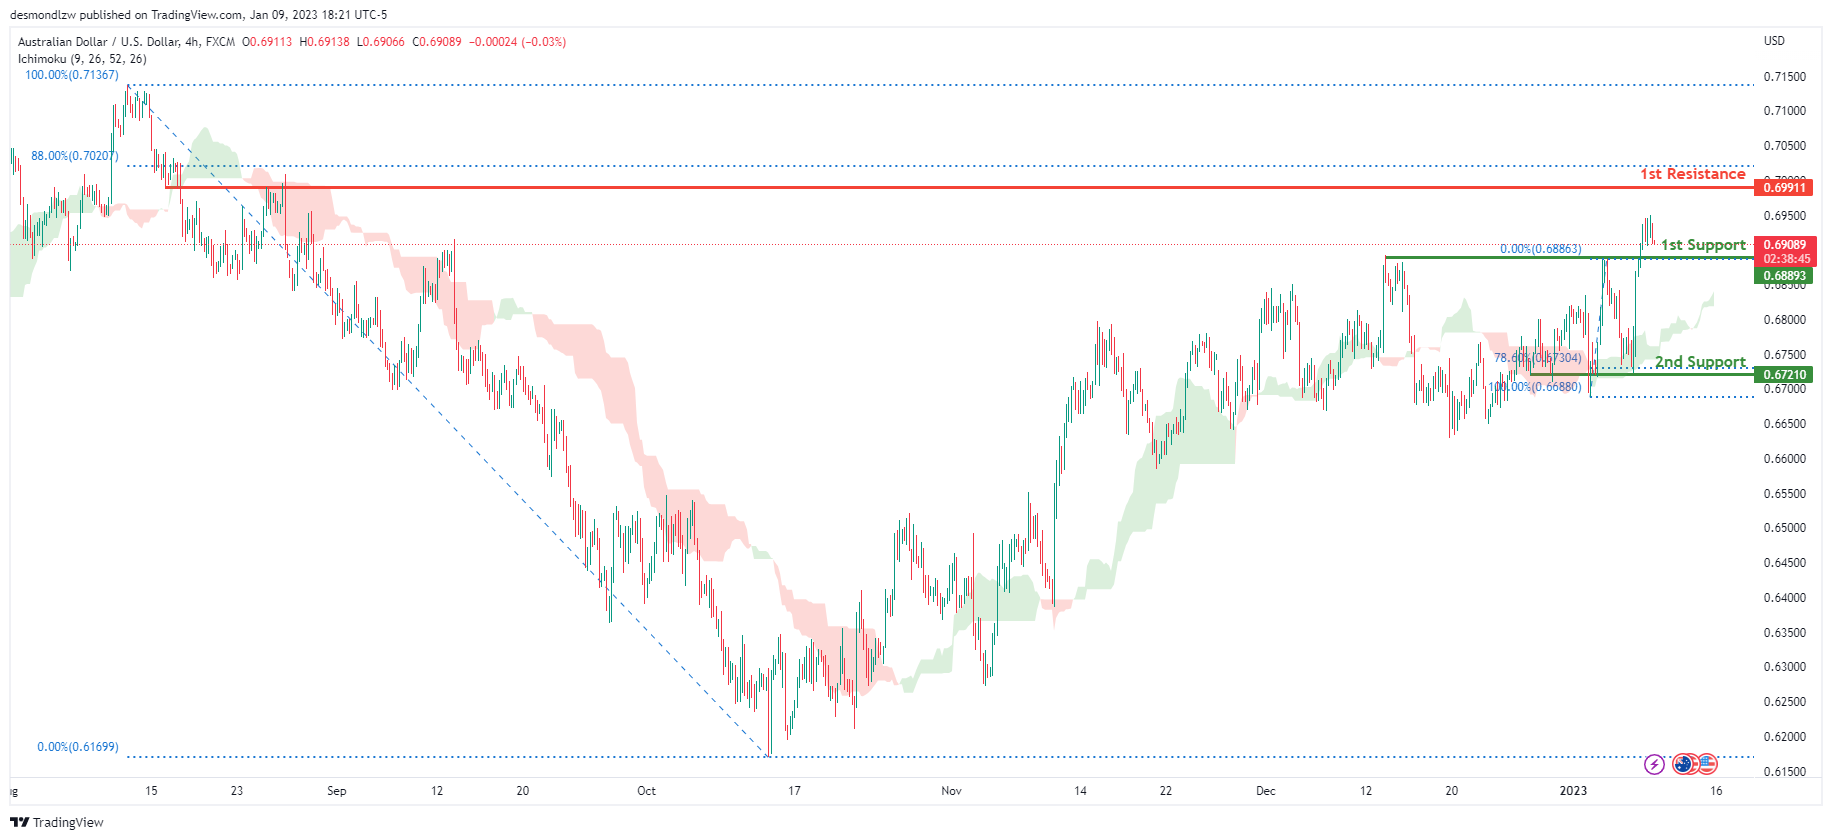
Looking at the H4 chart, my overall bias for AUDUSD is bullish due to the current price being above the Ichimoku cloud, indicating a bullish market. If this bullish momentum continues, expect the price to continue heading towards the 1st resistance at 0.69911, where the 88% Fibonacci line is. In an alternative scenario, price could possibly head back down towards the 1st support at 0.68893, where the recent swing high is
Areas of consideration
- H4, 1st resistance at 0.69911
- H4, 1st support at 0.68893
NZD/USD:
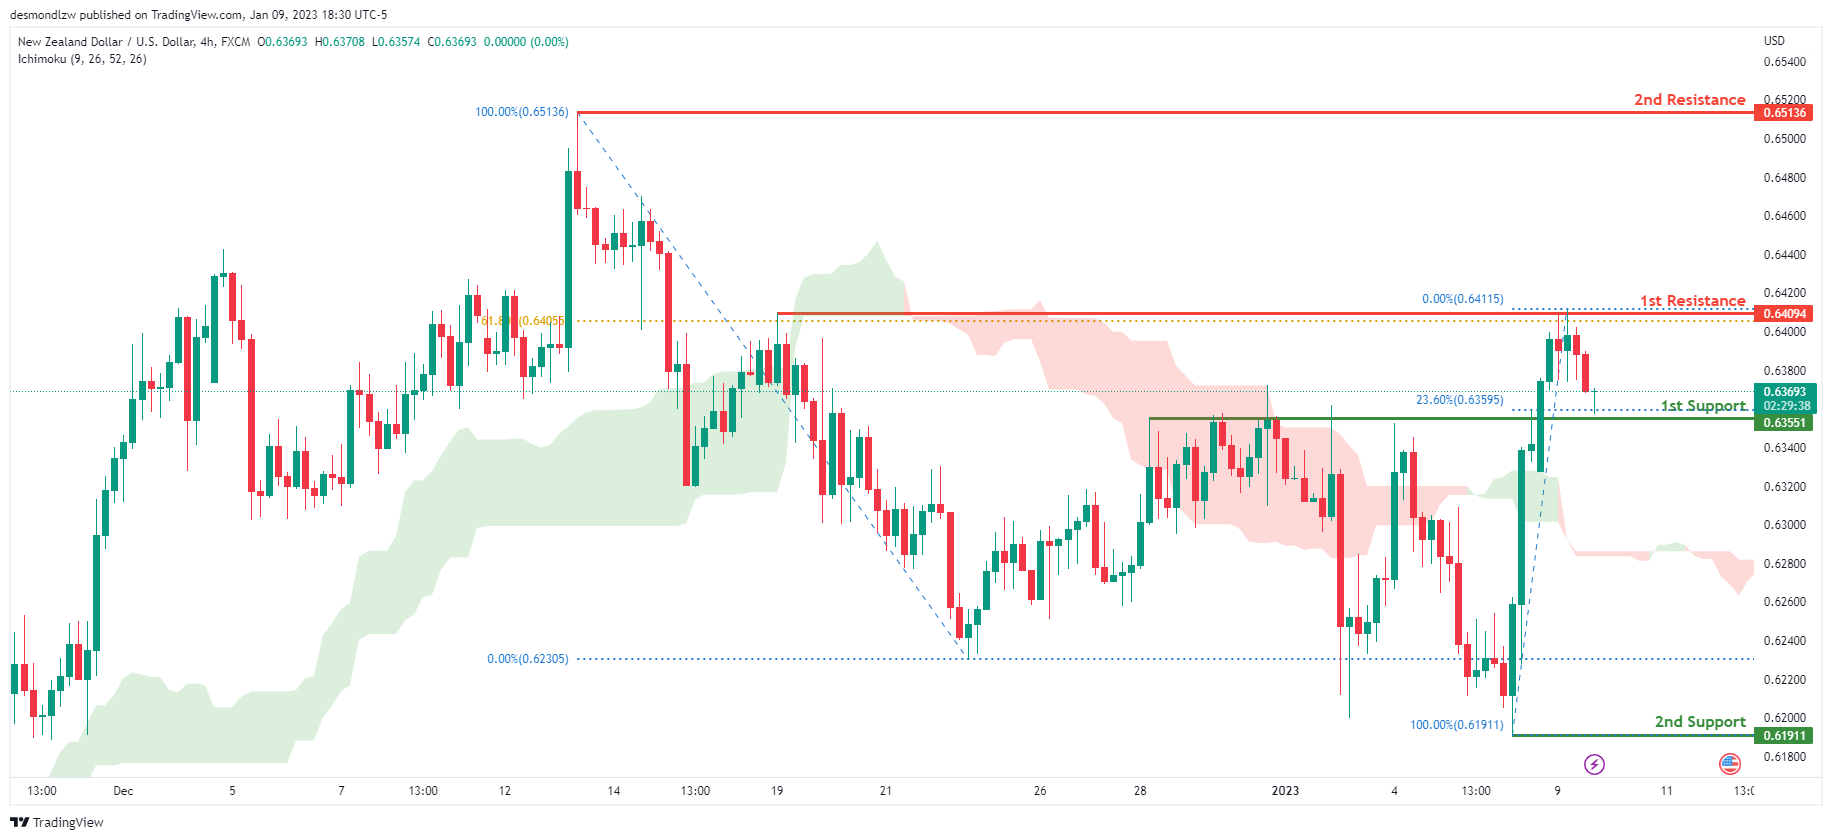
Looking at the H4 chart, my overall bias for NZDUSD is bullish due to the current price being above the Ichimoku cloud, indicating a bullish market. If this bullish momentum continues, expect price to possibly continue heading towards the 1st resistance at 0.64094, where the 61.8% Fibonacci line is. In an alternate scenario, price could possibly head back down to retest the 1st support at 0.63551, where the 23.6% Fibonacci line is
Areas of consideration:
- H4 time frame, 1st resistance at 0.64094
- H4 time frame, 1st support at 0.63551
USD/CAD:
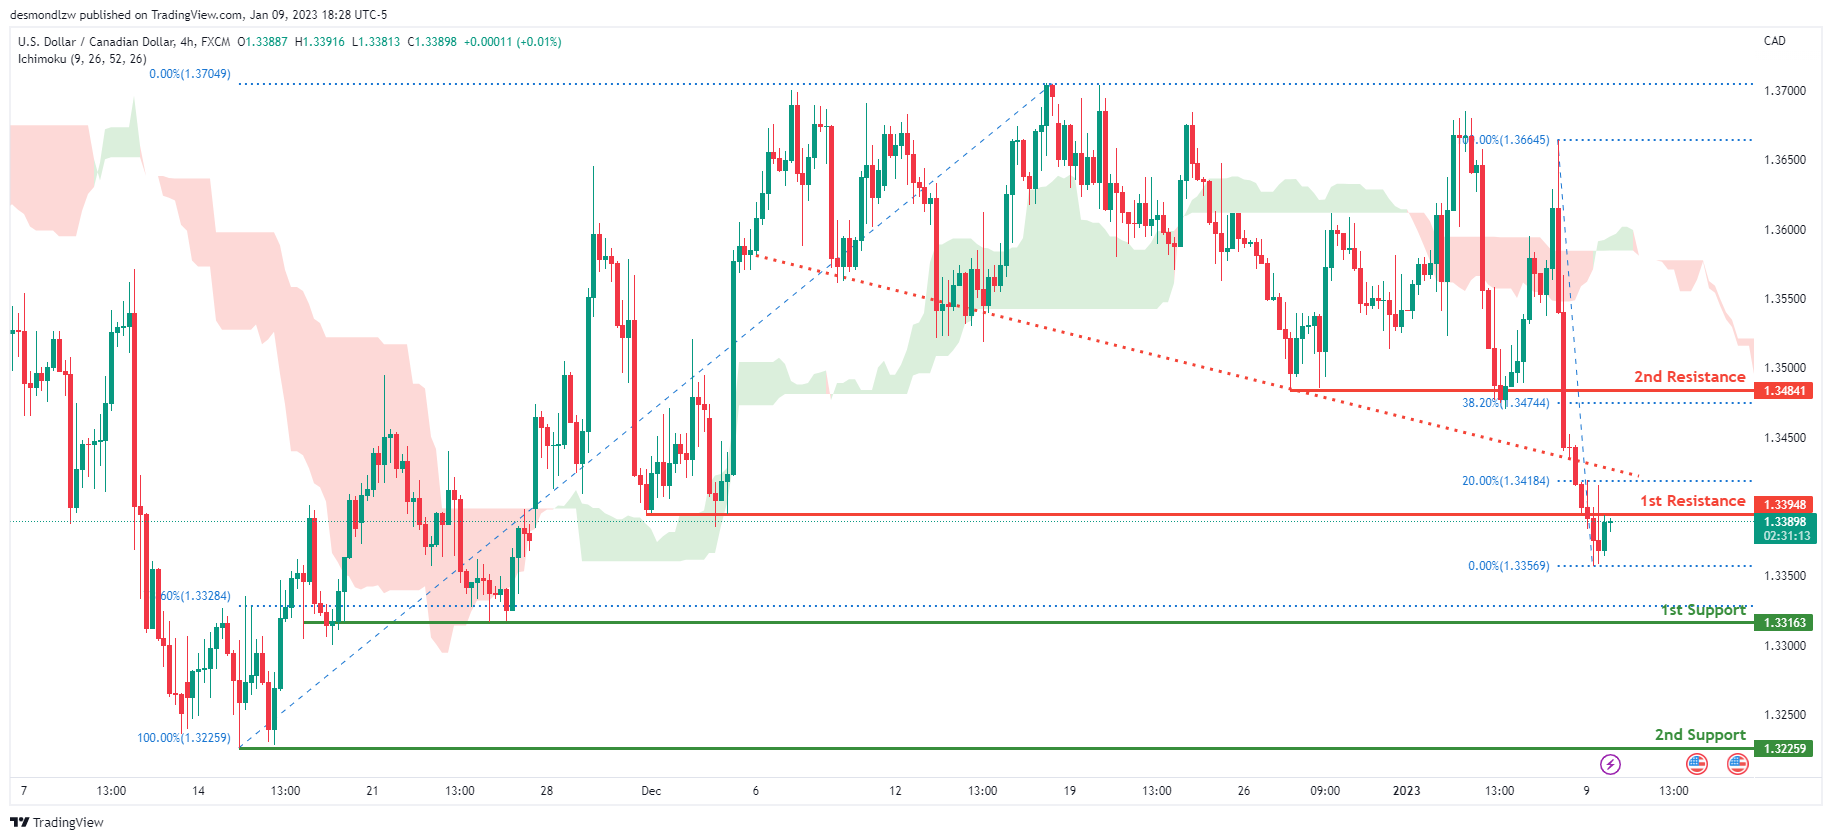
On the H4 chart, the overall bias for USDCAD is bearish. To add confluence to this, the price is below the Ichimoku cloud which indicates a bearish market. To add support to this bias, price has also broken under the descending trendline indicating strong bearish momentum. If this bearish momentum continues, expect the price to possibly head towards the 1st support at 1.33163, where the 78.6% Fibonacci line is. In an alternative scenario, price could head back up to retest the 1st resistance at 1.33948, slightly below where the 20% Fibonacci line is.
Areas of consideration:
- H4 time frame, 1st resistance at 1.33948
- H4 time frame, 1st support at 1.33163
OIL:
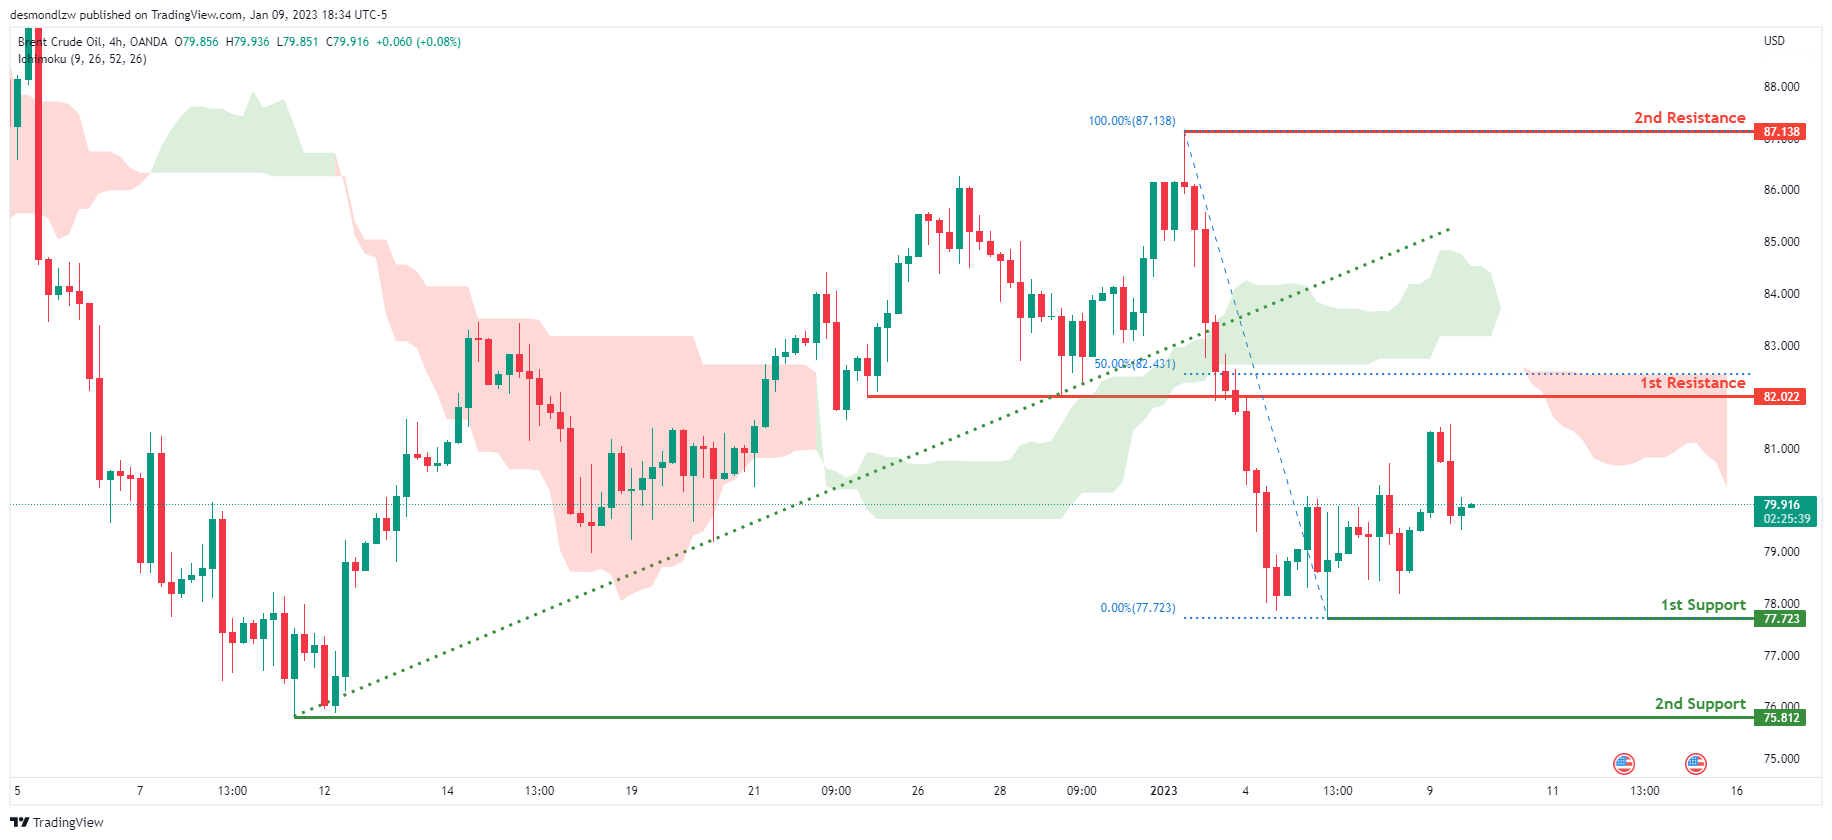
Looking at the H4 chart, my overall bias for BCOUSD is bearish due to the current price crossing below the Ichimoku cloud, indicating a bearish market. Adding more confluence to this bias, price has also broken the ascending trend line. If this bearish momentum continues, expect the price to possibly continue heading towards the 1st support at 77.723, where the recent low is. In an alternate scenario, price could possibly head back up to retest the 1st resistance at 82.022, slightly below where the 50% Fibonacci line is
Areas of consideration:
- H4 time frame, 1st resistance at 82.022
- H4 time frame, 1st support at 77.723
Dow Jones Industrial Average:
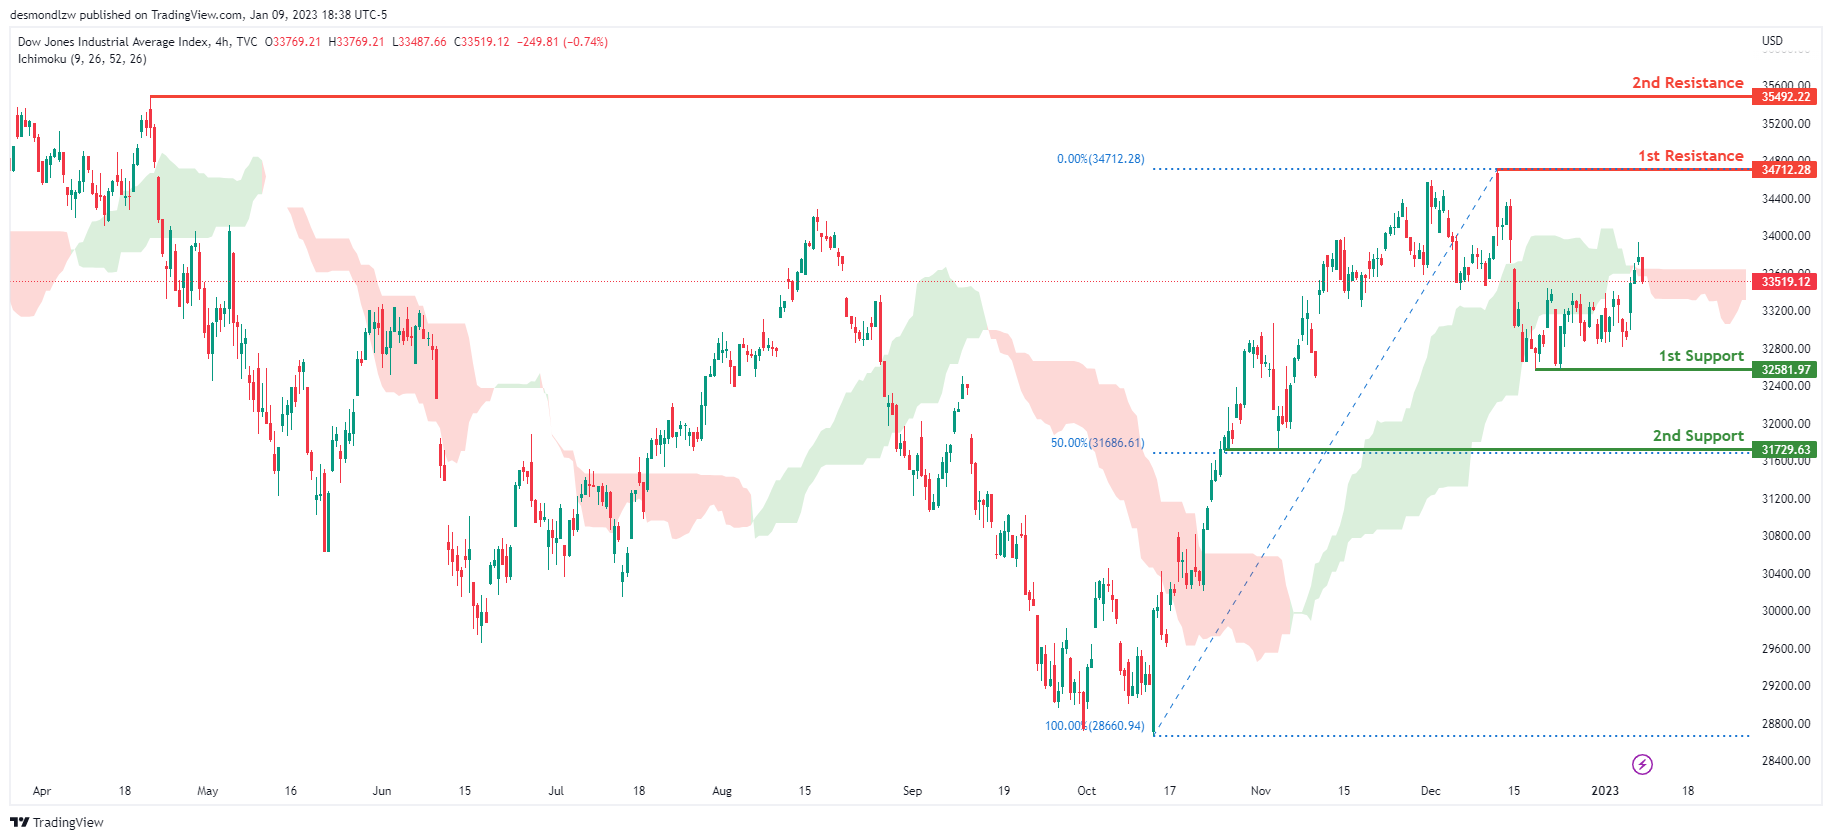
On the H4 chart, the overall bias for DJI is bearish. To add confluence to this, the price is crossing below the Ichimoku cloud which indicates a bearish market. If this bearish momentum continues, expect the price to head back down towards the 1st support at 32581.97, where the recent low is. In an alternative scenario, price could possibly continue heading towards the 1st resistance line at 34712.28, where the recent swing high is.
Areas of consideration:
- H4 time frame, 1st support at 32581.97
- H4 time frame, 1st Resistance at 34712.28
DAX:
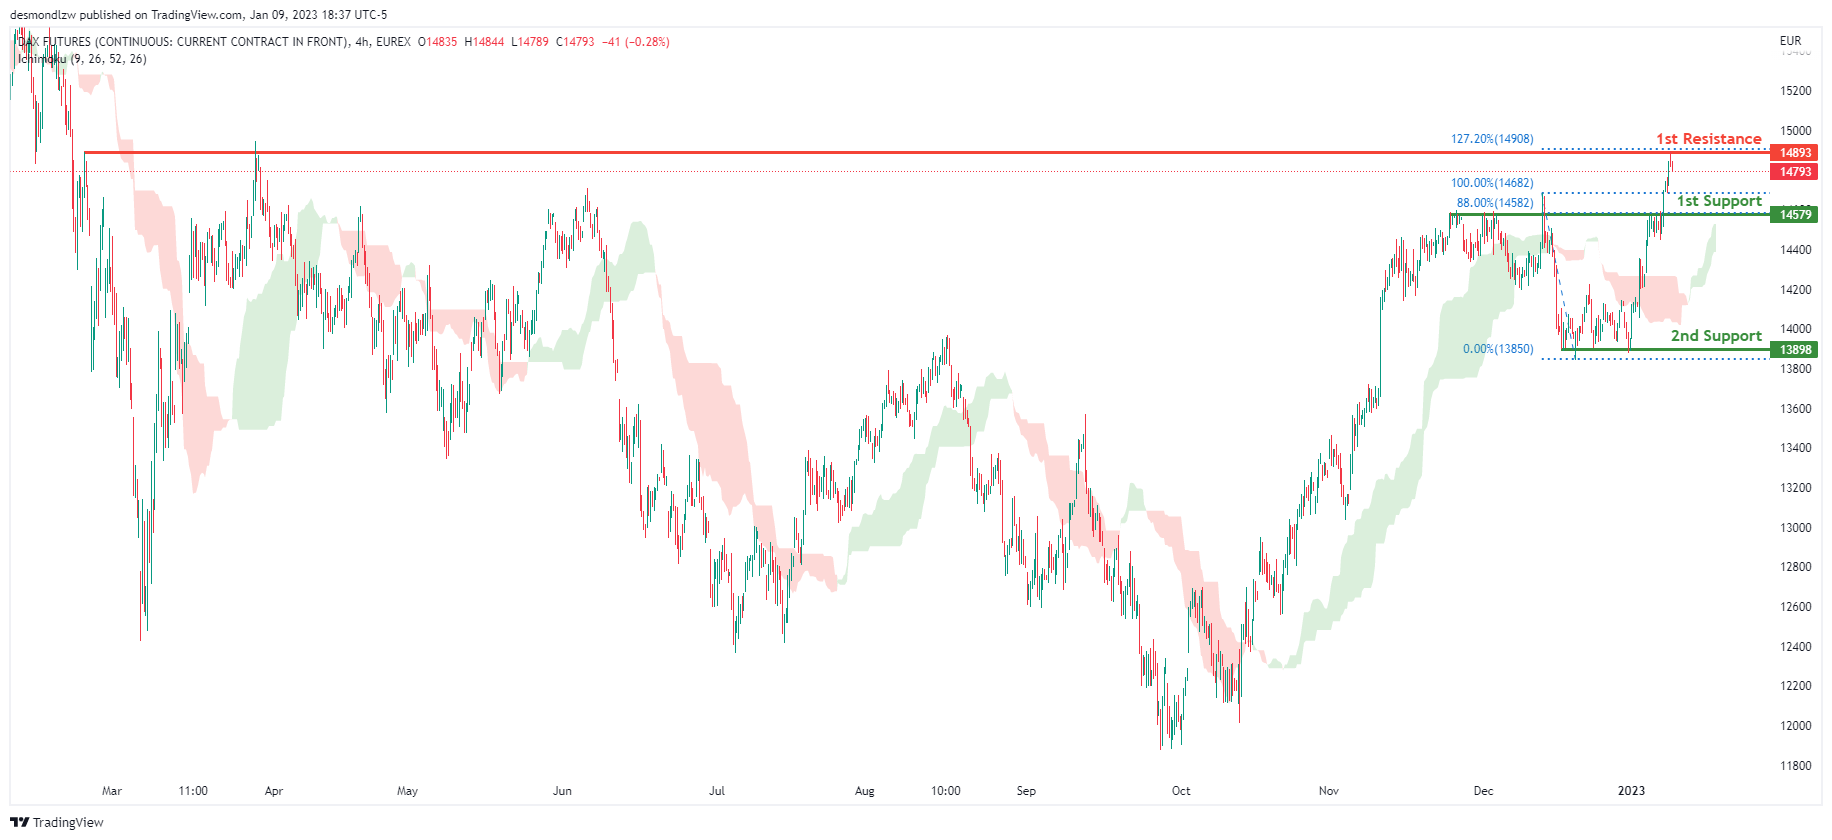
Looking at the H4 chart, my overall bias for DAX is bullish due to the current price crossing above the Ichimoku cloud, indicating a bullish market. If this bullish momentum continues, expect the price to possibly head towards the 1st resistance line at 14893, where the 127.2% Fibonacci extension line is. In an alternative scenario, price could possibly head down to retest the 1st support at 14579, where the 88% Fibonacci line is.
Areas of consideration:
- H4 time frame, 1st resistance is at 14893
- H4 time frame, 1st support is at 14579
ETHUSD:
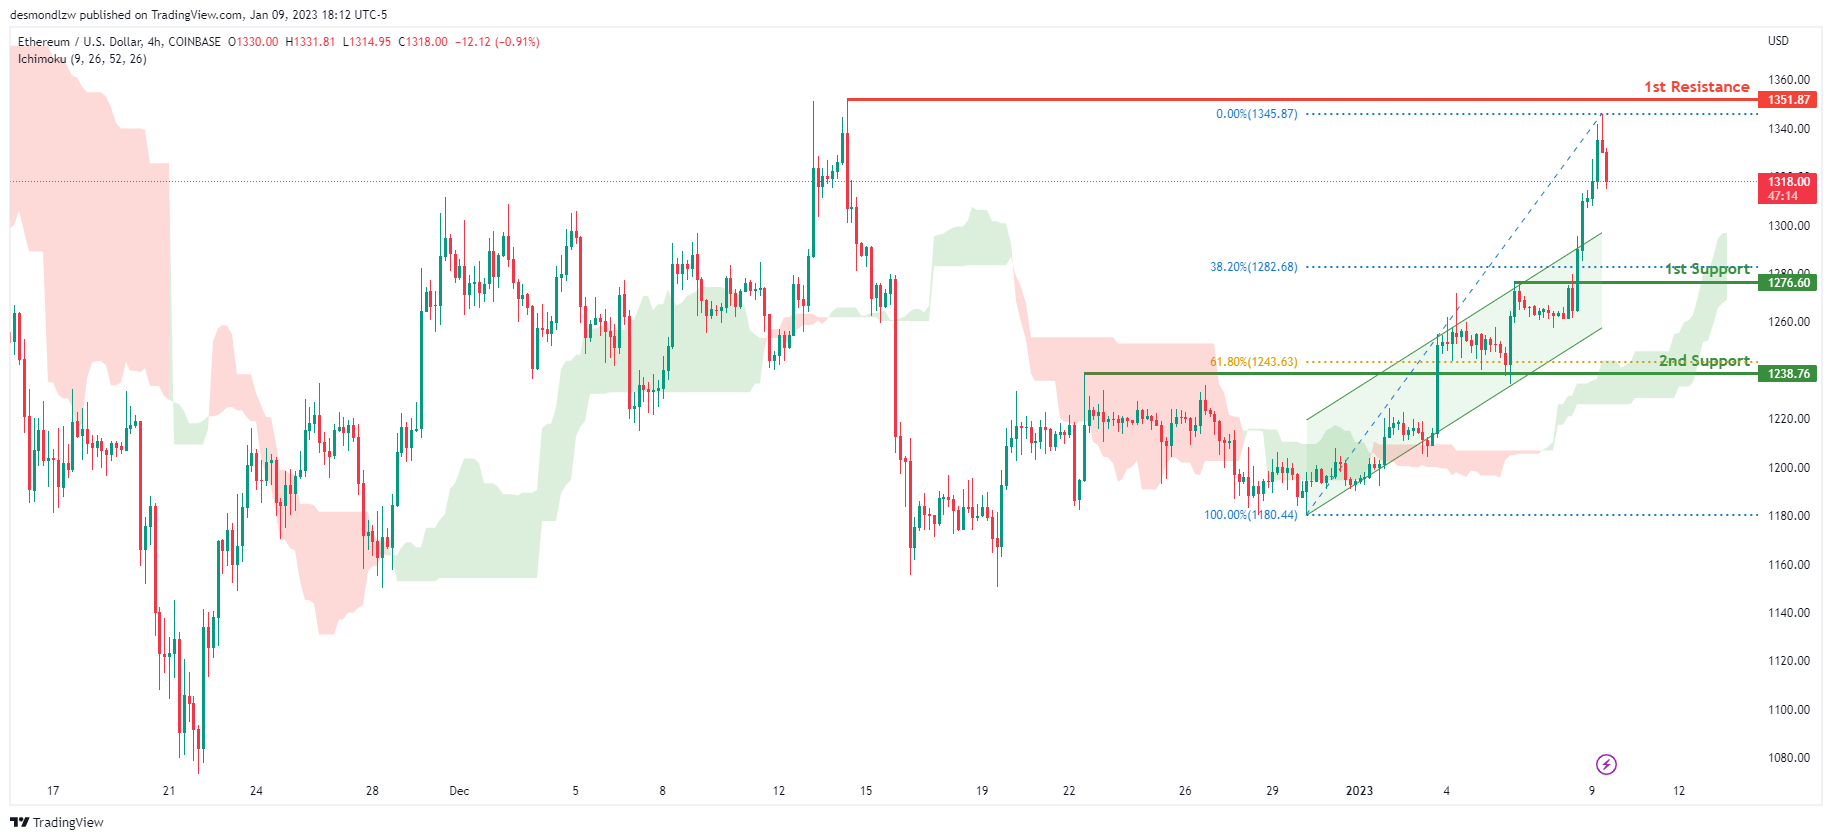
Looking at the H4 chart, my overall bias for ETHUSD is bullish due to the current price crossing above the Ichimoku cloud, indicating a bullish market. To add support to this bias, price is also broken upwards from an ascending channel. If this bullish momentum continues, expect the price to head towards the 1st resistance at 1351.87, where the previous swing high is. In an alternative scenario, price could head back down to retest the 1st support at 1276.60, where the 38.2% Fibonacci line is.
Areas of consideration:
- H4 time frame, 1st resistance of 1351.87
- H4 time frame, 1st support at 1276.60
BTCUSD:
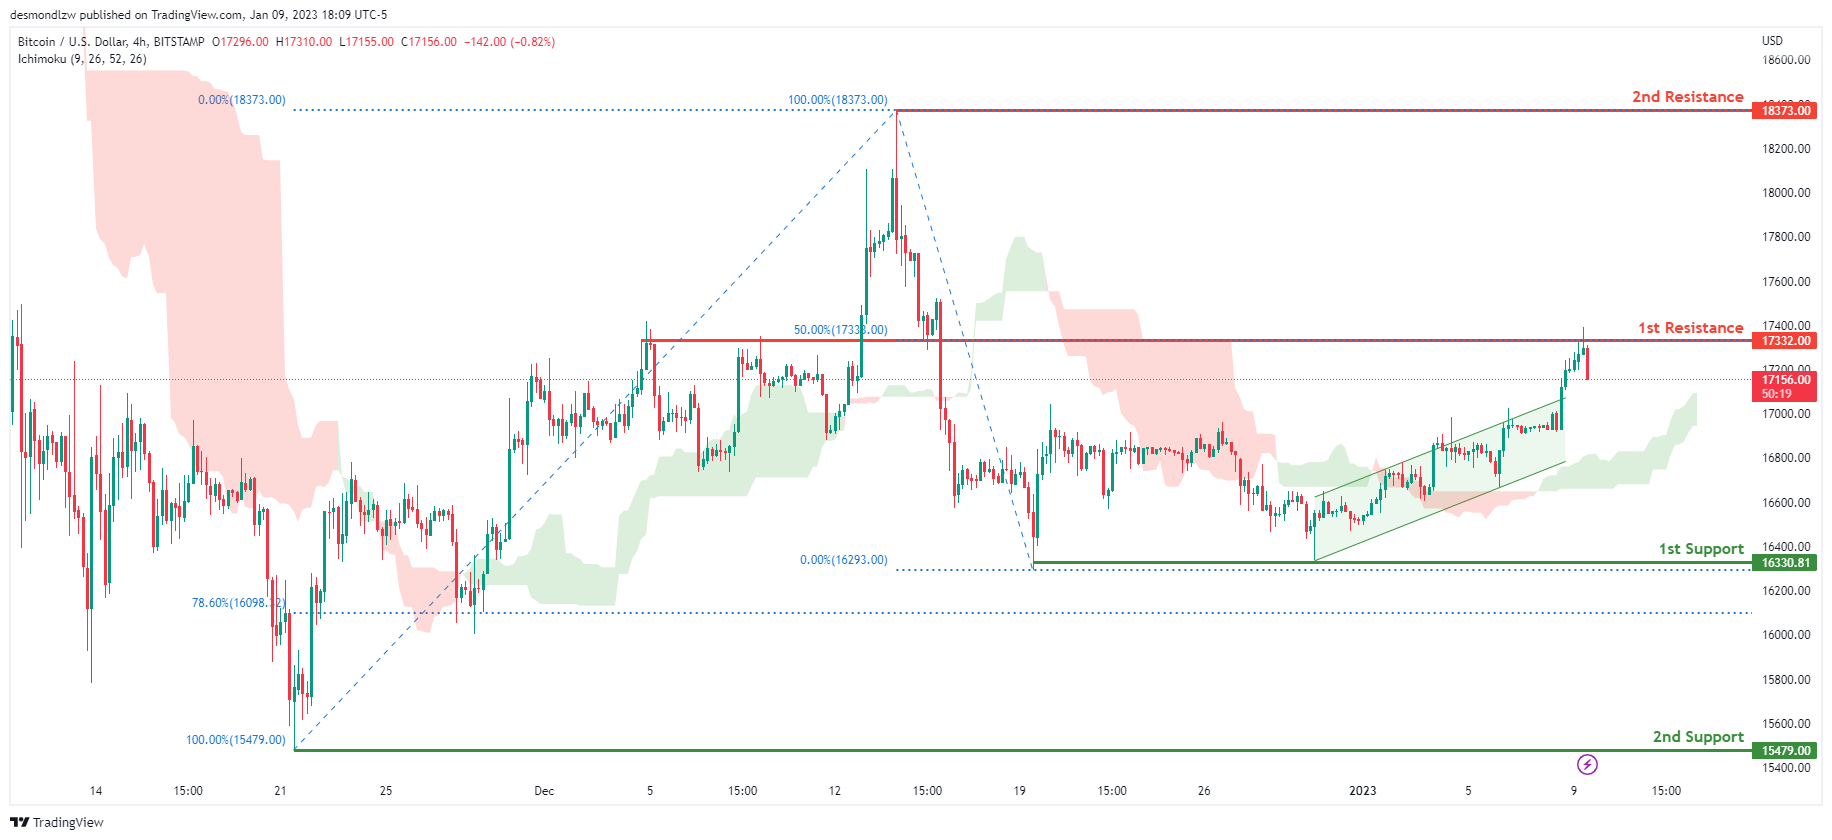
Looking at the H4 chart, my overall bias for BTCUSD is bullish due to the current price being above the Ichimoku cloud, indicating a bullish market. To add support to this bias, price is also within a bullish ascending channel. If this bullish momentum continues, expect the price to possibly continue heading towards the 1st resistance at 17332.00, where the 50% Fibonacci line is. In an alternative scenario, price could possibly head back down towards the 1st support at 16330.81, where the recent low and liquidity hotspot are.
Areas of consideration:
- H4 time frame, 1st resistance 17332.00
- H4 time frame, 1st support at 16330.81
S&P 500:
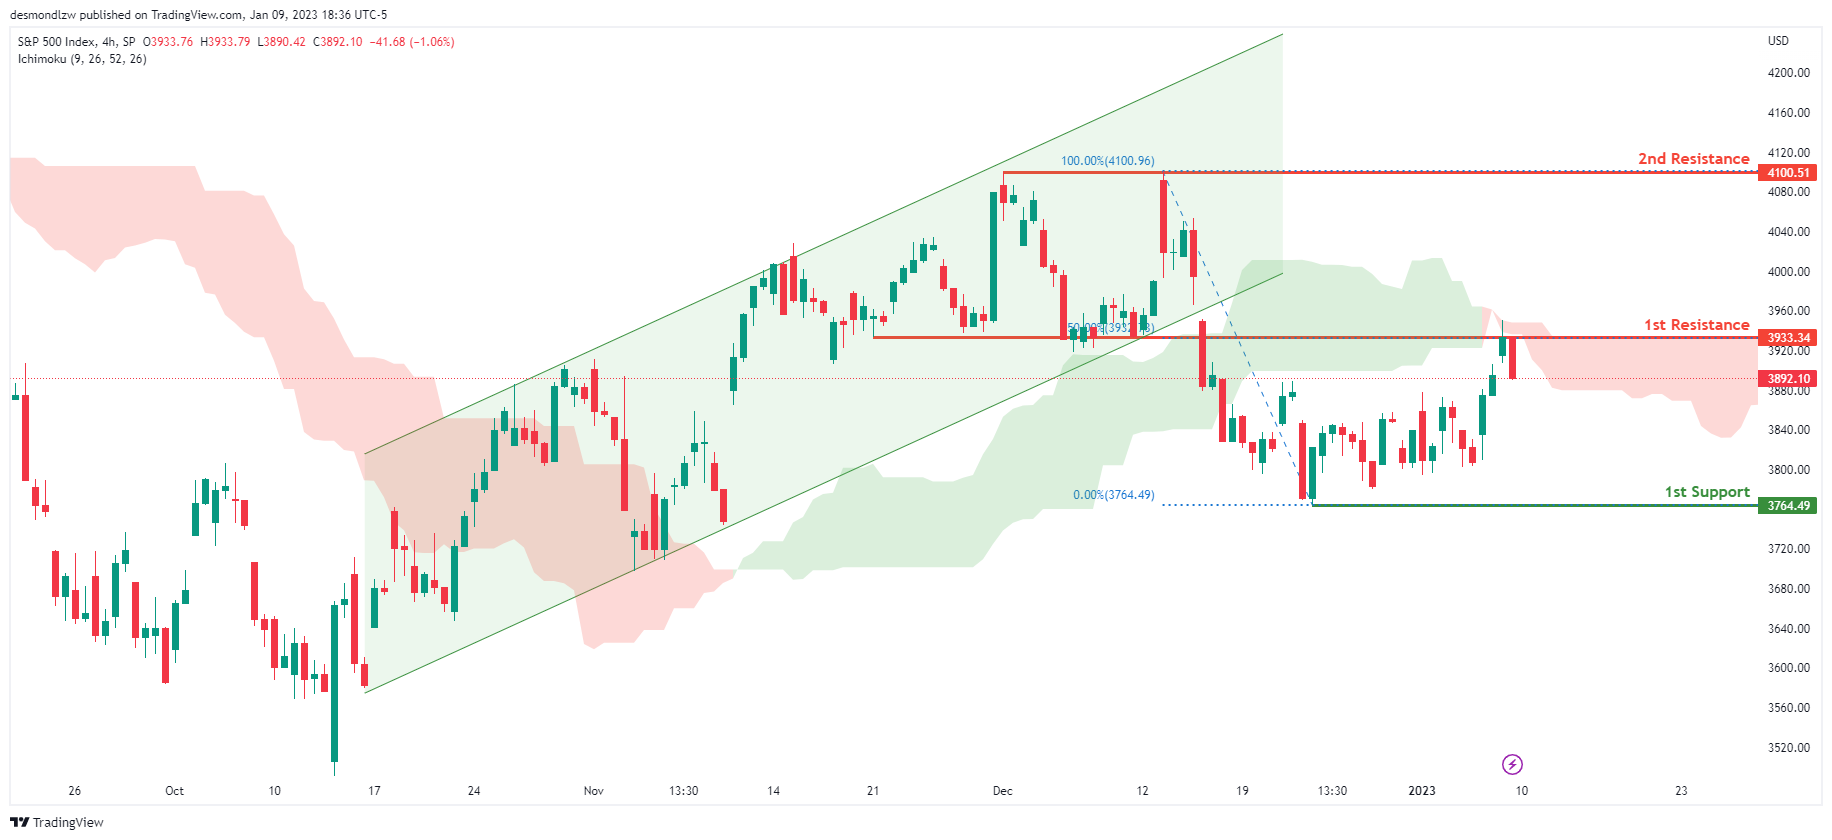
Looking at the H4 chart, my overall bias for S&P500 is bearish due to the current price being below the Ichimoku cloud, indicating a bearish market. If this bearish momentum continues, expect the price to continue heading towards the 1st support at 3764.49, where the recent low is. In an alternative scenario, price could possibly head back up to retest the 1st resistance at 3933.34, where the 50% Fibonacci line is.
Areas of consideration:
- H4 time frame, 1st support at 3764.49
- H4 time frame, 1st resistance at 3933.34
DAX Looking to End 5 Waves Elliott Wave Impulse
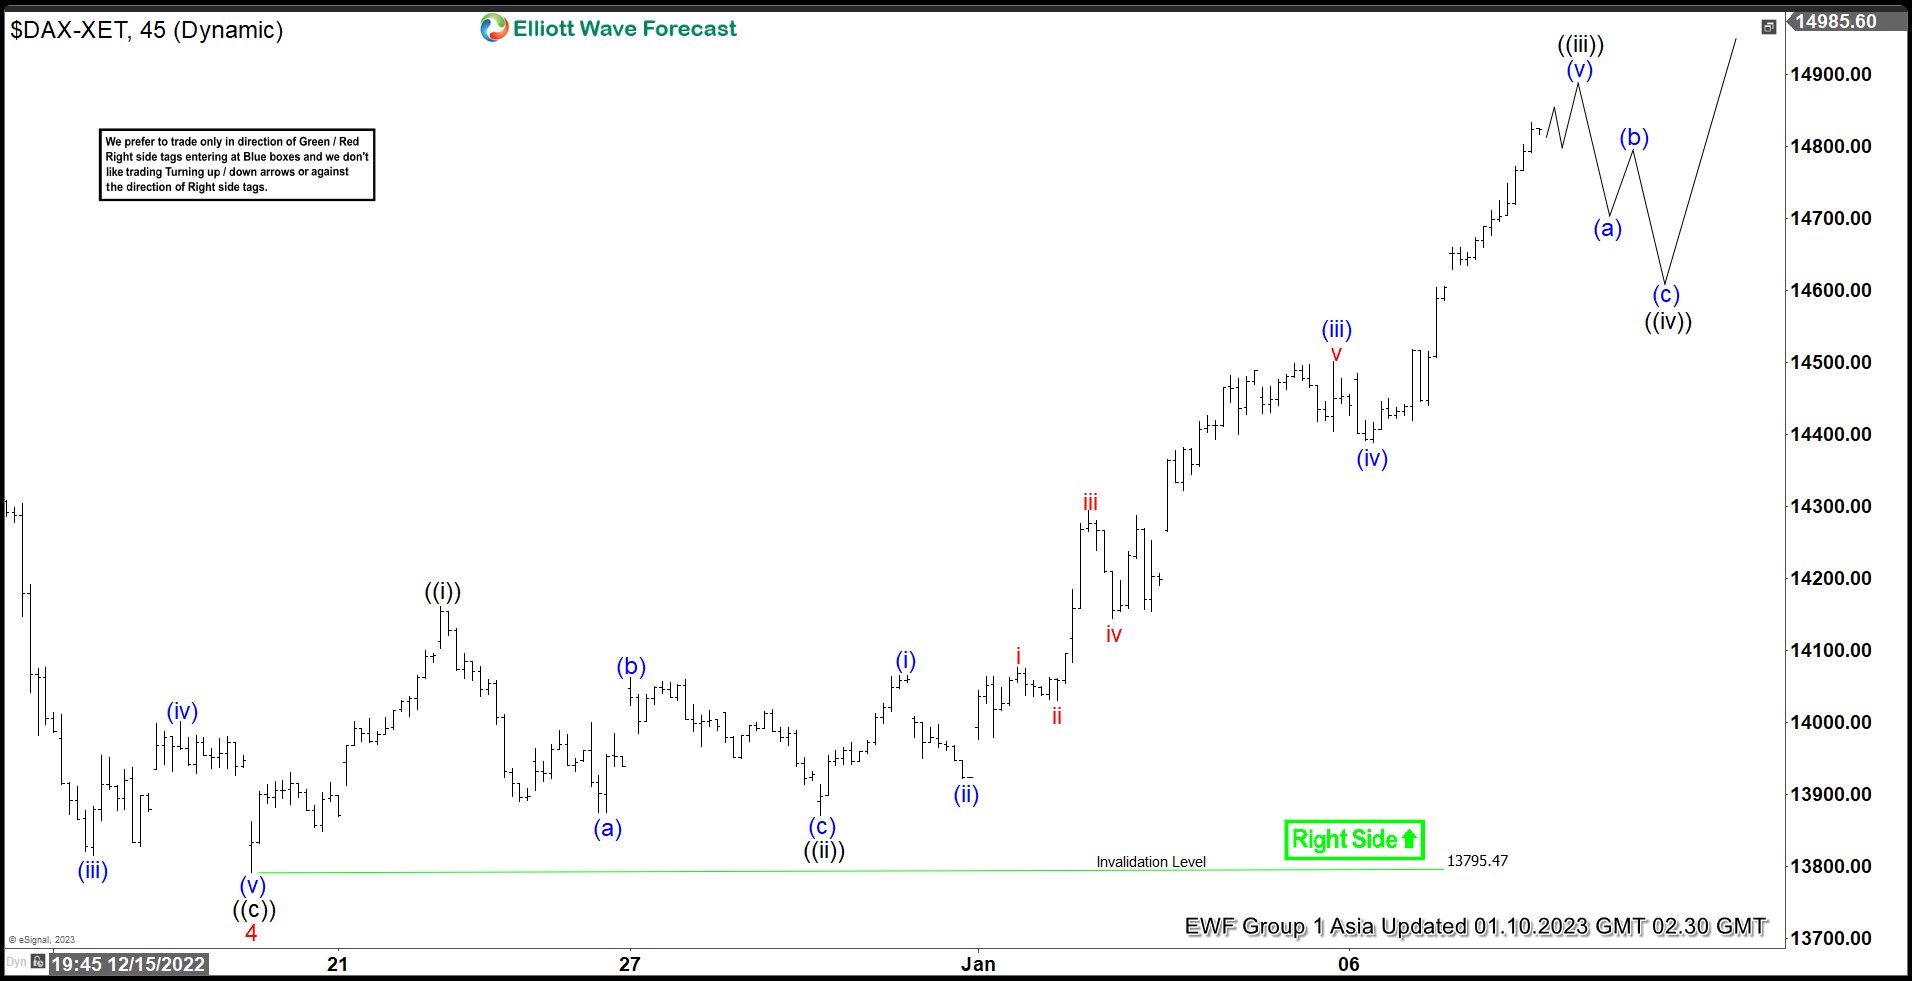
Cycle from 9.29.2022 low is in progress as a 5 waves impulse Elliott Wave structure. In the 45 minutes chart below, we can see wave 4 ended at 13795.47. Wave 5 rally is currently in progress with internal subdivision as another 5 waves impulse. Up from wave 4, wave ((i)) ended at 14160.87 and pullback in wave ((ii)) ended at 13871.32. Internal subdivision of wave ((ii)) unfolded as a zigzag structure where wave (a) ended at 13874.50, wave (b) ended at 14063.14, and wave (c) ended at 13871.32
Wave ((iii)) higher is now in progress with internal subdivision as another impulse in lesser degree. Up from wave ((ii)), wave (i) ended at 14065.59 and pullback in wave (ii) ended at 13922.55. Wave (iii) higher ended at 14501.60 and pullback in wave (iv) ended at 14388.98. Final leg higher wave (v) should end soon which should complete wave ((iii)). Afterwards, the Index should pullback in wave ((iv)) to correct cycle from 12.29.2022 low before the rally resumes. Near term, as far as pivot at 13795.47 low stays intact, expect pullback to find support in 3, 7, 11 swing for further upside.
DAX 45 Minutes Elliott Wave Chart
USD/CAD Daily Outlook
Daily Pivots: (S1) 1.3349; (P) 1.3399; (R1) 1.3440; More....
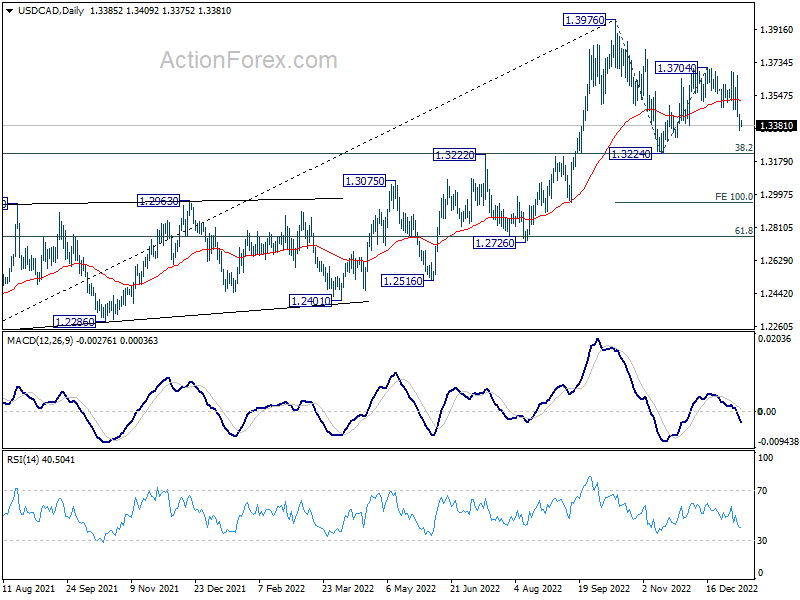
Intraday bias in USD/CAD remains on the downside for deeper decline. But strong support would be seen above 1.3224 to contain downside. Above 1.3483 minor resistance will turn bias back to the upside for 1.3704 resistance. However, sustained break of 1.3222/4 cluster support will resume the whole fall from 1.3976 and carry larger bearish implications.
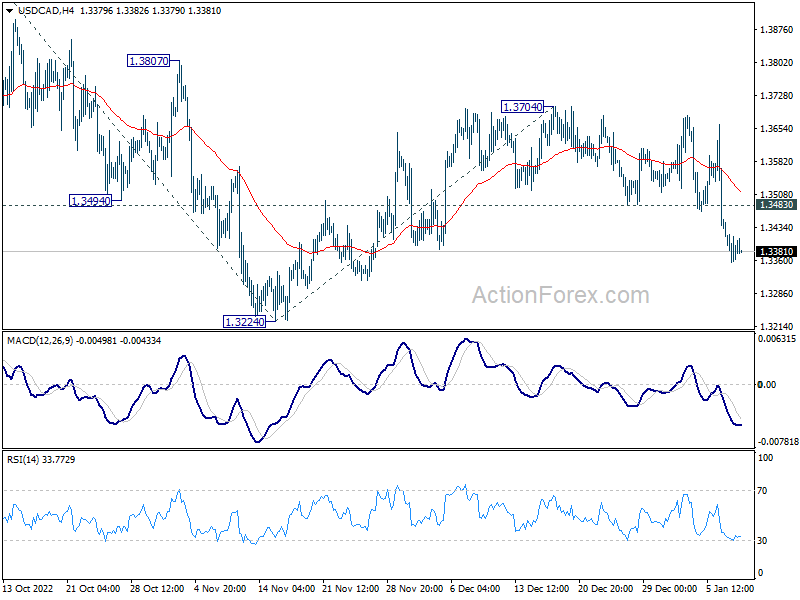
In the bigger picture, as long as 1.3222 cluster support (38.2% retracement of 1.2005 to 1.3976 at 1.3223) holds, larger up trend from 1.2005 (2021 low) is still expected to resume through 1.3976 high at a later stage. However, firm break of 1.3222/3 will indicate that the trend might have reversed. Deeper fall would be seen to next cluster support at 1.2726 (61.8% retracement at 1.2758).
AUD/USD Daily Report
Daily Pivots: (S1) 0.6875; (P) 0.6913; (R1) 0.6950; More...
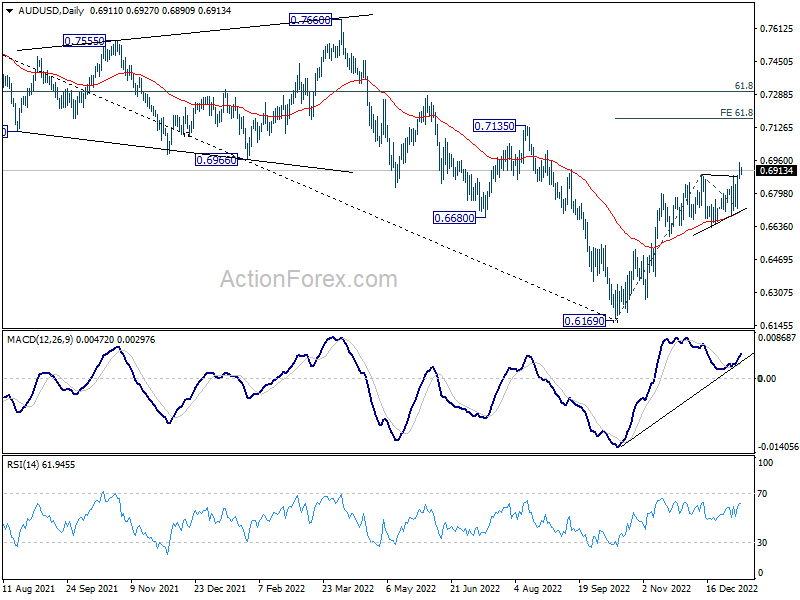
Intraday bias in AUD/USD remains mildly on the upside at this point. Rise from 0.6169 is in progress and should target 61.8% projection of 0.6169 to 0.6892 from 0.6721 at 0.7444 next. On the downside, below 0.6873 minor support will turn intraday bias neutral first. But outlook will stay bullish as long as 0.6721 support holds, in case of retreat.
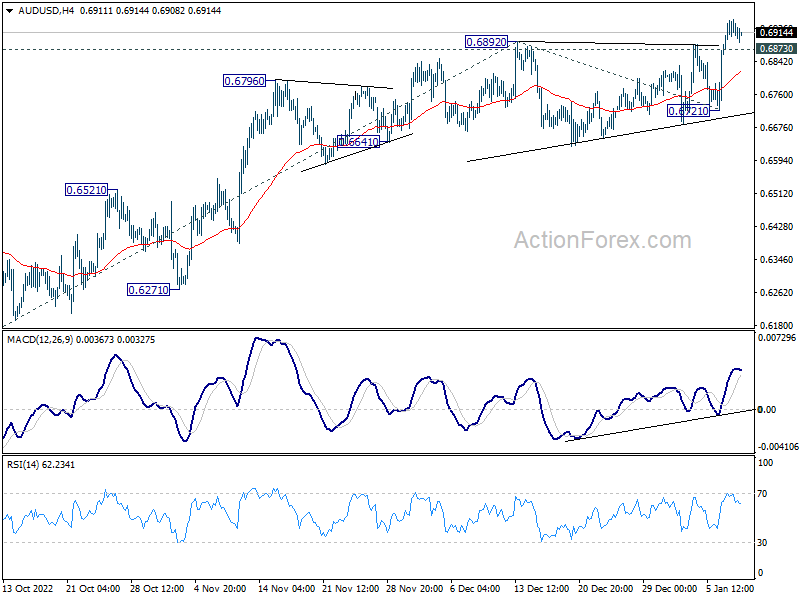
In the bigger picture, corrective decline from 0.8006 (2021 high) should have completed with three waves down to 0.6169 (2022 low). Further rally should be seen to 61.8% retracement of 0.8006 to 0.6169 at 0.6871. Sustained break there will pave the way to retest 0.8006. This will now remain the favored case as long as 0.6721 support holds.
USD/JPY Daily Outlook
Daily Pivots: (S1) 131.25; (P) 131.95; (R1) 132.60; More...
Intraday bias in USD/JPY remains neutral for the moment as range trading continues. On the upside, firm break of 134.49 should confirm short term bottoming, and bring stronger rise to 138.16 cluster resistance (38.2% retracement of 151.93 to 129.49 at 138.06). However, break of 129.49 will resume the whole decline from 151.93 instead.
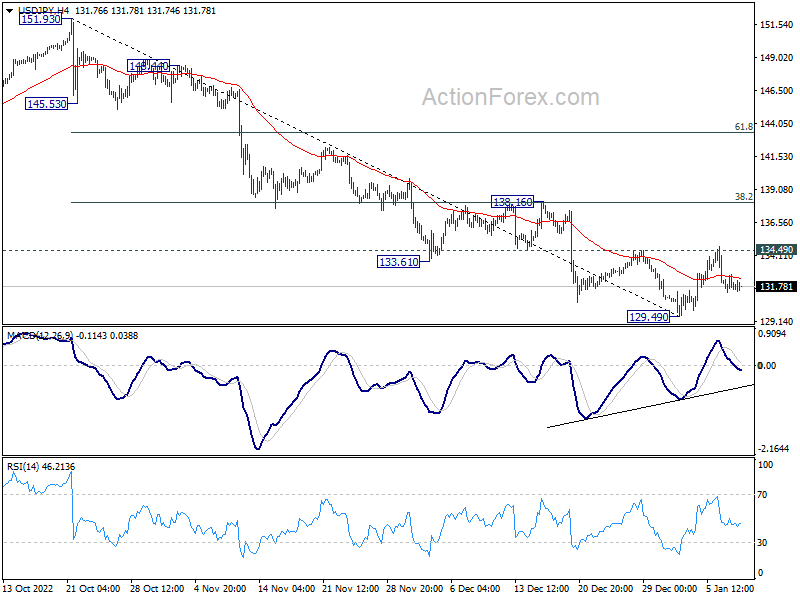
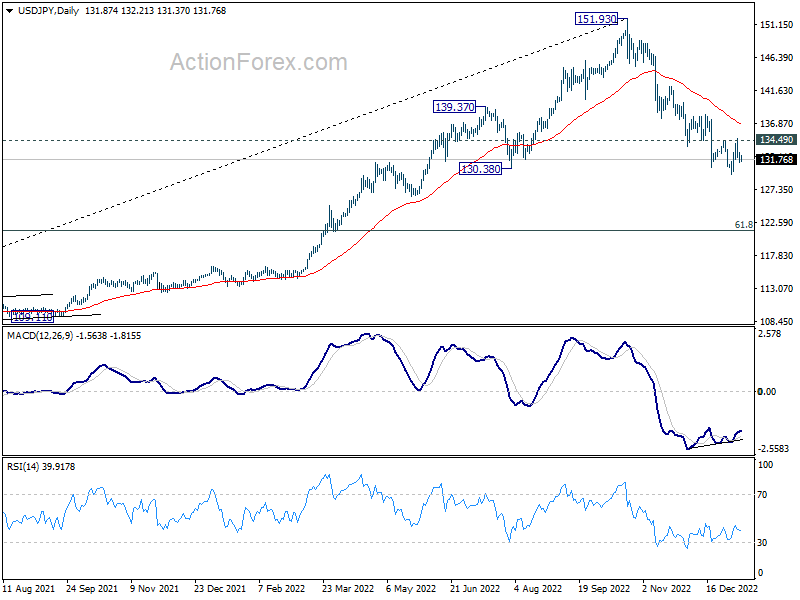
In the bigger picture, a medium term top was in place at 151.93. Sustained trading below 55 week EMA (now at 131.73) would raise the chance of bearish trend reversal. Deeper fall would be seen to 61.8% retracement of 102.58 to 151.93 at 121.43. This will now remain the favored case as long as 55 day EMA (now at 137.08) holds.
USD/CHF Daily Outlook
Daily Pivots: (S1) 0.9159; (P) 0.9221; (R1) 0.9276; More...
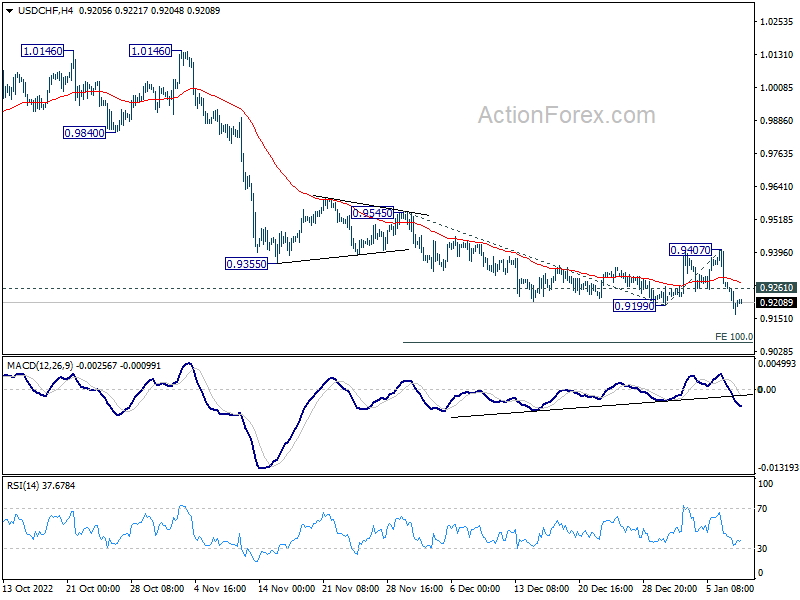
Intraday bias in USD/CHF remains on the downside at this point. Current decline from 1.0146 should target 100% projection of 0.9545 to 0.9199 from 0.9407 at 0.9061 next. On the upside, above 0.9261 minor resistance will turn intraday bias neutral first. But outlook will remain bearish as long as 0.9407 resistance holds, in case of recovery.
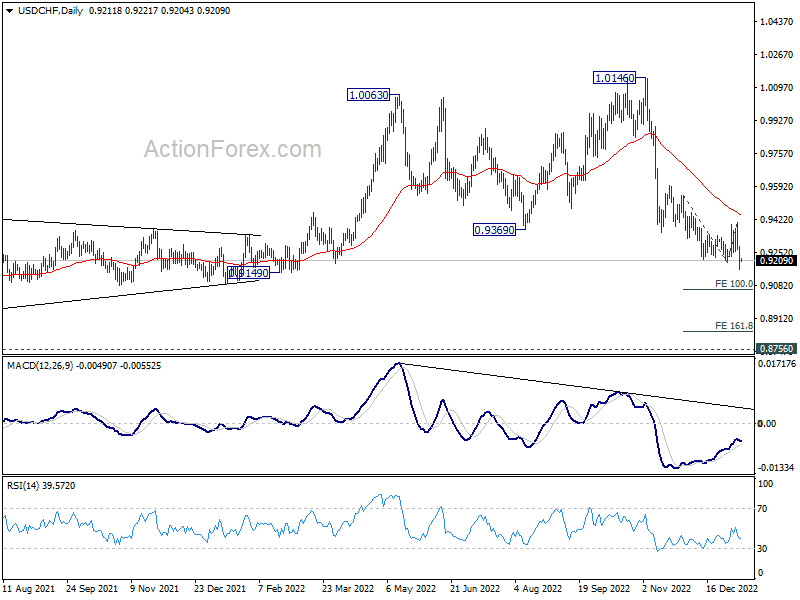
In the bigger picture, rise from 0.8756 (2021 low) has completed at 1.0146, well ahead of 1.0342 long term resistance (2016 high). Based on current downside momentum, fall from 1.0146 should be a medium term down trend itself. Next target is a test on 0.8756 low. Strong support should be seen there to bring rebound. Still, further decline will now be expected as long as 0.9407 resistance holds, in any case.
GBP/USD Daily Outlook
Daily Pivots: (S1) 1.2111; (P) 1.2160; (R1) 1.2236; More...
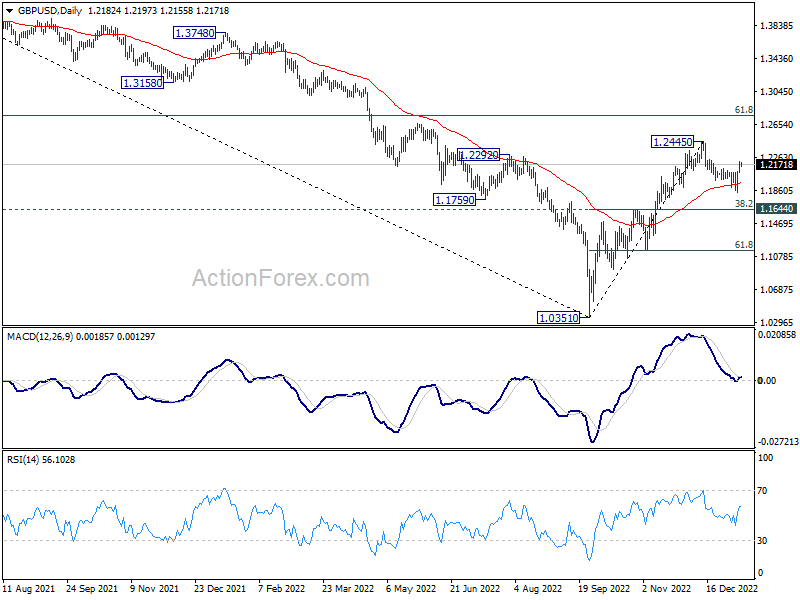
Outlook in GBP/USD remains unchanged and intraday bias stays on the upside for retesting 1.2445 high. Decisive break there will resume whole rally from 1.0351 to 1.2759 fibonacci level. On the downside, however, break of 1.1840 will resume the correction to 38.2% retracement of 1.0351 to 1.2445 at 1.1645.
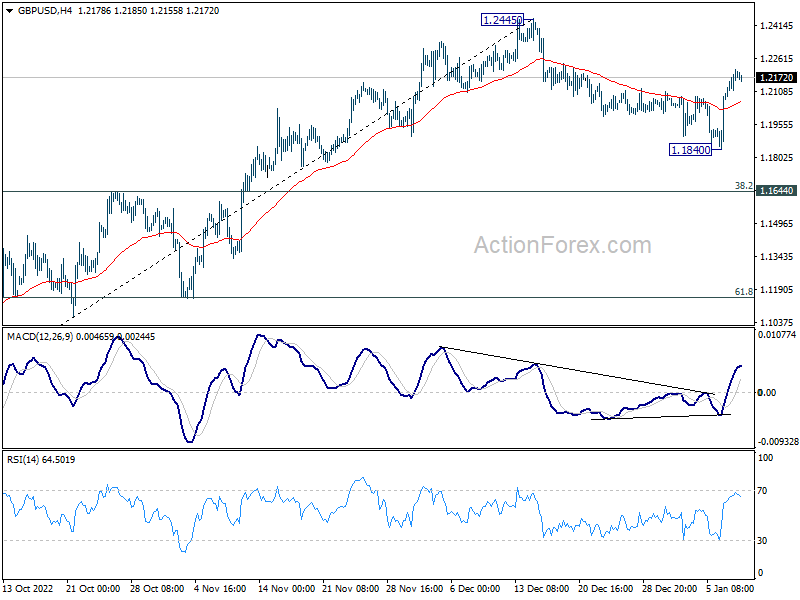
In the bigger picture, rise from 1.0351 medium term bottom is at least correcting whole down trend from 1.4248 (2021 high). Further rise is expected as long as 1.1644 resistance turned support holds. Next target is 61.8% retracement of 1.4248 to 1.0351 at 1.2759. Sustained break there will pave the way back to 1.4248.
EUR/USD Daily Outlook
Daily Pivots: (S1) 1.0662; (P) 1.0711; (R1) 1.0785; More...
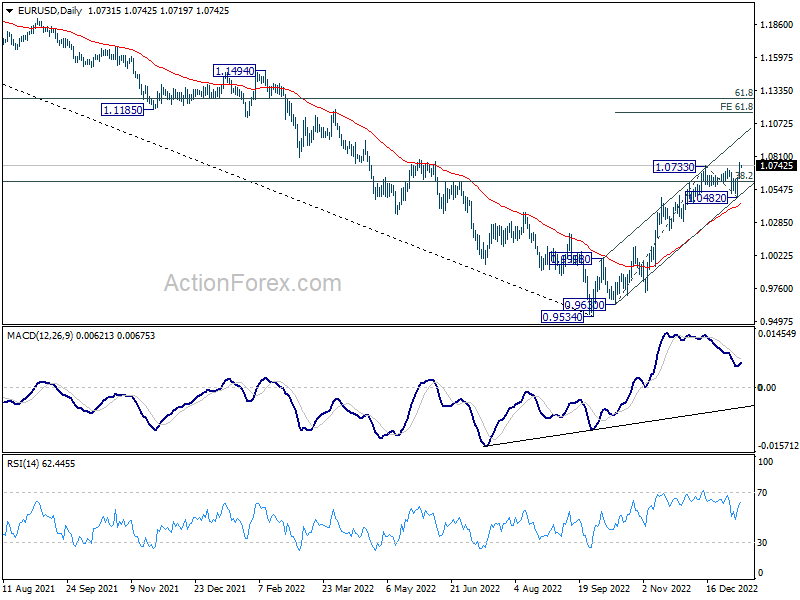
Break of 1.0733 resistance indicates resumption of whole rally from 0.9534. Intraday bias in EUR/USD is turned to the upside. Next target is 61.8% projection of 0.9630 to 1.0733 from 1.0482 at 1.1164. On the downside, below 1.0659 minor support will turn intraday bias neutral again fist. But near term outlook will stay bullish as long as 1.0482 support holds, in case of retreat.
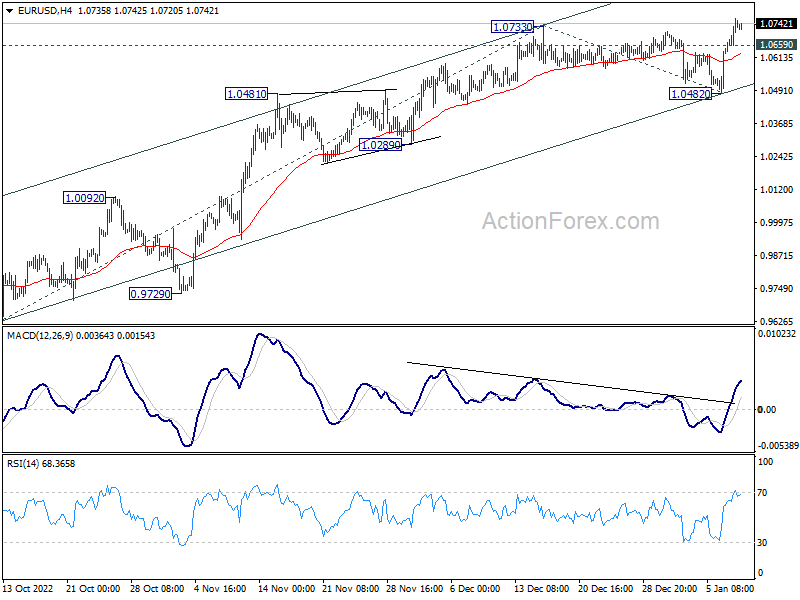
In the bigger picture, focus stays on 38.2% retracement of 1.2348 (2021 high) to 0.9534 at 1.0609. Rejection by 1.0609 will suggest that price actions from 0.9534 medium term bottom are developing into a corrective pattern. Thus, medium bearishness is retained for another fall through 0.9534 at a later stage. However, sustained break of 1.0609 will raise the chance of trend reversal and target 61.8% retracement at 1.1273.
Dollar Staying Weak, But Awaits Committed Selling
Markets turned steady in Asian session as risk-on moves take a breather for now. Dollar remains the worst performer but there is no committed follow through selling so far, after breaking near term support against Euro and Swiss Franc. Commodity currencies also lose some momentum and are overtaken by European majors in terms of strength. Euro is having mild upper hand against other European peers.
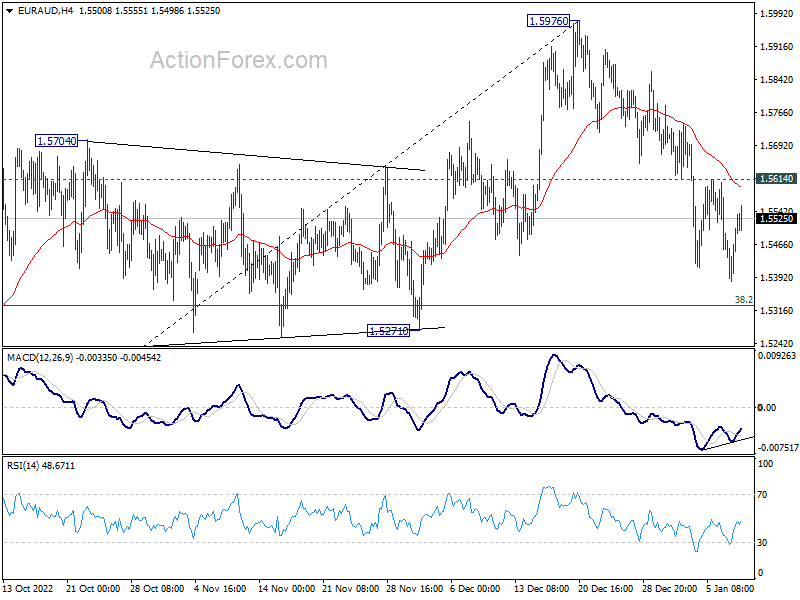
Technically, EUR/AUD is losing some downside momentum as seen in 4 hour MACD. The corrective fall from 1.5976 might complete ahead of 38.2% retracement of 1.4281 to 1.5976 at 1.5329. Break of 1.5614 resistance will bring stronger rally back to retest 1.5976 high. If happens, given AUD/USD's firmness, that might be accompanied some upside acceleration in EUR/USD finally. Let's see.
In Asia, at the time of writing, Nikkei is up 0.72%. Hong Kong HSI is down -0.33%. China Shanghai SSE is up 0.38%. Singapore Strait Times is down -1.00%. Japan 10-year JGB yield is down -0.0024 at 0.503. Overnight, DOW dropped -0.34%. S&P 500 dropped -0.08%. NASDAQ rose 0.63%. 10-year yield dropped -0.052 to 3.517.
BoE Pill: Distinctive context prevails in UK creates the potential for more persistent inflation
BoE Chief Economist Huw Pill said in a speech yesterday that the central bank's communication "rightly places the persistence of inflation at centre-stage".
"Given the famous 'long and variable lags' in monetary policy transmission, it is the persistent component of inflation – that component of inflation that will still be there once the lags in monetary policy transmission unwind – that is the relevant object for the MPC's attention," he said.
He also noted, "the distinctive context that prevails in the UK – of higher natural gas prices with a tight labour market, adverse labour supply developments and goods market bottlenecks – creates the potential for inflation to prove more persistent."
"It is therefore in this nexus that I focus in coming to my own assessment of the risks surrounding inflation persistence, which – consistent with the MPC's collective communication – will strongly influence my monetary policy position in the coming months."
Fed Daly: Case can be made for either 25 or 50 next
San Francisco Fed President Mary Daly said in a WSJ interview that she expects interest rate to rise from the current 4.25-4.50% to 5.00-5.25%. But she added that "doing it in more gradual steps does give you the ability to respond to incoming information."
Daly said the "case can be made for either" a 25bps or 50bps hike in February. But at the same time, "I want to be data dependent, not wall off a 50 basis point increase."
She expects unemployment to rise from current 3.5% to 4.5-4.6% as tightening continues. Inflation, now running at 5.5%, will fall to low 3% range by the end of 2023, and closer to 2% in 2024.
Fed Bostic: Rates to stay above 5% a long time
Atlanta Fed President Raphael Bostic said, "if the CPI comes in showing the same kind of trending that we saw in the jobs number, that will make me have to take 25 more seriously," regarding the rate hike in February.
But he also emphasized that "we are just going to have to hold our resolve," and expect interest rates to rise to 5.00-5.52% range to bring inflation down. As how long he saw rates above 5%, Bostic said: "Three words: a long time."
"I am not a pivot guy. I think we should pause and hold there, and let the policy work," he said. The "base case" for him it no rate cuts in 2024.
On the data front
Japan Tokyo CPI core rose from 3.6% yoy to 4.0% yoy in December, above expectation of 3.8% yoy. Household spending dropped -1.2% yoy in November, versus expectation of 0.6% yoy.
Looking ahead, the economic calendar is light. France industrial output and US NFIB business optimism index are the main features.
Attention will more be on comments from BoC Macklem, BoJ Kuroda and Fed Powell.
EUR/USD Daily Outlook
Daily Pivots: (S1) 1.0662; (P) 1.0711; (R1) 1.0785; More...
Break of 1.0733 resistance indicates resumption of whole rally from 0.9534. Intraday bias in EUR/USD is turned to the upside. Next target is 61.8% projection of 0.9630 to 1.0733 from 1.0482 at 1.1164. On the downside, below 1.0659 minor support will turn intraday bias neutral again fist. But near term outlook will stay bullish as long as 1.0482 support holds, in case of retreat.
In the bigger picture, focus stays on 38.2% retracement of 1.2348 (2021 high) to 0.9534 at 1.0609. Rejection by 1.0609 will suggest that price actions from 0.9534 medium term bottom are developing into a corrective pattern. Thus, medium bearishness is retained for another fall through 0.9534 at a later stage. However, sustained break of 1.0609 will raise the chance of trend reversal and target 61.8% retracement at 1.1273.
Economic Indicators Update
| GMT | Ccy | Events | Actual | Forecast | Previous | Revised |
|---|---|---|---|---|---|---|
| 23:30 | JPY | Tokyo CPI Core Y/Y Dec | 4.00% | 3.80% | 3.60% | |
| 23:30 | JPY | Household Spending Y/Y Nov | -1.20% | 0.60% | 1.20% | |
| 00:01 | GBP | BRC Like-For-Like Retail Sales Y/Y Dec | 6.50% | 4.10% | ||
| 07:45 | EUR | France Industrial Output M/M Nov | 0.90% | -2.60% | ||
| 11:00 | USD | NFIB Business Optimism Index Dec | 91.6 | 91.9 | ||
| 15:00 | USD | Wholesale Inventories Nov F | 1.00% | 1.00% |
Fed Bostic: Rates to stay above 5% a long time
Atlanta Fed President Raphael Bostic said, "if the CPI comes in showing the same kind of trending that we saw in the jobs number, that will make me have to take 25 more seriously," regarding the rate hike in February.
But he also emphasized that "we are just going to have to hold our resolve," and expect interest rates to rise to 5.00-5.52% range to bring inflation down. As how long he saw rates above 5%, Bostic said: "Three words: a long time."
"I am not a pivot guy. I think we should pause and hold there, and let the policy work," he said. The "base case" for him it no rate cuts in 2024.