Sample Category Title
EUR Is Vigorous Again
The first week of the year was really volatile for the market major. On Monday, it recovered and secured near 1.0680.
The reason for the nervous reaction was publication of the minutes of the US Fed’s meeting. The document mentioned inadequacy of emotional conclusions based on just the Fed’s decision to fight with inflation. As a result of all this, the USD got stronger.
Next, December reports on the US labour market came out. The unemployment rate dropped to 3.5%, though no changes had been anticipated. The NFP grew to 223 thousand instead of 200 thousand expected. The average wage growth decreased to 0.3% m/m from 0.6%. All this was good, but later the ISM report was released, and it demonstrated a serious decline in December. This sent the USD down – it could not ignore the fact that the economy keeps slowing down.
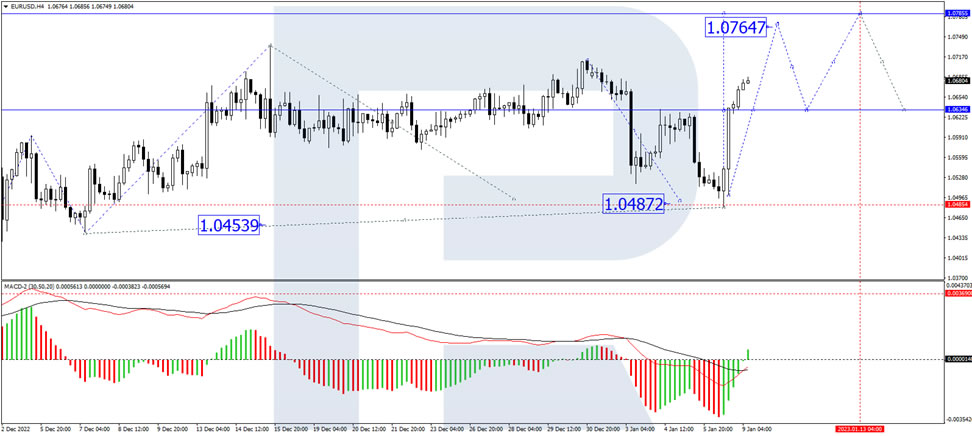
On H4, EUR/USD completed a wave of decline to 1.0482. Today the market has completed an impulse of growth to 1.0635. At the moment, the market has formed a consolidation range around this level. With an escape upwards, a pathway for a wave of growth to 1.0766 opened. After the pair reaches the level, a correction to 1.0635 should begin, followed by growth to 1.0785. Technically, this scenario is confirmed by the MACD: its signal line is directed strictly upwards, which suggests the continuation of a wave of growth.
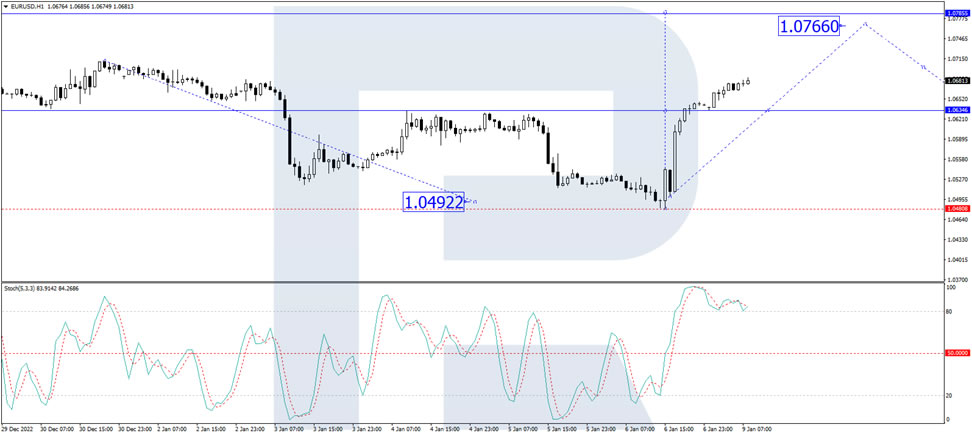
On H1, EUR/USD has formed an impulse of growth to 1.0634. The market has formed a consolidation range around it. With an escape upwards, a pathway for the wave of growth to 1.0766 opened. The goal is local. Technically, the scenario is confirmed by the Stochastic oscillator. Its signal line is above 80. After the target level is reached, a link f decline to 50 is expected.
EUR/USD Mid-Day Outlook
Daily Pivots: (S1) 1.0537; (P) 1.0592; (R1) 1.0702; More...
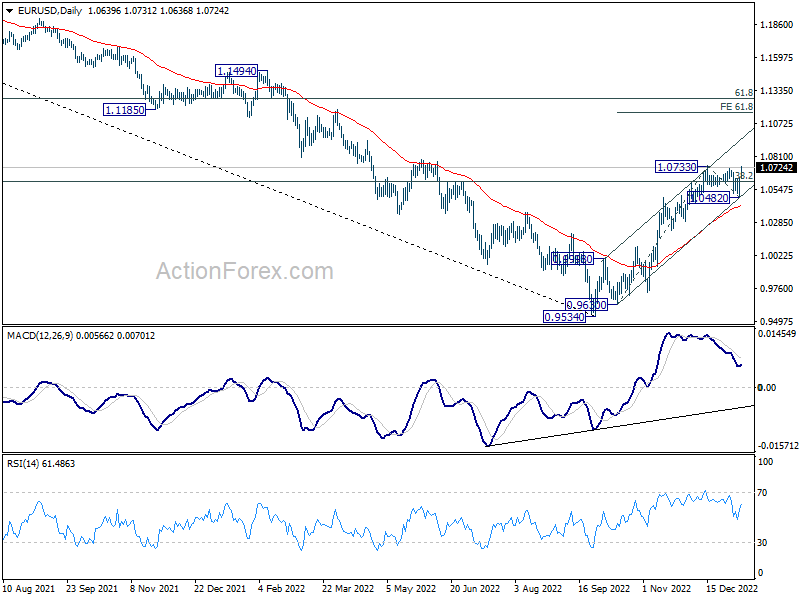
Immediate focus is now on 1.0733 resistance in EUR/USD. Firm break there will resume whole rally from 0.9534. Next target will be 61.8% projection of 0.9630 to 1.0733 from 1.0482 at 1.1164. For now, outlook will continue stay bullish as long as 1.0482 support holds, in case of retreat.
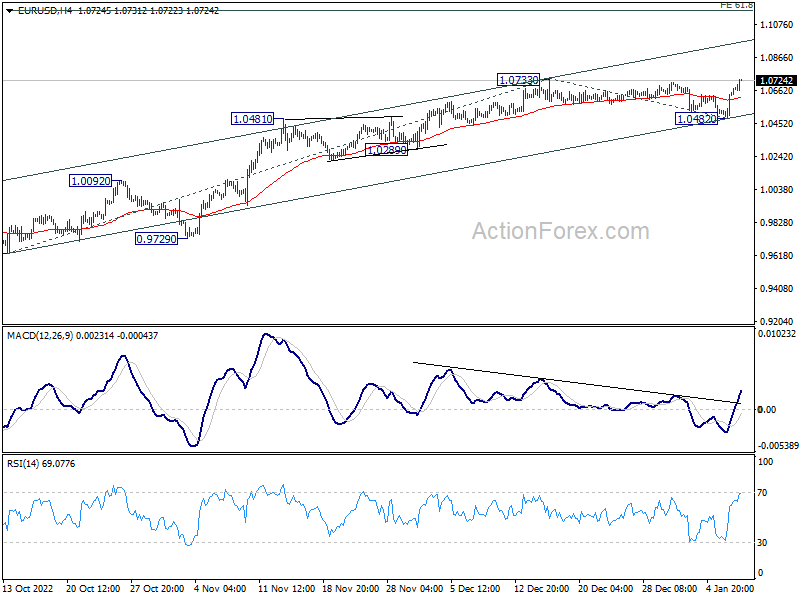
In the bigger picture, focus stays on 38.2% retracement of 1.2348 (2021 high) to 0.9534 at 1.0609. Rejection by 1.0609 will suggest that price actions from 0.9534 medium term bottom are developing into a corrective pattern. Thus, medium bearishness is retained for another fall through 0.9534 at a later stage. However, sustained break of 1.0609 will raise the chance of trend reversal and target 61.8% retracement at 1.1273.
GBP/USD Mid-Day Outlook
Daily Pivots: (S1) 1.1924; (P) 1.2012; (R1) 1.2181; More...
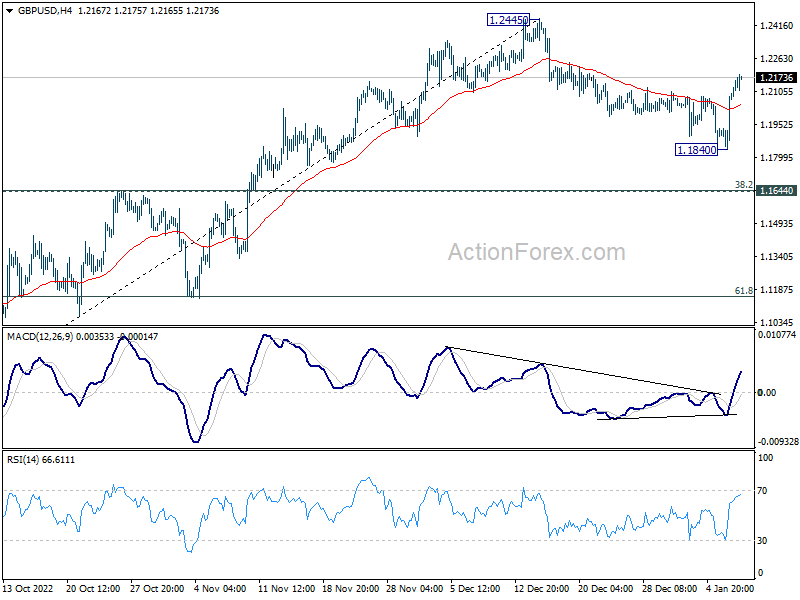
Intraday bias GBP/USD stays on the upside for retesting 1.2445 high. Decisive break there will resume whole rally from 1.0351 to 1.2759 fibonaci level. On the downside, however, break of 1.1840 will resume the correction to 38.2% retracement of 1.0351 to 1.2445 at 1.1645.
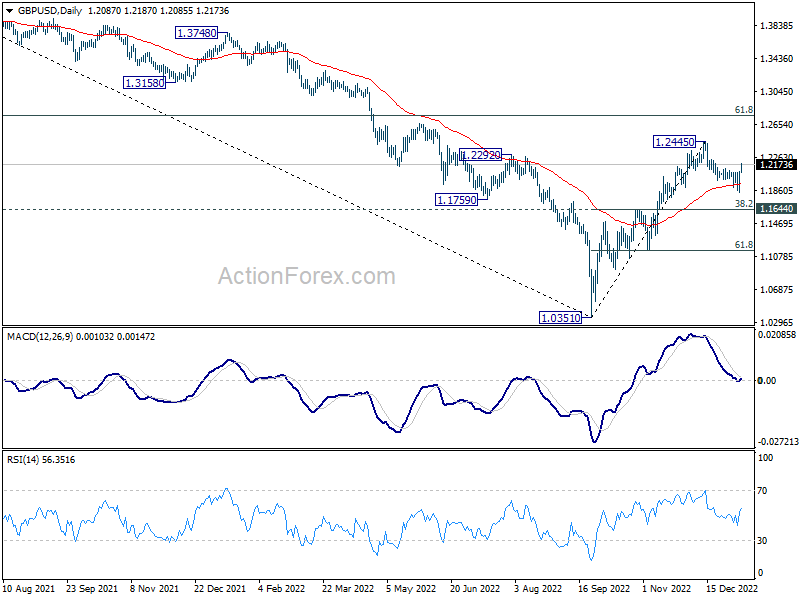
In the bigger picture, rise from 1.0351 medium term bottom is at least correcting whole down trend from 1.4248 (2021 high). Further rise is expected as long as 1.1644 resistance turned support holds. Next target is 61.8% retracement of 1.4248 to 1.0351 at 1.2759. Sustained break there will pave the way back to 1.4248.
USD/JPY Mid-Day Outlook
Daily Pivots: (S1) 131.14; (P) 132.96; (R1) 133.92; More...
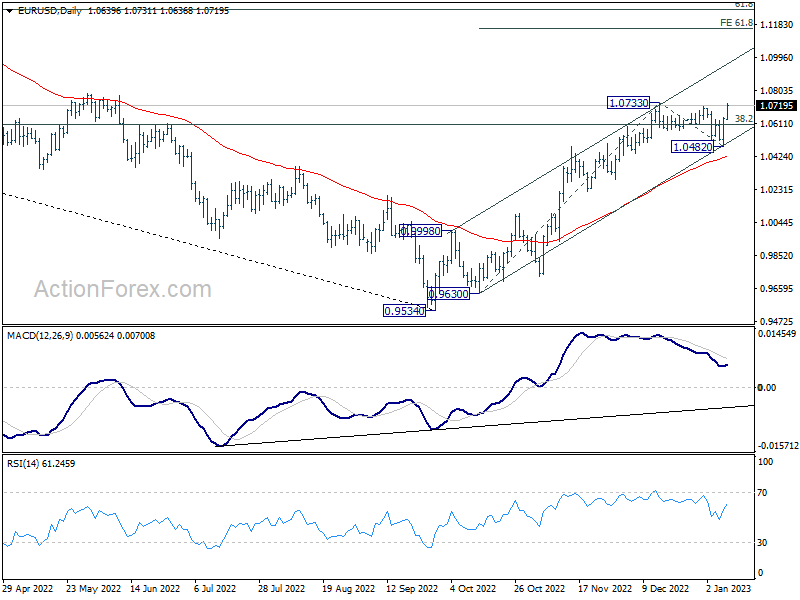
Range trading continues in USD/JPY and intraday bias remains neutral at this point. On the upside, firm break of 134.49 should confirm short term bottoming, and bring stronger rise to 138.16 cluster resistance (38.2% retracement of 151.93 to 129.49 at 138.06). However, break of 129.49 will resume the whole decline from 151.93 instead.
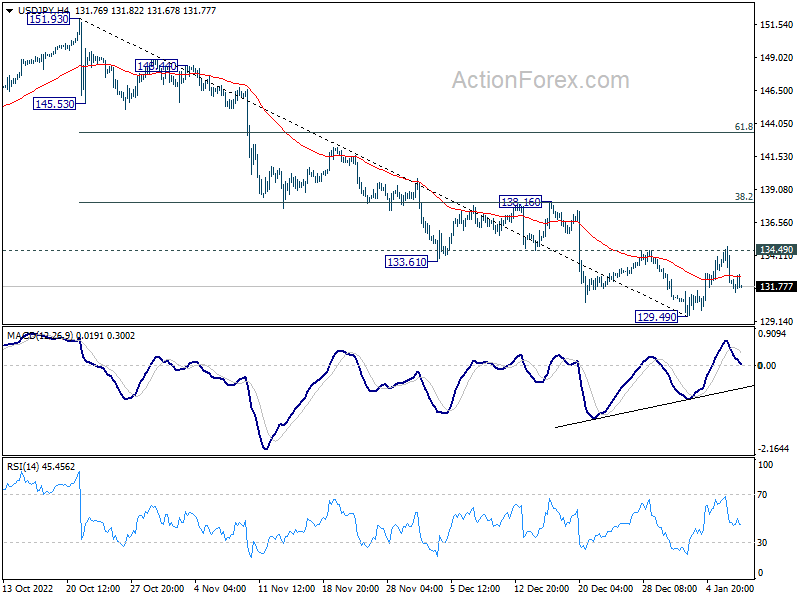
In the bigger picture, a medium term top was in place at 151.93. Sustained trading below 55 week EMA (now at 131.73) would raise the chance of bearish trend reversal. Deeper fall would be seen to 61.8% retracement of 102.58 to 151.93 at 121.43. This will now remain the favored case as long as 55 day EMA (now at 137.08) holds.
USD/CHF Mid-Day Outlook
Daily Pivots: (S1) 0.9228; (P) 0.9319; (R1) 0.9368; More...
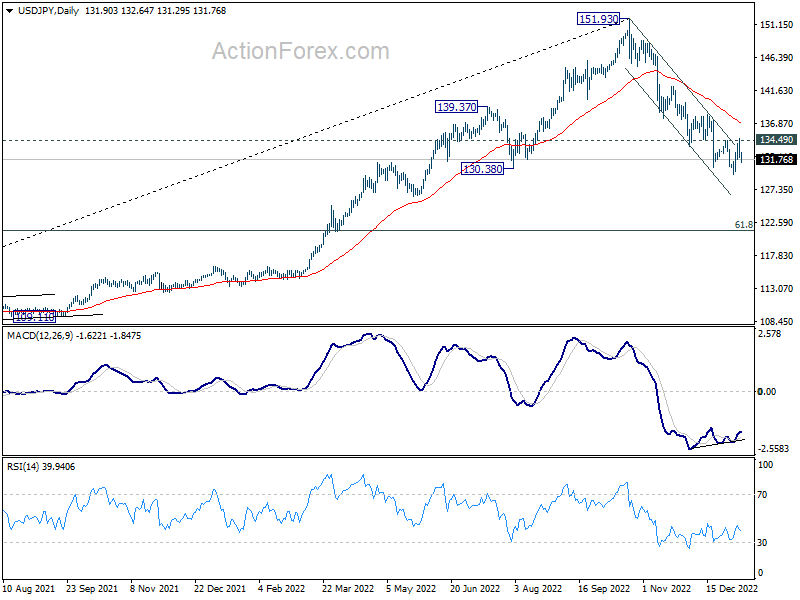
USD/CHF's down trend resumed by breaking through 0.9199 support. Intraday bias is back on the downside. Next target is 100% projection of 0.9545 to 0.9199 from 0.9407 at 0.9061. On the upside, break of 0.9407 resistance is needed to indicate short term bottoming. Otherwise, outlook will stay bearish in case of recovery.
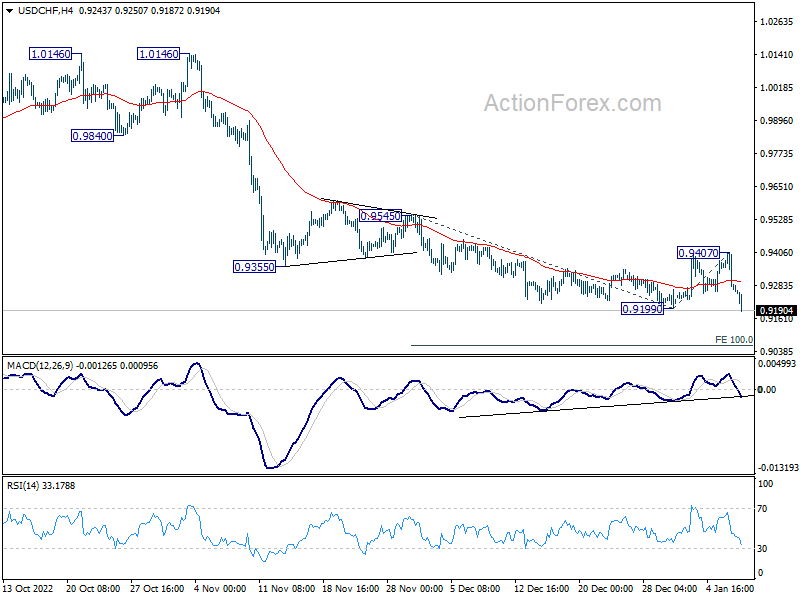
In the bigger picture, rise from 0.8756 (2021 low) has completed at 1.0146, well ahead of 1.0342 long term resistance (2016 high). Based on current downside momentum, fall from 1.0146 should be a medium term down trend itself. Next target is a test on 0.8756 low. Strong support should be seen there to bring rebound. Still, further decline will now be expected as long as 0.9407 resistance holds, in any case.
Dollar Selloff Continues, Euro Ready for Upside Breakout
Selloff in Dollar remains the main theme today, but Yen is also sharing some burden. US 10-year yield is falling below 3.6 handle again, giving the greenback some additional pressure. Swiss Franc breaks through recent resistance against Dollar already, with help from cross buying. But Euro might also follow very soon. For now, Aussie and Kiwi are still the strongest ones, with Loonie lagging behind.
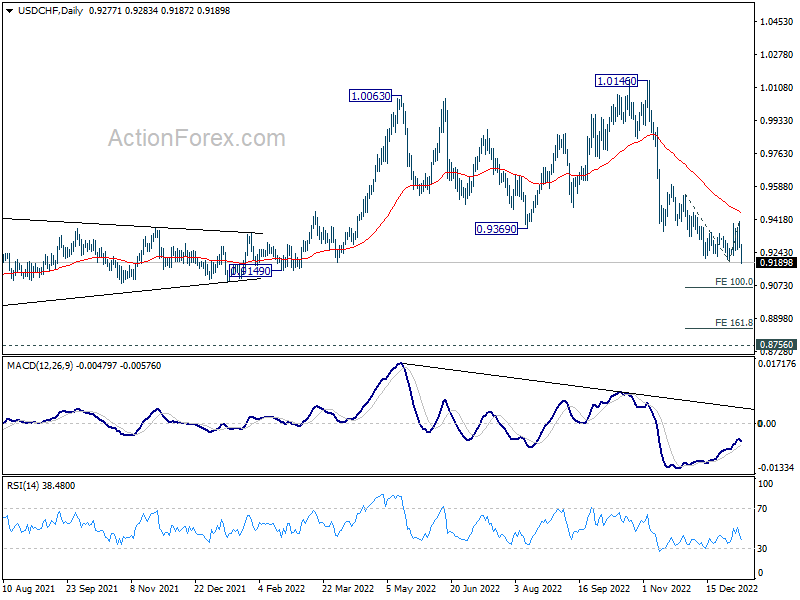
Technically, EUR/USD could break through 1.0733 resistance during the rest of the session. In that case, whole rally from 0.9534 low should resume. Next target would be channel resistance (now at 1.0905). Reaction from there would decide whether upside acceleration would follow to 61.8% projection of 0.9630 to 1.0733 from 1.0482 at 1.1164.
In Europe, at the time of writing, FTSE is up 0.04%. DAX is up 0.86%. CAC is up 0.42%. Germany 10-year yield is up 0.0656 at 2.277. Earlier in Asia, Hong Kong HSI rose 1.89%. China Shanghai SSE rose 0.58%. Singapore Strait Times rose 0.88%. Japan was on holiday.
ECB: Wage growth over the next few quarters very strong
In an economic bulletin article, ECB said, "Looking ahead, wage growth over the next few quarters is expected to be very strong compared with historical patterns."
"This reflects robust labour markets that so far have not been substantially affected by the slowing of the economy, increases in national minimum wages and some catch-up between wages and high rates of inflation."
"Beyond the near term, the expected economic slowdown in the euro area and uncertainty about the economic outlook are likely to put downward pressure on wage growth."
Eurozone Sentix rose to -17.5, sharp economic downturn off the table
Eurozone Sentix Investor Confidence improved from -21 to -17.5 in January, slightly below expectation of -17.0. That's nonetheless the highest since June 2022. Current Situation Index rose from -20.0 to -19.3, highest since last August. Expectations rose from -22.0 to -15.8, highest since last February.
Sentix said: "Investors are still assuming a recession, but it is expected to be much milder. The sharp economic downturn, which was expected by the majority of investors by October 2022, is therefore off the table (for now)...a
"Overall, the economic environment remains challenging. The latest increases should not be misinterpreted as a general turnaround. The risks of recession remain."
Eurozone unemployment rate unchanged at 6.5% in Nov, EU at 6.0%
Eurozone unemployment rate was unchanged at 6.5% in November. EU unemployment rate was unchanged at 6.0%.
Eurostat estimates that 12.950m men and women in the EU, of whom 10.849m in the Eurozone, were unemployed in November 2022. Compared with October 2022, unemployment increased by 10k in the EU and decreased -by 2k in the Eurozone.
USD/CHF Mid-Day Outlook
Daily Pivots: (S1) 0.9228; (P) 0.9319; (R1) 0.9368; More...
USD/CHF's down trend resumed by breaking through 0.9199 support. Intraday bias is back on the downside. Next target is 100% projection of 0.9545 to 0.9199 from 0.9407 at 0.9061. On the upside, break of 0.9407 resistance is needed to indicate short term bottoming. Otherwise, outlook will stay bearish in case of recovery.
In the bigger picture, rise from 0.8756 (2021 low) has completed at 1.0146, well ahead of 1.0342 long term resistance (2016 high). Based on current downside momentum, fall from 1.0146 should be a medium term down trend itself. Next target is a test on 0.8756 low. Strong support should be seen there to bring rebound. Still, further decline will now be expected as long as 0.9407 resistance holds, in any case.
Economic Indicators Update
| GMT | Ccy | Events | Actual | Forecast | Previous | Revised |
|---|---|---|---|---|---|---|
| 00:30 | AUD | Building Permits M/M Nov | -9.00% | 0.10% | -6.00% | |
| 06:45 | CHF | Unemployment Rate Dec | 1.90% | 2.10% | 2.00% | |
| 07:00 | EUR | Germany Industrial Production M/M Nov | 0.20% | 0.20% | -0.10% | |
| 07:45 | EUR | France Trade Balance (EUR) Nov | -13.8B | -11.3B | -12.2B | -11.6B |
| 08:00 | CHF | Foreign Currency Reserves (CHF) Dec | 784B | 790B | ||
| 09:00 | EUR | Italy Unemployment Nov | 7.80% | 7.80% | 7.80% | |
| 09:30 | EUR | Eurozone Sentix Investor Confidence (Jan) | -17.5 | -17 | -21 | |
| 10:00 | EUR | Unemployment Rate Nov | 6.50% | 6.50% | 6.50% | |
| 13:30 | CAD | Building Permits M/M Nov | 14.10% | 0.40% | -1.40% |
Why Forex Traders Should Especially Care About the Stock Market This Quarter
We all know that the forex and stock markets are related, so it's of course a good idea for forex traders to keep an eye on what equities are doing. But there are a couple of circumstances that are coinciding this quarter that make this relationship especially pronounced. The stock market, particularly in the United States, could give us some insight into what to expect in the currency markets.
What's going on?
To get a better understanding of the situation, we have to remember that one of the key ways the stock and currency markets are connected is through bonds. When bond prices fall, for example, then investors pile into that currency to buy. This pushes up the price of the currency with respect to others. At the same time, investors leave the stock market to buy bonds as well. This means the stock market goes down.
Hence, the standard inverse relationship between currencies and the stock market. Now, that doesn't always line up exactly, because it depends on why the price of bonds have gone down. The other main factor is risk sentiment. Stocks are higher risk, so investors will get out of the stock market and buy bonds when there is a risk-off market.
What's driving the underlying market
The issue is that the bond market right now is highly distorted, particularly in the US and Japan. This is because over the last couple of years, the regulators have been intervening in the market. Almost all central banks and governments have done this, but some more than others. Which is why there could be a discrepancy in the reaction from currencies.
During covid, governments issued massive amounts of debt in the form of bonds. That would normally force the interest rate higher, due to supply and demand. But central banks stepped in to buy bonds in order to force interest rates down. That creates an artificial situation in the bond market.
Tracking the distortion
The natural situation is that bond yields represent relative risk. That means the longer the bond term, the higher the interest rate. This is called the "bond yield curve". But central banks have stepped in to "control" the yield curve, such as the BOJ, or the BOE. The US bond curve is "inverted"; that is, short-term debt has a higher interest rate than long-term debt, which reflects expectations of central bank policy.
Why it matters
Investors are going to put their money where they believe there is the best risk-reward ratio. Bonds are low risk compared to stocks, so the higher the interest rate, the more interest there is in selling stocks. If the central bank is distorting the market, then investors have a different incentive structure. This can lead to a run-up in stocks, like in 2020-2021 when conditions aren't so good; and then a drop in the stock market when conditions are improving, like in 2022.
So, central bank policy can outweigh economic data. The Fed is expected to slow or stop its rate hikes sometime this quarter. With the Fed keeping policy steady, then the natural dynamics of the market could return. Which means the stock market could return to its more usual role of forecasting sentiment. Which in turn provides insight into how much demand there is for bonds, and whether or not a currency in particular will appreciate or weaken.
Is Oil Stuck Between a Rock and a Hard Place?
After trading in a rollercoaster manner in 2022, oil seems to be starting the new year between a rock and a hard place as the outcomes of ongoing market-related themes could end up working in favor of it or against it. In other words, the risks surrounding the black liquid are two-sided, and it remains to be seen which will prevail in the weeks and months to come.
Oil trades in rollercoaster fashion in 2022
Oil prices finished 2022 slightly in the green, with WTI and Brent crude oil futures adding yearly gains of around 7% and 9% respectively. However, these numbers are not telling the whole story. From around $75 per barrel, WTI shot up to around $130 in the aftermath of Russia’s invasion of Ukraine, reversing south soon thereafter as sky-high inflation and aggressive tightening by major central banks sparked fears about a global recession and thereby concerns about weaker demand for the black liquid.
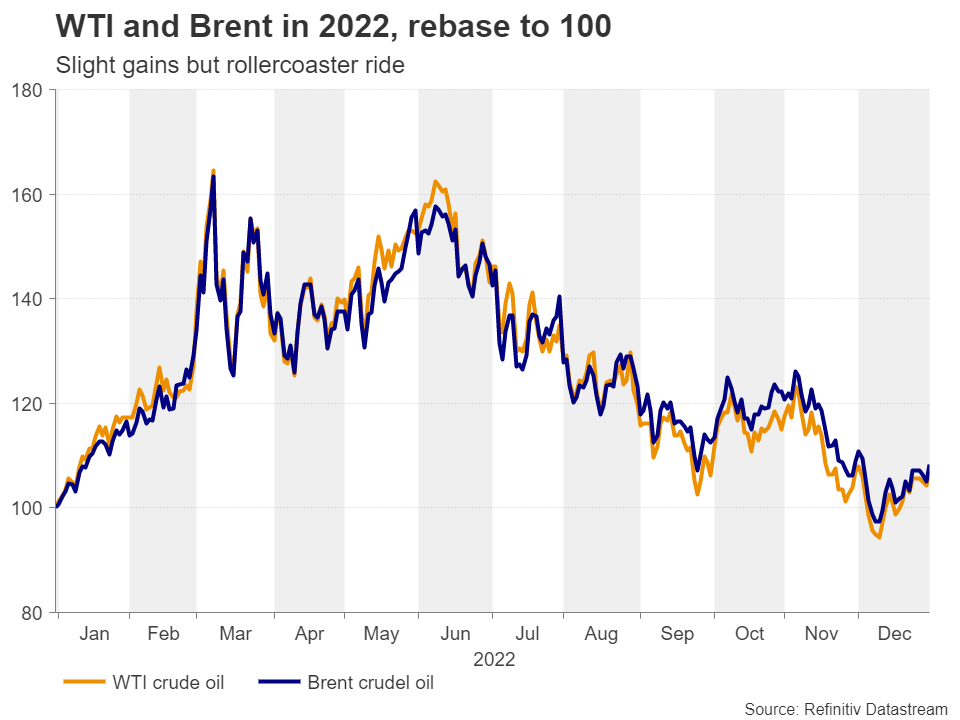
Entering 2023, oil seems to be trading between a rock and a hard place, as the current landscape and potential responses to expected developments could drive prices either way.
Is the reopening of China a positive development?
Getting the ball rolling with China, in early December, investors cheered headlines of a gradual easing of COVID restrictions and a reopening of the world’s second largest economy. Oil prices joined the party and rebounded from a nearly one year low on hopes that demand from the world’s top crude importer could be restored.
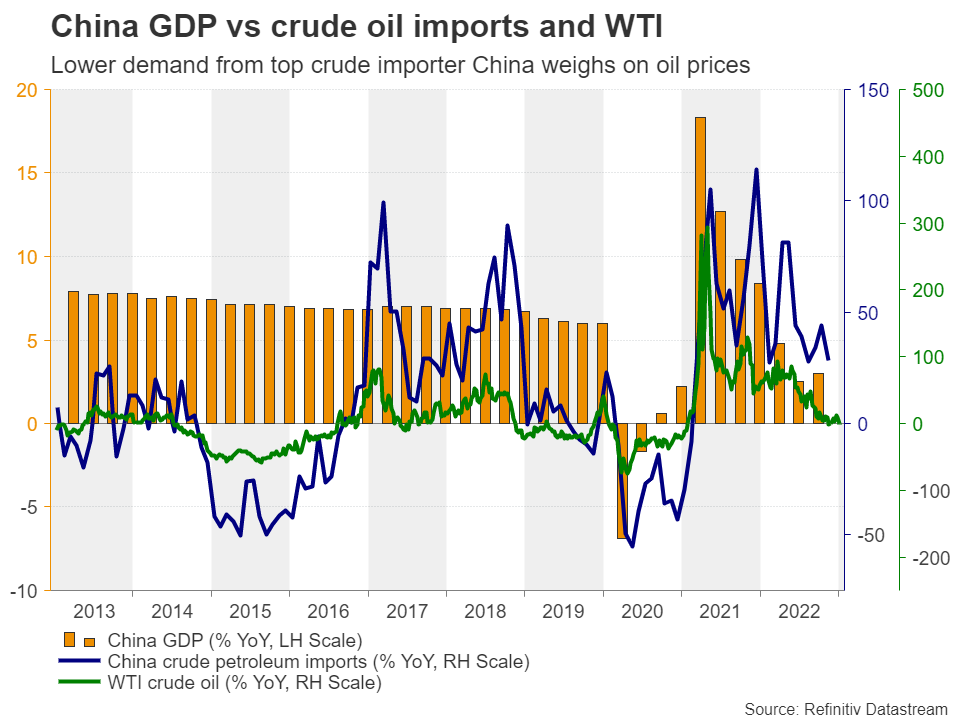
That said, with COVID infections soaring in many districts, the optimism faded fast. Investors became worried that, let alone the risk of reversing relaxations, the Chinese economy may take much longer to recover. There are also increasing concerns about the risk of new variants spreading to the rest of the world, resulting in economic complications elsewhere as well and thereby more reduction in fuel consumption. And all this as major economies, like the EU, the US, and the UK, are already considerably wounded.
What about the cap on Russian oil?
Apart from China’s reopening, the cap imposed by the G7 nations on Russian oil is another double-edged sword. Following the verdict, Russia decided to ban the supply of oil to nations that will abide by the cap for five months starting in February, which is supportive for prices.
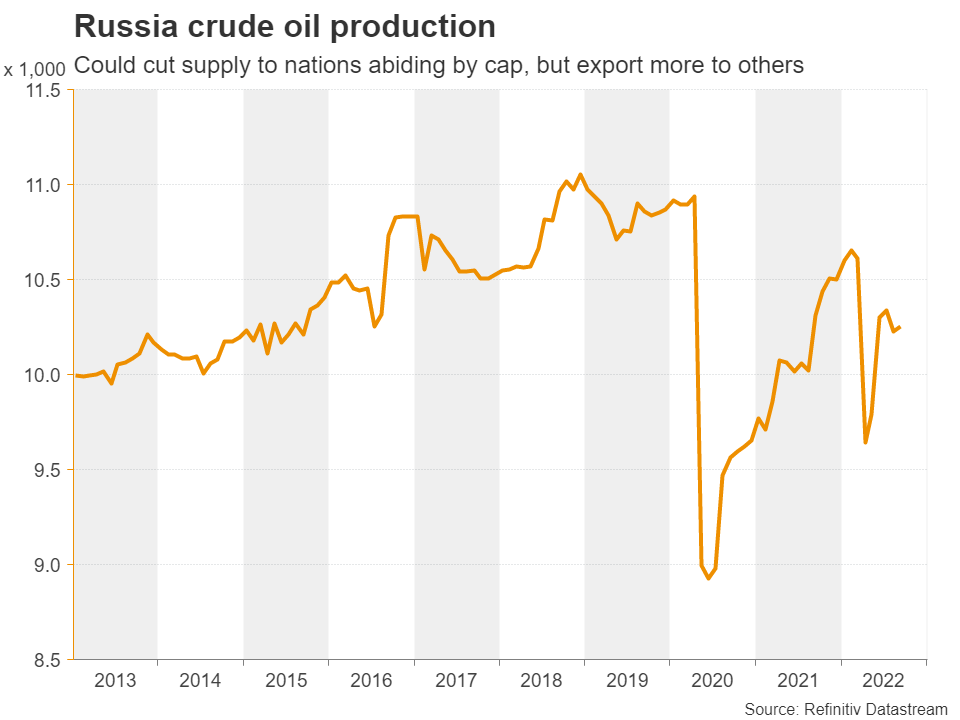
Nonetheless, given that more Russian oil is now shipped to China, Turkey, and Indonesia for refining and that there are no restrictions for the US and Europe on importing petroleum products made with Russian oil outside Russia, any gains in oil prices from Russia’s banning may be limited and short lived.
US reserves, OPEC, and winter also variables in the oil equation
Another source of demand may be the US’s decision to replenish its strategic petroleum reserve after selling record amounts, while the list of arguments pointing to a limited recovery includes the possibility of OPEC reversing some of its production cuts announced in November, as the cartel’s own projections point to increasing demand in 2023.
Winter is also a variable in the oil equation. EU nations’ ability to pile up oil before Russia’s retaliating measures take full effect and a mild winter so far have allowed oil prices to stay in downtrend mode. However, should winter get colder in the coming months, demand for heating oil could increase and thereby lift prices.
Outlook seems blurry for now
Blending everything together, the short-term outlook of oil looks blurry for now. Having said that though, what appears to be a clearer case for the next months is that a sustained uptrend may be off the books. Even if the Chinese economy recovers faster and oil demand is restored, and even if supply tightens more due to Russia’s decisions, a strong recovery in oil prices could well refuel inflation.
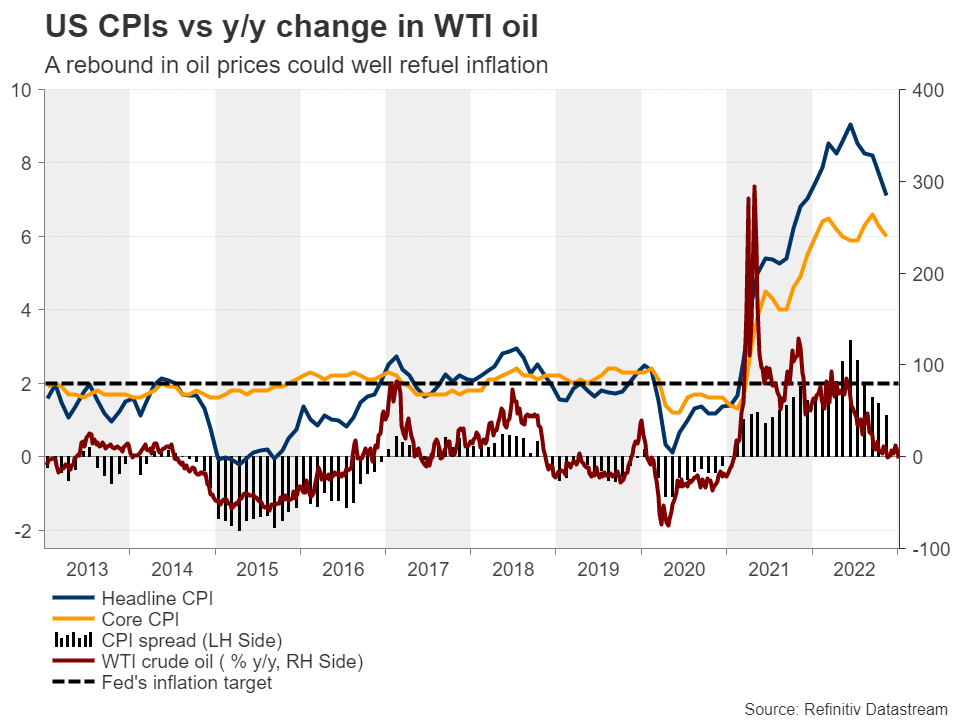
Should the central banks respond by re-accelerating and extending their tightening crusades, the global economy is very likely to fall into a deeper recession than currently estimated, which would eventually weigh on oil prices due to speculation that demand for energy could be dented again. A rebound in the US dollar as it reclaims the throne of the ultimate safe haven may also weigh on oil.
Now, if the surging infections in China result in more economic complications and the reopening of its borders more spreading of the virus to the rest of the world rather than spurring an economic recovery, oil prices may come instantly under pressure, with WTI perhaps falling below $70 per barrel.
Technical analysis still points to a downtrend
From a technical standpoint, WTI crude oil remains below the long-term uptrend line taken from the low of April 28, 2020, below the downtrend line drawn from the high of June 14, and below both the 50- and 200-day exponential moving averages. On top of that, last week, the black liquid came under selling pressure after hitting the short-term downtrend line, which implies that the bears may not have said their last word, despite allowing a rebound at the start of this week.
Should they overcome the low of December 9 at 70.40, a lower low would be confirmed and the trend may extend towards the low of December 2, 2021, at around 62.50. If that zone does not hold either, additional declines may result in the test of the 57.00 barrier, marked by the low of March 23, 2021, or even challenging the 51.50 zone, which provided support during January that year.
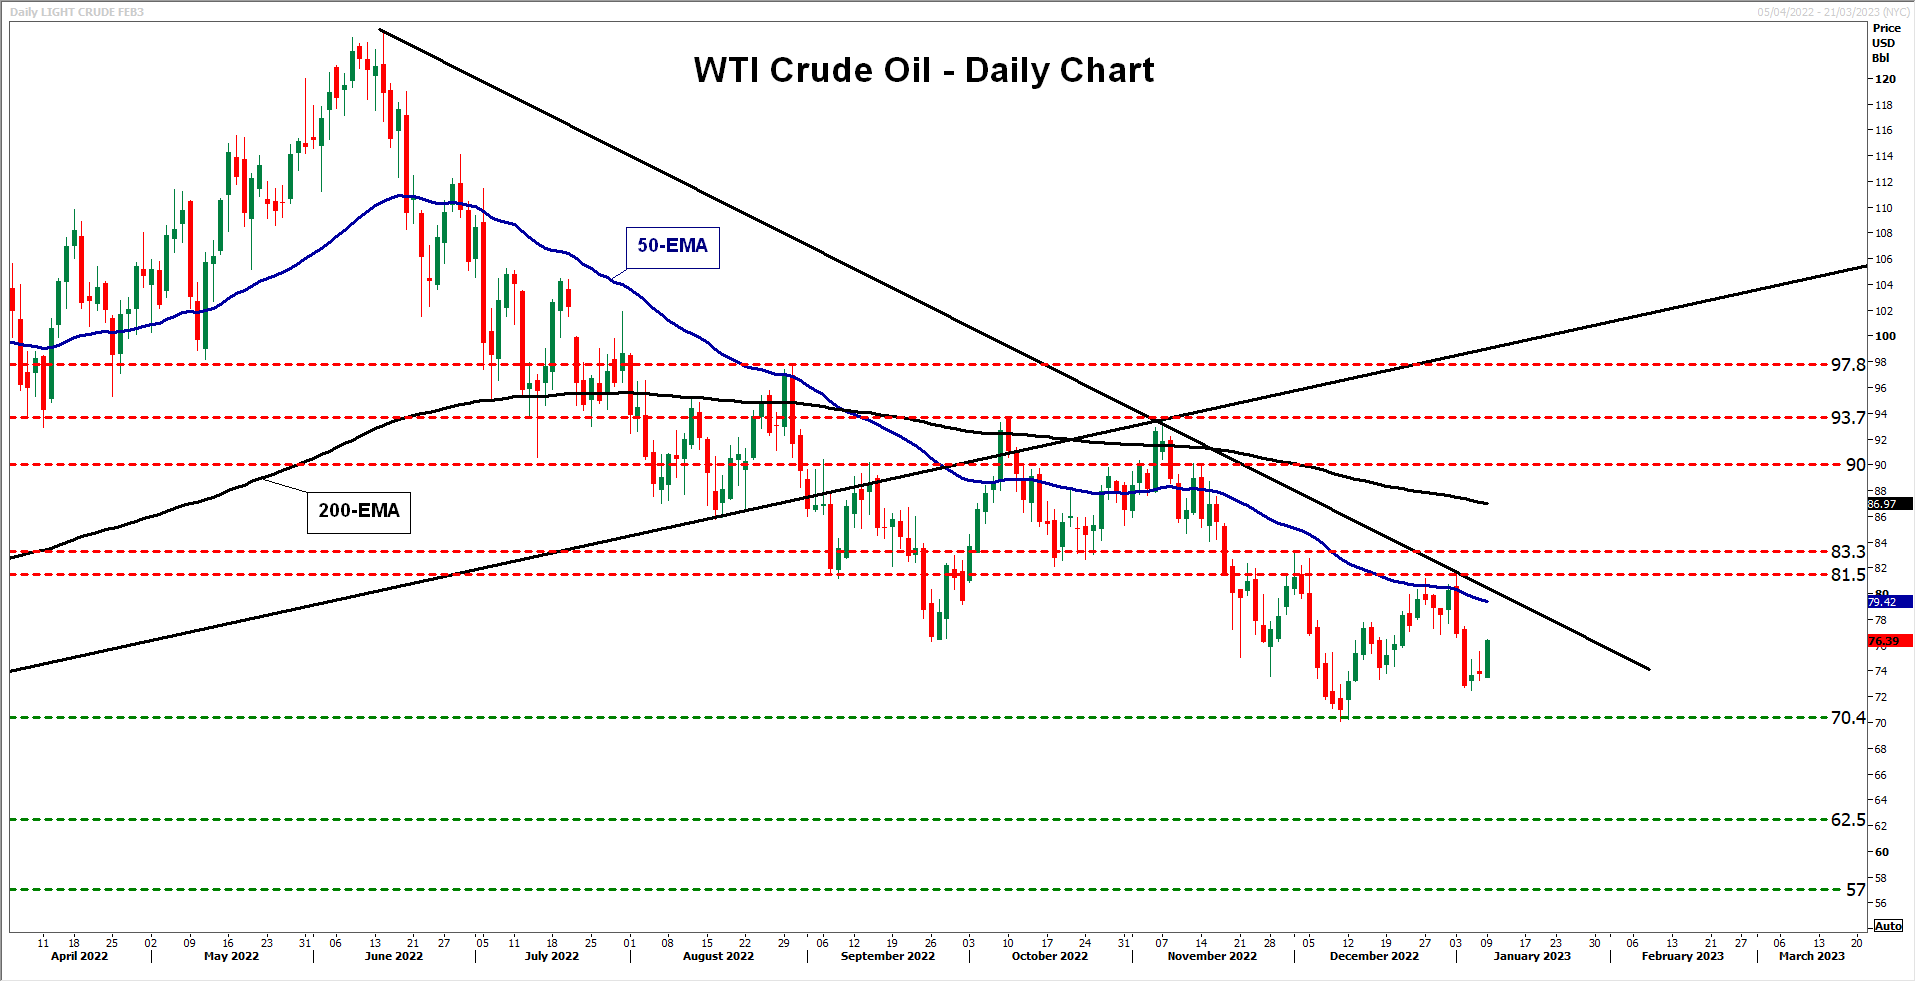
A decent recovery may be triggered upon a break above the 83.30 hurdle, which provided resistance on December 1 and support in October. Such a break could also take the price above the downtrend line and may allow advances towards the round number of 90.00 or the key resistance zone of 93.70, marked by the highs of October 7 and November 7 respectively. Slightly higher lies the peak of August 30 at 97.80 and the prior longer-term uptrend line, which may act as a strong resistance and confirm the hypothesis that any near-term recovery in oil prices is unlikely to lead to a sustained uptrend.
A meaningful uptrend may be a theme for the second half of 2023, conditional upon further cooling in inflation (especially underlying metrics), the end of the latest tightening crusade by major central banks, and signs of economic recovery worldwide.
USD/JPY Eyes Inflation, Household Data
The Japanese yen is calm on Monday and is trading slightly higher, at 132.27. The yen ended the week on a strong note, posting gains of about 1% on Friday.
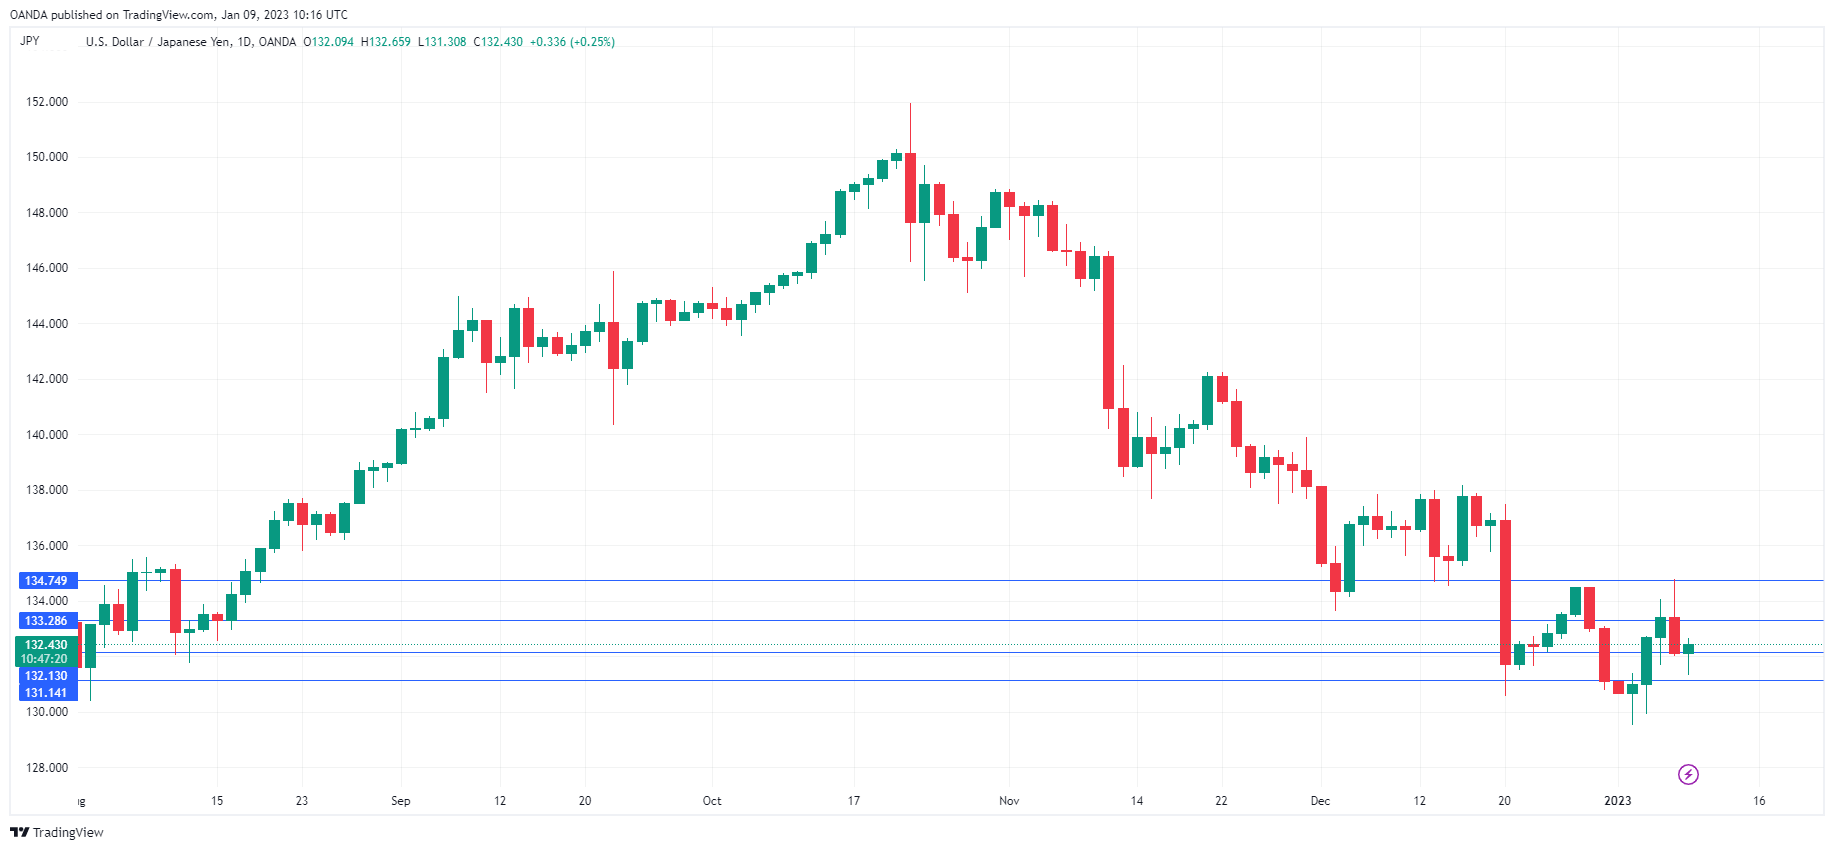
USD/JPY has shown significant volatility since late December. Last week, the pair traded in a range of over 500 points, which included breaking below the 130 line for the first time since May. We could see stronger movement again today, as Japan releases Tokyo Core CPI and Household Spending later in the day.
Tokyo Core CPI expected to rise to 3.8%
Tokyo Core CPI has been moving steadily higher since January 2022, when it came it a negligible 0.2%. The December report rose to 3.6%, up from 3.4%, and the upward trend is expected to continue, with a forecast of 3.8% for January. After years of deflation, rising prices have become the new norm. The Bank of Japan has repeatedly stated that it will not change its ultra-loose policy due to higher inflation. Governor Kuroda said last month that he expects inflation to fall below the 2% target as the effect of soaring import costs will ease. The BOJ shocked the markets in December by widening the yield curve band, and there is speculation that Kuroda’s successor, who will take over in April, could raise the yield targets on long-term bonds, which would be a major policy change.
High inflation has taken a bite out of Household Spending, which fell to 1.2% in October, down from 2.3% a month earlier. The downtrend is expected to continue, with a weak gain of 0.6% expected for November.
The US dollar was lower across the board on Friday, after the US posted some soft data. Nonfarm payrolls was slightly better than expected at 223,000, but wage growth headed lower. Average hourly earnings rose 4.6%, well off the 5.0% estimate and shy of the prior reading of 4.8%. The ISM Services PMI underperformed, slipping to 49.6, down sharply from 56.5 and the forecast of 55.5. This marked the first time the PMI has fallen into contraction territory since May 2020, with a reading below the neutral 50.0 threshold. The drop in wages and the weak services data indicate that the US economy is slowing and is likely to tip into recession, which could force the Fed to reconsider its aggressive rate-tightening policy.
USD/JPY Technical
- There is weak support at 132.13, followed by 131.14
- 133.28 and 134.75 are the next resistance lines
Dollar Index: Bears Pressure Key Support Zone and Risk Deeper Fall on Break
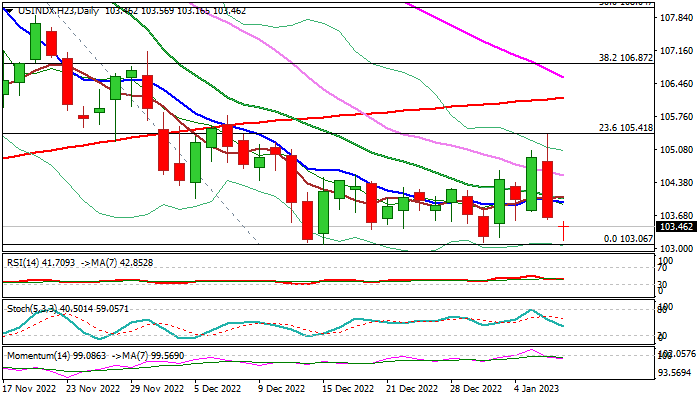
The dollar index remains at the back foot on Monday and pressuring key supports at 103 zone (lows of mid / late Dec, where a temporary base has formed) after strong fall on Friday (down 1.1% for the day).
The dollar came under increased pressure after US labor data signaled that the Fed may further ease its stance on interest rates, while China’s further easing of strict Covid policy, added to improving risk sentiment.
Daily studies returned to bearish configuration, contributing to weakening tone, though fresh bears need to register a clear break of 103 support zone, which would also confirm penetration into rising weekly cloud (top of the cloud lays at 103.64) and signal continuation of the downtrend from 114.72 (2022 high, the highest since 2002) which paused for consolidation in past two weeks.
Sustained break of 103 zone pivots (also bull-trendline off 89.50, May 2021 low) would risk drop towards 101.94 (50% retracement of 89.15/114.72 ascend), 100.44 (weekly cloud base) and 100 (psychological).
Initial resistances at 103.95 (10DMA) and 104.11 (20DMA) should ideally cap, but extended upticks should not exceed 105.41 (Friday’s high (Fibo 23.6% of 113.02/103.06) to keep larger bears intact
Res: 103.95; 104.11; 104.52; 105.41.
Sup: 103.06; 102.63; 101.94; 100.44.