Sample Category Title
EUR/GBP Daily Outlook
Daily Pivots: (S1) 0.8777; (P) 0.8801; (R1) 0.8832; More...
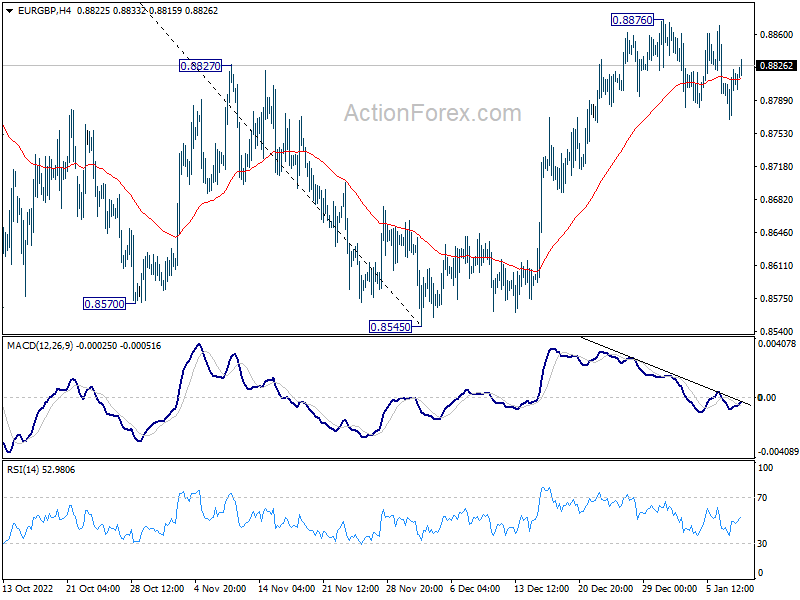
EUR/GBP is extending the consolidation from 0.8876 and intraday bias remains neutral. Further rally is expected as long as 55 day EMA (now at 0.8728) holds. Break of 0.8876 will resume the rise from 0.8545 to 61.8% retracement of 0.9276 to 0.8545 at 0.8997 and possibly above. However, sustained trading below 55 day EMA will bring retest of 0.8545 low instead.
In the bigger picture, outlook is mixed for now as rise from 0.8545 would either be part of the up trend from 0.8201 (2022 low), or just a correction to 0.9267 (2022 high). As long as 55 week EMA (now at 0.8616) holds, the former case is in favor, and break of 0.9267 should be seen next as up trend resumes at a later stage. However, sustained break of 55 week EMA will shift favor to the latter case, for another decline back towards 0.8201.
EUR/AUD Daily Outlook
Daily Pivots: (S1) 1.5430; (P) 1.5484; (R1) 1.5582; More...
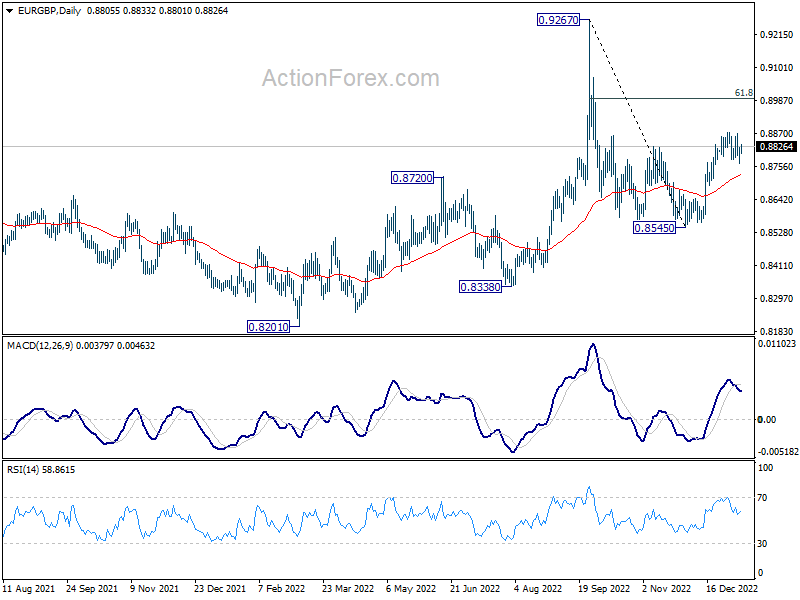
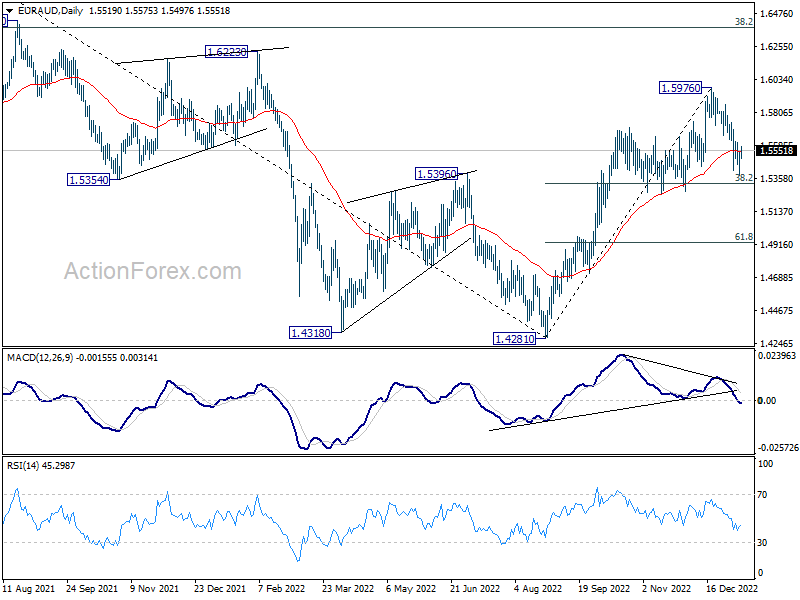
Intraday bias in EUR/AUD is turned neutral first with current recovery. Strong support could be seen from 38.2% retracement of 1.4281 to 1.5976 at 1.5329 to complete the correction from 1.5976. Break of 1.5614 minor resistance will turn bias back to the upside for retesting 1.5976. However, sustained trading below 1.5329 will carry larger bearish implication and target 61.8% retracement at 1.4928.
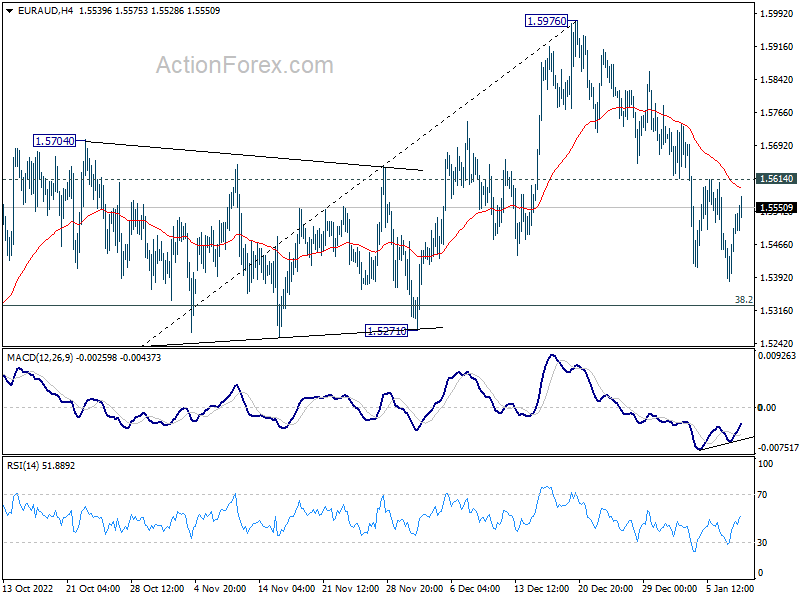
In the bigger picture, it's still early to confirm if rise from 1.4281 represents bullish trend reversal. But as long as 1.5271 support holds, such rally is in favor to continue. Break of 1.5976 will target 1.6434 key resistance next. On the other hand, firm break of 1.5271 will retain medium term bearishness instead.
EUR/CHF Daily Outlook
Daily Pivots: (S1) 0.9865; (P) 0.9878; (R1) 0.9902; More....
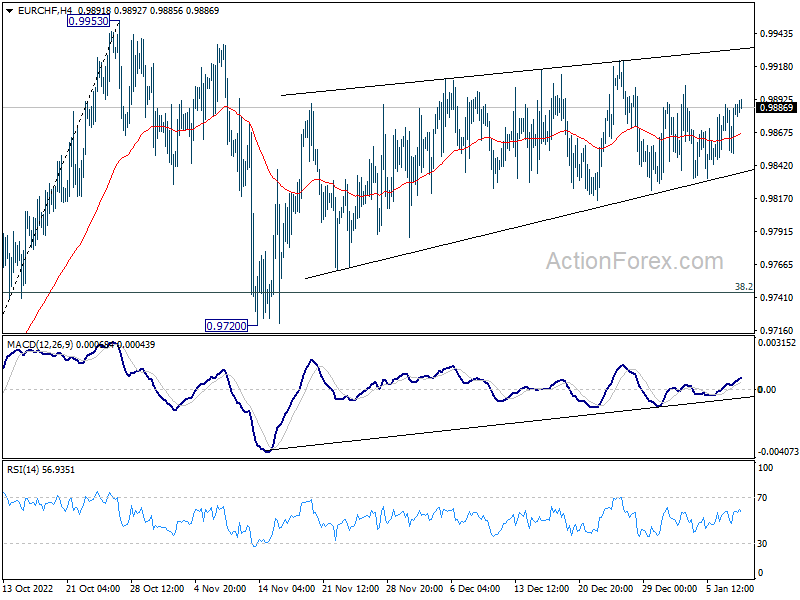
EUR/CHF is still extending the consolidation pattern from 0.9953 and intraday bias remains neutral. On the upside, firm break of 0.9953 resistance will resume larger rally from 0.9407 to 1.0072 fibonacci level. However, break of 0.9720 will extend the decline from 0.9953 to 61.8% retracement of 0.8407 to 0.9953 at 0.9616.
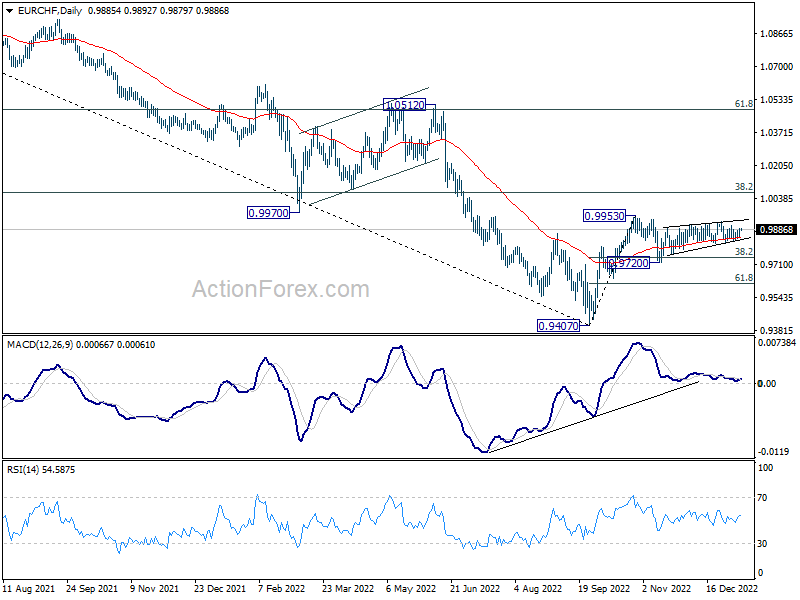
In the bigger picture, as long as 38.2% retracement of 1.1149 to 0.9407 at 1.0072 holds, price actions from 0.9407 medium term bottom will be treated as a corrective pattern. That is, long term down trend would resume through this low at a later stage. Nevertheless, firm break of 1.0072 will also have 55 week EMA (now at 1.0041) taken out. That would be an initial sign of long term bullish reversal.
Dax 40 Breaks Daily Resistance
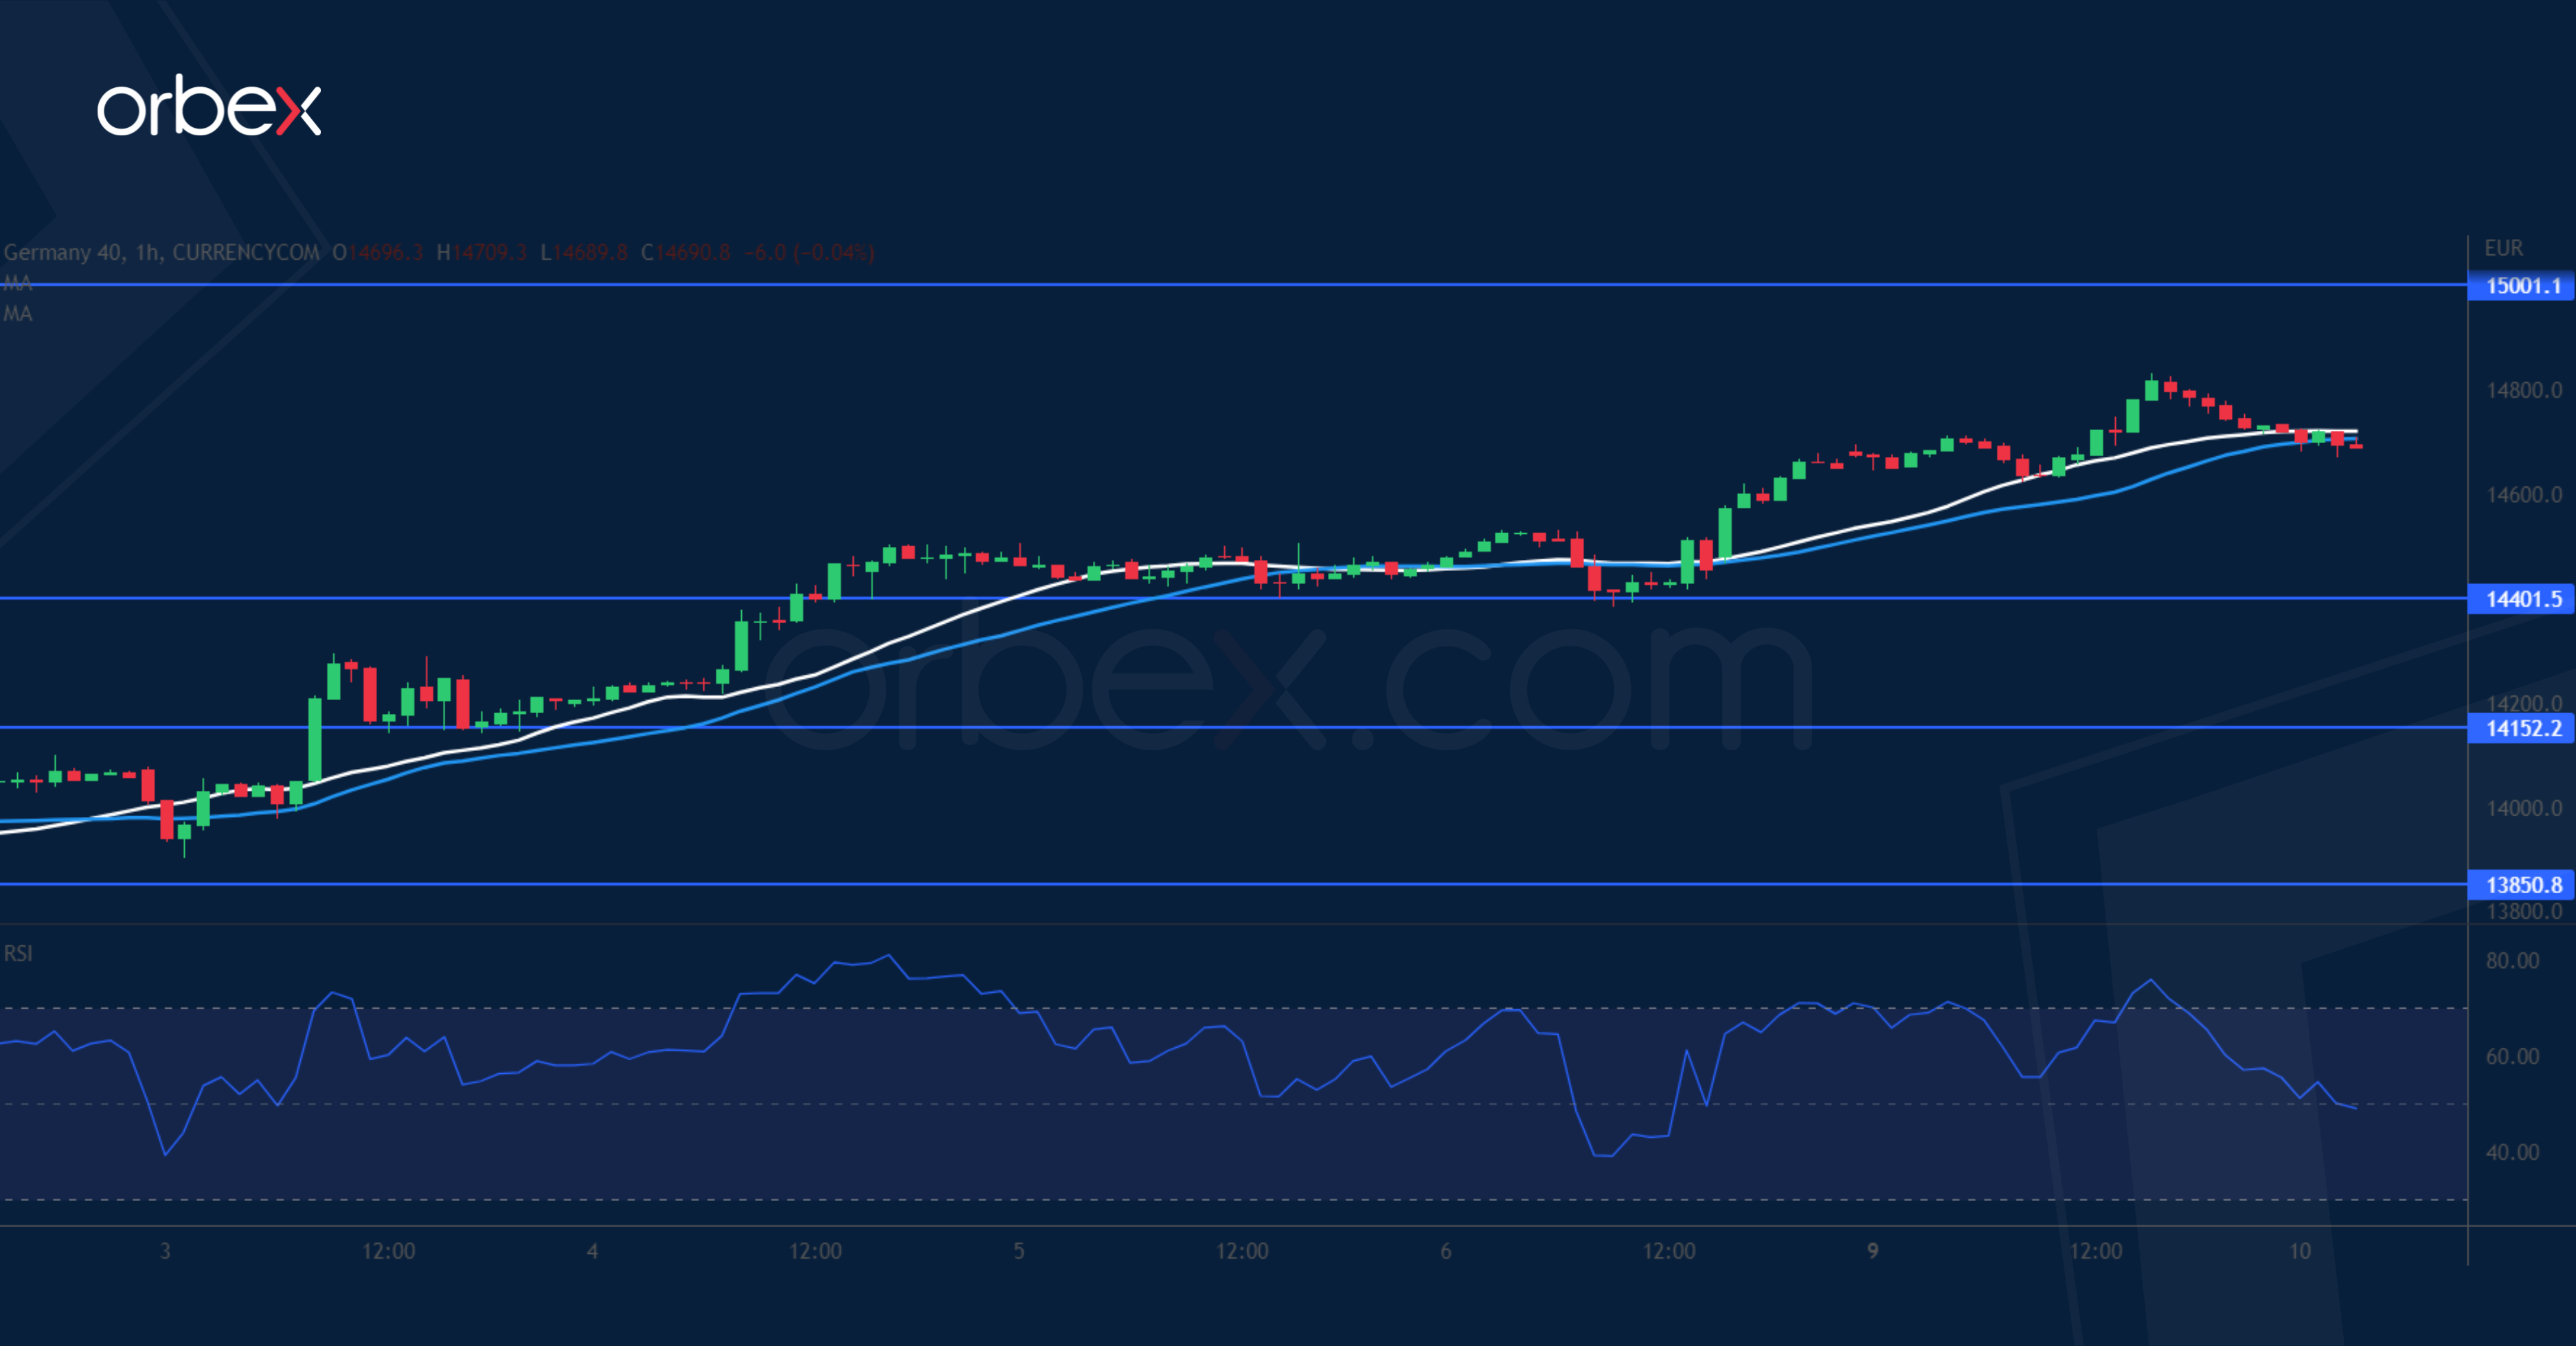
The Dax 40 climbs as upbeat industrial output in Germany eases fears of a deep recession. A close above December’s high of 14660, a major daily resistance may have put the index back on track. Zooming into the hourly chart, momentum from 14400 is a sign of strong conviction, prompting sellers to cover. In case of a pullback, the fresh support is a key level to keep the bullish bias intact. A brief consolidation could be in play after the RSI went overbought. The psychological level of 15000 might be next when volatility returns.
EUR/GBP Attempts to Recover
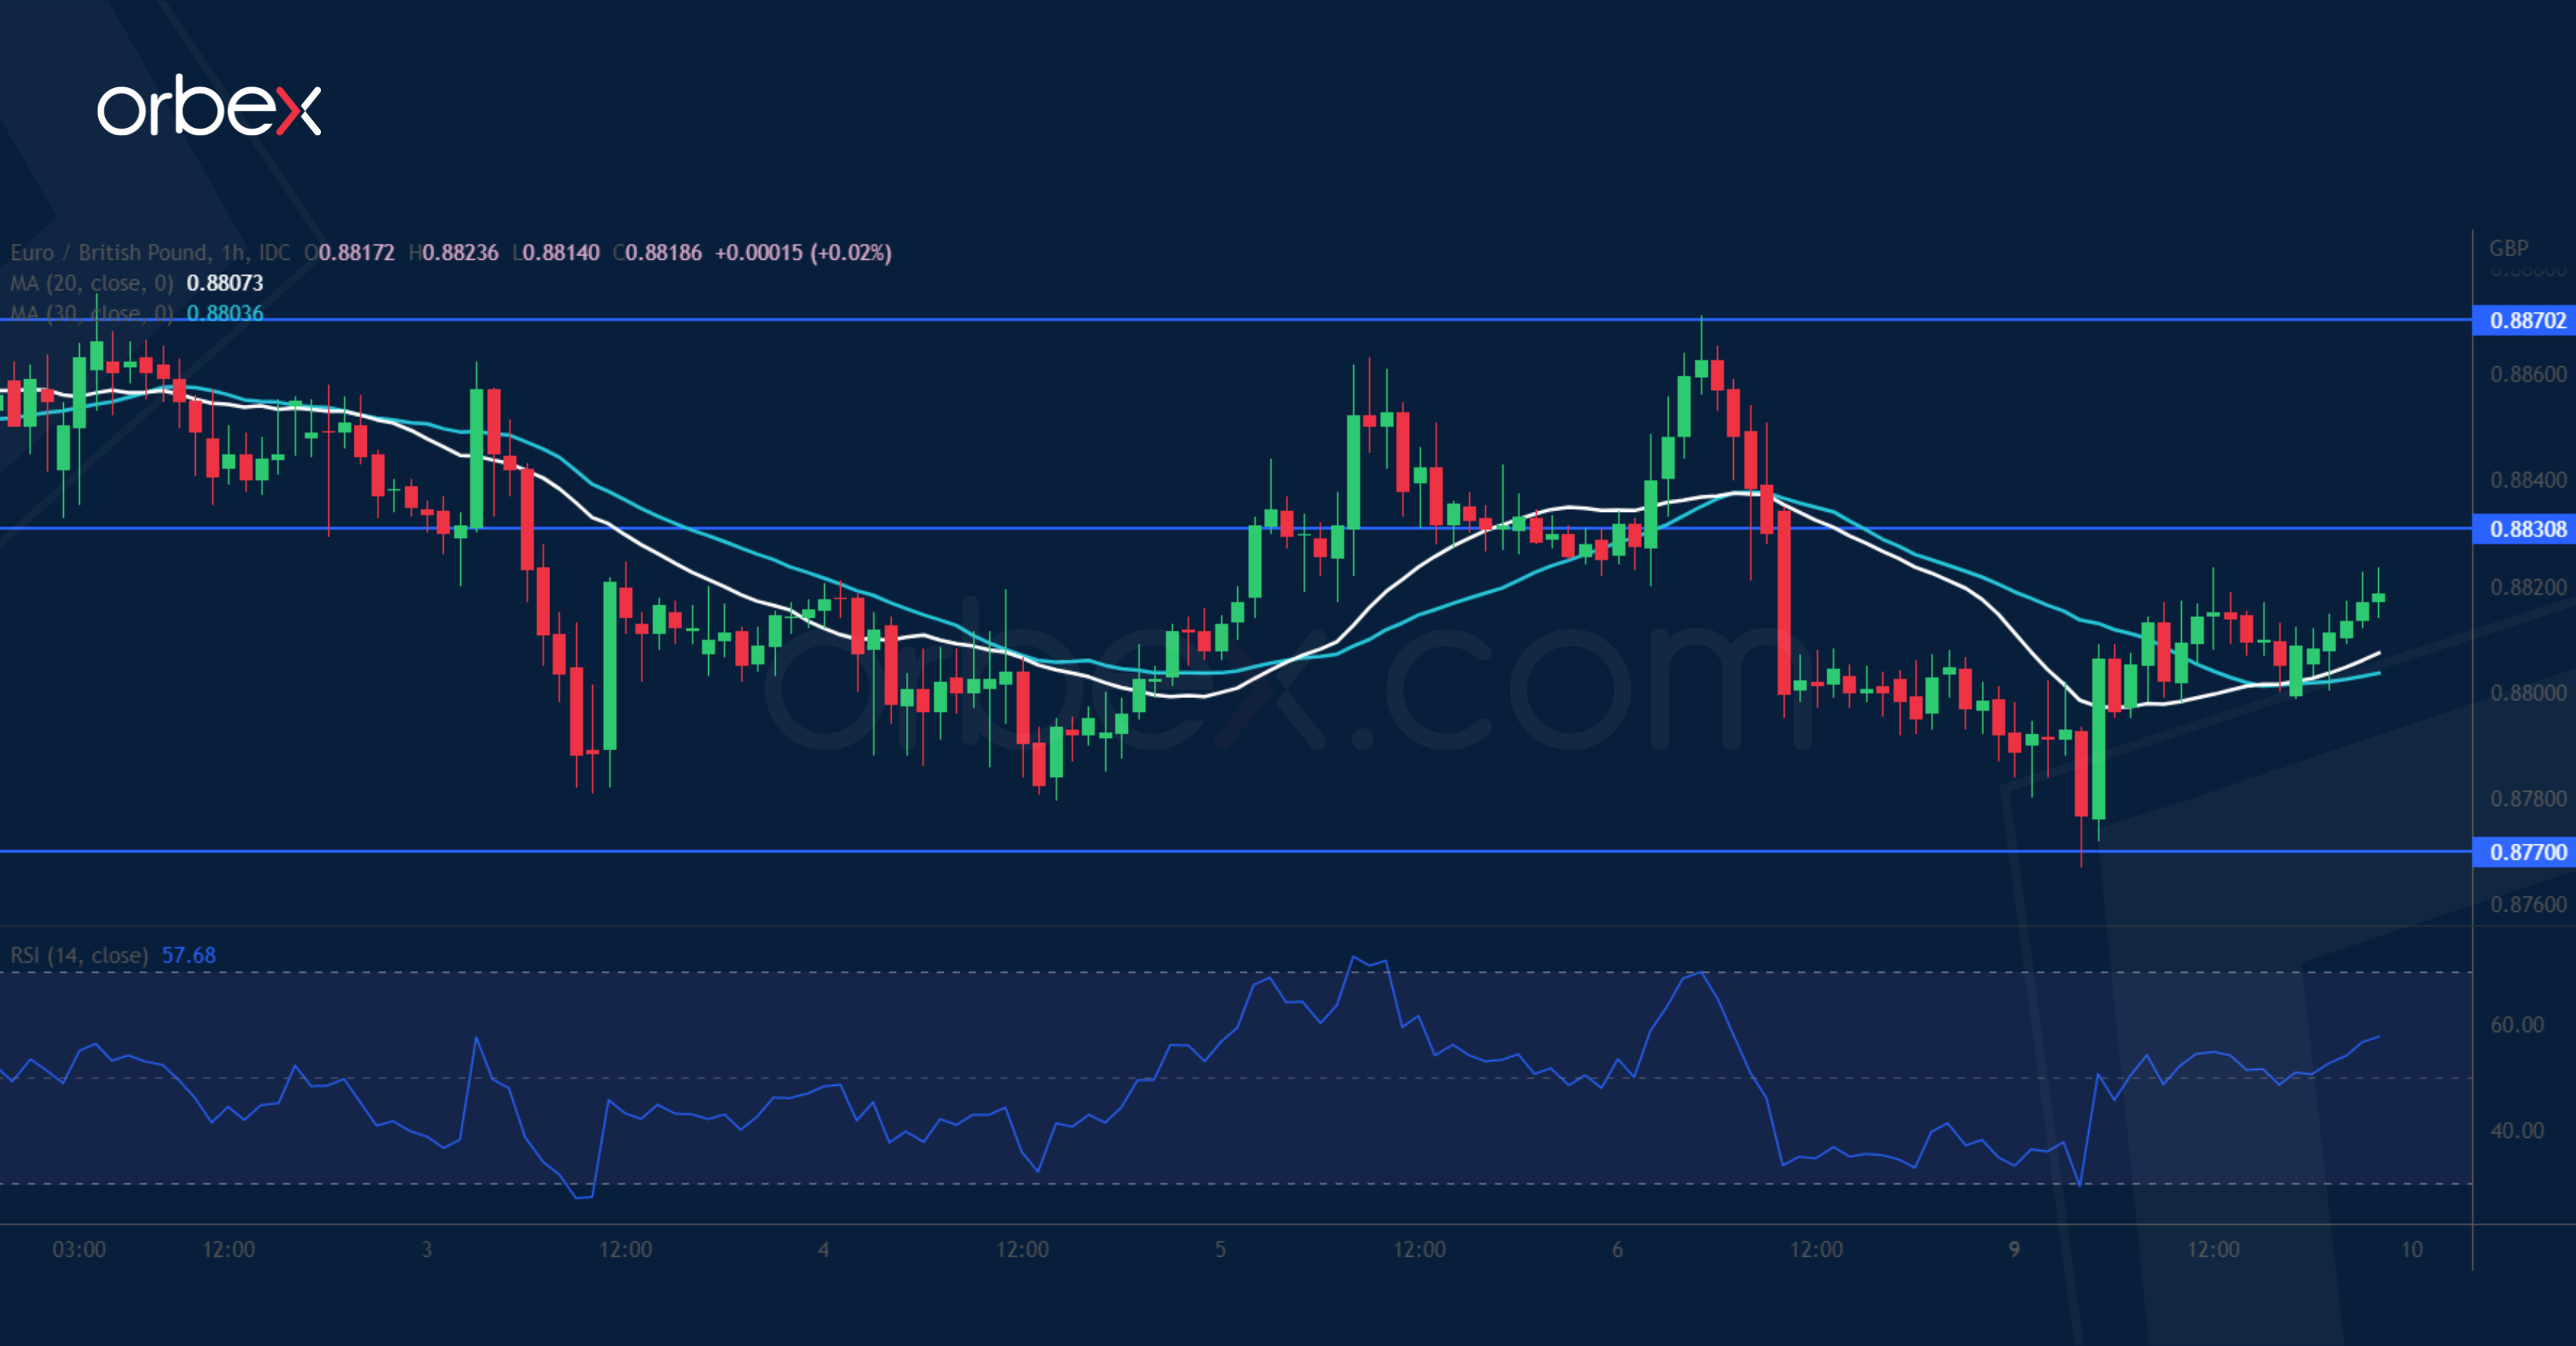
The pound softens as the BoE's chief economist warns of persistent inflation. On the daily chart, the euro is in a consolidation after it lifted last October’s high of 0.8860. A slide below 0.8780 may have prompted intraday traders to take profit, which could cause a choppy price action in the near term. 0.8770 is a fresh support and 0.8720 at the base of the bullish breakout is confluent with the 30-day moving average. Selling pressure could be expected between 0.8830 then 0.8870, but a breakout may trigger a bullish continuation.
USD/JPY Seeks Support
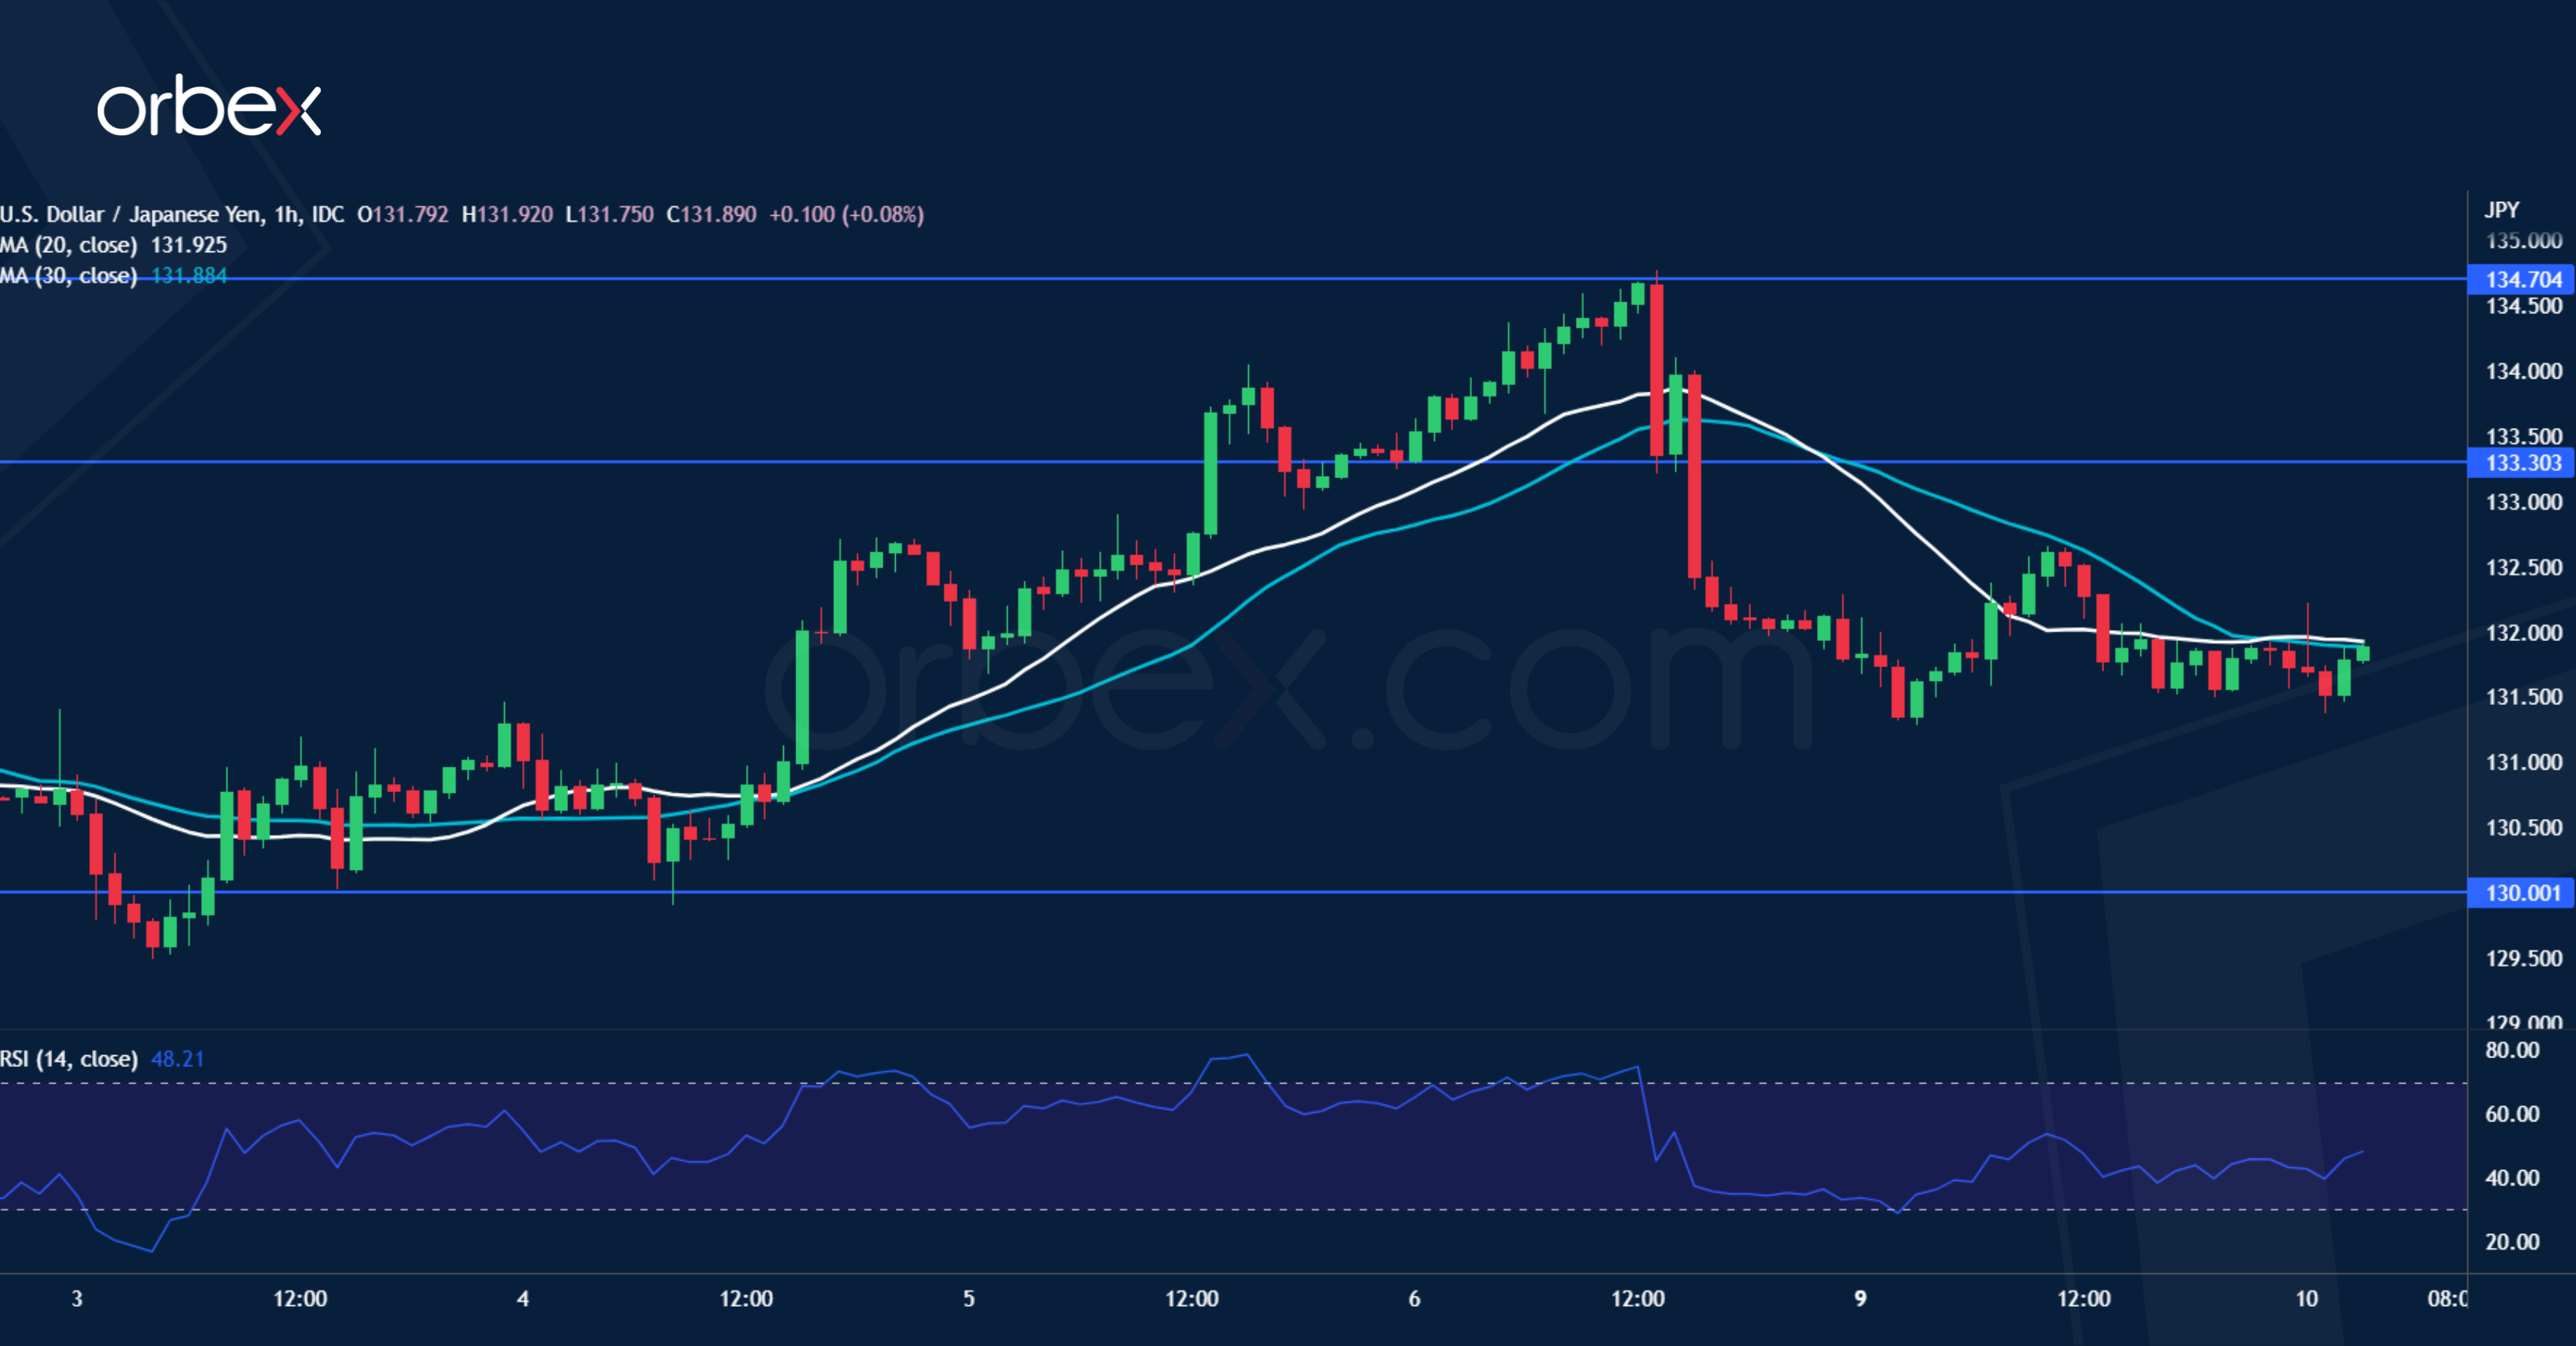
The Japanese yen rallied over better-than-expected Tokyo CPI in December. On the daily chart, a break below August’s low (130.50) has put the buy side under pressure. The latest bounce hit resistance in the supply zone 134.70-135.00 which coincides with the 30-day moving average. The bulls will need to clear the support-turned-resistance of 133.30 before they could turn short-term sentiment around. The psychological level of 130.00 at the bottom of the bounce is a critical floor to keep the dollar steady.
Dollar Faced a Second Consecutive Day of Heavy Selling Pressure
Markets
Friday’s post-ISM moves petered out yesterday though US Treasuries continued to outperform German Bunds. The NY Fed’s Survey of Consumer Expectations showed median one-year-ahead inflation expectations continuing to decline in December, falling by 0.2 ppt to 5%, its lowest reading since July 2021. In contrast, three-year-ahead inflation expectations were unchanged in December at 3%. US Fed governors again stressed the need to lift the policy rate beyond 5% as core (services) inflation shows no signs of slowing down yet. (FI) Markets selectively ignored the latter. US yields lost another 2.8 bps (10-yr) to 4.2 bps (2-yr). The US 10-yr yield is closing in on the support zone 3.4% (Dec low)/3.42% (50% retracement on Aug/Oct move higher)/3.49% (previous June high). German yields added 1.9 bps (10-yr) to 3.7 bps (20-yr) with the wings of the curve underperforming the belly. The dollar faced a second consecutive day of heavy selling pressure. The trade-weighted greenback (DXY) set a new sell-off low just below 103. EUR/USD tested the cycle top at 1.0735. 62% retracement on last year’s decline comes in at 1.0747 with the May high at 1.0787. Those levels are at risks of giving away this week, especially in case of a softer than expected US December CPI on Thursday. EUR/GBP over the past sessions failed to take out 0.8867 resistance. The pair closed just above 0.88 yesterday. We retain rather mixed comments by chief economist Pill. On the one hand he talked about the uncertainty around inflation drivers and a firm commitment to bring inflation back to the 2% target. On the other hand he pointed to the possibility of a turning labour market. “Should economic slack emerge and unemployment rise as the latest MPC forecasts imply, that will weigh against domestic inflationary pressure and ease the threat of inflation persistence.” Today’s eco calendar remains extremely thin. We keep a close eye on central bank speeches and the start of the US mid-month refinancing operation following the latest move in US Treasuries.
The Kingdom of Belgium (rated Aa3/AA/AA-; outlook all stable) yesterday announced that it intends to issue a new 10-yr syndicated OLO benchmark (OLO 97 Jun 2033) in the near future, subject to market conditions (likely today). It’s the first of three new expected benchmark deals in 2023 which serve to help complete a €45bn OLO funding need. In 2022, the Belgian debt agency raised €44.1bn in long term funding. OLO issuance is the lion share to cover this year’s €51.07bn gross borrowing requirement of the federal government, mainly consisting of a €27.54bn net financing requirement and €21.13bn worth of OLO redemptions. Apart from Belgium, also Italy (Sep2043) and Latvia (5y deal) mandated banks for a near term syndicated deal. Other sovereigns that didn’t hesitate to get new €-funding on the primary market last week included Slovenia (€1.25bn, MS +77 bps, 3.625%, Mar2033 & €0.25bn tap of 3.125% Aug2045 at MS +137 bps), Austria (€5bn, MS +8 bps, 2.9%, Feb2033), Portugal (€3bn, MS + 75bps, 3.5%, Jun2038) and Ireland (€3.5bn, MS +43 bps, 3%, Oct2043). All deals met with stellar demand.
News Headlines
Regional CPI data for Japan’s capital, a potential precursor for the nationwide development, show a seventh consecutive rise in December. The closely watched Tokyo core measure (excluding Fresh food prices) jumped from 3.6% to 4%, the highest level in about 40-year. The headline measure also touched 4%. The core-core reading, excluding fresh food and energy rose from 2.4% Y/Y to 2.7%. The rising inflation is putting pressure on the BOJ to take further steps to policy normalization after it widened the corridor for the target level of the 10-y yield in December. The BOJ is expected to upwardly revise inflation forecasts when it meets next week. The BOJ today didn’t announce any additional bond buying other than the regular purchases. The yen gains marginally USD/JPY (131.75).
The UK and the EU issued a joint statement after a meeting of UK Foreign Secretary James Cleverly, European Commission Vice President Maros Sefcovic and Norther Ireland Secretary Chris Heaton-Harris. The statement said that ‘while a range of critical issues need to be resolved to find a way forward, an agreement was reached on the way forward regarding the specific question of the EU’s access to UK IT systems’. This agreement on data exchange is seen as an important step to organize a workable solution for trade with Northern Ireland that both protects the Belfast Good Friday agreement and at the same time gives guarantees for both the integrity of the EU single market and the UK internal market. A new meeting to take stock on the progress in the process will take place on Jan 16.
Powell Could Shoot the Fed Doves Down
Good news is that Asian stocks entered bull market. Bad news is that the Federal Reserve (Fed) President Jerome Powell could hammer the post-NFP stock rally in US stocks. Sentiment is mixed and investors are tense before Powell’s speech, and Thursday’s US inflation data.
Asia enters bull market
Asian stocks entered the bull market, as China’s post-covid reopening, the weakening US dollar, and stimulus from the Chinese government and central bank supported a sustained rally in Chinese, and the Asian stocks since last October.
As a result, the MSCI Asia Pacific index gained more than 20% since the October dip.
Plus, China announced that it will continue supporting growth with unheard amounts of stimulus packages. It is on the news that the Chinee officials are discussing a record 3.8 trillion yuan quota for local government bond issuance this year – it equals $561 billion US dollars.
Many investors expect the Asian equities to diverge positively from their Western peers through this year.
Tense before Powell
In the US, the good mood is more difficult to justify and to extend. The euphoria around Friday’s jobs data faded on Monday, when Fed officials came up and said that… the Fed rates will go above the 5% level and stay there for some time.
Sounds familiar? Yes, it does, because the Fed officials have been saying that they will push the rates above 5% and keep them there for a long time to make sure that inflation is on a solid path toward the 2% target.
The S&P500 was unable to extend gains above the 3900, rapidly started erasing early-session gains and ended the session 0.08% lower. Nasdaq also gave back early-session gains, though closed the session 0.60% higher.
US equity futures are in the negative this morning, as the King of market disappointment, the Fed Chair Jerome Powell, will be speaking at an event in Stockholm today, and he will probably not pop the champagne just because the wages grew less than expected last month, especially when you think that the US economy added a near record 4.5 million jobs last year, and that the unemployment rate fell to 3.5%.
Looking at the activity on Fed funds futures, the pricing suggests that the Fed will raise the rates by 50bp at the beginning of February. This means that there is a good margin for hawkish pricing in the coming weeks, into the Fed decision. Thursday’s inflation read will be key in tilting the balance to one side, or to the other. A soft enough inflation figure could get investors to further go against the Fed.
In the FX
The US dollar index remains under a decent selling pressure, as a result of the dovish Fed expectations since last Friday’s US jobs data. While any hawkish readjustment could give a minor boost to the dollar, the US dollar is set for further weakness this year. If the Fed shifts to a more dovish tone, the dollar should weaken, and if not, the dollar should still weaken on rising recession odds.
The EURUSD advanced to 1.0760 yesterday, which is the highest levels since last summer, while Cable flirted with 1.22 this morning. Gold consolidates gains above $1870, while we are about to see a golden cross formation on the daily chart, where the 50-DMA will shortly go past the 200-DMA.
Other supportive factors of gold prices these days are the softening US yields, and the cheapening US dollar. A softer inflation report on Thursday could get the bulls to target a rally above $1900.
In energy, crude oil remains under pressure despite the Chinese reopening talk, and the falling Russian supply. We see that the European sanctions weigh on Russian oil supply, as the 4-week average shipments decline despite a small gain posted last week. That means that the lower Russian supply will be another supportive factor of oil prices, besides the Chinese reopening, the tight global supply, the rising global demand defying recession odds, the fact that the Americans will have to refill their reserves, and the fact that oil companies underinvest to increase capacity. Despite the actual selling pressure, levels into $70 could be interesting dip buying opportunities for those looking for a sustainable recovery.
Likewise, commodities see a decent boost thanks to the Chinese recovery story. Copper futures – which are a barometer for global economy, are on a strong positive trend since the beginning of October, but they remain vulnerable to any deterioration in the global outlook. In this respect, the World Bank is expected to release its latest global economic prospect report this Thursday, and the projections may not be rosy.
Equity Rally Stalls on Fed Comments
Market movers today
Both Norway and Denmark release CPI for December this morning while we will get various activity data out of Sweden later in the day, see Nordics section below.
In the US we get the NFIB small business optimism index. It is hovering at a low level and expected to stay weak. It also contains interesting sub-indices on price plans and outlook for compensation.
Fed Chairman Jerome Powell will speak at a Riksbank conference on central bank independence. It is not clear if he will comment on the current US economy as well.
The 60 second overview
Fed comments and markets. Yesterday Atlanta Fed's Bostic explained how he favours hiking policy rates to 5.00-5.25% and then keep policy on hold for "a long time". While this in isolation suggests 50bp is still in play for the February meeting Bostic did mention that a US inflation disappointment on Thursday (lower than expected print) could result in a 25bp hike instead. Also his counterpart from Fed Bank of San Francisco Daly explained how she still pencils in policy rates to move "somewhere above 5.0%" and that it's still too early to "declare victory" over persistent inflation.
Both comments come following markets returning to pricing in a peak in US policy rates below 5.0% which came on the back of Friday's non-farm payrolls and ISM services reports that both indicated that the nominal engine of the US economy is set to ease.
Markets have reacted to the comments by sending rates slightly higher, the equity rally has stalled while the recent sell-off in the USD has calmed. The oil price has also come slightly lower while gold is little changed.
Japan inflation. Overnight Tokyo inflation matched expectations on both the headline and core measure at 4.0% Y/Y and 2.7%, respectively. Tokyo inflation is used as a proxy for the national inflation prints that have become increasingly important - not just for Japan but also for global markets with Bank of Japan set on course for ending its yield curve control later this year.
Credit: Despite continued high activity in the primary market, sentiment remains upbeat in credit and investor appetite for new deals continues to look solid. Secondary spreads are also performing and yesterday, iTraxx Xover tightened 8.4bp and Main 1.8bp, reaching their lowest levels since April last year.
FI: European rates were quite volatile yesterday although core and semi-core rates ended only 2bp higher across the curves. Peripheral spreads performed relative to core. The morning session was dominated by partial reversal of Friday's rally.
FX: Scandies got off to a good start to the week, where USD and JPY struggled in the other end of the G10 currency sphere. CNY continues to gain momentum vis-à-vis USD, but took a breather vis-à-vis EUR yesterday.
Nordics
Today is primarily about Norwegian and Danish CPI.
Norway. Norwegian core inflation for once surprised to the downside in November, with prices for food, hotels/restaurants and furniture/interiors not rising as much as expected. Although the figures were probably affected by discounting during Black Week, they confirmed that the underlying trend, as reflected in the monthly change in seasonally adjusted terms, is still down. A slight correction after Black Week means that we expect the annual rate to stay at 5.7% in December.
Denmark. November delivered a decent downside surprise on the back of lower energy prices, which presents the risk of an upside surprise in the December figures. On the other hand, December has seen the market prices of electricity, gas, petrol and diesel fall, which overall means we expect a decline in the consumer price index of 0.3% relative to November. However, in terms of the annual inflation rate comparing to December last year, it implies an increase from 8.9% in November to 9.0% in December. Developments remain very uncertain, for example for food prices, which we have incorporated into our forecast with a small decline.
That said we also get data out of Sweden:
We get a bunch of November data with production figures, household consumption and GDP-indicator all due. Household consumption is likely to be affected by the bounce up in retail sales, probably an effect of the Black Friday sales. GDP and PVI (production) are usually quite correlated. Although recent GDP prints have been resilient, both NIER and PMI's point to a slowdown with weak order inflow and this should start to show up in the production figures.
The National Debt Office also releases the December budget outcome and its forecast is a borrowing requirement of SEK 138bn. Note, however, that in the previous two months the borrowing requirement has been SEK 13bn lower than expected, largely due to higher tax revenues. Last but not least, today the Riksbank holds an international symposium with speakers such as Bailey (BoE), Kuroda (BoJ), Schnabel (ECB), Powell (Fed) and Knot (ECB). The new Riksbank governor Thedeen will give some intro remarks which will also be his first words as the head of the Riksbank.
Technical Outlook and Review
USD/JPY:
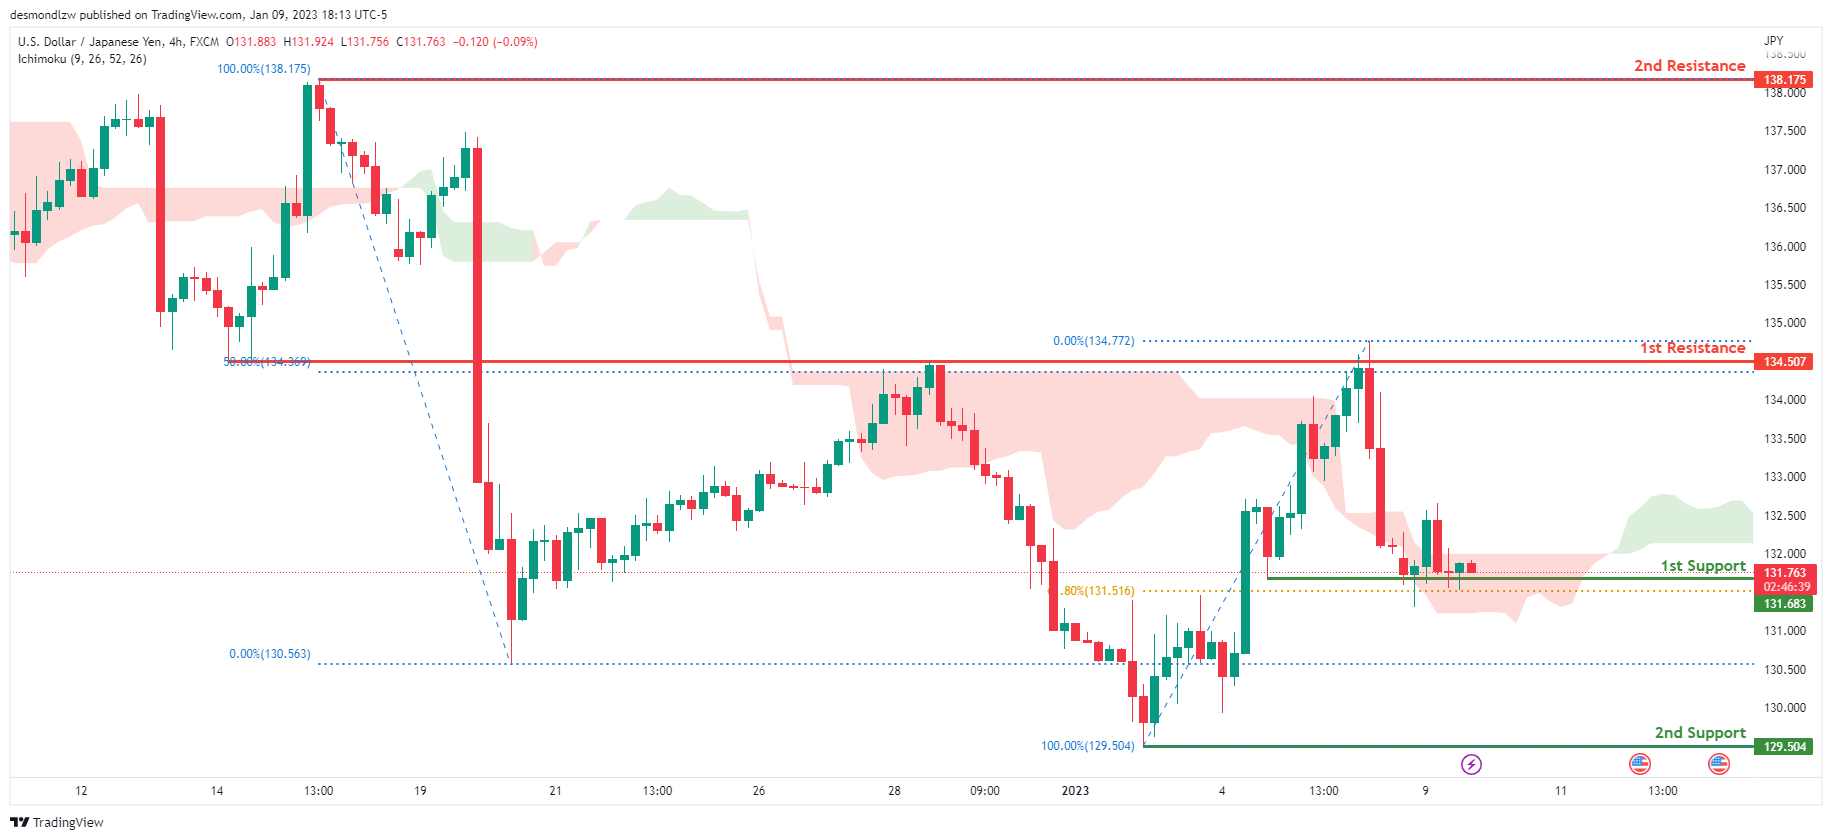
Looking at the H4 chart, my overall bias for USDJPY is bearish due to the current price being below the Ichimoku cloud, indicating a bearish market. If this bearish momentum continues, expect price to possibly break the 1st support at 131.683, where the 61.8% Fibonacci line is, before heading towards the 2nd support at 129.504, where the previous swing low is. In an alternate scenario, price could possibly head back up towards the 1st resistance level at 134.507, where the 50% Fibonacci line is.
Areas of consideration:
- H4 time frame, 1st resistance at 134.507
- H4 time frame, 1st support at 131.683
- H4 time frame, 2nd support at 129.504
DXY:
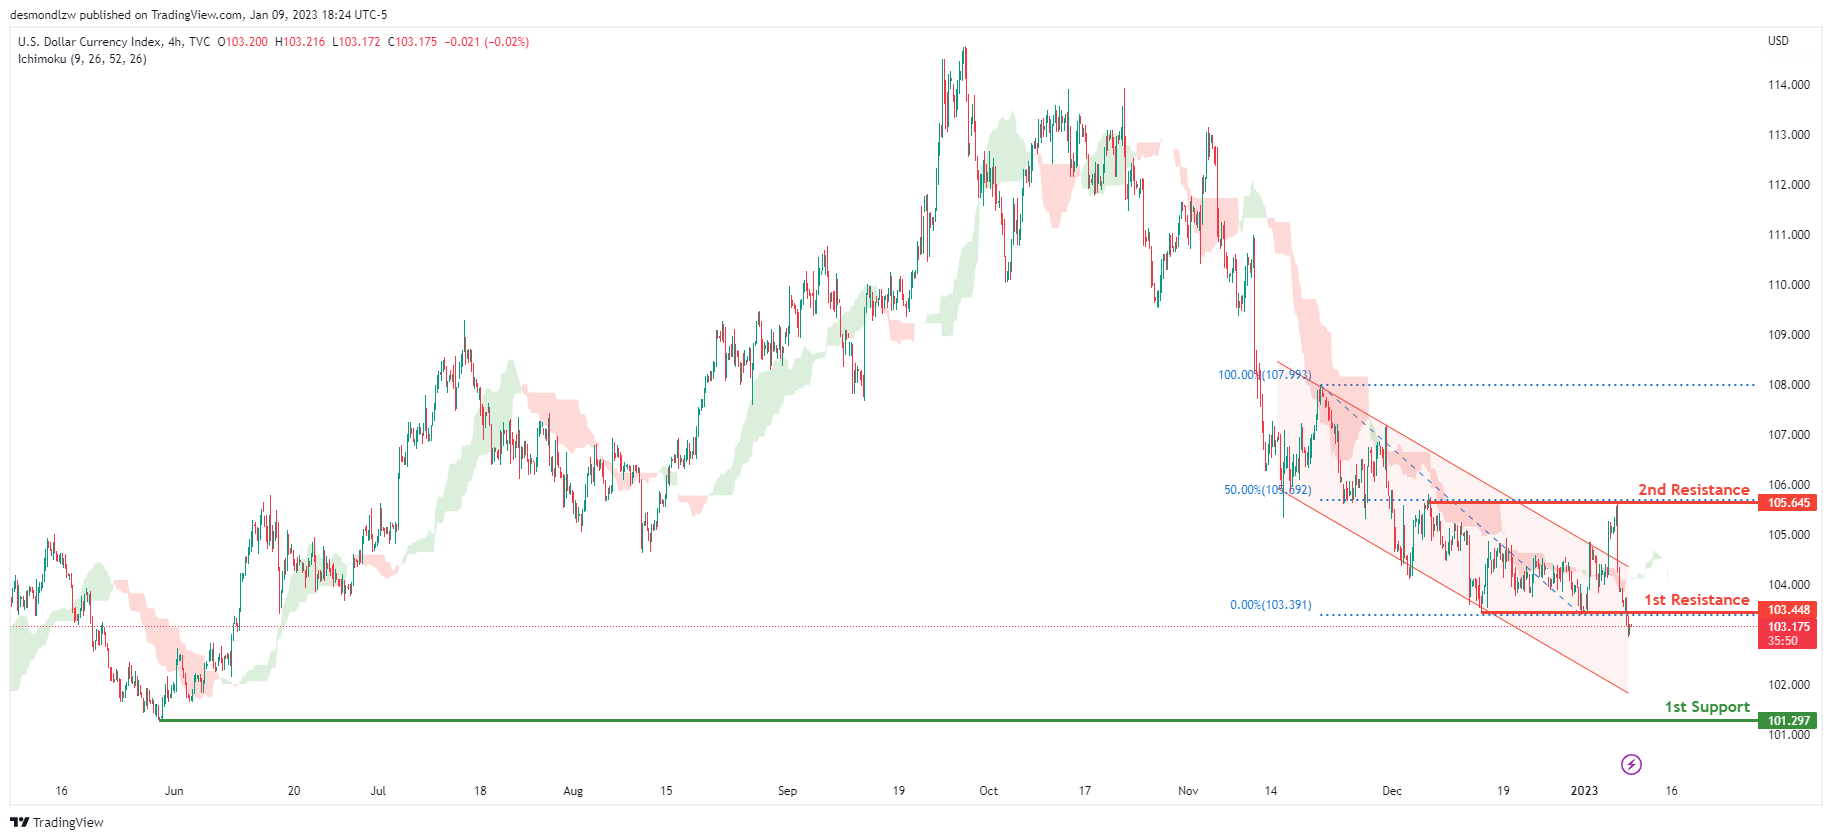
Looking at the H4 chart, my overall bias for DXY is bearish due to the current price being below the Ichimoku cloud, indicating a bearish market. To add confluence to this, price is within the descending channel which indicates a bearish market. If this bearish momentum continues, expect the price to possibly continue heading towards the 1st support at 101.297, where the previous lows and liquidity hotspots are. In an alternative scenario, price could head back up to retest the 1st resistance at 103.448, where the previous low is.
Areas of consideration:
- H4 time frame, 1st resistance at 103.448
- H4 time frame, 1st support at 101.297
EUR/USD:
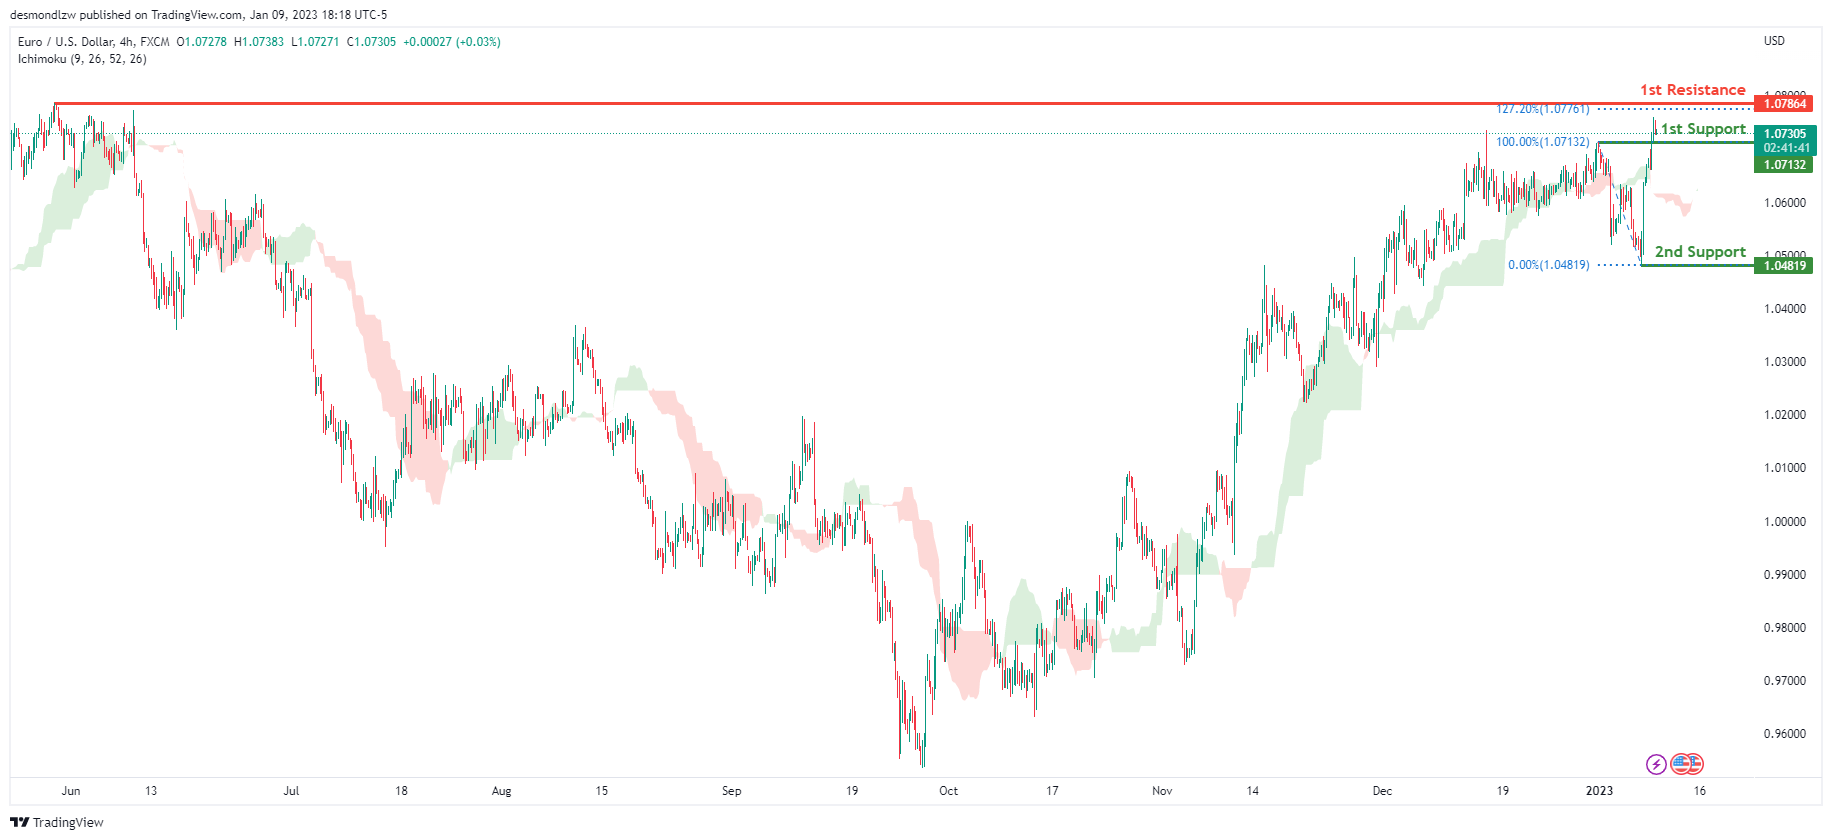
Looking at the H4 chart, my overall bias for EURUSD is bullish due to the current price being above the Ichimoku cloud, indicating a bullish market structure. If this bullish momentum continues, expect the price to possibly continue heading towards the 1st resistance at 1.07864, where the previous swing high is. In an alternate scenario, price could possibly head back down to retest the 1st support level at 1.07132, where the previous swing high is.
Areas of consideration :
- H4 1st resistance at 1.07864
- H4 1st support at 1.07132
GBP/USD:
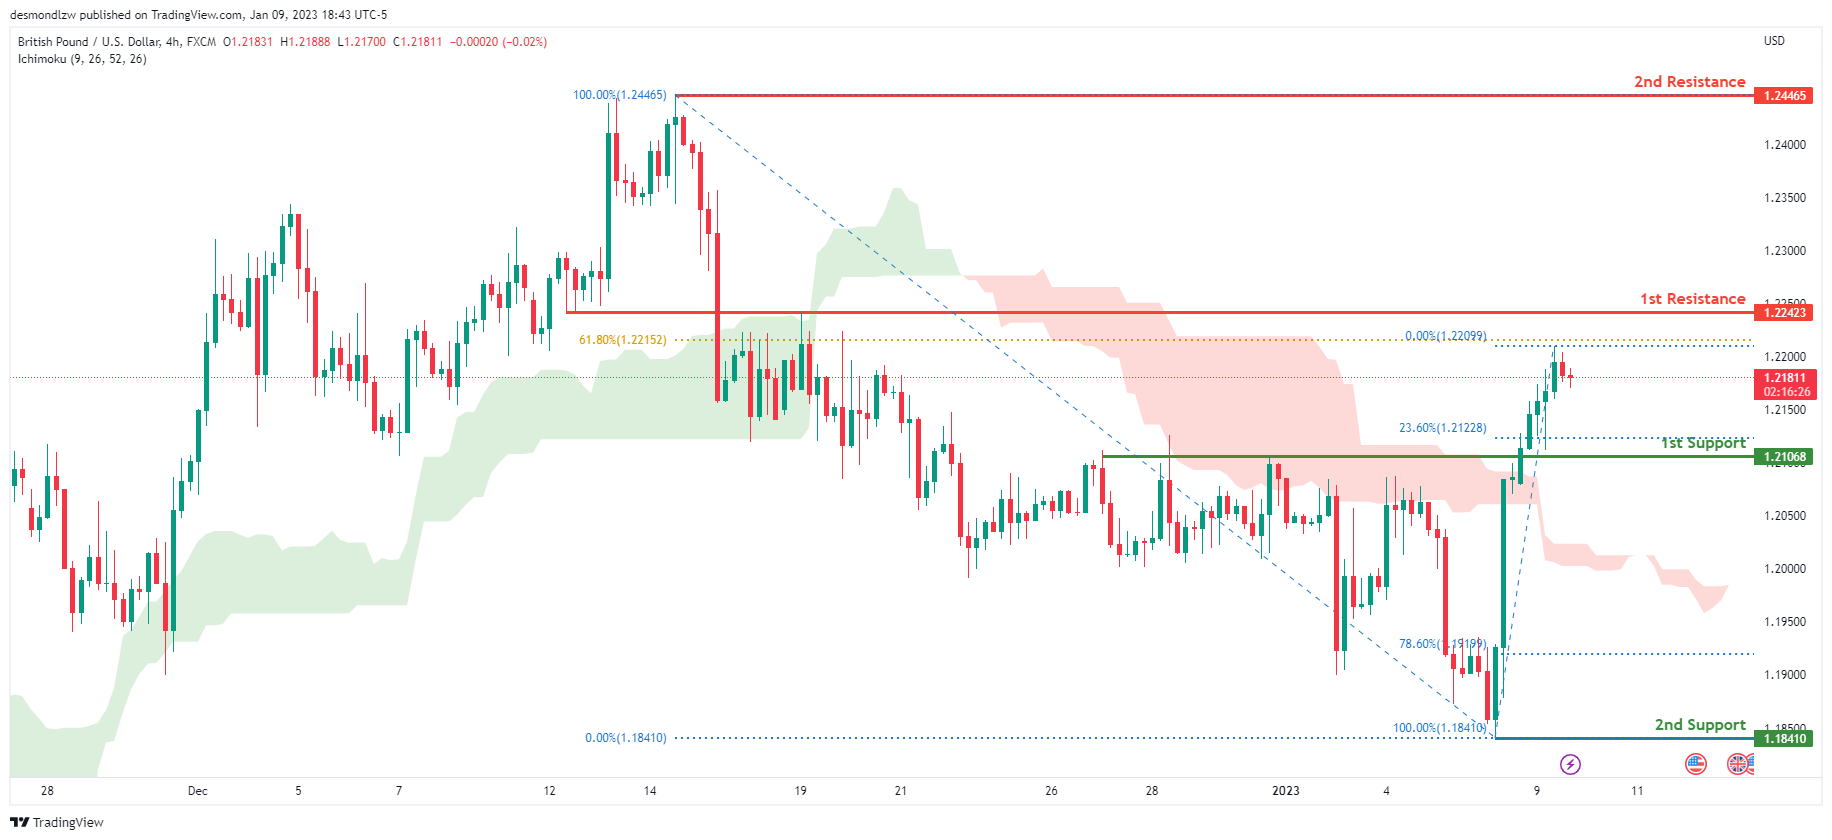
Looking at the H4 chart, my overall bias for GBPUSD is bullish due to the current price being above the Ichimoku cloud, indicating a bullish market. If this bullish momentum continues, expect price to possibly continue heading towards the 1st resistance line at 1.22423, slightly above where the 61.8% Fibonacci line is. In an alternate scenario, price could possibly head back down towards the 1st support at 1.21068, where the 23.6% Fibonacci line is
Areas of consideration:
- H4 1st resistance at 1.22423
- H4 1st support at 1.21068
USD/CHF:
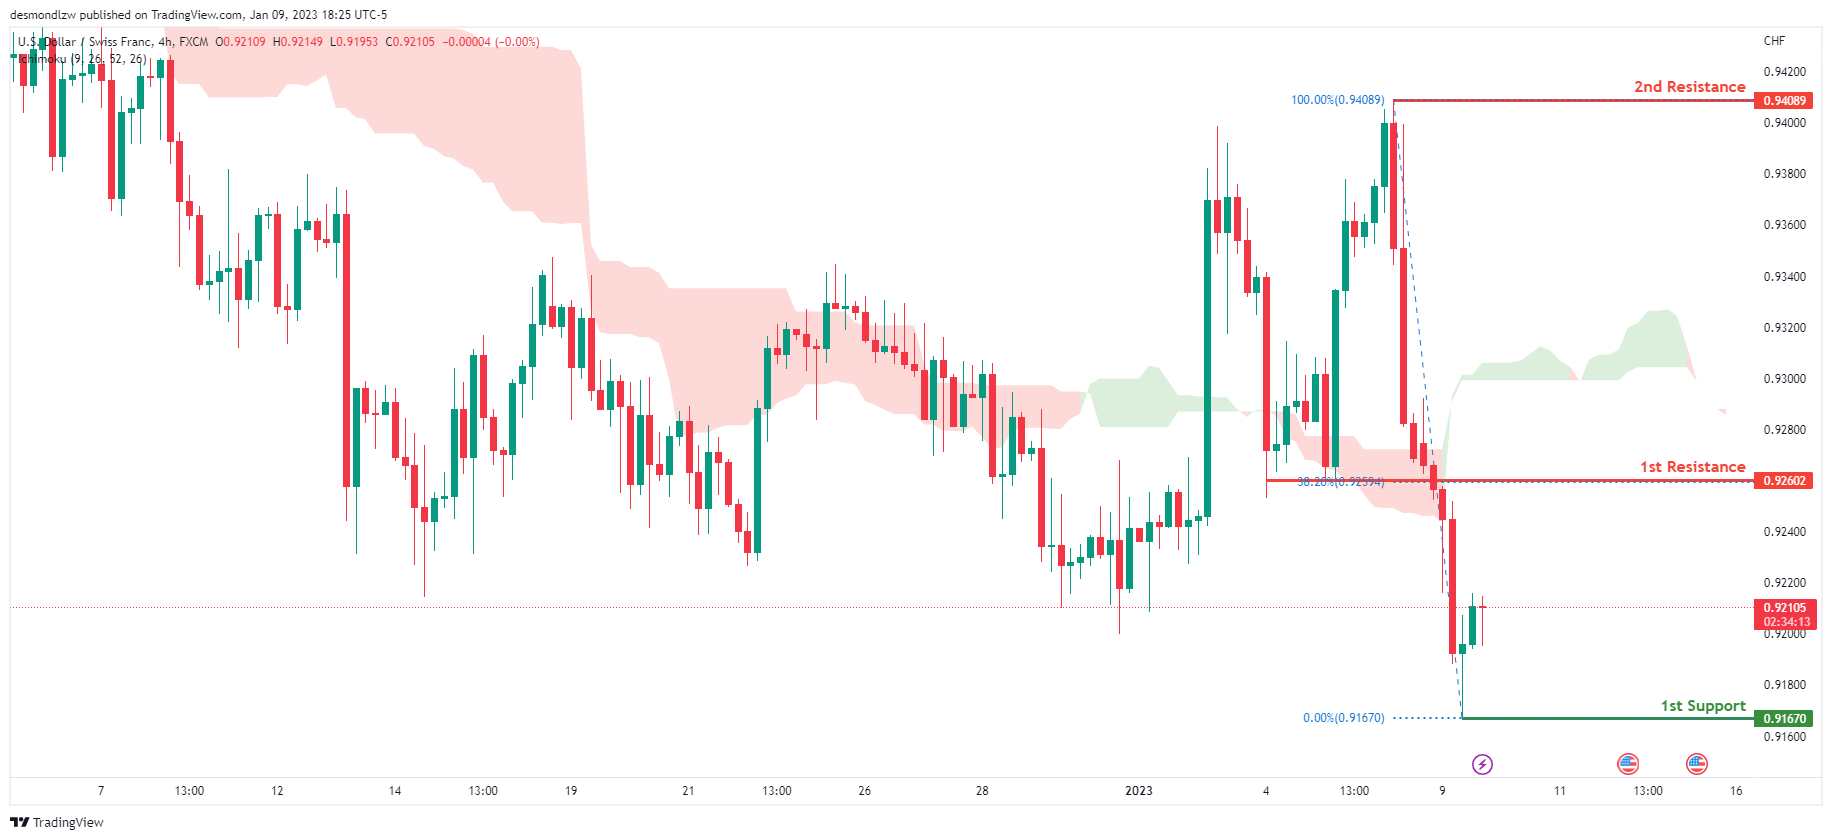
Looking at the H4 chart, my overall bias for USDCHF is bearish due to the current price being below the Ichimoku cloud, indicating a bearish market. If the current bearish trend continues, expect the price to head towards the 1st support at 0.91670, where the recent low is. In an alternative scenario, price could possibly head back up to retest the 1st resistance at 0.92602, where the 38.2% Fibonacci line is.
Areas of consideration
- H4 1st support at 0.91670
- H4 1st resistance at 0.92602
XAU/USD (GOLD):
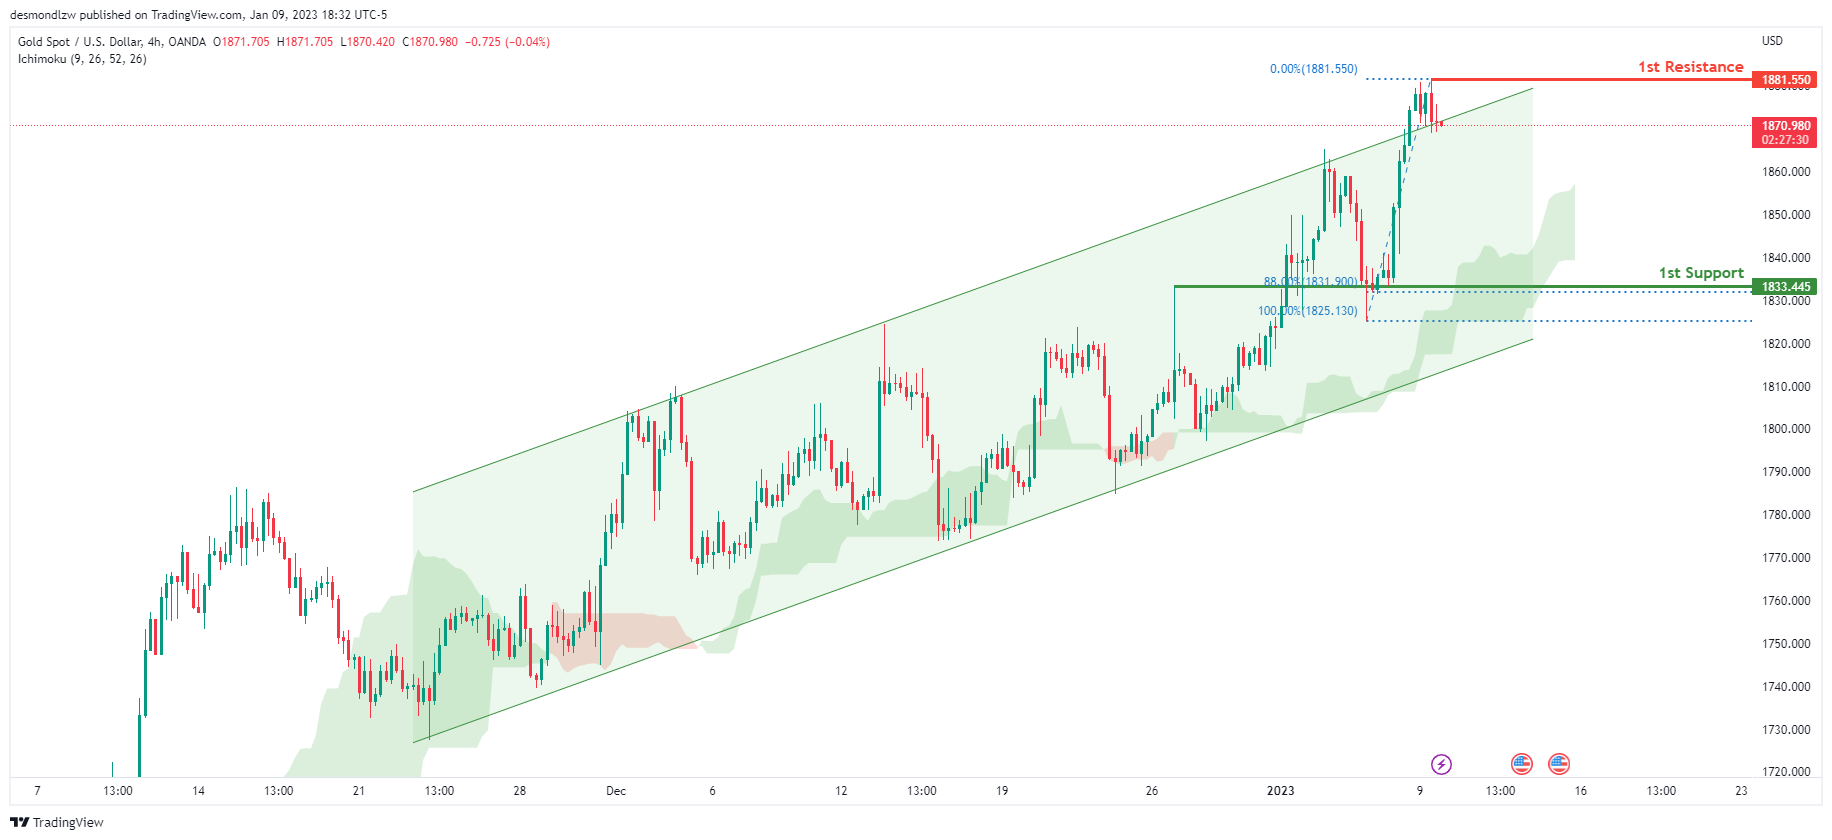
Looking at the H4 chart, my overall bias for XAUUSD is bullish due to the current price crossing above the Ichimoku cloud, indicating a bullish market. To add support to this bias, price is also within a bullish ascending channel. If this bullish momentum continues, expect the price to possibly continue heading towards the 1st resistance at 1881.550 where the recent high is. In an alternative scenario, price could possibly head back down towards the 1st support at 1833.445, where the 88% Fibonacci line is.
Areas of consideration:
- H4 time frame, 1st resistance at 1881.550
- H4 time frame, 1st support at 1833.445
- H4 time frame, 2nd support at 1833.445
AUD/USD:
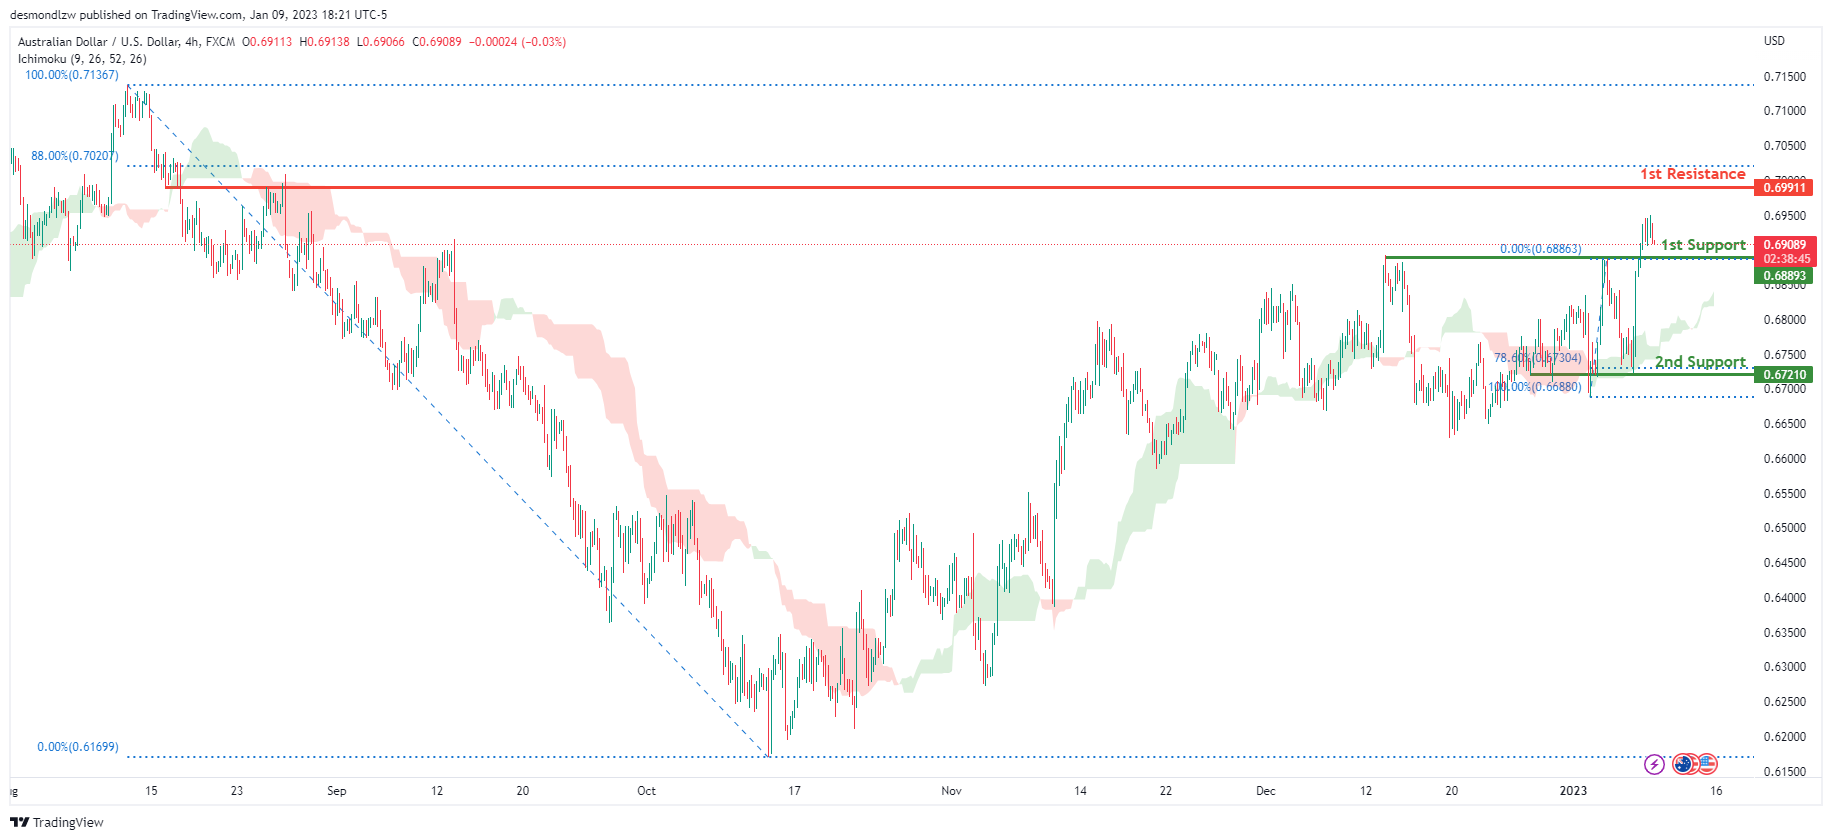
Looking at the H4 chart, my overall bias for AUDUSD is bullish due to the current price being above the Ichimoku cloud, indicating a bullish market. If this bullish momentum continues, expect the price to continue heading towards the 1st resistance at 0.69911, where the 88% Fibonacci line is. In an alternative scenario, price could possibly head back down towards the 1st support at 0.68893, where the recent swing high is
Areas of consideration
- H4, 1st resistance at 0.69911
- H4, 1st support at 0.68893
NZD/USD:
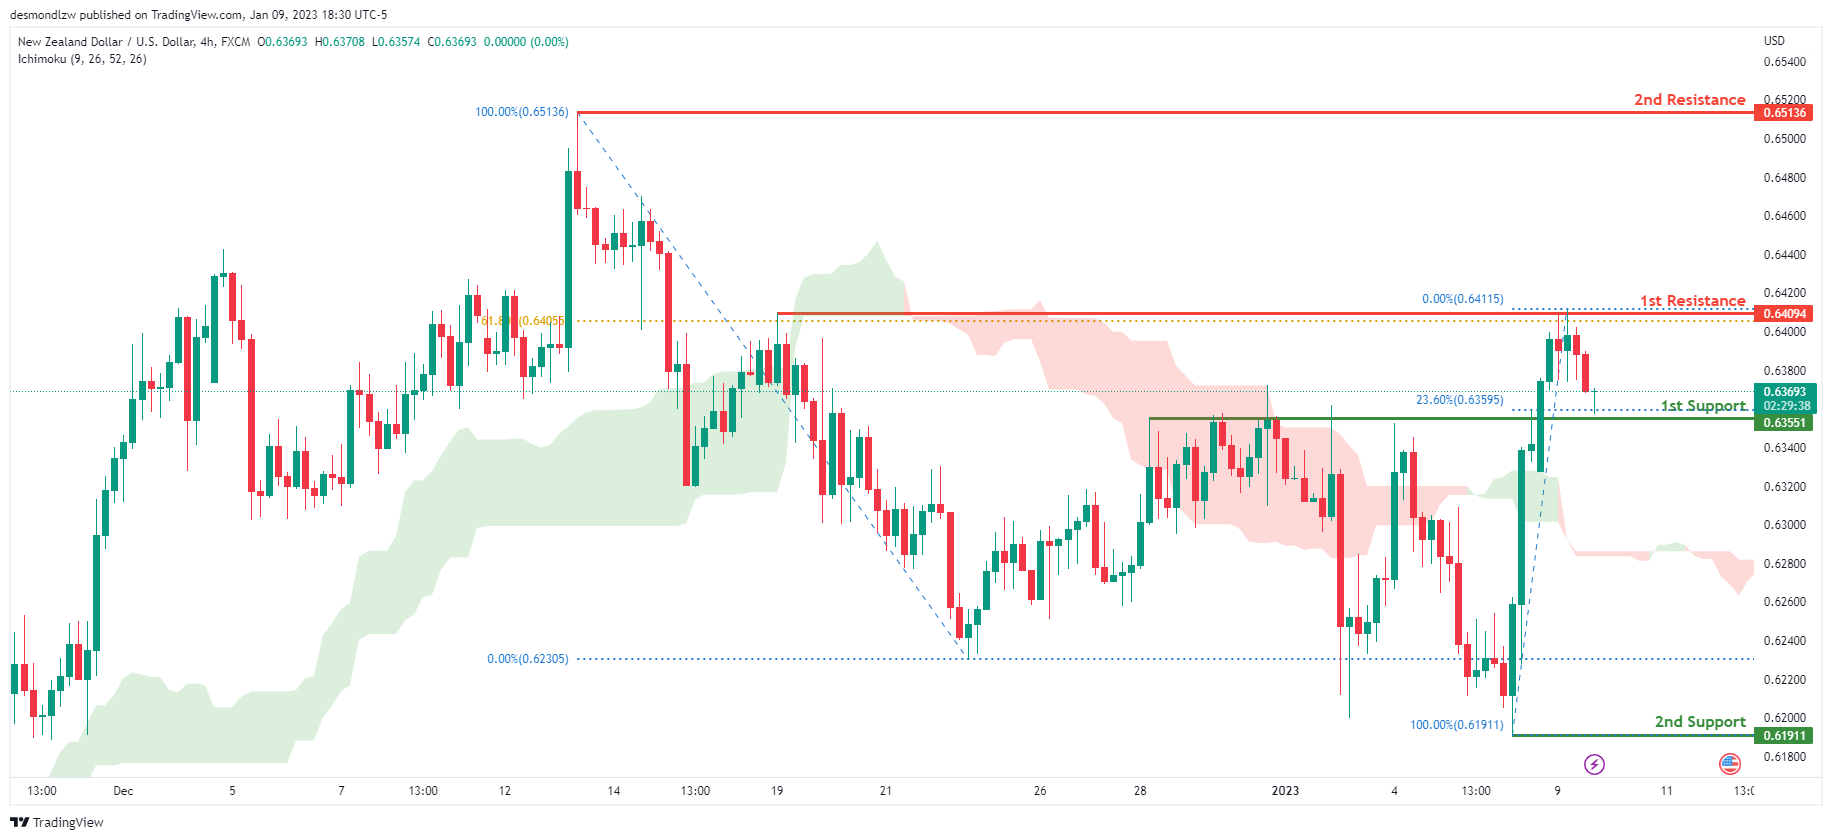
Looking at the H4 chart, my overall bias for NZDUSD is bullish due to the current price being above the Ichimoku cloud, indicating a bullish market. If this bullish momentum continues, expect price to possibly continue heading towards the 1st resistance at 0.64094, where the 61.8% Fibonacci line is. In an alternate scenario, price could possibly head back down to retest the 1st support at 0.63551, where the 23.6% Fibonacci line is
Areas of consideration:
- H4 time frame, 1st resistance at 0.64094
- H4 time frame, 1st support at 0.63551
USD/CAD:
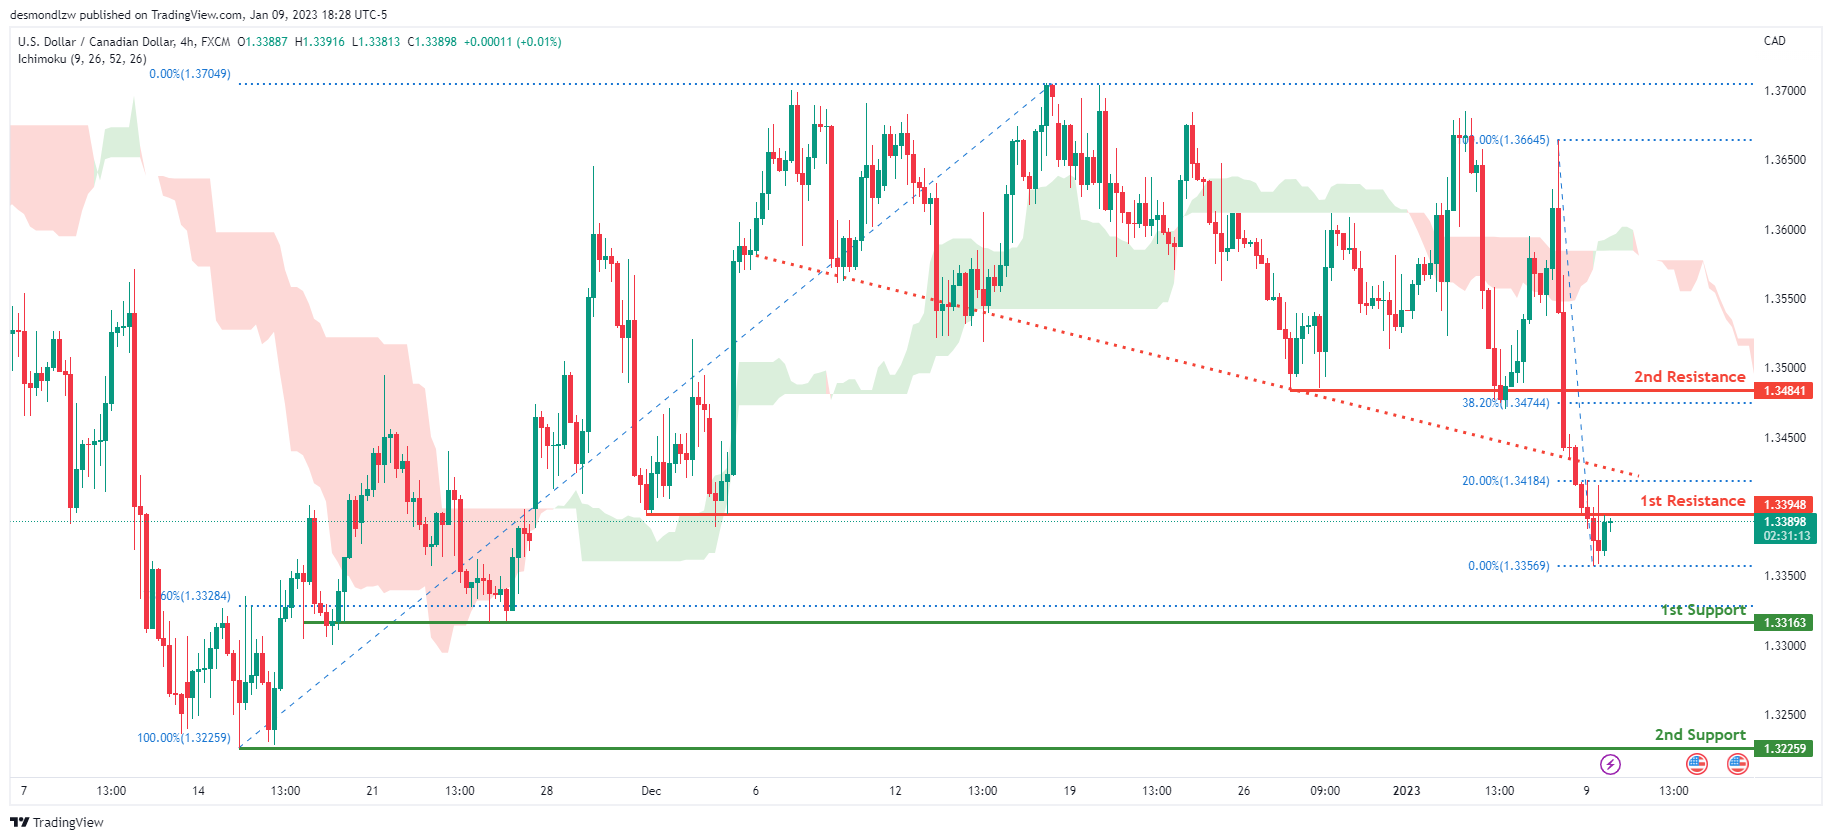
On the H4 chart, the overall bias for USDCAD is bearish. To add confluence to this, the price is below the Ichimoku cloud which indicates a bearish market. To add support to this bias, price has also broken under the descending trendline indicating strong bearish momentum. If this bearish momentum continues, expect the price to possibly head towards the 1st support at 1.33163, where the 78.6% Fibonacci line is. In an alternative scenario, price could head back up to retest the 1st resistance at 1.33948, slightly below where the 20% Fibonacci line is.
Areas of consideration:
- H4 time frame, 1st resistance at 1.33948
- H4 time frame, 1st support at 1.33163
OIL:
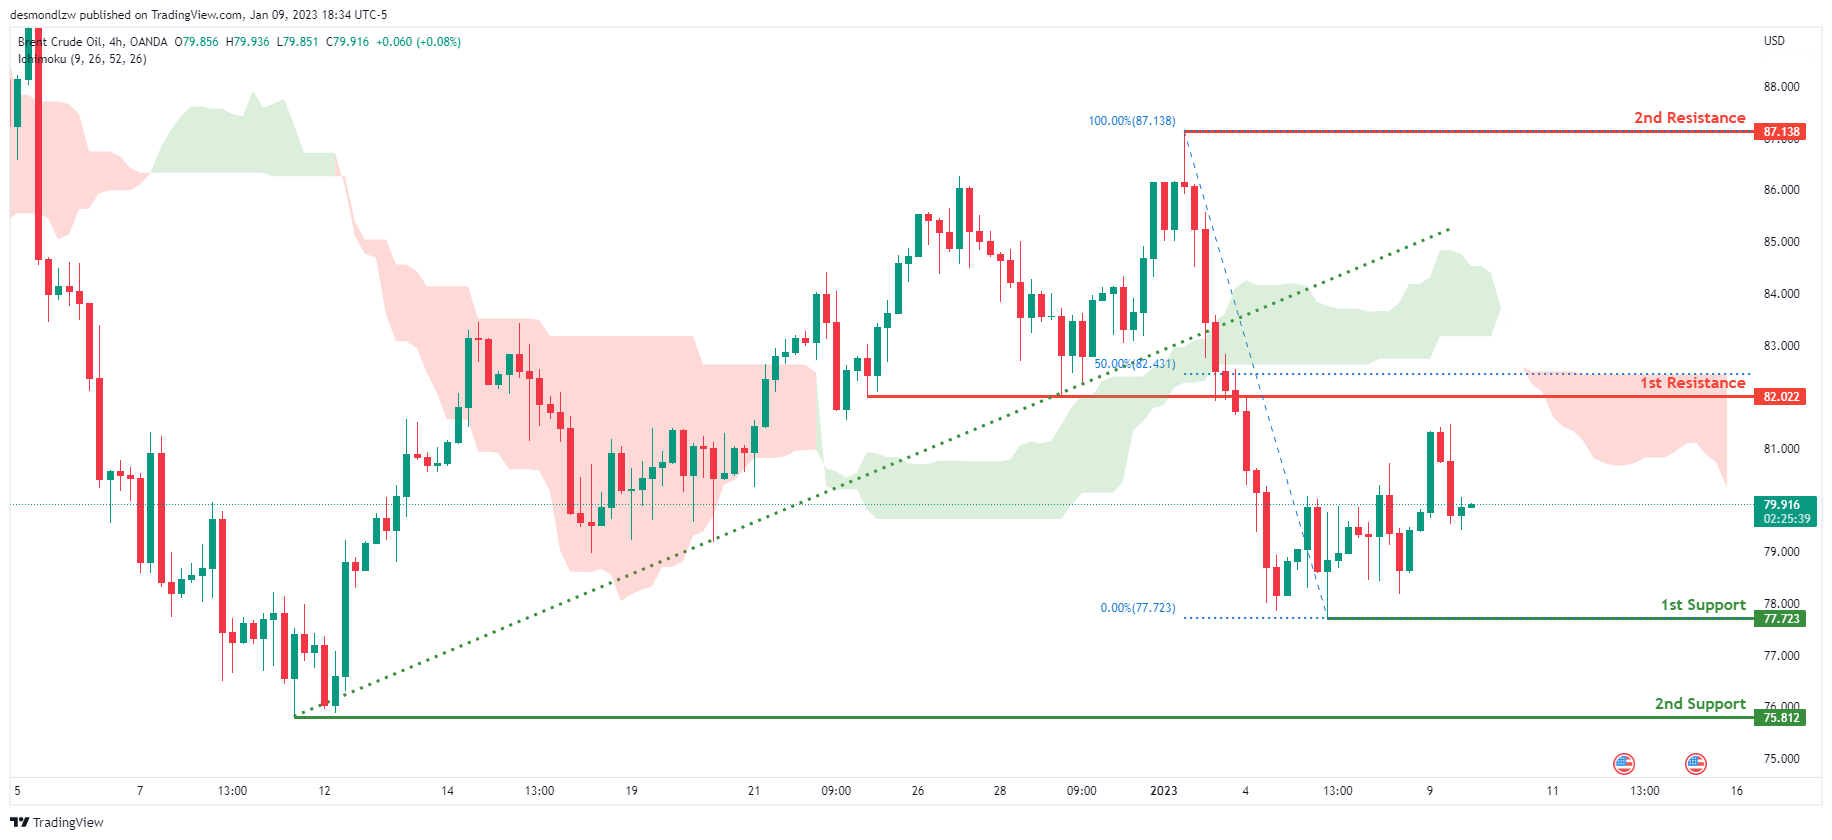
Looking at the H4 chart, my overall bias for BCOUSD is bearish due to the current price crossing below the Ichimoku cloud, indicating a bearish market. Adding more confluence to this bias, price has also broken the ascending trend line. If this bearish momentum continues, expect the price to possibly continue heading towards the 1st support at 77.723, where the recent low is. In an alternate scenario, price could possibly head back up to retest the 1st resistance at 82.022, slightly below where the 50% Fibonacci line is
Areas of consideration:
- H4 time frame, 1st resistance at 82.022
- H4 time frame, 1st support at 77.723
Dow Jones Industrial Average:
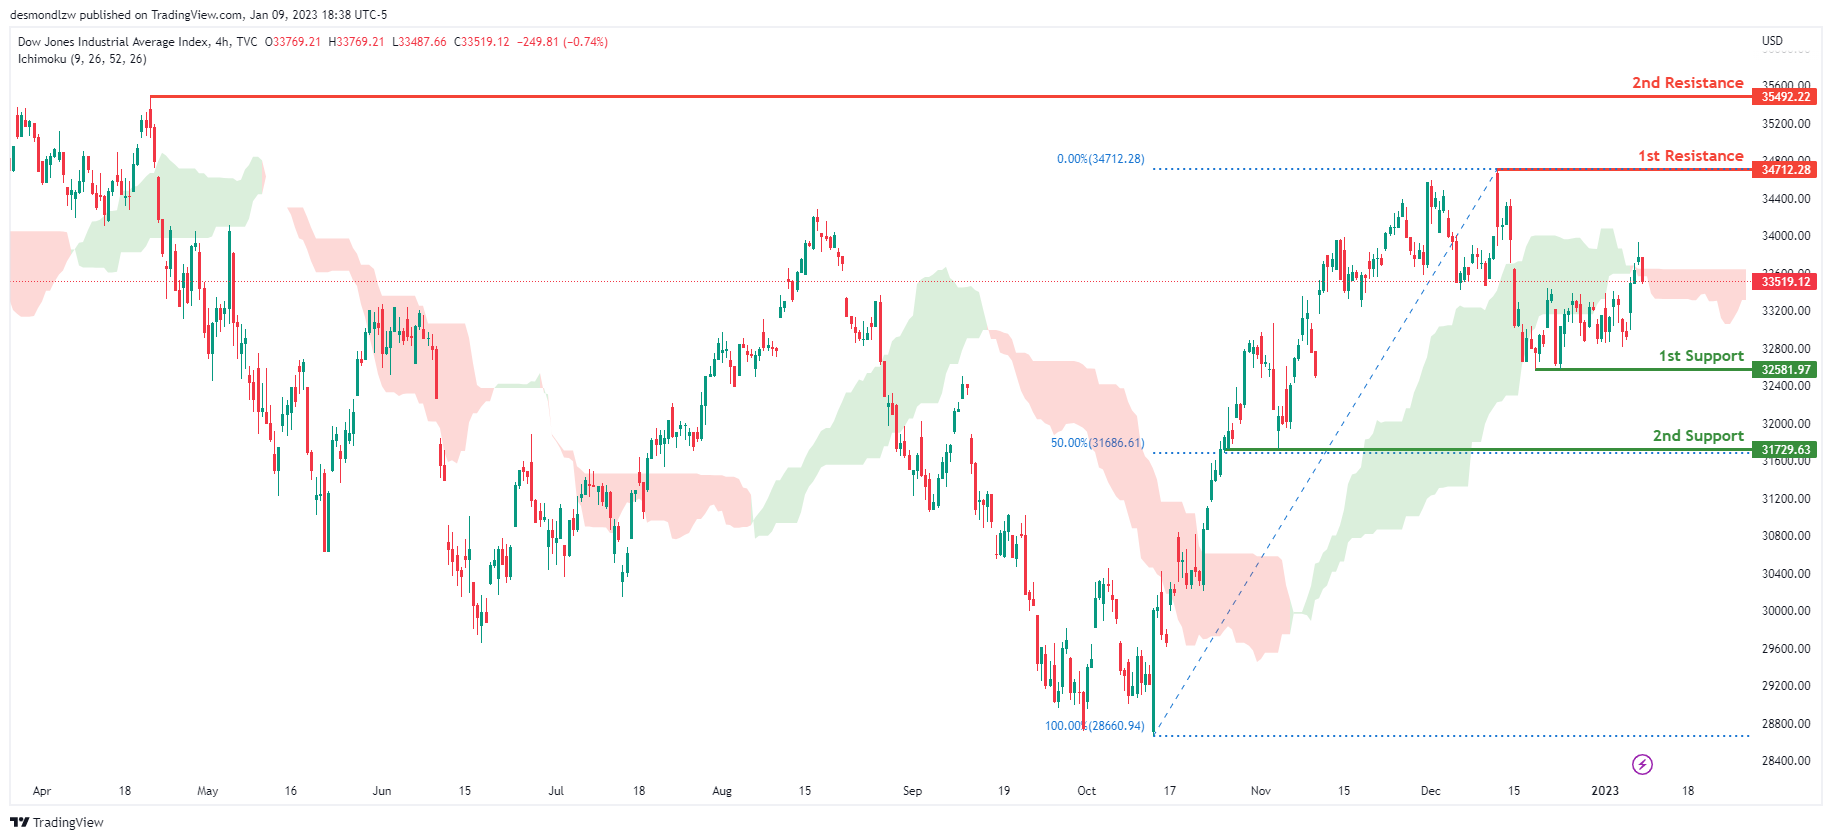
On the H4 chart, the overall bias for DJI is bearish. To add confluence to this, the price is crossing below the Ichimoku cloud which indicates a bearish market. If this bearish momentum continues, expect the price to head back down towards the 1st support at 32581.97, where the recent low is. In an alternative scenario, price could possibly continue heading towards the 1st resistance line at 34712.28, where the recent swing high is.
Areas of consideration:
- H4 time frame, 1st support at 32581.97
- H4 time frame, 1st Resistance at 34712.28
DAX:
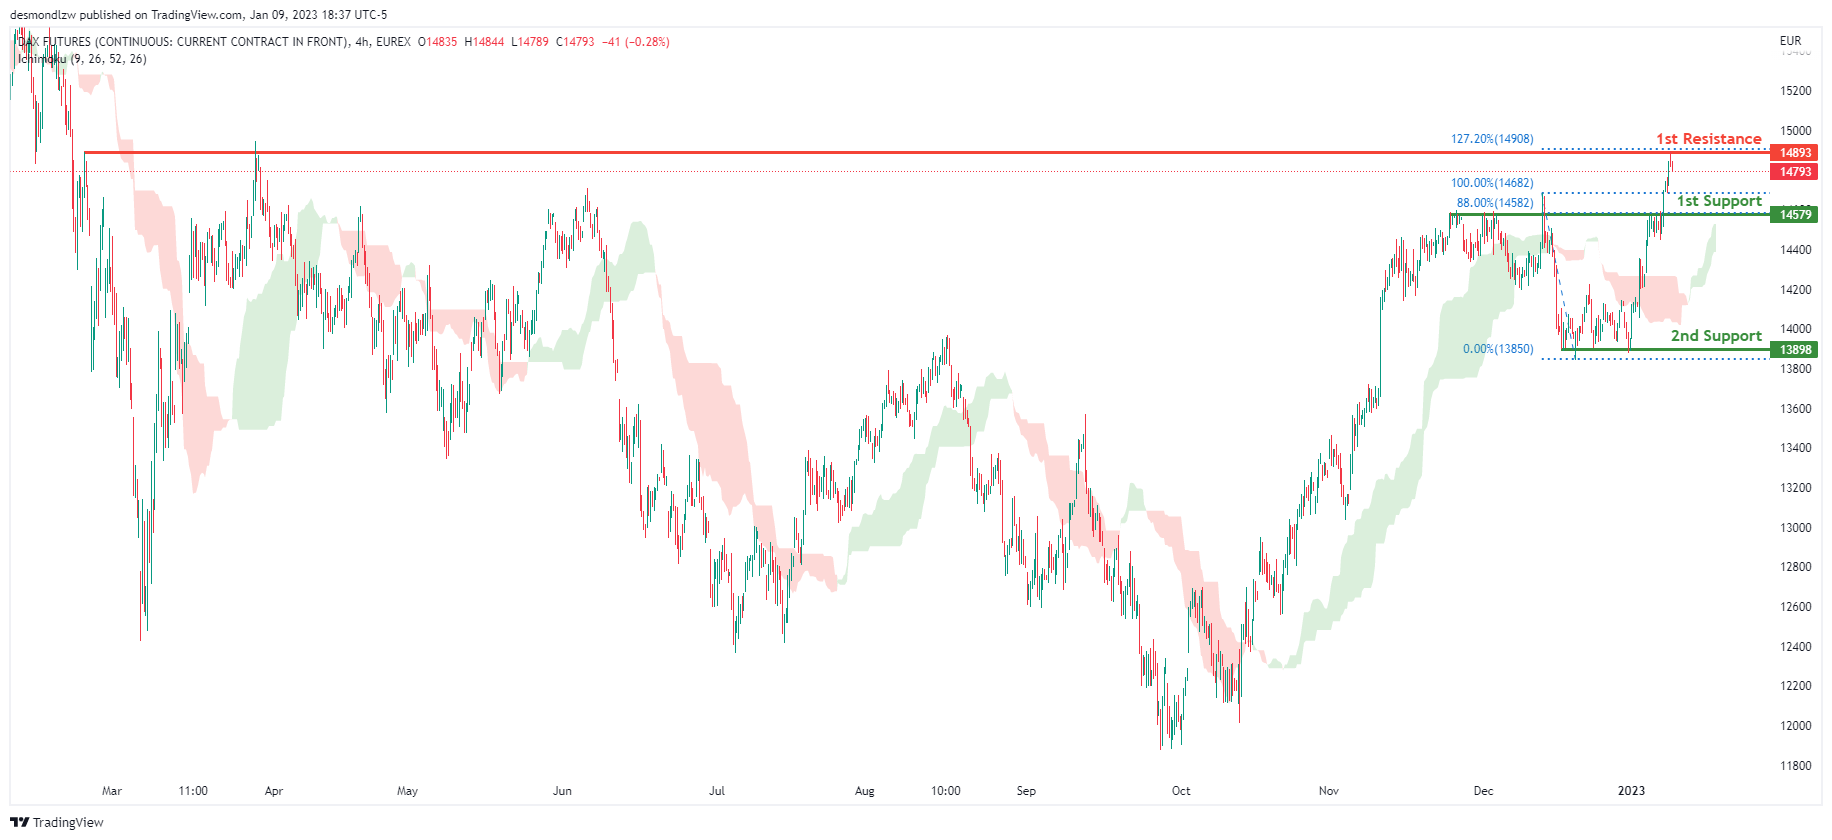
Looking at the H4 chart, my overall bias for DAX is bullish due to the current price crossing above the Ichimoku cloud, indicating a bullish market. If this bullish momentum continues, expect the price to possibly head towards the 1st resistance line at 14893, where the 127.2% Fibonacci extension line is. In an alternative scenario, price could possibly head down to retest the 1st support at 14579, where the 88% Fibonacci line is.
Areas of consideration:
- H4 time frame, 1st resistance is at 14893
- H4 time frame, 1st support is at 14579
ETHUSD:
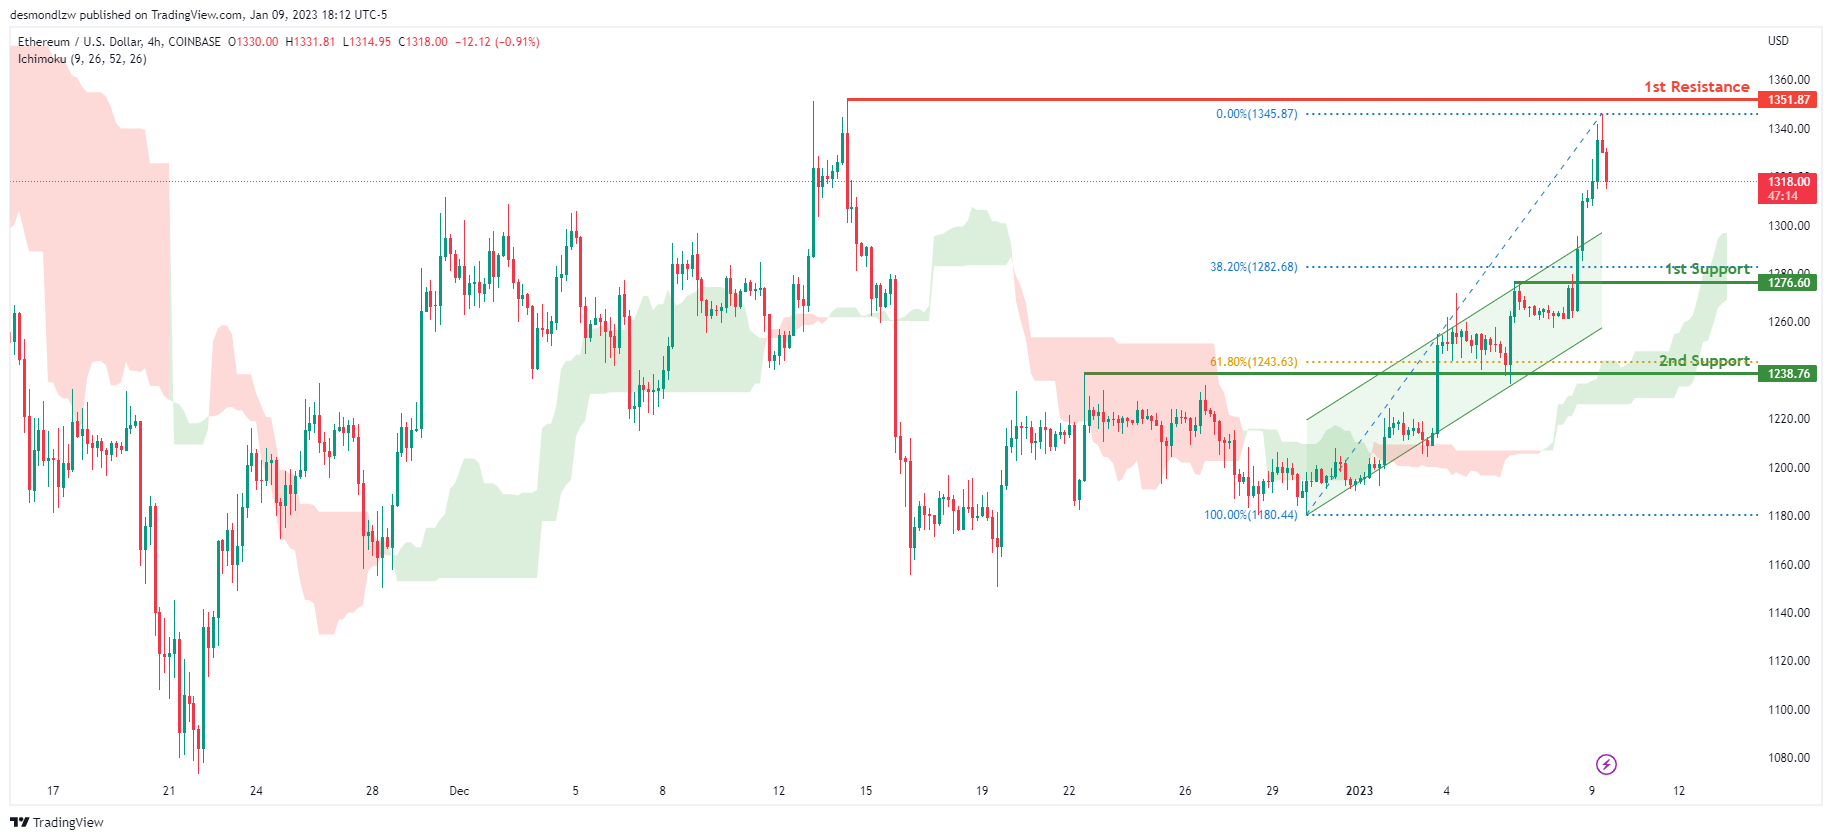
Looking at the H4 chart, my overall bias for ETHUSD is bullish due to the current price crossing above the Ichimoku cloud, indicating a bullish market. To add support to this bias, price is also broken upwards from an ascending channel. If this bullish momentum continues, expect the price to head towards the 1st resistance at 1351.87, where the previous swing high is. In an alternative scenario, price could head back down to retest the 1st support at 1276.60, where the 38.2% Fibonacci line is.
Areas of consideration:
- H4 time frame, 1st resistance of 1351.87
- H4 time frame, 1st support at 1276.60
BTCUSD:
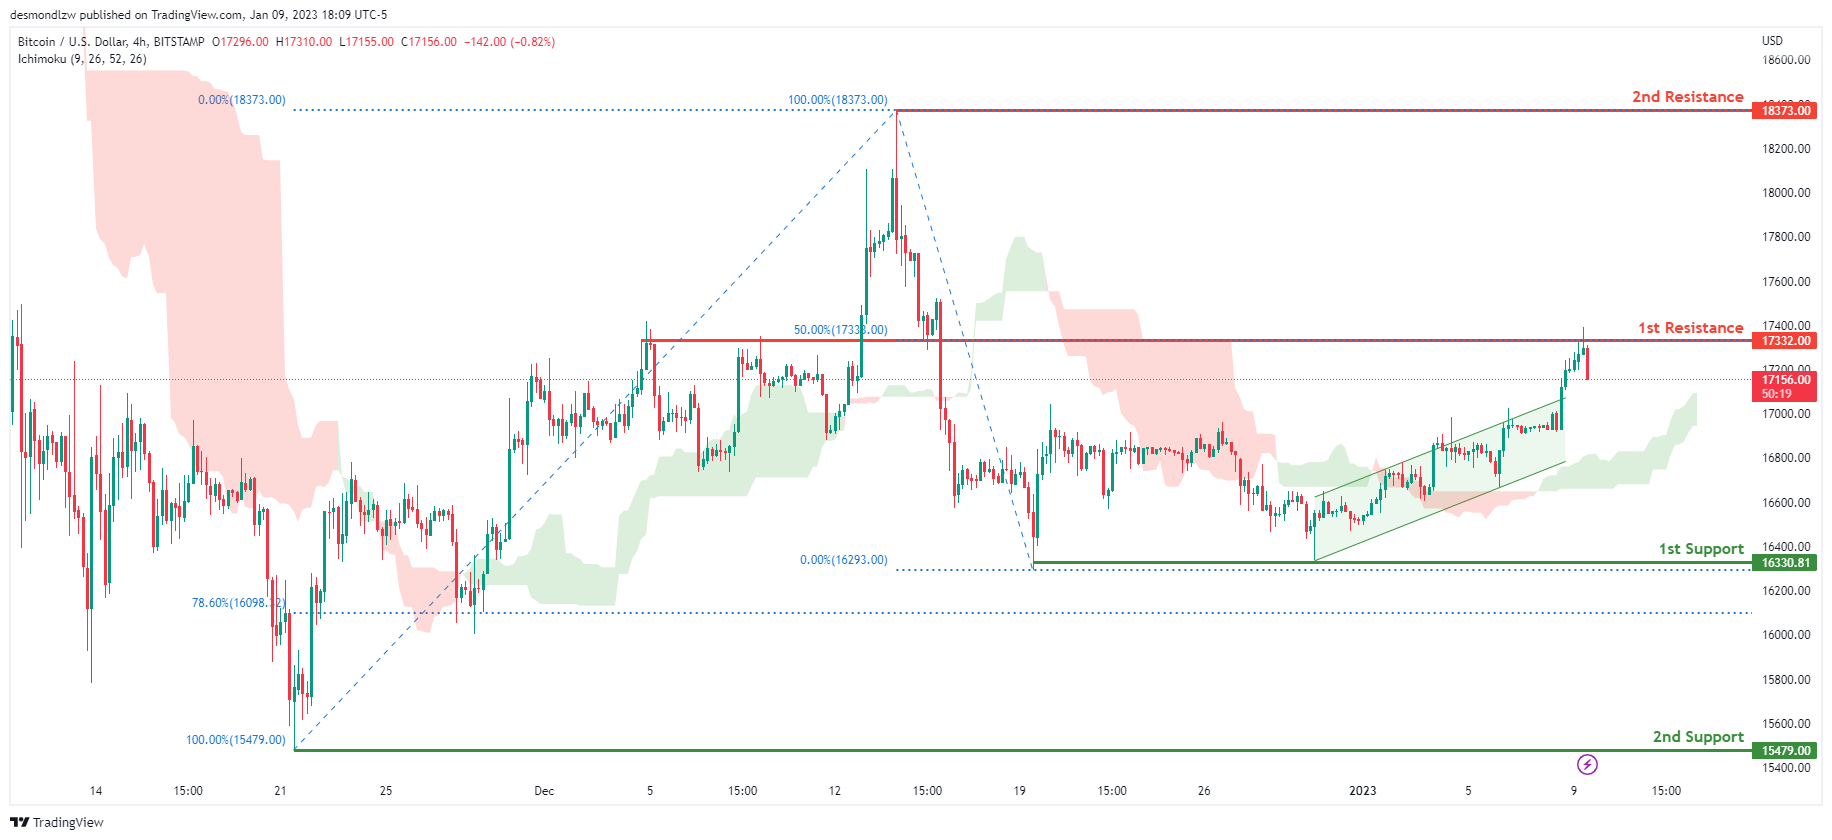
Looking at the H4 chart, my overall bias for BTCUSD is bullish due to the current price being above the Ichimoku cloud, indicating a bullish market. To add support to this bias, price is also within a bullish ascending channel. If this bullish momentum continues, expect the price to possibly continue heading towards the 1st resistance at 17332.00, where the 50% Fibonacci line is. In an alternative scenario, price could possibly head back down towards the 1st support at 16330.81, where the recent low and liquidity hotspot are.
Areas of consideration:
- H4 time frame, 1st resistance 17332.00
- H4 time frame, 1st support at 16330.81
S&P 500:
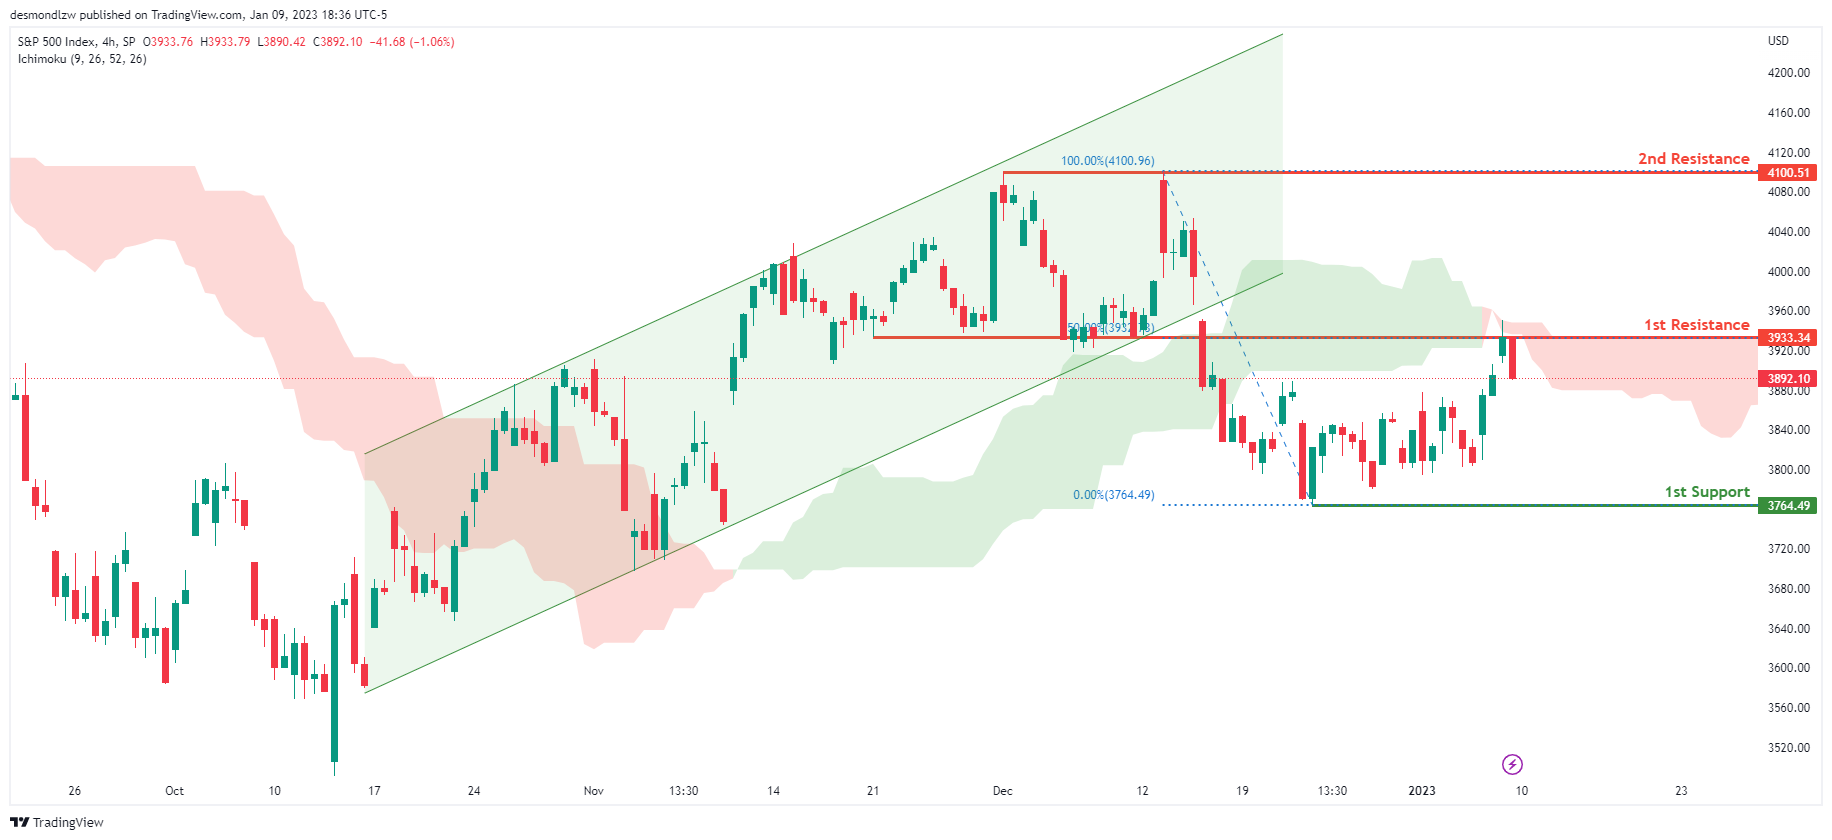
Looking at the H4 chart, my overall bias for S&P500 is bearish due to the current price being below the Ichimoku cloud, indicating a bearish market. If this bearish momentum continues, expect the price to continue heading towards the 1st support at 3764.49, where the recent low is. In an alternative scenario, price could possibly head back up to retest the 1st resistance at 3933.34, where the 50% Fibonacci line is.
Areas of consideration:
- H4 time frame, 1st support at 3764.49
- H4 time frame, 1st resistance at 3933.34