Sample Category Title
Bitcoin Price Shows Signs of Important Reversal
Key Highlights
- Bitcoin price started a fresh increase above the $16,750 resistance.
- It broke a major bearish trend line at $16,760 on the 4-hours chart.
- Gold price is gaining pace above the $1,870 resistance.
- Crude oil price is facing a major hurdle near $77 and $78.
Bitcoin Price Technical Analysis
Bitcoin price formed a base and started a fresh increase above $16,550 resistance. BTC/USD surpassed key hurdles near $16,750 to move into a short-term positive zone.
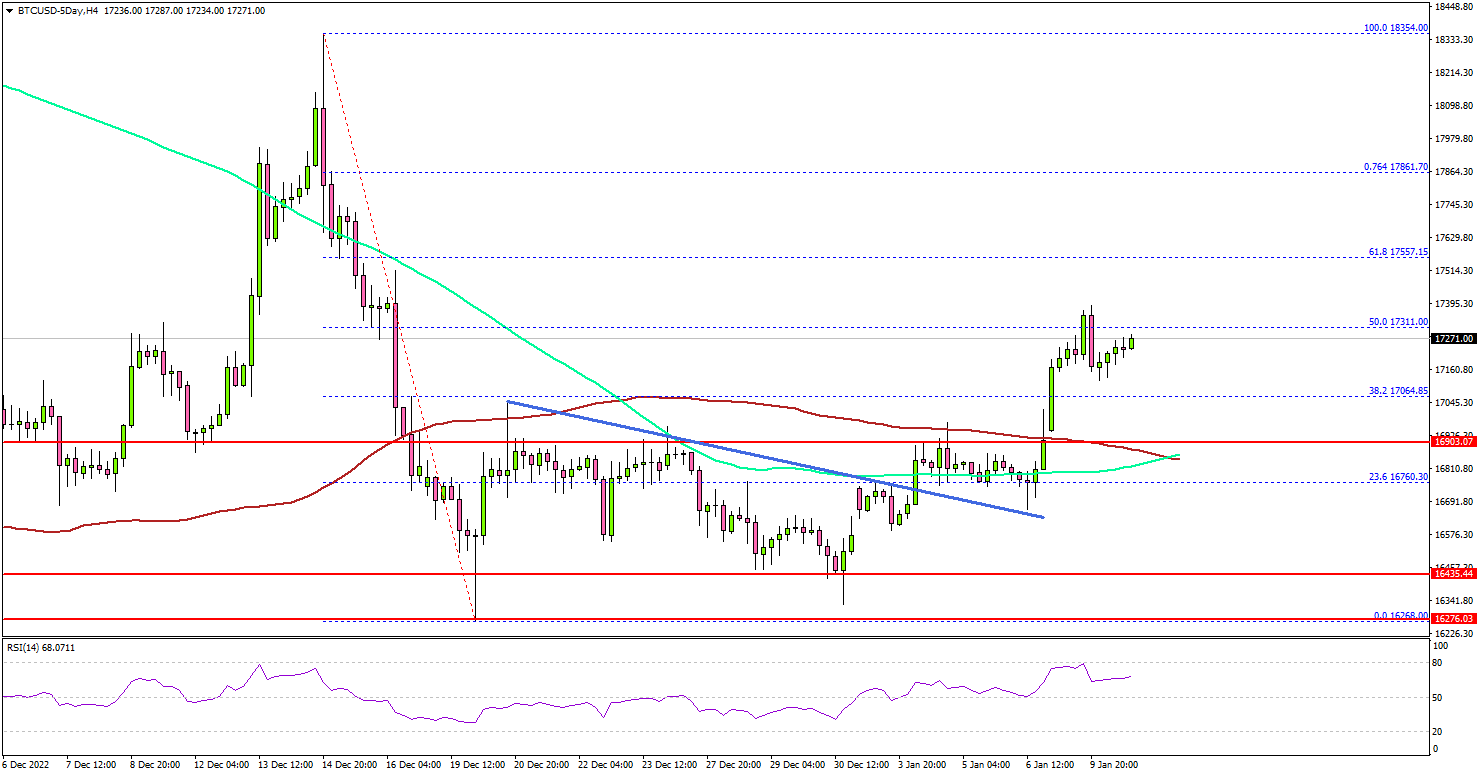
Looking at the 4-hours chart, the price traded above the $16,800 resistance, the 200 simple moving average (green, 4-hours), and the 100 simple moving average (red, 4-hours).
There was a clear move above a major bearish trend line at $16,760 on the same chart. Bitcoin price also spiked above the 50% Fib retracement level of the key decline from the $18,354 swing high to $16,268 low.
If the price climbs higher above the $17,400 ad $17,500 resistance levels, the price could rise further. The next resistance sits near the $17,860 zone. It is close to the 76.4% Fib retracement level of the key decline from the $18,354 swing high to $16,268 low.
A close above the $17,860 level may perhaps start another steady increase in the coming days. In the stated case, the price could rise towards the $18,350 level. Any more gains could set the pace for a move towards the $19,000 level.
On the downside, an initial support sits near the $17,000 level. The main breakdown support sits near the $16,800 zone and the 100 simple moving average (red, 4-hours).
If there is a downside break and close below $16,800, bitcoin might start another major decline in the coming days. In the stated case, it could revisit the $16,000 support or even test $15,650.
Economic Releases
- EIA Crude Oil Stocks Change – Forecast -2.375M, versus 1.694M previous.
Australian Monthly CPI Indicator
The Monthly CPI Indicator rose 7.3% in the year to November splitting Westpac’s 7.4%yr forecast and the market’s 7.2%yr.
The most significant contributors to the annual rise in November were housing (+9.6%yr), food & non-alcoholic beverages (+9.4%yr), transport (+9.0%yr), furniture, household equipment & services (+8.4%yr) and recreation & culture (+5.8%yr). In the month the CPI indicator gained 0.8% compared to our forecast for 0.9%.
The annual pace of the Trimmed Mean CPI Indicator lifted from 5.4%yr to 5.6%yr.
Given how close our forecast for the monthly increase we doubt this update will have a significant impact on our current forecasts for a 1.6%qtr/7.5%yr for the CPI and 1.7%qtr/6.7%yr for the Trimmed Mean.
We are processing the Monthly CPI Indicator data to incorporate it into a complete Q4 CPI preview. As this will included our estimate for December Monthly CPI Indicator it could result in some small revisions to our forecasts.
EURJPY Wave Analysis
- EURJPY reversed from support level 138.00
- Likely to rise to resistance level 142.80
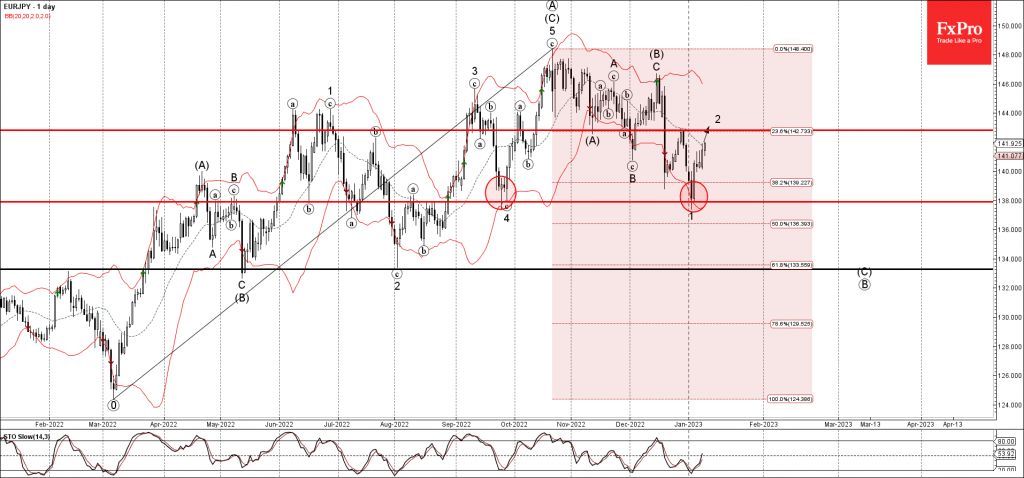
EURJPY currency pair recently reversed up with the daily Bullish Engulfing from the key support level 138.00 (which also stopped the previous correction 4 at the end of September), intersecting with the daily lower Bollinger Band.
The pair is currently rising inside the minor correction 2, which belongs to wave (C) from the middle of December.
EURJPY currency pair can be expected to rise further toward the next resistance level 142.80 (previous minor resistance from December and the target for the completion of the active wave 2).
The Glittering Rise of Gold
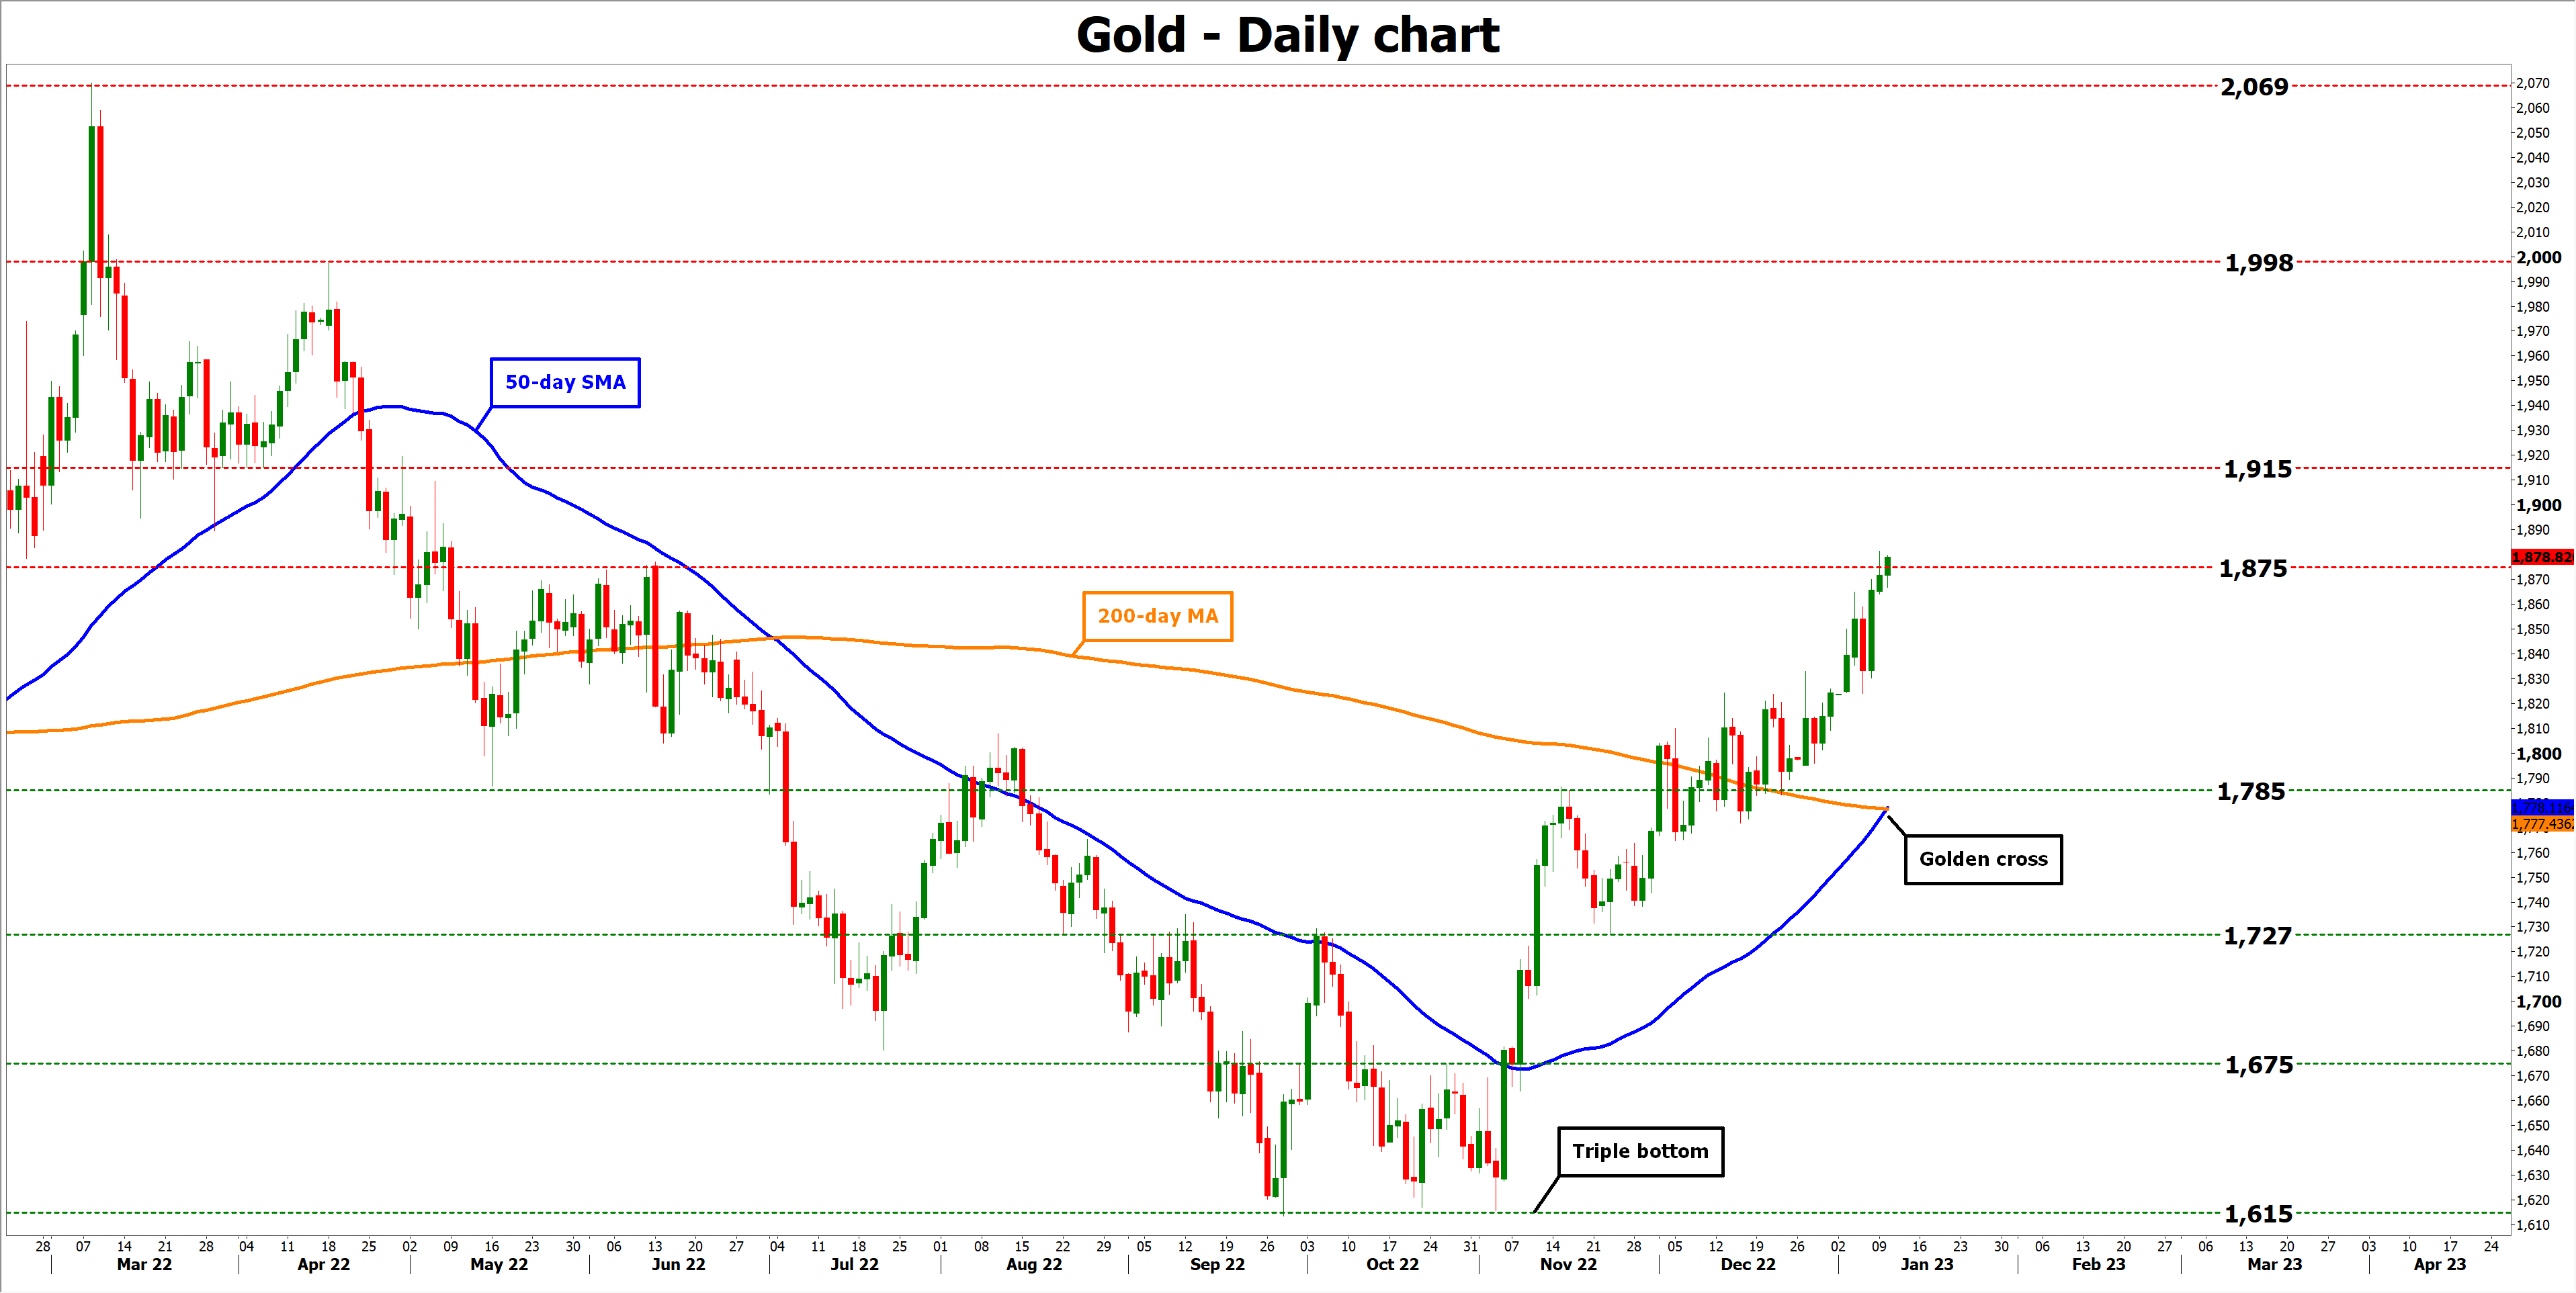
Gold is trading at $1875 per troy ounce – near the highs since last May. Having pushed back from the bottom in early November, the price has rallied by more than 15%, above $260, and so far, probably has yet to exhaust the upside momentum.
Three touches of $1617 between the end of September and the beginning of November formed a firm bottom, from which gold pushed off two months ago. The momentum of gold’s rise started later but was more resilient than the dollar’s decline against its major competitors and did not compare with the stumbling increase in the major US stock indices.
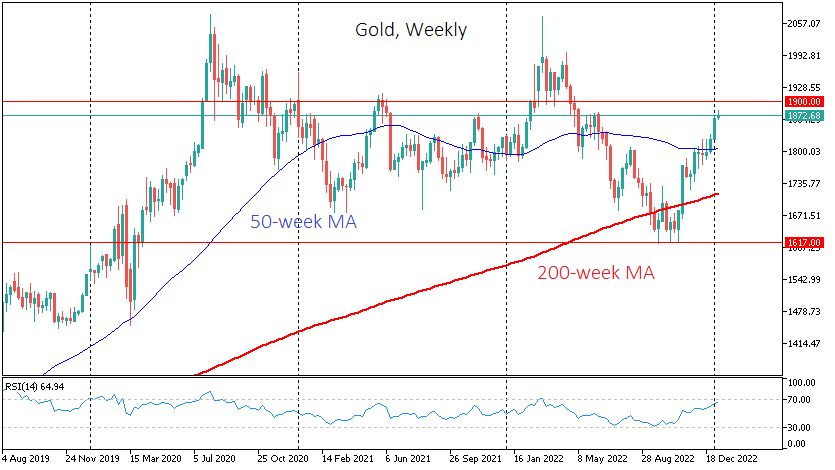
On the weekly charts, the RSI has moved out of the oversold area but still needs to enter the overbought zone. On the daily chart, gold also manages to avoid being overbought due to short-term local pullbacks. Often this kind of market dynamic is observed when investors form long-term positions rather than when they succumb to short-term impulsive ideas.
There is also a new bullish signal of change in the long-term trend, the “golden cross”, which is formed on the daily charts. A bullish signal is created when the 50-day moving average crosses the 200-day moving average upwards, reflecting a long-term trend reversal. Additionally, this signal is strengthened by the price above these averages, promising to form a golden cross as early as this week.
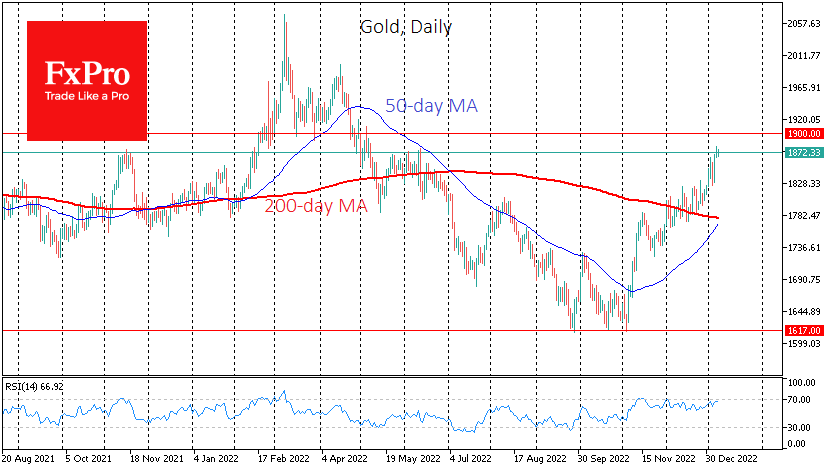
Gold is well-positioned on the cross of the 50- and 200-day averages. In July, for example, the “death cross” (the 50-day MA falling below the 200-day MA) initiated a 7% sell-off in the following three weeks. And the formation of the golden cross in February 2022 was followed by an almost 15% rally in the following two and a half weeks, which was the second test of the historic highs above $2070.
This time, the rally looks stretched, so we see the short-term potential for the gold price to rise to the $1900-1910 area before the bulls might need to recharge.
Longer term, the rise of gold is unlikely to stop above $1900. We shall expect another test of the historical highs of $2070 before the end of 2023; this time, it will be successful. The main reasons for such optimism are growing investor doubts about the stability of the major reserve currencies due to the high debt burden and speculation that central bankers will allow inflation to remain slightly above target despite current assurances.
Gold Goes on a Winning Streak, Can It Rise Further in 2023?
Gold prices started the year with a powerful rally, capitalizing on hopes that the Fed is approaching the end of its tightening cycle. Looking into 2023, the prospects for the yellow metal seem bright in a macroeconomic environment characterized by heightened recession fears. The main downside risk is probably a resolution to the Ukraine war, which does not seem imminent.
Dissecting gold's comeback
The world's oldest safe-haven closed 2022 essentially flat, staging a late rally to recover most of the losses it suffered earlier in the year. This advance has extended into the new year, propelling the precious metal to multi-month highs with a little help from macroeconomic developments.
Chief among those was speculation that the Fed is almost done with rate increases. With inflation grinding lower and US business surveys pointing to a sharp slowdown in economic growth, perhaps even a recession later this year, the dollar has lost its shine and Treasury yields have edged lower.
Any moves in the dollar and yields are crucial for gold prices. This is because gold is priced in dollars, so when the currency depreciates, it becomes cheaper for investors using foreign currencies to buy the metal. Similarly, since gold pays no interest to hold, it becomes more attractive by comparison as yields on government bonds edge lower.
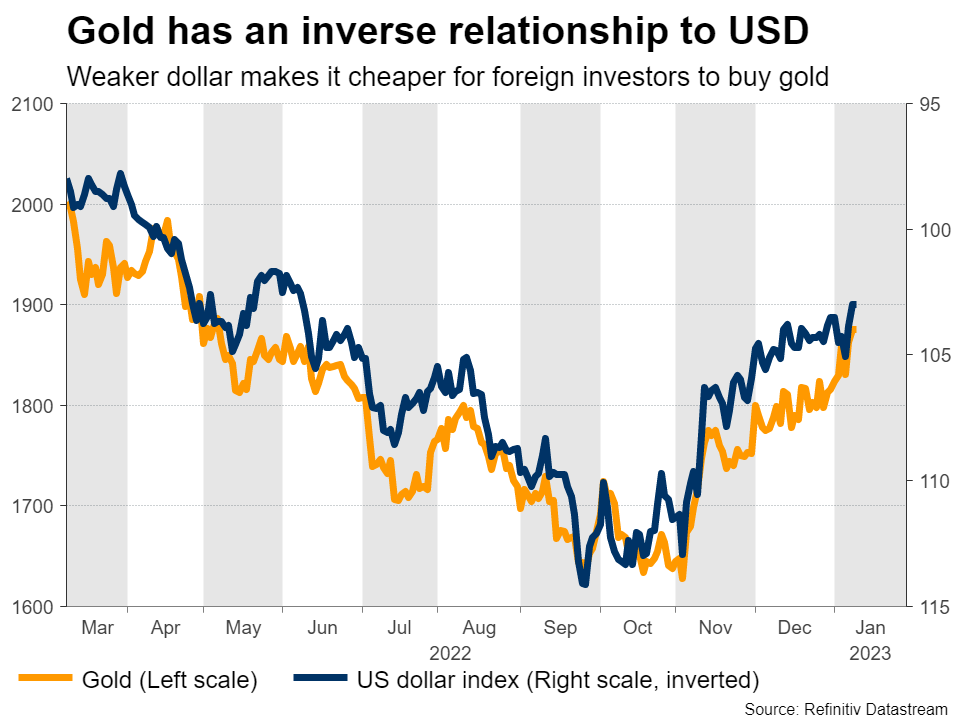
In other words, the expectation that the US economy is losing power was the main catalyst behind gold's surge, as that implies a more cautious Fed profile. Market pricing currently suggests the central bank will roll out its final rate increase by March, before cutting rates towards the end of the year.
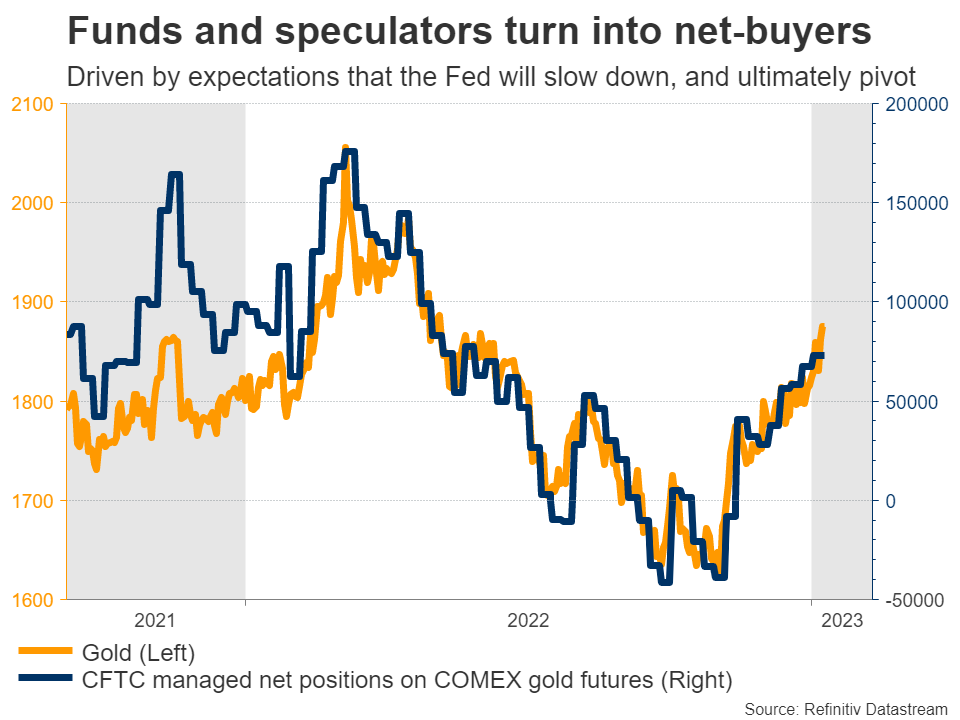
This was the driving force for speculators to enter long positions again, but it wasn't the only catalyst pushing gold higher. Other important buyers were central banks, which loaded up on bullion at a historic pace. Although data on central bank reserves is not published immediately, it seems that China and Turkey accumulated quite a lot last year.
There are also some seasonal factors at play. The months around the turn of the year - November, December, and January - are usually the strongest for gold prices. Several explanations exist for this phenomenon, ranging from holiday demand for jewelry to portfolio rebalancing around year-end.
Last but not least, flows coming out of crypto might have helped gold demand. There is some overlap between crypto and gold investors - money flowing into crypto was often cited as a reason for gold's underperformance after the pandemic. But with crypto prices crashing, this process might have gone into reverse, directing money back towards gold.
The outlook in 2023
Looking into this year, the prospects for bullion seem favorable. Inflation has started to cool across the world, which suggests that central banks are in the final chapter of their tightening cycles. The market is looking ahead to lower rates next year, and is potentially front-running this theme.
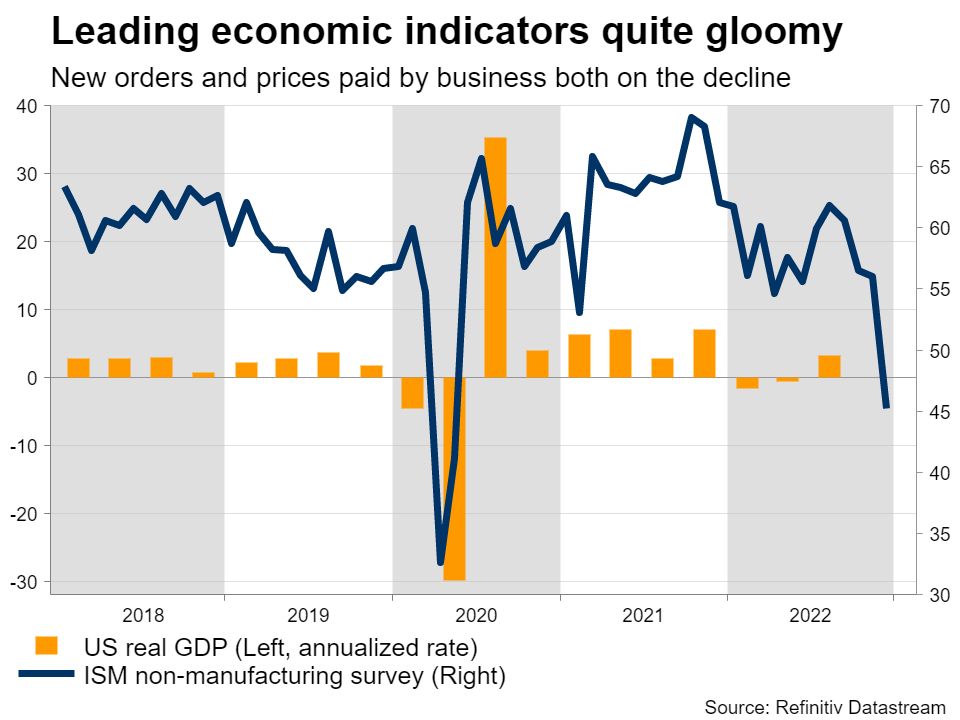
With most forward-looking economic indicators deteriorating sharply, recession risks have also started to intensify. The European Commission and the Bank of England already expect a recession in their respective economies, while even the Fed admitted in its latest minutes that a recession has become a 'plausible alternative'.
This outcome would imply greater demand for gold through the safe-haven channel, and it would also make central banks more likely to cut rates. If the US dollar softens in the process, it would be a trifecta for bullion. The chart is quite bullish too, with gold putting in a triple bottom last quarter, although a decisive move above the $1,875 region is required to boost momentum.
Central bank purchases could be another persistent theme. After the invasion of Ukraine, the dollars and euros that Russia held as FX reserves were frozen by America and the European Union, leaving gold as its primary reserve. This might be the reason why China has started to diversify and accumulate gold - to make sure it won't suffer the same fate.
Downside risks
While the macroeconomic picture seems favorable, gold prices have already come a long way, rising by 16% from their lows last quarter. The chart seems overextended at this stage, so a short-term pullback wouldn't be surprising.
Of course, there are fundamental risks for gold prices too. For instance, if inflation remains stubbornly high, that could lead the Fed to raise rates even higher and also diminish the prospect of rate cuts later this year. In turn, that could resurrect the dollar and yields, dealing a heavy blow to gold prices.
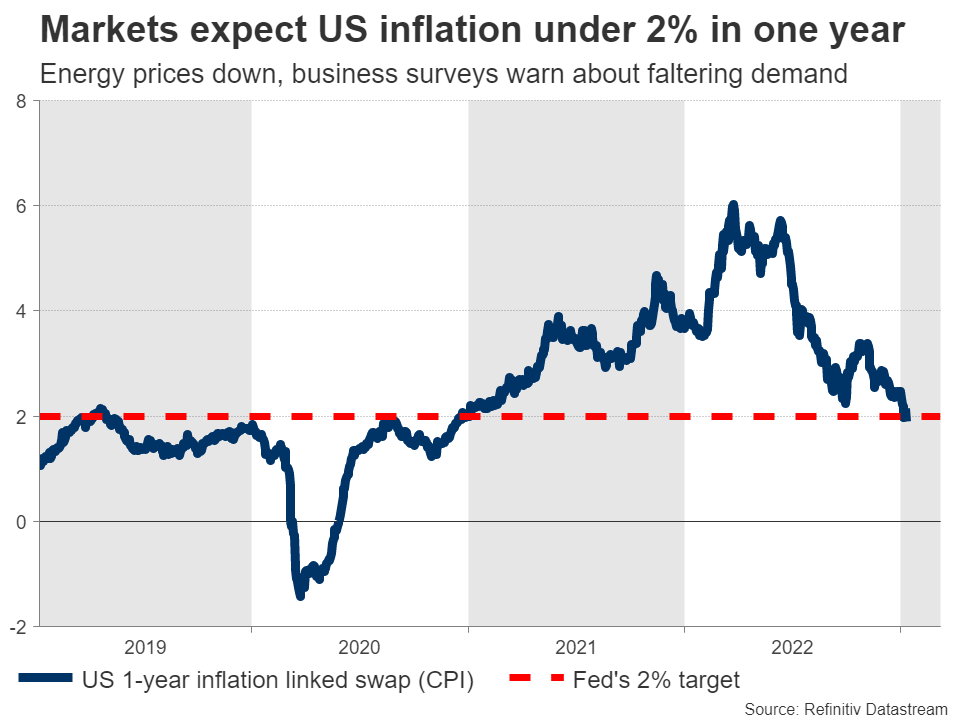
That said, this seems like a lower-probability scenario. Inflation swaps suggest that US CPI will be running under 2% in one year's time, something corroborated by the decline in energy prices, the trends in house prices, and the gloomy signals in business surveys.
This leaves a resolution to the conflict in Ukraine as the main downside risk for bullion. Any signs that peace talks might begin could crush safe-haven demand, although that doesn't seem imminent either. The two sides are too far apart on their red lines, while the United States and Europe are still sending Ukraine advanced weapons, alongside financial aid.
Therefore, a diplomatic solution is unlikely for now. Instead, the path for gold might depend mostly on how quickly inflation subsides, whether there is a recession, and how central banks deal with that.
Sunset Market Commentary
Markets
The decline in US bond yields following Friday’s soft US wage data and services ISM is gradually petering out. Still, markets stay highly sceptic on the Fed’s mantra that rates will (have to) be raised to 5%+ and stay there for some time. That said, technical support levels in the US 2-y (4.13% area vs .4.24% currently) and 10-y yield (3.40% vs 3.58% currently) for now continue to provide downside protection. There were again few data releases in EMU and the US today. The only one really worth mentioning, the US NFIB small business confidence, dropped sharply from 91.9 to 89.8. Small business owners turn ever more uncertain as poorer business conditions are eroding profits. Price prices are easing. The recessionary narrative this time didn’t trigger further yield declines. US yields currently are rebounding between 5 bps (30-y) and 3 bps (5-y). At a Riksbank conference on central bank independence, Fed Powell in general said that the Fed as an independent central bank can take necessary/unpopular measures to slow growth, but he didn’t elaborate on current policy. Later today, the US Treasury will start is monthly refinancing with a $40 bn sale of 3-y Notes. German Bunds again slightly underperform Treasuries with yields rising between 6 bps (5-y & 10-y) and 4 bps (2-y). At the same Riksbank conference, ECB Schnabel said that ‘interest rates will have to rise significantly at a steady pace to reach levels that are sufficiently restrictive to ensure a timely return of inflation to our 2% medium-term target’. Intra-EMU 10-y government bond spreads narrowed marginally today, with Greece outperforming (-4bps). The Kingdom of Belgium placed € 7bn of a 10-y (June 2033) bond priced at MS + 10 bps, with books reported above € 51 bn. The Brent oil price gains marginally, trading near $80/b. Equities mostly suffer modest losses (EuroStoxx -0.3%, S&P little changed).
On FX markets, the dollar stays in the defensive, even as risk sentiment turns less positive. EUR/USD (1.074) is testing the 1.0735/87 resistance area, with 1.0912 marking 50% retracement from the decline between early 2020 and the correction low end September last year. However, the move probably also contains a pinch of underlying euro strength. The trade-weighted DXY index, after touching a new correction low below 103 yesterday, is still struggling not the fall below this big figure. USD/JPY is going nowhere (132 area). A more cautious global sentiment and markets pondering the BoE’s reaction function in case of a recessionary scenario (softer comments from economist Pill yesterday) is again pushing EUR/GBP (0.884) closer to the 0.8867/77 resistance.
News Headlines
After hitting a peak of 7.5% in October last year, Norwegian headline inflation continued to abate in December. Price pressures decelerated from 6.5% to 5.9% (0.1% m/m), less than the 6.1% (0.3% m/m) expected. An underlying gauge excluding tax changes and energy unexpectedly rose though, from 5.7% to 5.8%. That’s just one tenth of a percentage below the series high of 5.90%, underscoring the stickiness of core inflation. It also took the Norges Bank by surprise, which had penciled in no change of core inflation for last month. However, it’s unlikely to dramatically change the central bank’s assessment that one more 25 bps rate hike to 3% (on January 19) will suffice to bring inflation back to target as the economy cools down. The Norwegian krone reacted stoic on the release. EUR/NOK is trending marginally higher towards 10.68 in a technically insignificant move.
Hungary’s Finance Ministry State Secretary Toth is optimistic that the government by the end of June can unlock billions of euro funds blocked by the Commission until several milestones regarding the rule of law set by the EU are met. At the same time he added that the country is in a very relaxed situation with respect to the need of FX. Hungary sold a combined $4.25bn in dollar bonds (5y, 10y and 30y) last week, taking advantage of a global bond rally that pushed yields lower since the start of the year. Bids exceeded $12bn. Central-European sentiment improving was also visible in the forint with EUR/HUF depreciating to the lowest levels since September last year. The pair today does nudge higher though stays sub 400. Poland’s head of public debt department at the Finance Ministry today said that the country also plans to be present in euro and dollar bond markets this year, seeking to broaden the investor base.
World Bank downgrades global growth forecast sharply to 1.7% in 2023
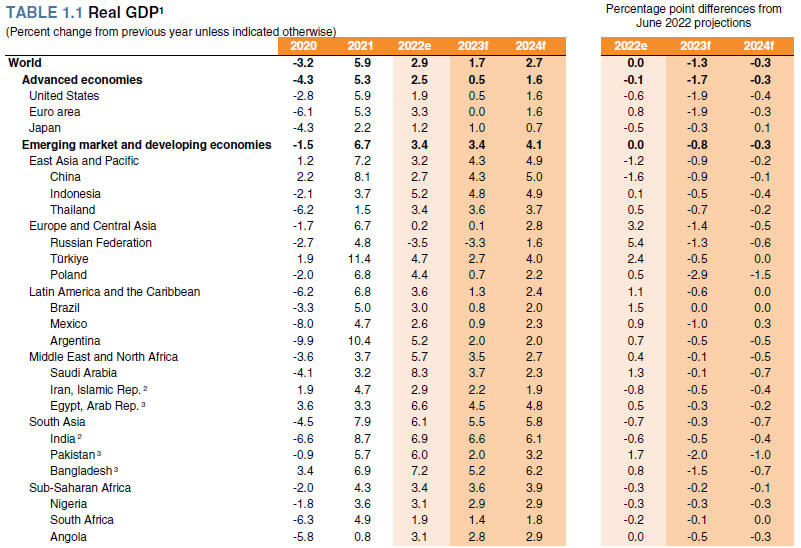
The World Bank lowered global growth forecast to 1.7% in the latest Global Economic Prospects report, down sharply from 3.0% expected six months ago. It said, "Global growth is slowing sharply in the face of elevated inflation, higher interest rates, reduced investment, and disruptions caused by Russia's invasion of Ukraine."
2023 GDP growth:
- World: 1.7%, downgraded by -1.3%.
- US: 0.5%, downgraded by -1.9%.
- Eurozone: 0.0%, downgraded by -1.9%.
- Japan: 1.0%, downgraded by -0.3%.
- China: 4.3%, downgraded by -0.9%.
2024 GDP growth:
- World: 2.7%, downgraded by -0.3%.
- US: 1.6%, downgraded by -0.4%.
- Eurozone: 1.6%, downgraded by -0.4%.
- Japan: 0.7%, upgraded by 0.1%.
- China: 5.0%, downgraded by -0.1%.
Will Wounded Dollar Take Another Hit from US Inflation Data?
The US dollar tried to stage a comeback during the first few days of 2023, but any attempts to conquer higher areas proved abortive as disappointing wage growth on Friday added credence to investors’ view that the Fed may indeed need to slow further its rate increases and eventually consider reversing some of its hikes at some point later this year. Will Thursday’s inflation numbers validate or dismiss that belief?
Investors don’t believe the Fed
After pushing the triple-hike button four times in a row, Fed officials decided to proceed with a smaller 50bps increment at the December meeting. That said, they still appeared in their hawkish suits, signaling that interest rates may rise to above 5%, while at the press conference, Fed Chair Powell tried to push back against pivot expectations.
Even in the aftermath of that gathering, the Fed chief and most of his colleagues have been adamantly sticking to their guns. Some of the most recent remarks come from Minneapolis Fed President Neel Kashkari, who saw interest rates peaking at 5.4%, and from Atlanta Fed President Raphael Bostic, who favored raising rates above 5% by early in the second quarter and then staying on hold for “a long time”.
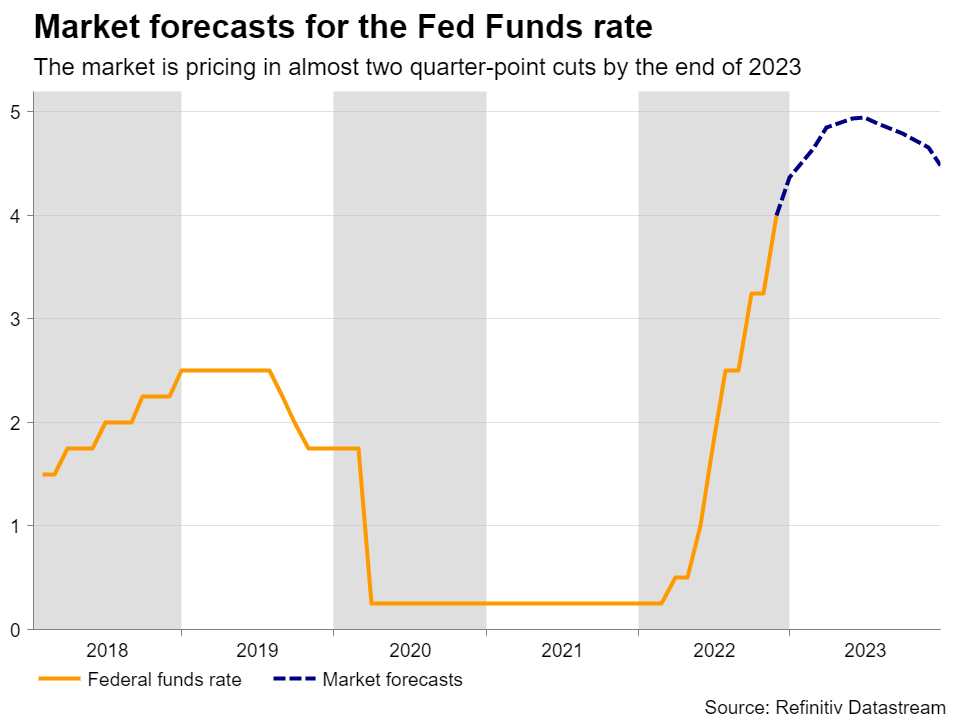
And yet, market participants remained unconvinced that the Fed could outpace their expectations. They are currently expecting the Fed to slow further at its upcoming gathering and deliver a 25bps hike, while they see rates peaking at 4.95% in June. More importantly, they are stubbornly maintaining bets of around 50bps worth of rate reductions by the end of the year.
Asymmetrical reaction
Perhaps market participants believe that inflation will continue cooling at a fast pace and/or that the already delivered hikes will weigh more on the US economy. This is evident by the fact that they are aggressively selling the US dollar when the data corroborates their view, but they don’t buy with the same excitement when economic releases surprise to the upside.
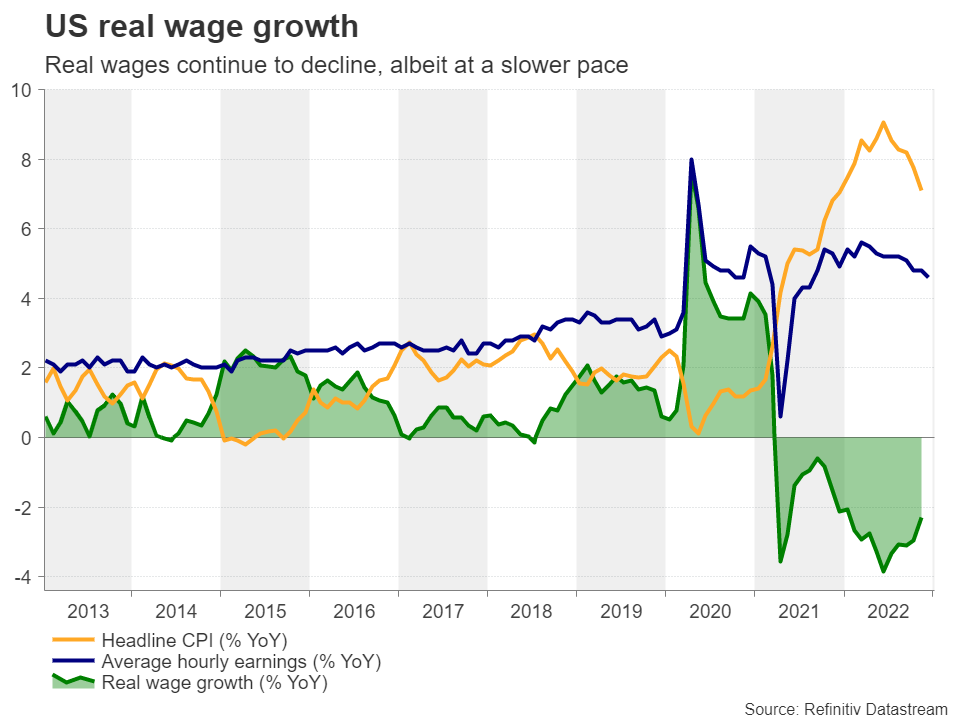
A recent example of this is that the dollar was bought last Wednesday after the ADP print beat expectations and initial jobless claims fell by more than forecast, but it was sold much more aggressively after Friday’s official jobs report pointed to slowing wage growth, despite still suggesting decent employment gains and an unemployment rate matching its lowest level in the last 50 years.
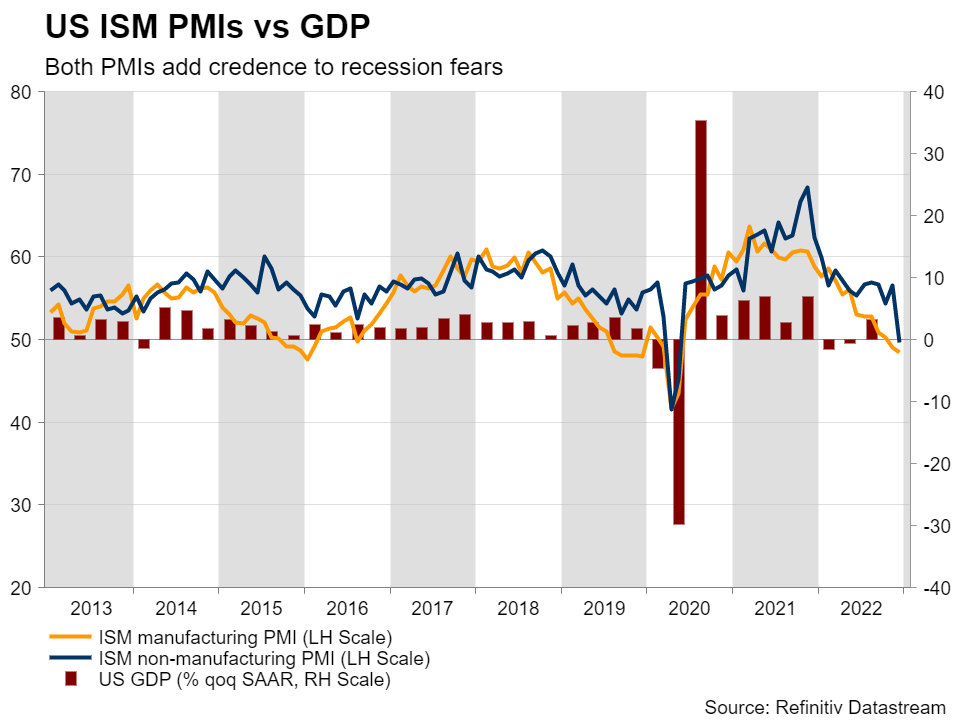
Just after the jobs data, the ISM non-manufacturing PMI for December slid to contractionary territory for the first time since May 2020, which may have amplified the selling of the dollar, despite equities ending the day in the green. This may have been due to expectations of lower interest rates in the future resulting in higher present values for firms valued by discounting expected cash flows.
CPI numbers to corroborate the pivot view
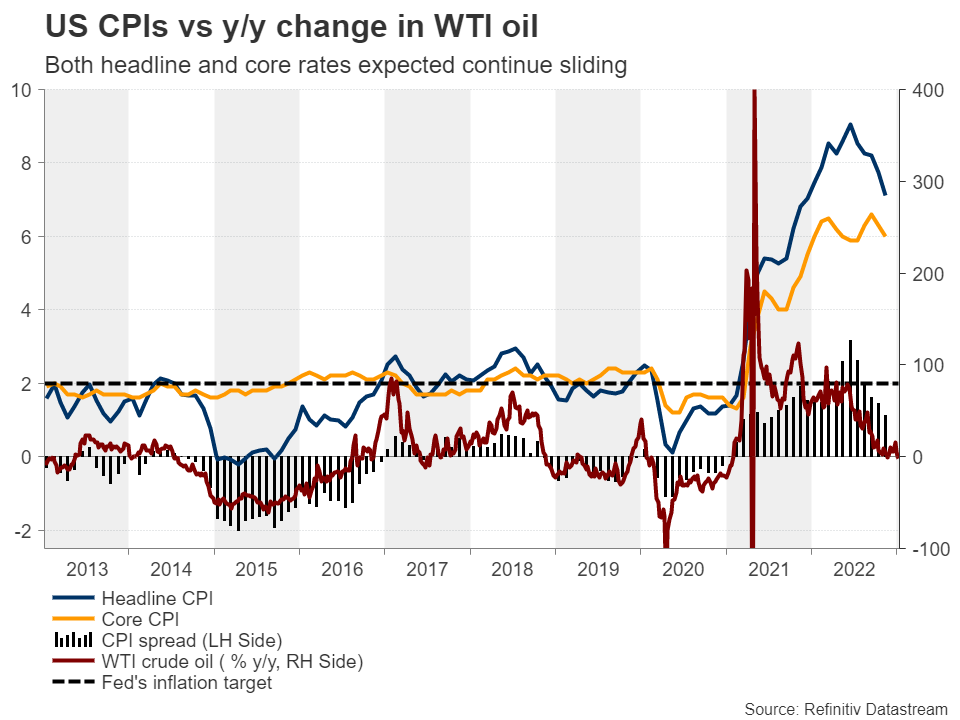
On Thursday, both the headline and core CPI rates for December are expected to have continued declining to 6.5% y/y and 5.7% y/y from 7.1% and 6.0% respectively. In contrast to the Eurozone, where underlying inflation continues to rise, in the US, underlying price pressures are cooling alongside headline inflation, which supports investors’ view that a Fed pivot may indeed be on the cards for later this year. This is likely to keep the US dollar under selling pressure, and perhaps boost stocks a while longer.
Having said all that though, a deeper contraction of the manufacturing sector during December and a deteriorating service sector (which currently accounts for 77.6% of US GDP) are likely adding to fears about the performance of the US economy and therefore, apart from a weaker dollar, equities may also resume their slide at some point soon. In other words, the inverse correlation between the stock market and the dollar may – even temporarily – break down at some point.
Euro/dollar may continue rising, mind the 1.0800 zone
From a technical standpoint, euro/dollar rebounded strongly from 1.0470 after Friday’s jobs report and entered this week on a strong footing, closing Monday above the key resistance zone of 1.0715. The pair is trading well above the prior downtrend line taken from the high of February 10 and above a newly drawn uptrend line from the low of September 28, while just this week, the 50-day exponential moving average (EMA) crossed above the 200-day EMA. All these technical signs point to a positive near-term picture.
A slowdown in US inflation, especially in underlying terms, will contrast with the rise in Eurozone’s core HICP rate and may validate speculation that the ECB may continue tightening more aggressively than the Fed henceforth. This might drive euro/dollar above the important resistance zone of 1.0800. Such a break could encourage more bulls to join the action and perhaps help lift the pair up to the 1.1175 zone, marked by the high of March 31.
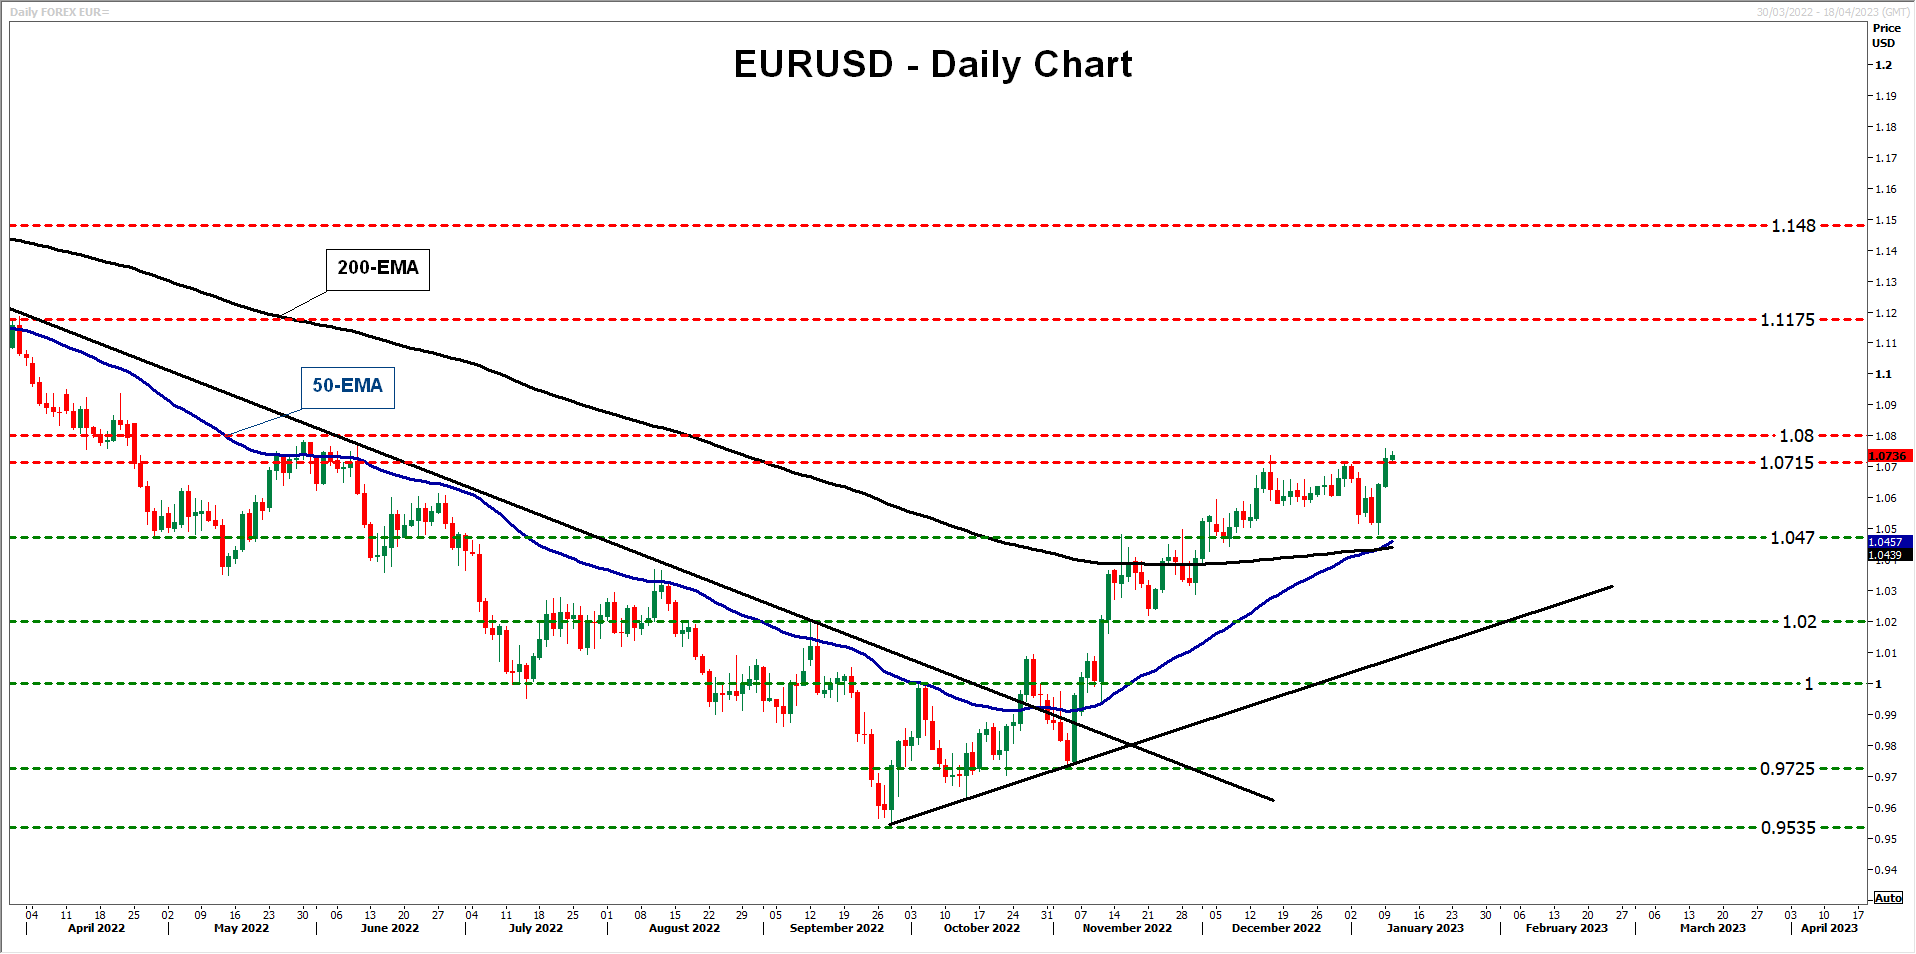
Yes, the dollar could still attract some safe-haven flows, but it seems that with Treasury yields coming down, it may have already lost the title of the ultimate safe haven. Therefore, any declines in euro/dollar may be just corrections before the next leg north. For the bears to take full charge of this pair again, a break below parity may be needed, as such a move would also confirm the violation of the uptrend line drawn from the low of September 28.
AUD/USD Edges Lower, CPI Next
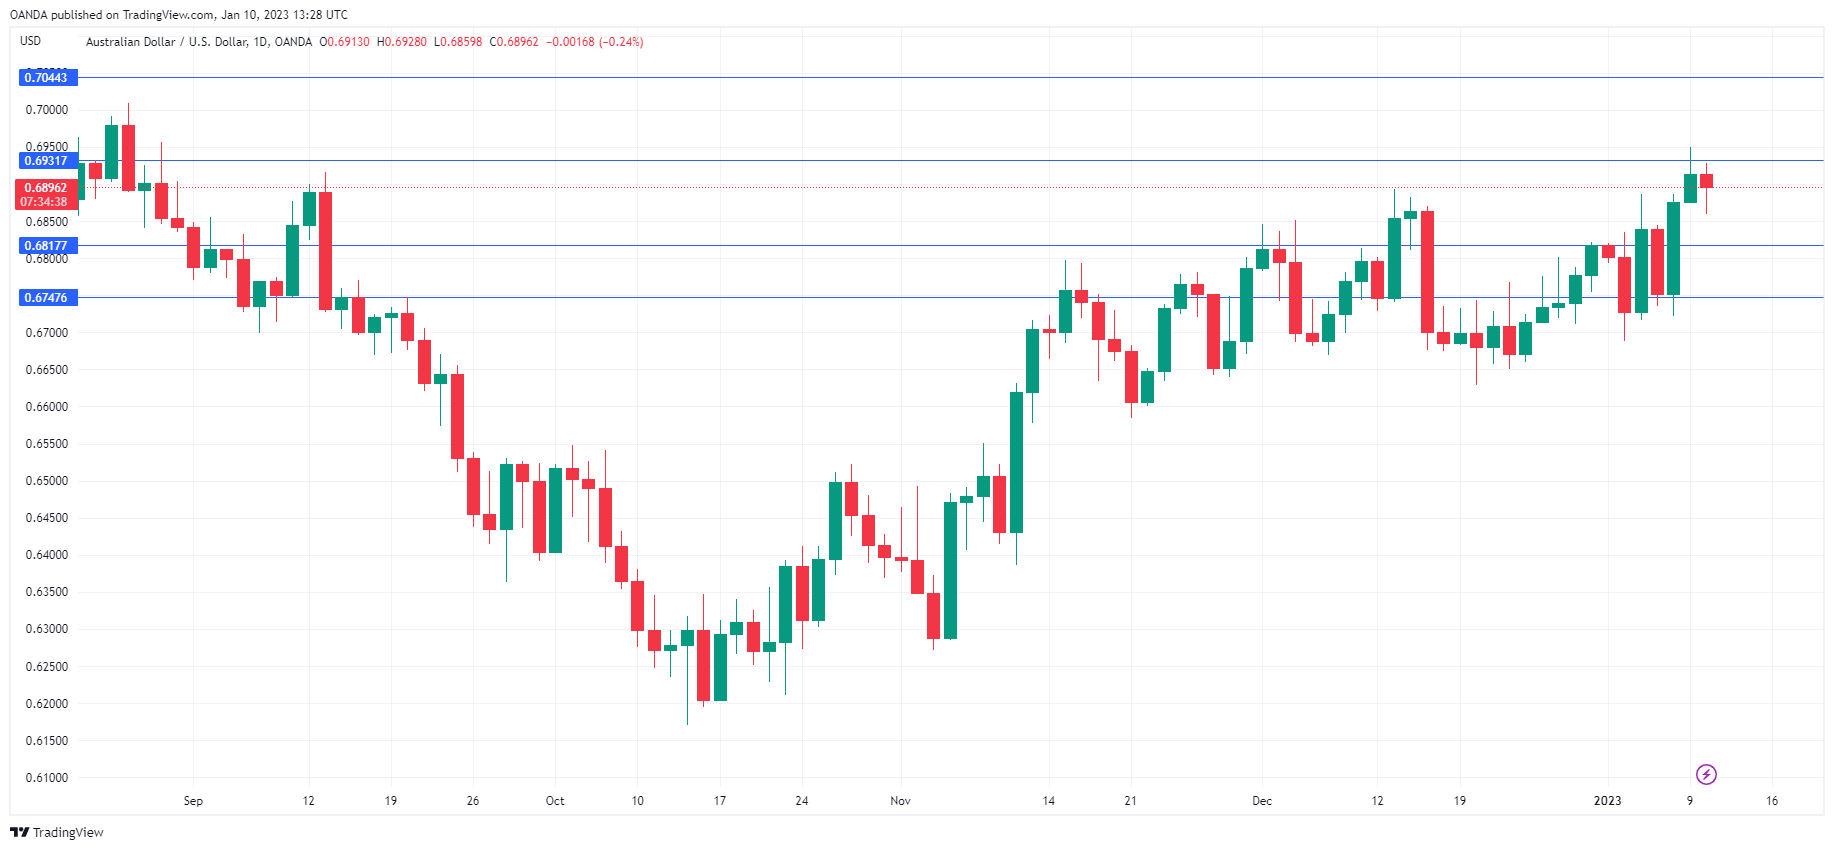
The Australian dollar is in negative territory on Tuesday. In the European session, AUD/USD is trading at 0.6898, down 0.21%. This follows a two-day rally in AUD/USD climbed over 2%.
Australian CPI looms
It could be a busy week for the Australian dollar, with Australia releasing CPI on Wednesday, followed by the US on Thursday. Australian headline inflation dropped to 6.9% in October, down from 7.3% a month earlier. The markets are bracing for inflation to rise again, with a forecast of 7.3% for December. As well, the trimmed mean rate (core CPI) is also expected to rise to 5.5%, up from 5.3%.
The RBA is widely expected to continue its tightening at the February 7th meeting. The markets are currently pricing in a 25-basis point hike at 60%, and this will likely rise if inflation reverses directions and climbs higher on Wednesday, as expected. The RBA is well aware of the pain that high rates are causing to consumers and businesses and remains flexible with its rate policy. The minutes of the December meeting indicated that the RBA considered three options at that meeting – a 25 bp hike, a 50-bp hike and a pause. In the end, RBA members opted for the 25-bp increase.
The Fed hasn’t had much success in convincing the markets to adopt its outlook on interest rates. The markets have stubbornly clung to a dovish approach, pricing in a terminal rate of 4.93%. In contrast, the Fed dot plot indicates a terminal rate of 5-5.25%. But you can’t fault the Fed for not trying. On Monday, two non-voting FOMC members reiterated the Fed’s hawkish stance, saying that rates would likely rise above 5%. Atlanta Fed President Rafael Bostic said he expected rates to remain above the 5% level for “a long time” and that he would put rates on hold throughout 2024. Bostic added that if Thursday’s inflation data showed inflation easing, it would strengthen the case for reducing the rate hike at the February meeting to 25 basis points. San Francisco Fed President Mary Daly echoed this stance, saying that holding rates at its peak for 11 months was a “reasonable starting point.”
If inflation is stronger than expected, the markets may listen a bit more closely. Conversely, a soft inflation release will make it harder for the Fed to convince the markets that it is not planning to wind up the current tightening cycle with a “one and done” hike in February.
AUD/USD Technical
- AUD/USD has support at 0.6703 and 0.6620
- There is resistance at 0.6841 and 0.6969