

Sample Category Title
USD/JPY Daily Outlook
Daily Pivots: (S1) 131.60; (P) 132.04; (R1) 132.68; More...
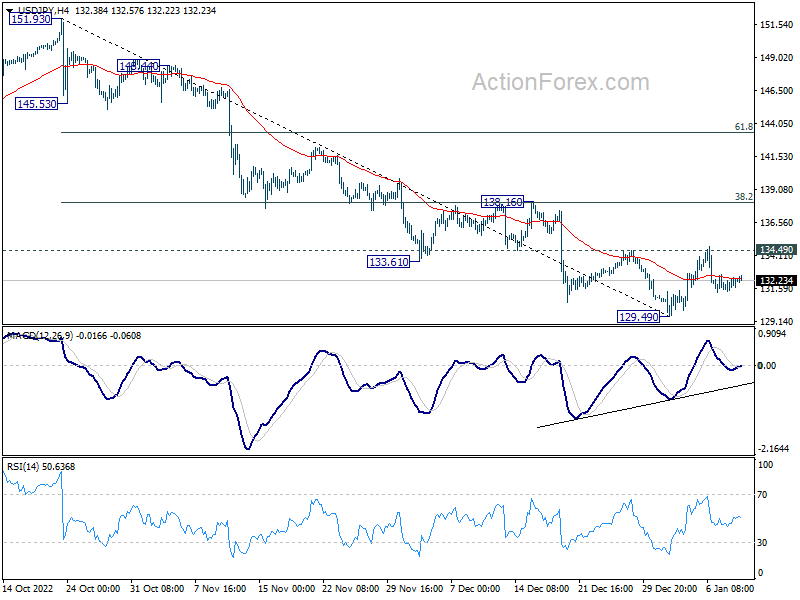
Range trading continues in USD/JPY and intraday bias remains neutral for the moment. On the upside, firm break of 134.49 should confirm short term bottoming, and bring stronger rise to 138.16 cluster resistance (38.2% retracement of 151.93 to 129.49 at 138.06). However, break of 129.49 will resume the whole decline from 151.93 instead.
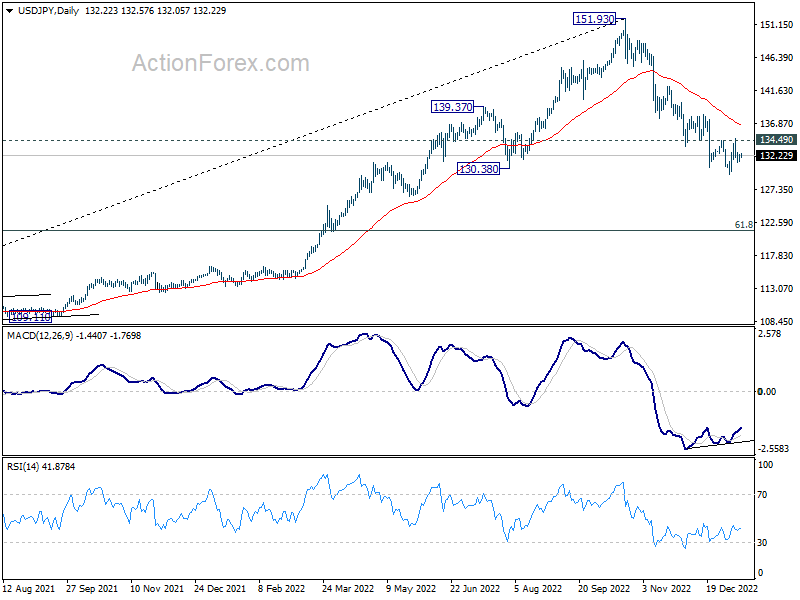
In the bigger picture, a medium term top was in place at 151.93. Sustained trading below 55 week EMA (now at 131.73) would raise the chance of bearish trend reversal. Deeper fall would be seen to 61.8% retracement of 102.58 to 151.93 at 121.43. This will now remain the favored case as long as 55 day EMA (now at 137.08) holds.
USD/CAD Daily Outlook
Daily Pivots: (S1) 1.3387; (P) 1.3416; (R1) 1.3456; More....
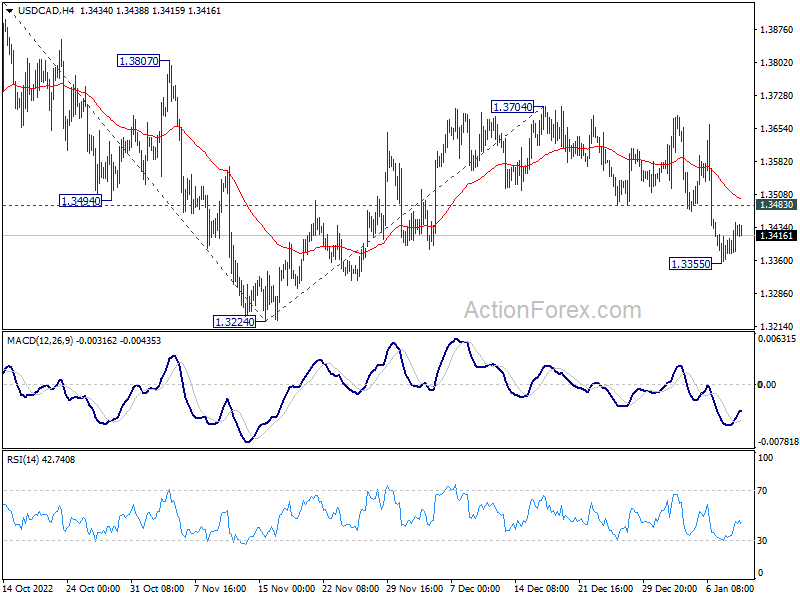
Intraday bias in USD/CAD is turned neutral first with current recovery. Another fall could still be seen through 1.3355 temporary low. But strong support would be seen above 1.3224 to contain downside. Above 1.3483 minor resistance will turn bias back to the upside for 1.3704 resistance. However, sustained break of 1.3222/4 cluster support will resume the whole fall from 1.3976 and carry larger bearish implications.
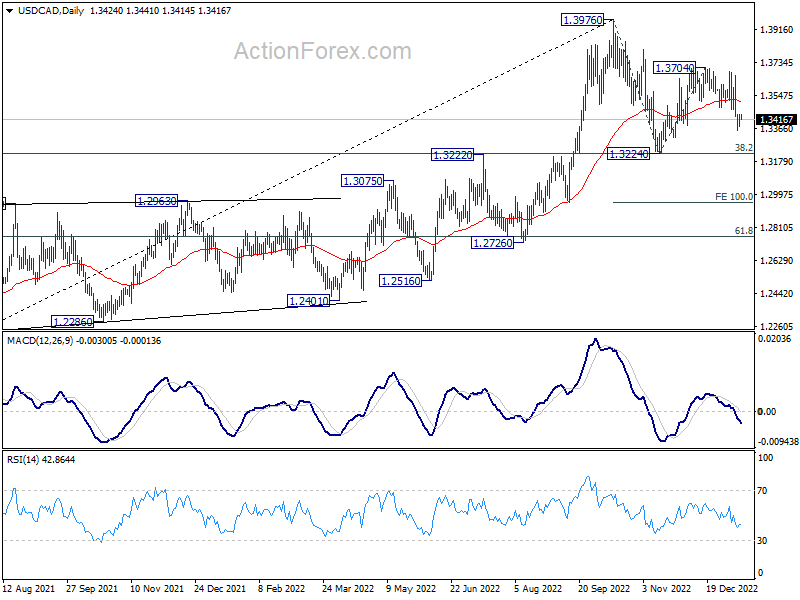
In the bigger picture, as long as 1.3222 cluster support (38.2% retracement of 1.2005 to 1.3976 at 1.3223) holds, larger up trend from 1.2005 (2021 low) is still expected to resume through 1.3976 high at a later stage. However, firm break of 1.3222/3 will indicate that the trend might have reversed. Deeper fall would be seen to next cluster support at 1.2726 (61.8% retracement at 1.2758).
AUD/USD Daily Report
Daily Pivots: (S1) 0.6859; (P) 0.6894; (R1) 0.6927; More...
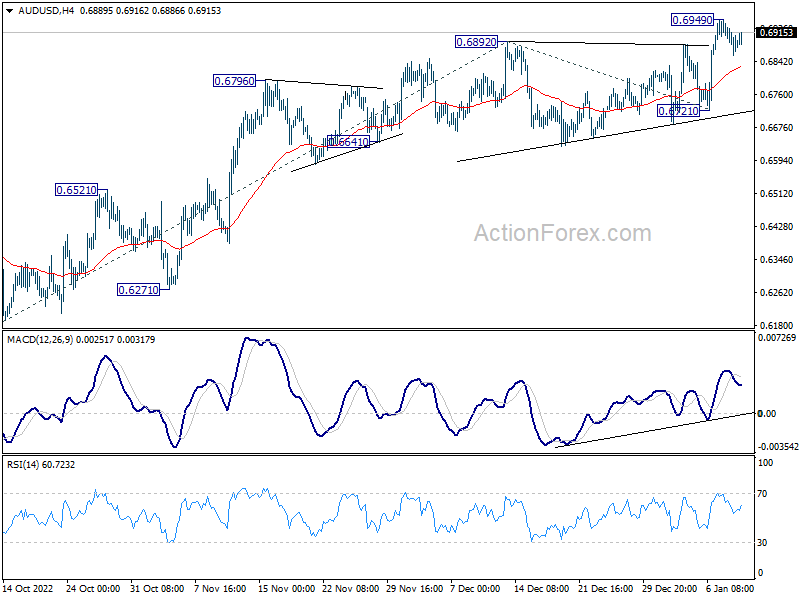
Intraday bias in AUD/USD remains neutral as consolidation from 0.6949 temporary top is extending. Outlook will stay bullish as long as 0.6721 support holds. Break of 0.6949 will resume larger rise from 0.6169 to 61.8% projection of 0.6169 to 0.6892 from 0.6721 at 0.7444 next. However, firm break of 0.6721 will indicate near term reversal and turn bias back to the downside.
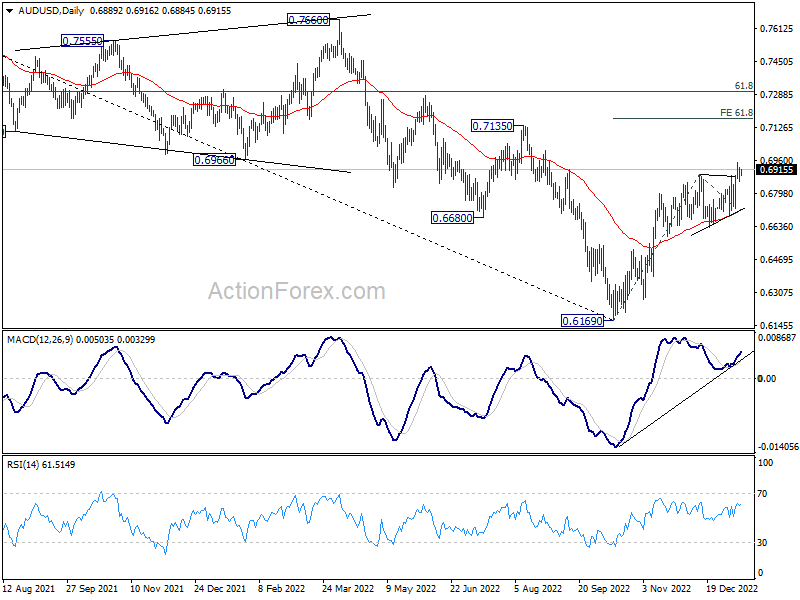
In the bigger picture, corrective decline from 0.8006 (2021 high) should have completed with three waves down to 0.6169 (2022 low). Further rally should be seen to 61.8% retracement of 0.8006 to 0.6169 at 0.6871. Sustained break there will pave the way to retest 0.8006. This will now remain the favored case as long as 0.6721 support holds.
Aussie Regains Ground after CPI, Dollar Treads Water
Australian Dollar regains some ground in Asian session today, following stronger than expected monthly CPI data. In the background, market sentiment also stabilizes after Fed Chair Jerome Powell refrained from commenting on monetary policy or inflation. New Zealand Dollar is currently the second strongest, followed by Swiss Franc. Yen is the worse performer, followed by Canadian and then Dollar and Euro. Sterling is mixed for now.
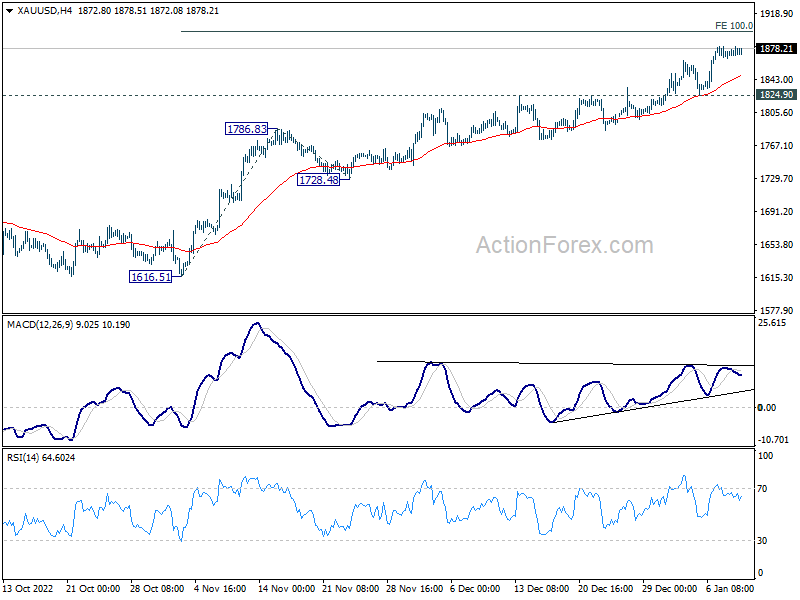
Technically, Dollar's selloff has clearly lost momentum this week so far, but there is no sign of a sustainable rebound yet. Traders are probably just holding their bets ahead of tomorrow's US CPI release. Gold's rally is still on track to 100% projection of 1616.51 to 1786.63 from 1728.48 at 1898.80. Considering weak upside momentum in 4 hour MACD, 1900 handle could cap upside in first attempt, and bring pull back. That might give Dollar a chance to rebound elsewhere.
In Asia, at the time of writing, Nikkei is up 0.98%. Hong Kong HSI is up 1.02%. China Shanghai SSE is up 0.20%. Singapore Strait Times is up 0.29%. Japan 10-year JGB yield is down -0.0074 at 0.504. Overnight, DOW rose 0.56%. S&P 500 rose 0.70%. NASDAQ rose 1.01%. 10-year yield rose 0.104 to 3.621.
Fed Bowman: Rates to remain at sufficiently restrictive level for some time
Fed Governor Michelle Bowman said in a speech, "In recent months, we've seen a decline in some measures of inflation but we have a lot more work to do, so I expect the FOMC will continue raising interest rates to tighten monetary policy, as we stated after our December meeting."
"My views on the appropriate size of future rate increases and on the ultimate level of the federal funds rate will continue to be guided by the incoming data and its implications for the outlook for inflation and economic activity."
"I will be looking for compelling signs that inflation has peaked and for more consistent indications that inflation is on a downward path, in determining both the appropriate size of future rate increases and the level at which the federal funds rate is sufficiently restrictive."
"I expect that once we achieve a sufficiently restrictive federal funds rate, it will need to remain at that level for some time in order to restore price stability, which will in turn help to create conditions that support a sustainably strong labor market."
ECB Centeno: Inflation will fall again from March onwards
ECB Governing Council member Mario Centeno said yesterday, "we are approaching the end of the current process of interest rate hikes, I believe that is true."
Centeno said that "wage updates in Europe could make it difficult for prices to continue to fall" in the next two months, but "after that, inflation will fall again from March onwards."
BoJ Public Survey: 32.5% expects prices to go up significantly, up from 28.9%
According to BoJ's December Survey on the General Public's Views and Behavior, 32.5% of respondents expect prices will go up significantly one year from now, up from September's survey of 28.9%. Those expecting prices to go up slightly dropped to 52.5%, down from 56.8%. Together, those expecting prices to go up dropped to 85.0%, down slightly from 85.7%. Only 2.4% expects prices to go down.
Regarding economic condition one year from now, those expecting improvement dropped to 9.1%, down from 10.5%. Those expecting unchanged dropped to 44.4%, down from 46.0%. Those expect worsening conditions rose to 46.2%, up from 42.9%. DI dropped to -37.1, down from -32.4.
Australia monthly CPI rose back to 7.3% yoy in Nov, ongoing inflationary pressures
Australia monthly CPI accelerated from 6.9% yoy to 7.3% yoy in November, above expectation of 7.2% yoy.
Michelle Marquardt, ABS Head of Prices Statistics, said "This month's annual movement of 7.3% compares to 6.9% in October and 7.3% in September, indicating ongoing inflationary pressures."
The most significant contributors to the annual rise in November were Housing (+9.6%), Food and non-alcoholic beverages (+9.4 per cent), Transport (+9.0%), Furniture, household equipment and services (+8.4%) and Recreation and culture (+5.8%).
Australia retail sales rose 1.4% mom in Nov on Black Friday sales
Australia retail sales rose 1.4% mom in November, well above expectation of 0.7% mom. The seasonally adjusted turnover of AUD 35.92B was a new record high.
Ben Dorber, ABS head of retail statistics, said, "While we typically see a rise in spending around Black Friday sales, the strong seasonally adjusted rise in November 2022 shows that the effect is increasing over time, as the event has become more common across retailers and sales periods become longer."
"Given the increasing popularity of Black Friday sales, the smaller increase in October may reflect consumers waiting to take advantage of discounting in November, particularly in light of cost-of-living pressures."
Looking ahead
Italy retail sales and US crude oil inventories are the only features in another ultra-light day.
AUD/USD Daily Report
Daily Pivots: (S1) 0.6859; (P) 0.6894; (R1) 0.6927; More...
Intraday bias in AUD/USD remains neutral as consolidation from 0.6949 temporary top is extending. Outlook will stay bullish as long as 0.6721 support holds. Break of 0.6949 will resume larger rise from 0.6169 to 61.8% projection of 0.6169 to 0.6892 from 0.6721 at 0.7444 next. However, firm break of 0.6721 will indicate near term reversal and turn bias back to the downside.
In the bigger picture, corrective decline from 0.8006 (2021 high) should have completed with three waves down to 0.6169 (2022 low). Further rally should be seen to 61.8% retracement of 0.8006 to 0.6169 at 0.6871. Sustained break there will pave the way to retest 0.8006. This will now remain the favored case as long as 0.6721 support holds.
Economic Indicators Update
| GMT | Ccy | Events | Actual | Forecast | Previous | Revised |
|---|---|---|---|---|---|---|
| 00:30 | AUD | Retail Sales M/M Nov | 1.40% | 0.70% | -0.20% | |
| 00:30 | AUD | CPI Y/Y Nov | 7.30% | 7.20% | 6.90% | |
| 05:00 | JPY | Leading Economic Index Nov P | 97.6 | 98.8 | 98.6 | |
| 09:00 | EUR | Italy Retail Sales M/M Nov | 0.20% | -0.40% | ||
| 15:30 | USD | Crude Oil Inventories | -2.0M | 1.7M |
BoJ Public Survey: 32.5% expects prices to go up significantly, up from 28.9%
According to BoJ's December Survey on the General Public's Views and Behavior, 32.5% of respondents expect prices will go up significantly one year from now, up from September's survey of 28.9%. Those expecting prices to go up slightly dropped to 52.5%, down from 56.8%. Together, those expecting prices to go up dropped to 85.0%, down slightly from 85.7%. Only 2.4% expects prices to go down.
Regarding economic condition one year from now, those expecting improvement dropped to 9.1%, down from 10.5%. Those expecting unchanged dropped to 44.4%, down from 46.0%. Those expect worsening conditions rose to 46.2%, up from 42.9%. DI dropped to -37.1, down from -32.4.
Technical Outlook and Review
USD/JPY:
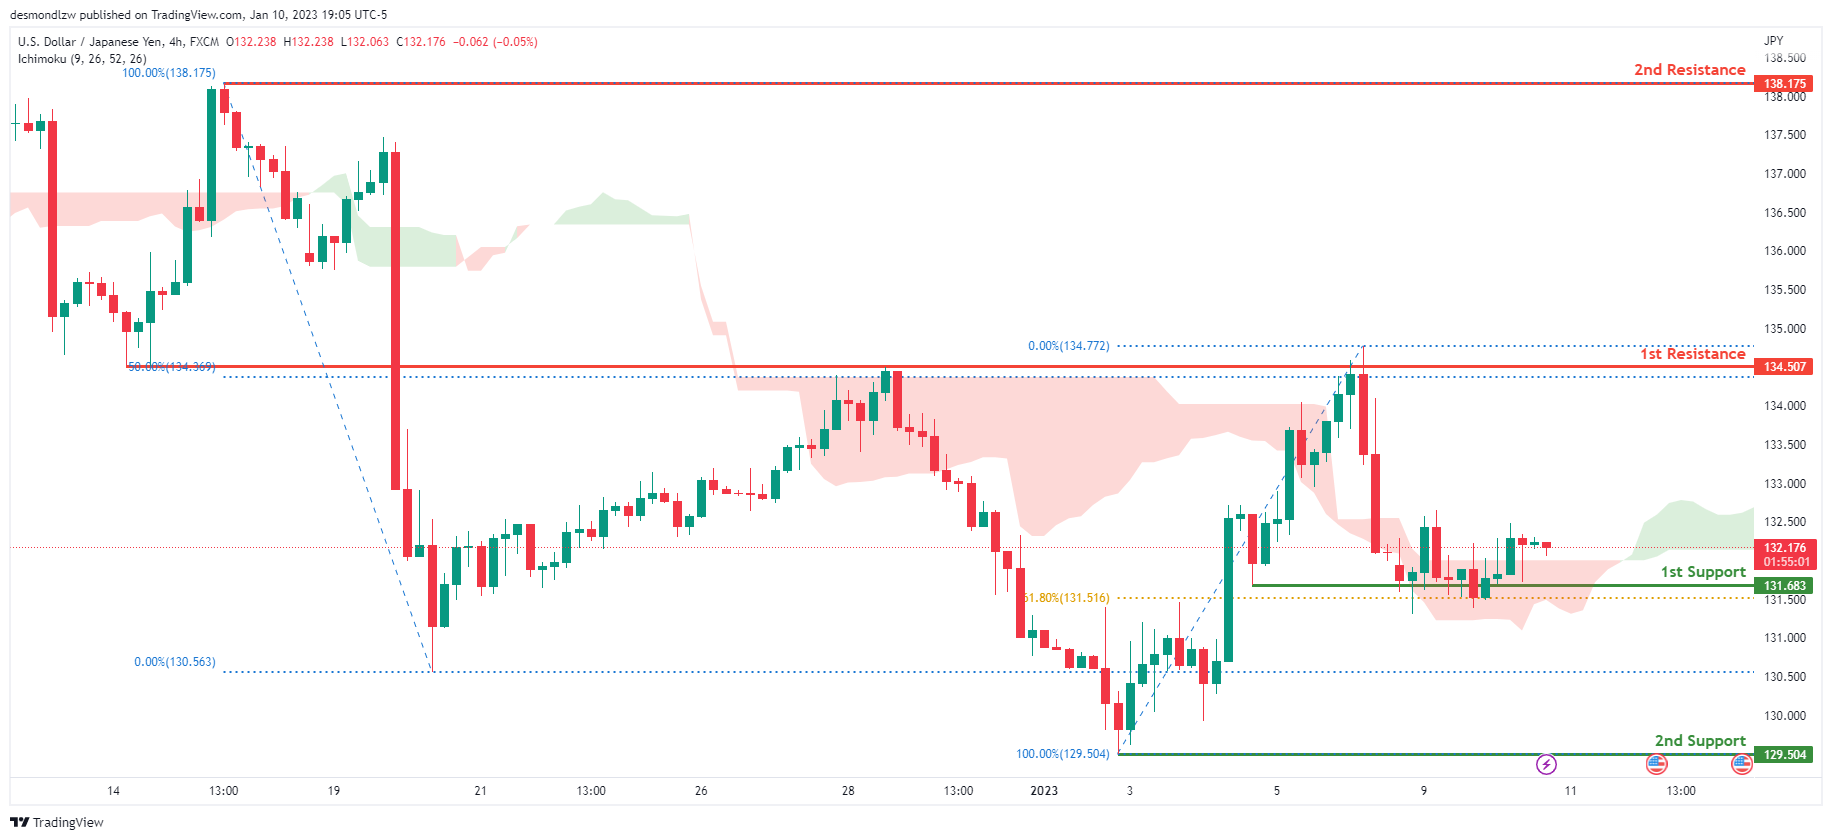
Looking at the H4 chart, my overall bias for USDJPY is bullish due to the current price being above the Ichimoku cloud, indicating a bullish market. If this bullish momentum continues, expect the price to possibly head back up towards the 1st resistance level at 134.507, where the 50% Fibonacci line is. In an alternate scenario, price could possibly break the 1st support at 131.683, where the 61.8% Fibonacci line is, before heading towards the 2nd support at 129.504, where the previous swing low is.
Areas of consideration:
- H4 time frame, 1st resistance at 134.507
- H4 time frame, 1st support at 131.683
- H4 time frame, 2nd support at 129.504
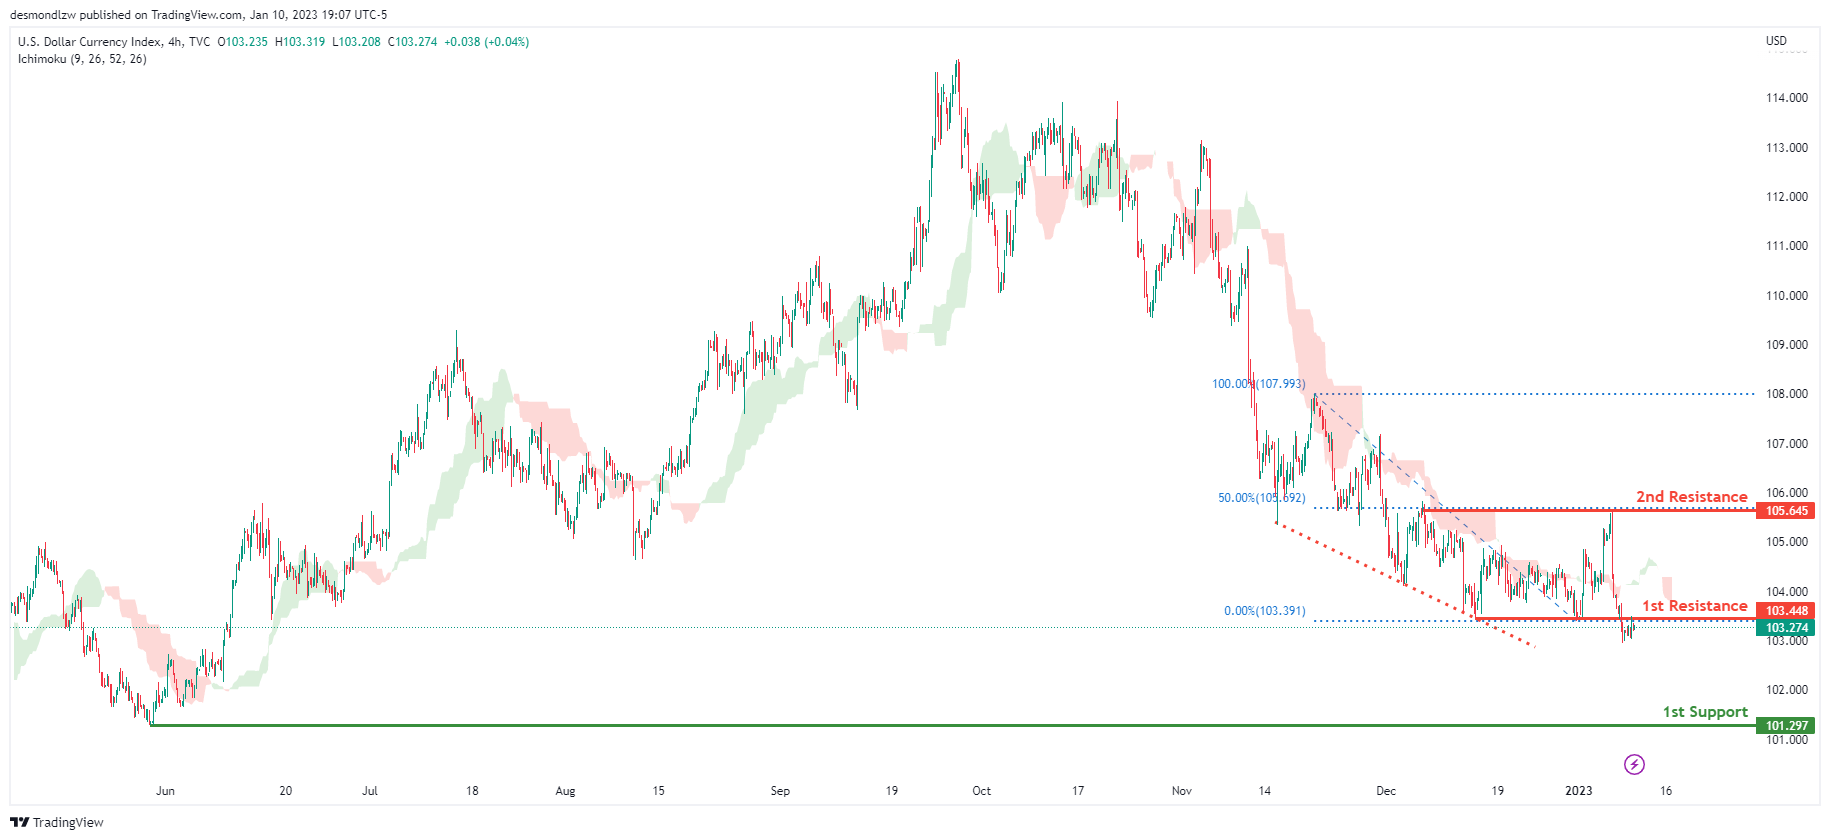
DXY:
Looking at the H4 chart, my overall bias for DXY is bearish due to the current price being below the Ichimoku cloud, indicating a bearish market. To add confluence to this, price is along a descending trend line which indicates a bearish market. If this bearish momentum continues, expect the price to possibly continue heading towards the 1st support at 101.297, where the previous lows and liquidity hotspots are. In an alternative scenario, price could head back up to retest the 1st resistance at 103.448, where the previous low is.
Areas of consideration:
- H4 time frame, 1st resistance at 103.448
- H4 time frame, 1st support at 101.297
EUR/USD:
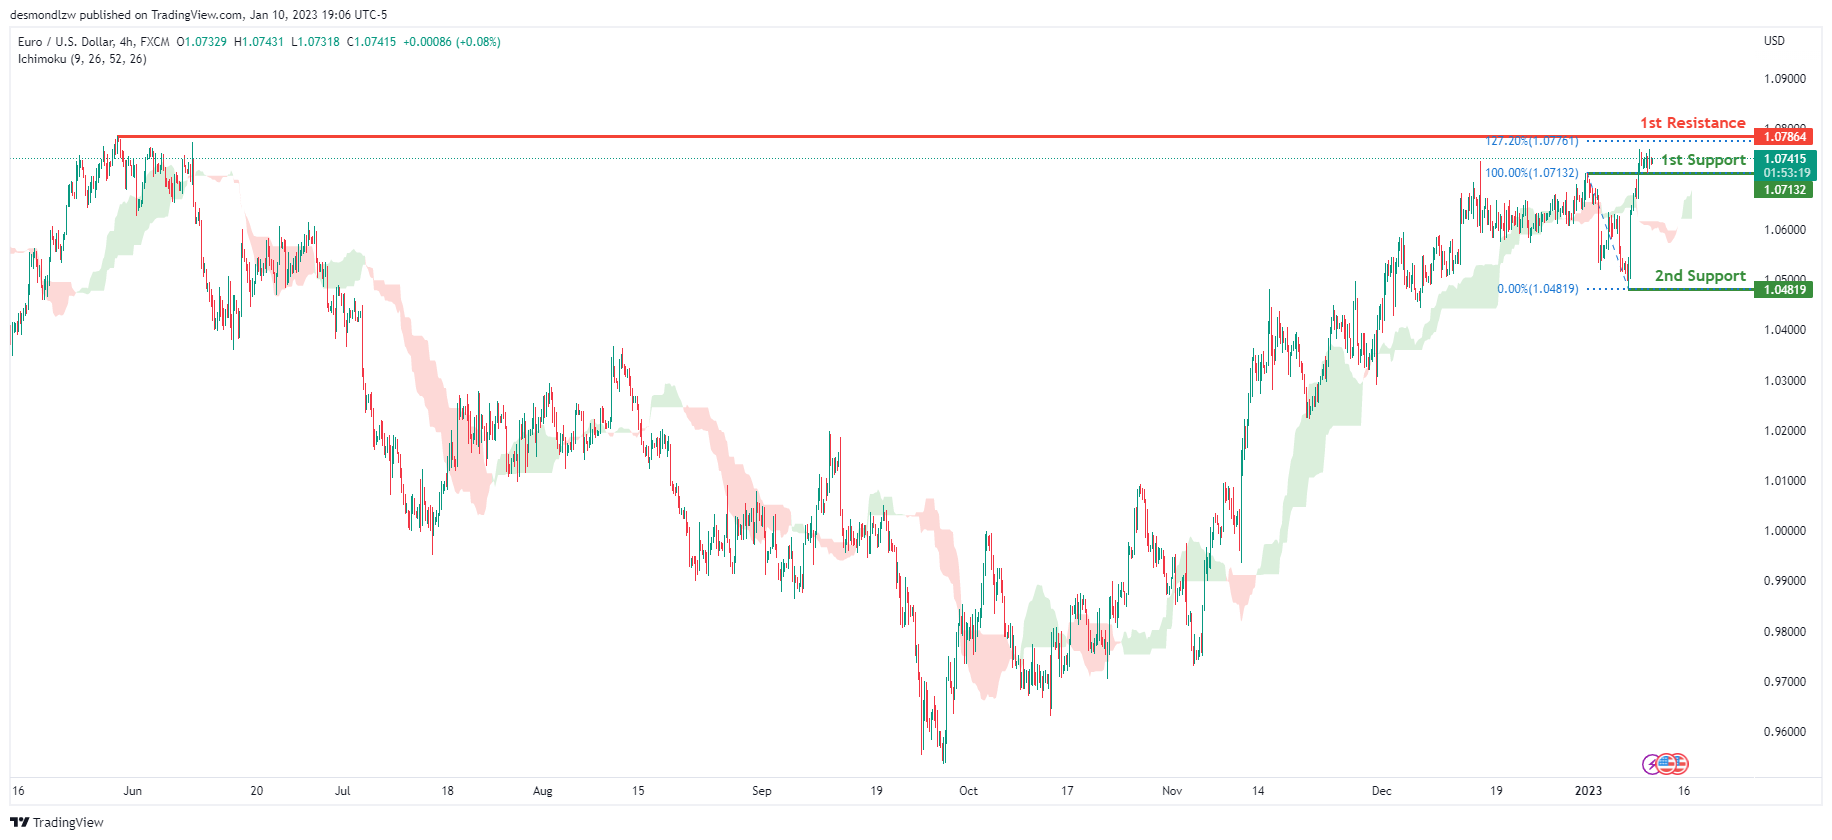
Looking at the H4 chart, my overall bias for EURUSD is bullish due to the current price being above the Ichimoku cloud, indicating a bullish market structure. If this bullish momentum continues, expect the price to possibly continue heading towards the 1st resistance at 1.07864, where the previous swing high is. In an alternate scenario, price could possibly head back down to retest the 1st support level at 1.07132, where the previous swing high is.
Areas of consideration :
- H4 1st resistance at 1.07864
- H4 1st support at 1.07132
GBP/USD:
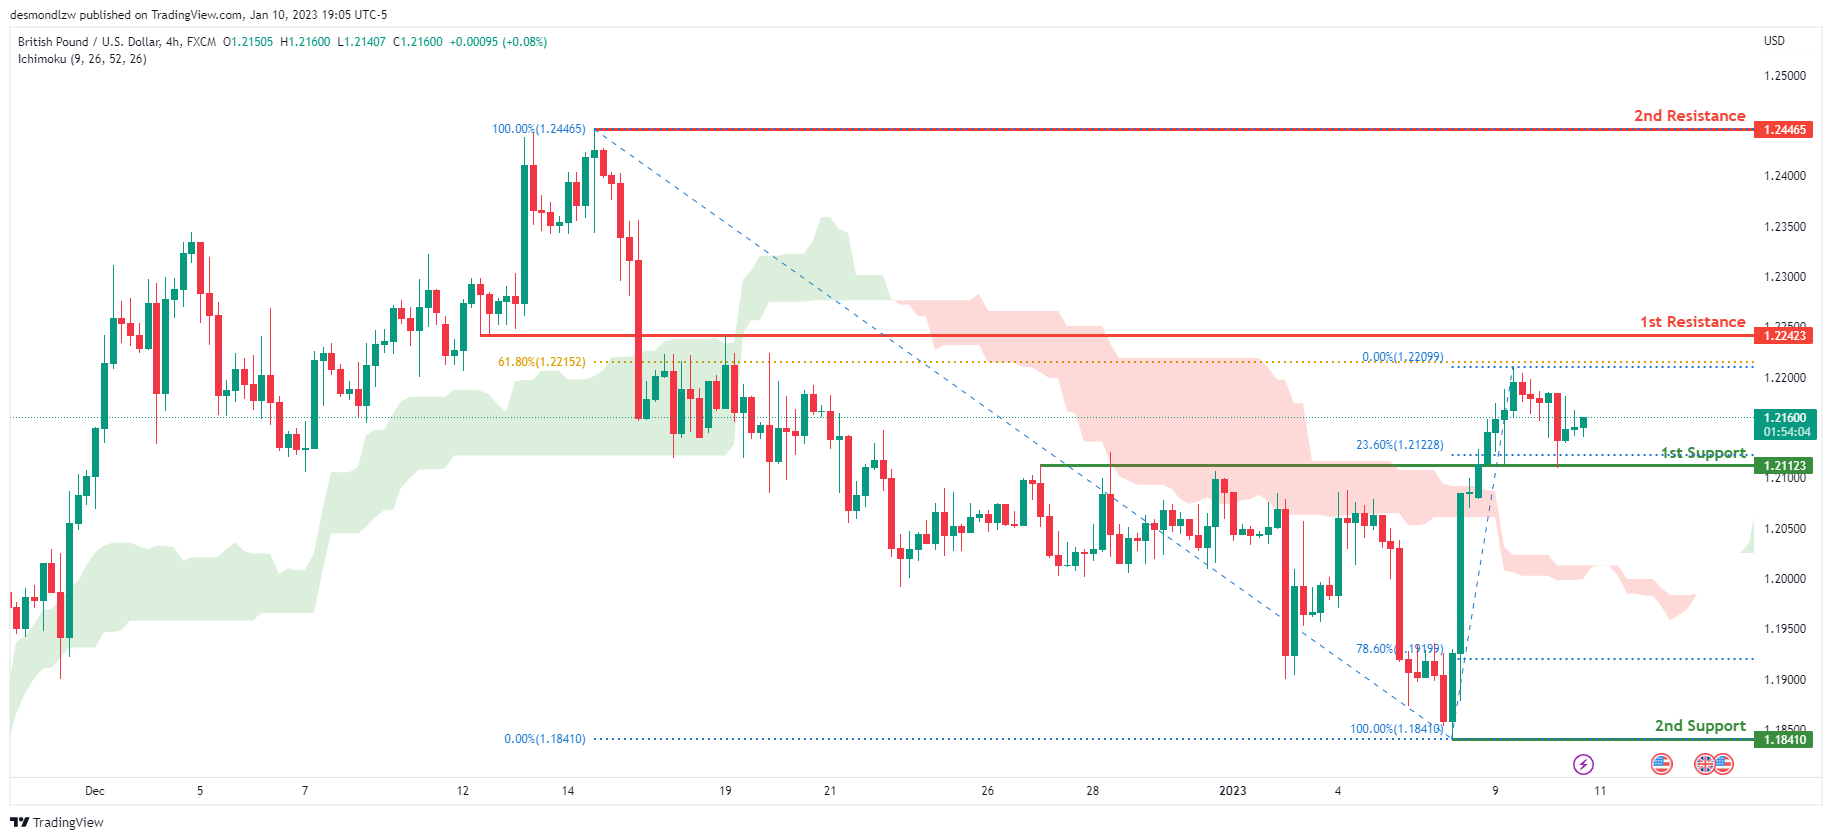
Looking at the H4 chart, my overall bias for GBPUSD is bullish due to the current price being above the Ichimoku cloud, indicating a bullish market. If this bullish momentum continues, expect price to possibly continue heading towards the 1st resistance line at 1.22423, slightly above where the 61.8% Fibonacci line is. In an alternate scenario, price could possibly head back down towards the 1st support at 1.21123, where the 23.6% Fibonacci line is
Areas of consideration:
- H4 1st resistance at 1.22423
- H4 1st support at 1.21068
USD/CHF:
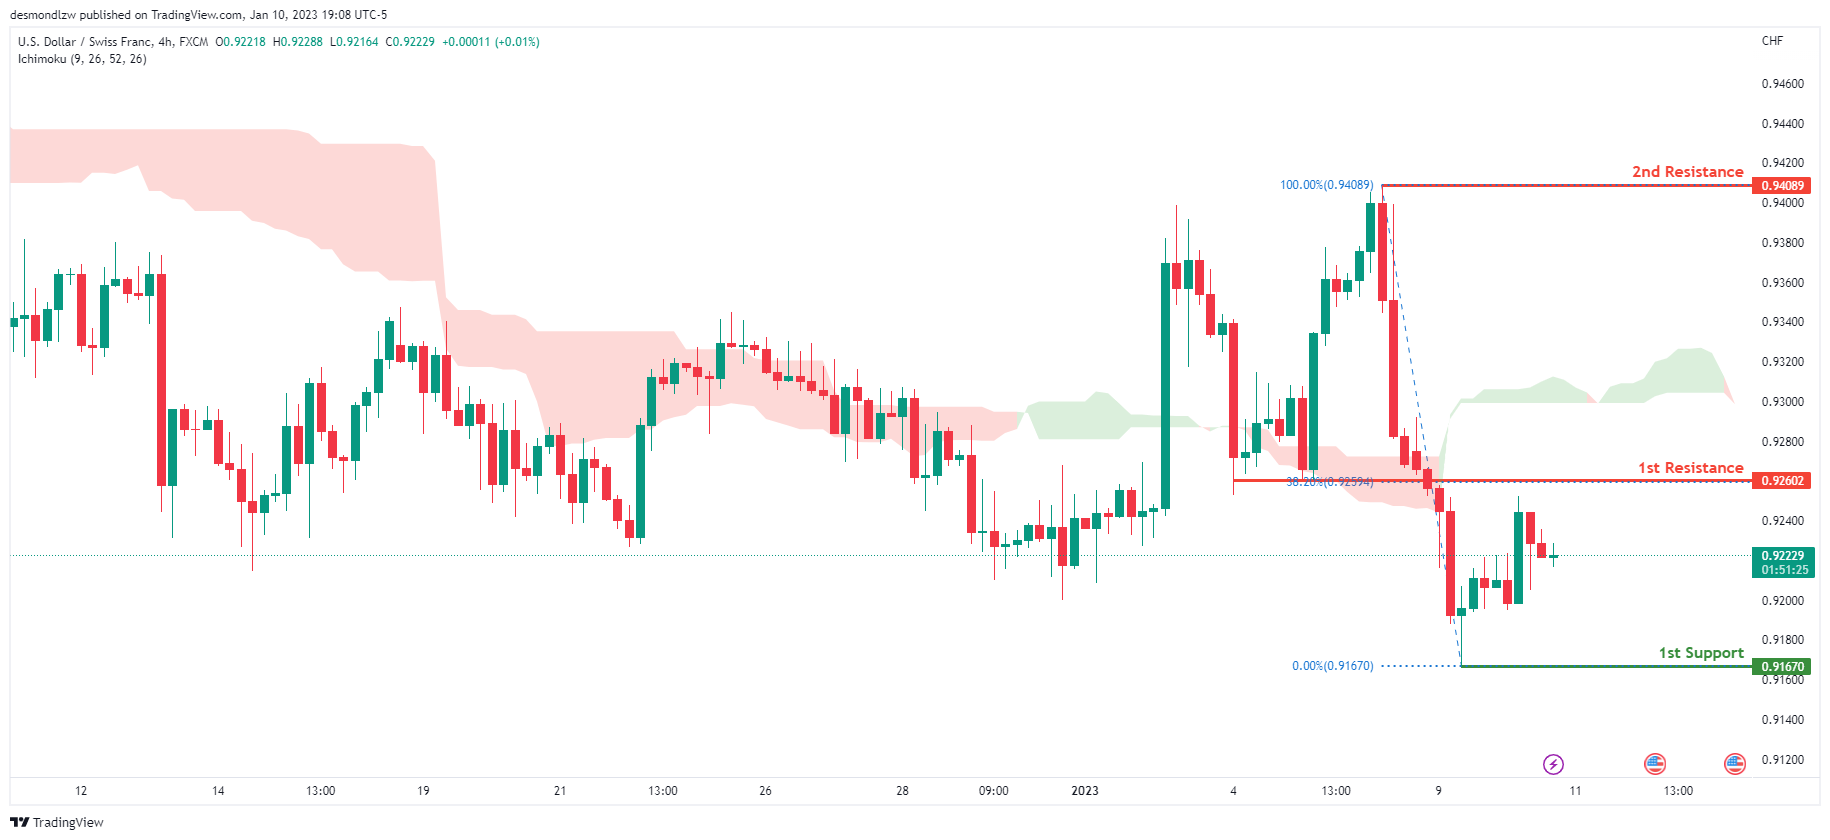
Looking at the H4 chart, my overall bias for USDCHF is bearish due to the current price being below the Ichimoku cloud, indicating a bearish market. If the current bearish trend continues, expect the price to head towards the 1st support at 0.91670, where the recent low is. In an alternative scenario, price could possibly head back up to retest the 1st resistance at 0.92602, where the 38.2% Fibonacci line is.
Areas of consideration
- H4 1st support at 0.91670
- H4 1st resistance at 0.92602
XAU/USD (GOLD):
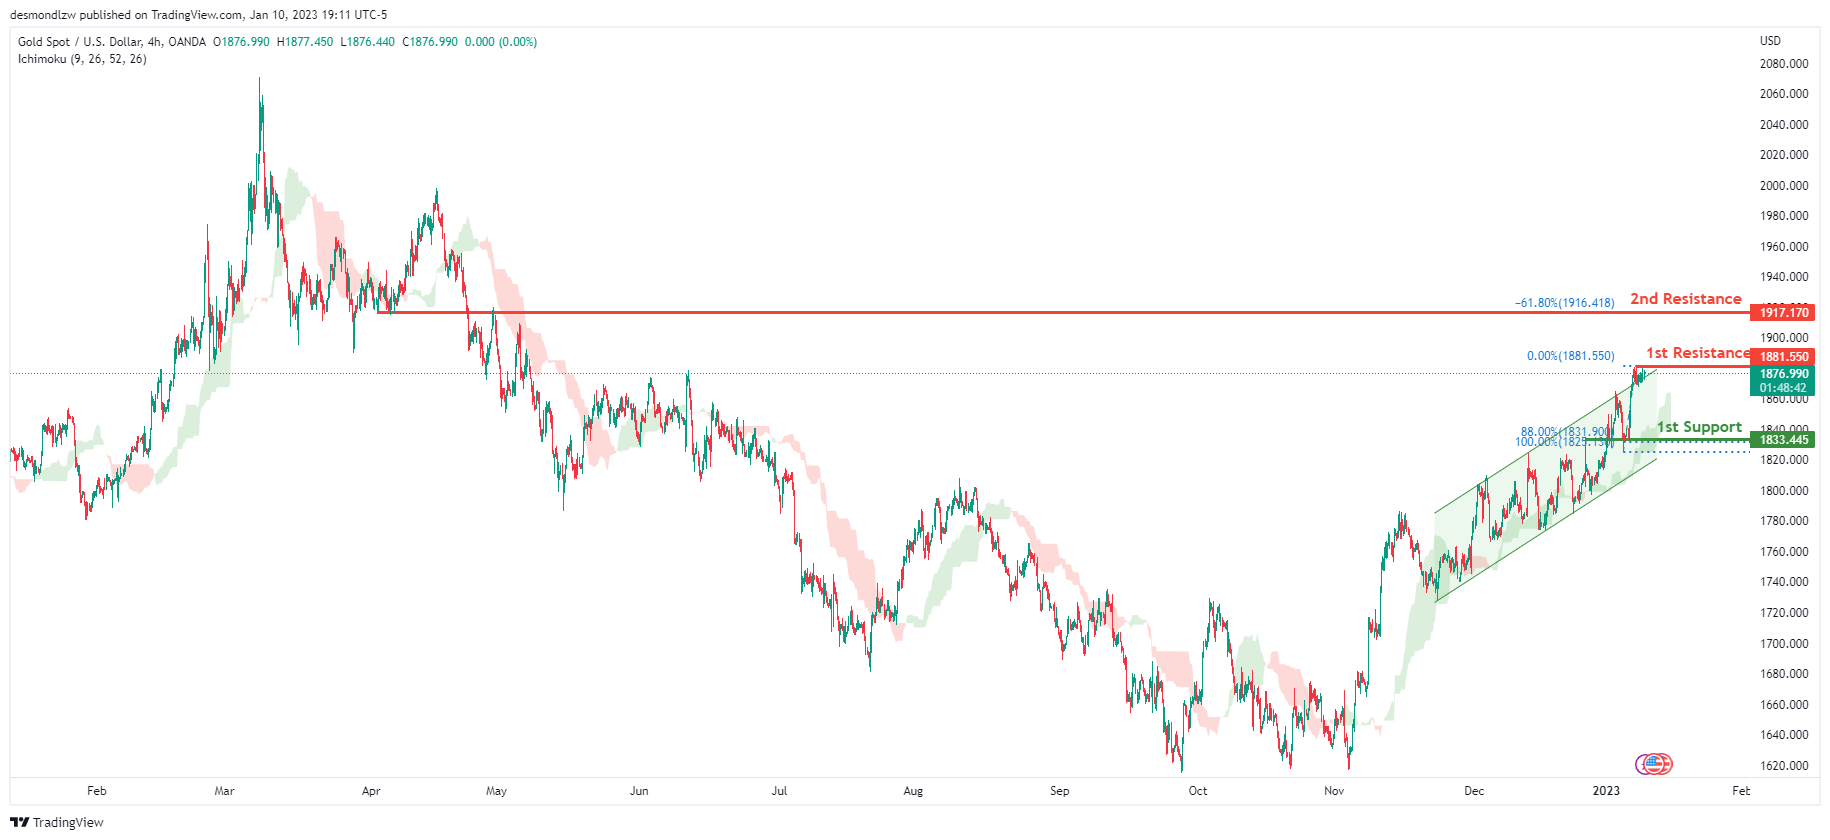
Looking at the H4 chart, my overall bias for XAUUSD is bullish due to the current price crossing above the Ichimoku cloud, indicating a bullish market. To add support to this bias, price has also broken above the bullish ascending channel. If this bullish momentum continues, expect the price to possibly break the 1st resistance at 1881.550 where the recent high is, before heading towards the 2nd resistance at 1917.170, where the -61.8% Fibonacci expansion line is. In an alternative scenario, price could possibly head back down towards the 1st support at 1833.445, where the 88% Fibonacci line is.
Areas of consideration:
- H4 time frame, 1st resistance at 1881.550
- H4 time frame, 2nd resistance at 1917.170
- H4 time frame, 1st support at 1833.445
- H4 time frame, 2nd support at 1833.445
AUD/USD:
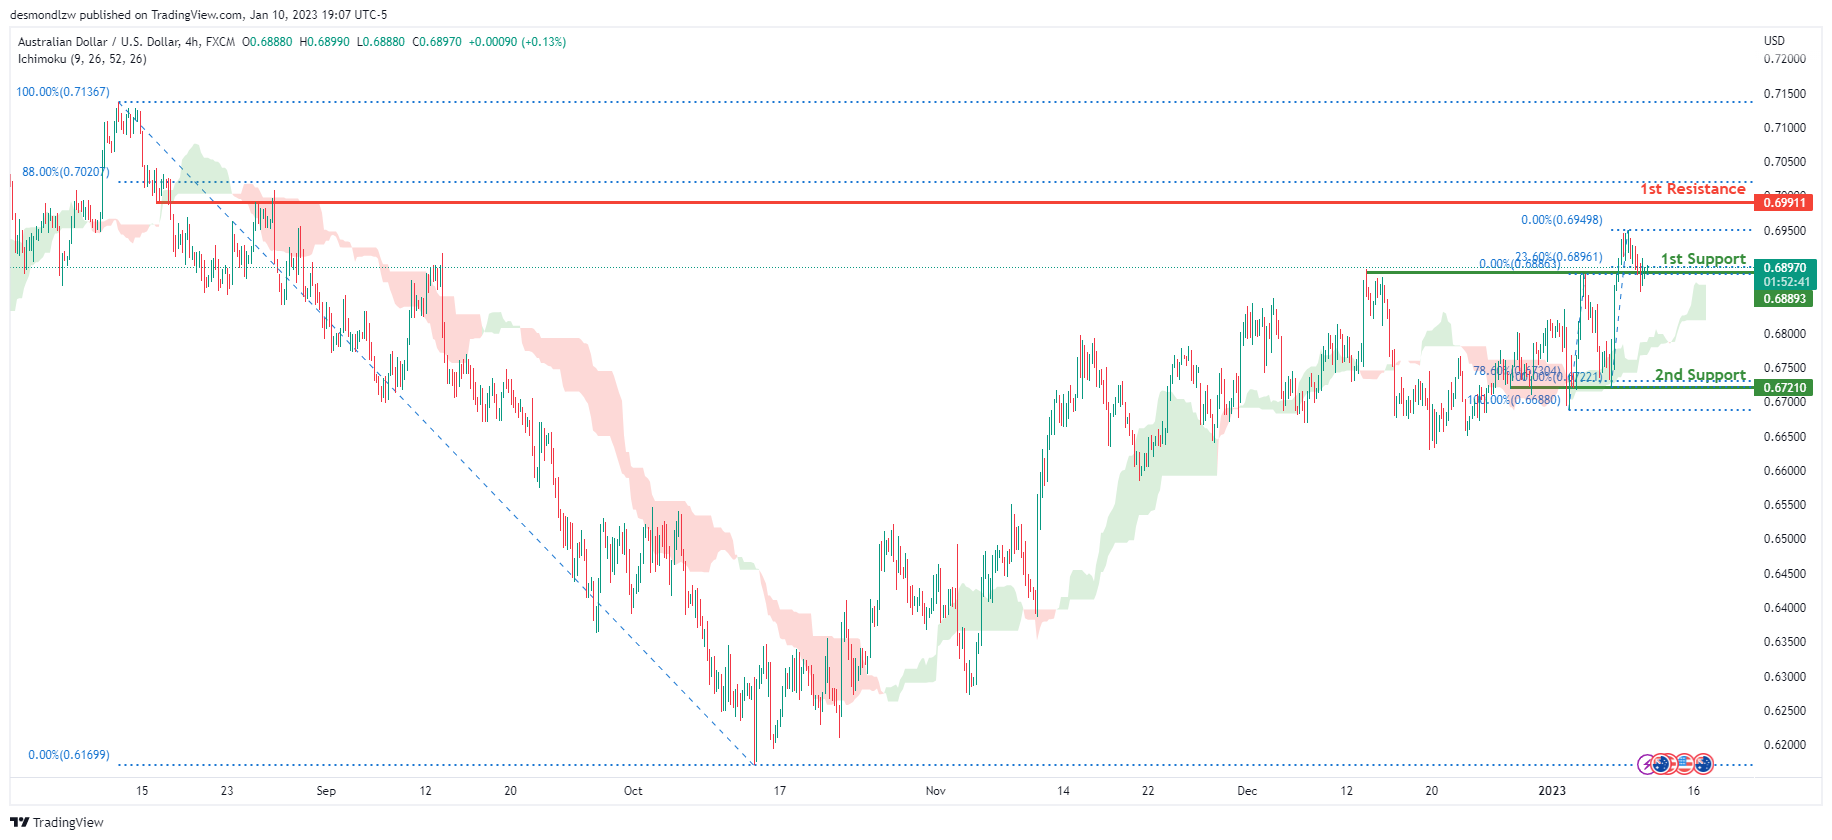
Looking at the H4 chart, my overall bias for AUDUSD is bullish due to the current price being above the Ichimoku cloud, indicating a bullish market. If this bullish momentum continues, expect the price to continue heading towards the 1st resistance at 0.69911, where the 88% Fibonacci line is. In an alternative scenario, price could possibly head back down towards the 1st support at 0.68893, where the 23.6% Fibonacci line is.
Areas of consideration
- H4, 1st resistance at 0.69911
- H4, 1st support at 0.68893
NZD/USD:
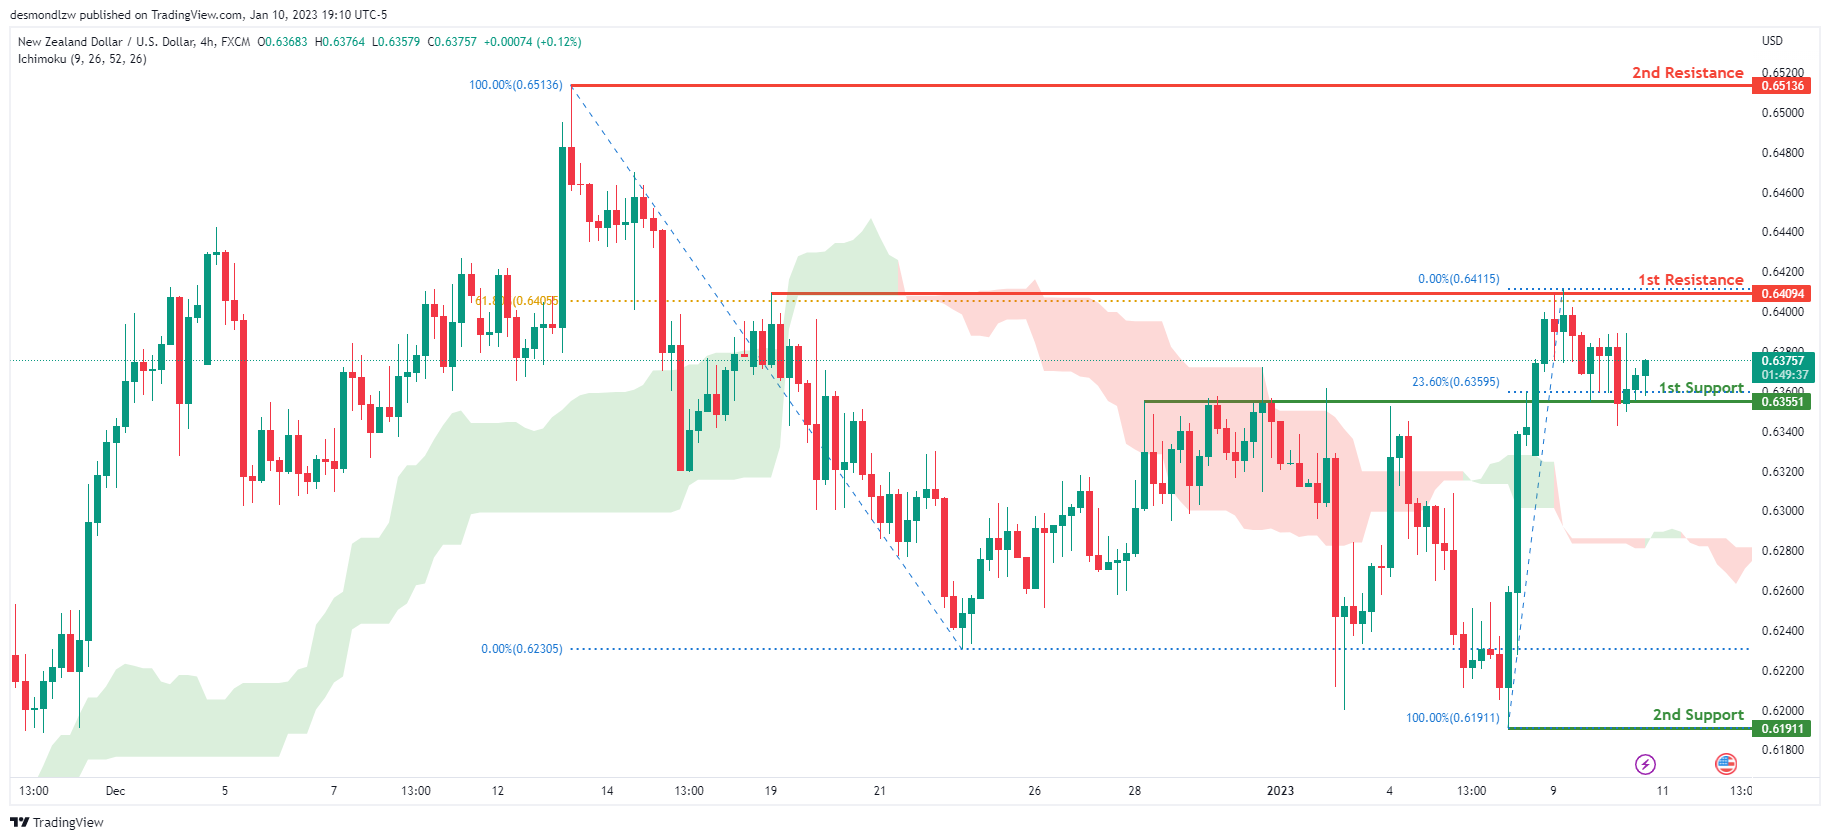
Looking at the H4 chart, my overall bias for NZDUSD is bullish due to the current price being above the Ichimoku cloud, indicating a bullish market. If this bullish momentum continues, expect price to possibly continue heading towards the 1st resistance at 0.64094, where the 61.8% Fibonacci line is. In an alternate scenario, price could possibly head back down to retest the 1st support at 0.63551, where the 23.6% Fibonacci line is
Areas of consideration:
- H4 time frame, 1st resistance at 0.64094
- H4 time frame, 1st support at 0.63551
USD/CAD:
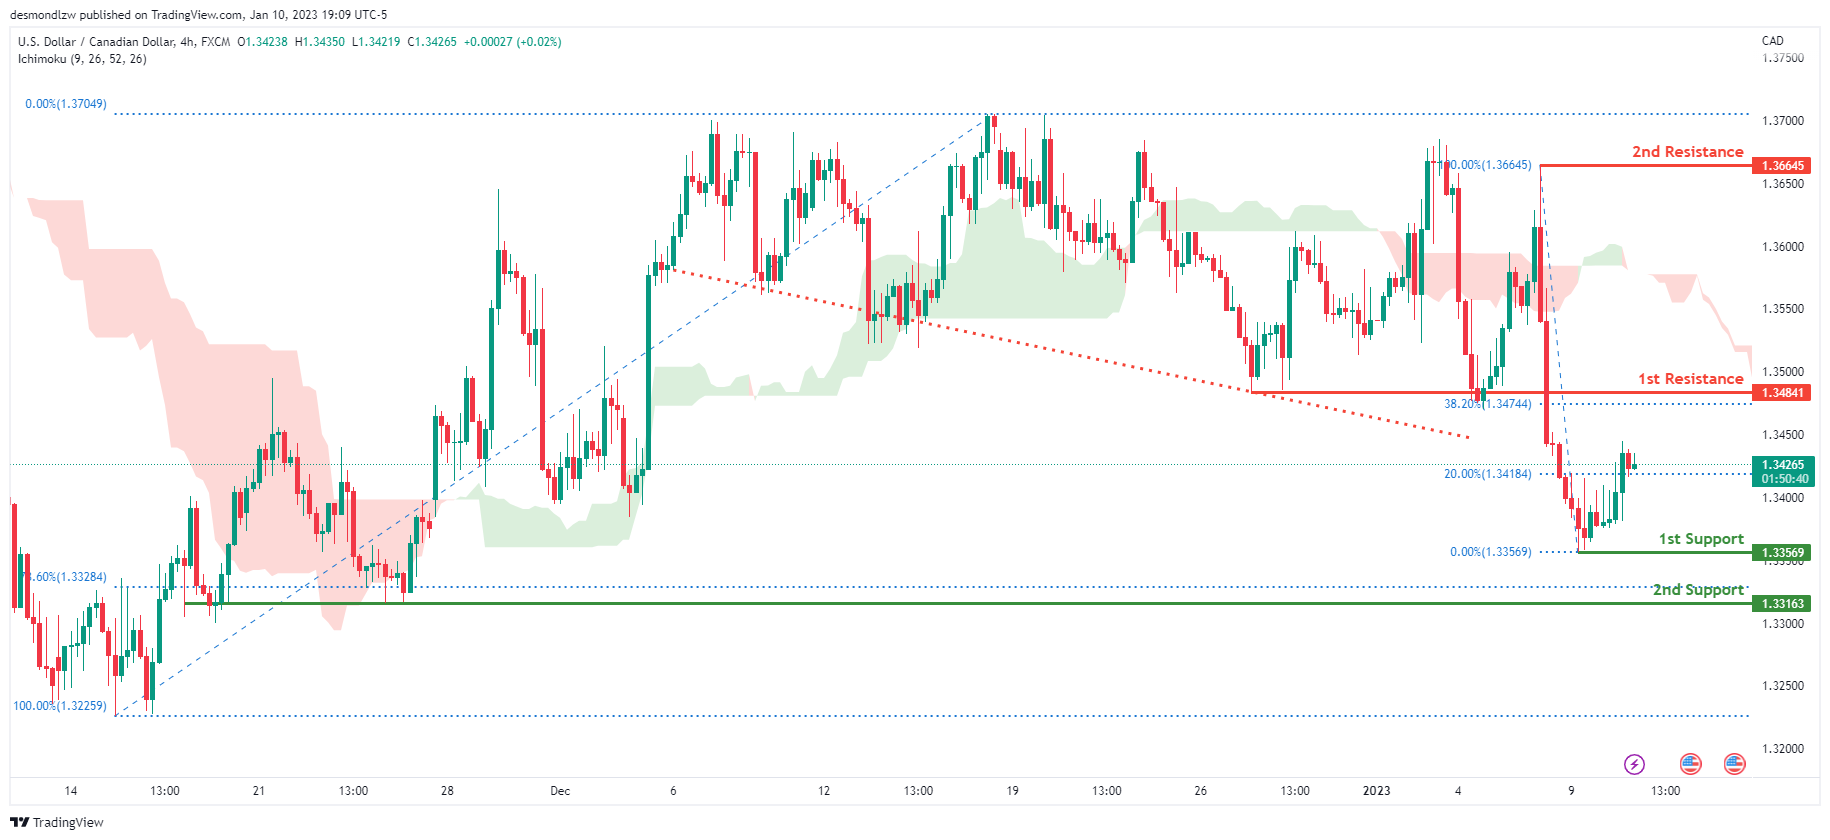
On the H4 chart, the overall bias for USDCAD is bearish. To add confluence to this, the price is below the Ichimoku cloud which indicates a bearish market. To add support to this bias, price has also broken under the descending trendline indicating strong bearish momentum. If this bearish momentum continues, expect the price to possibly head towards the 1st support at 1.33569, where the recent low is. In an alternative scenario, price could head back up to retest the 1st resistance at 1.34841, where the 38.2% Fibonacci line is.
Areas of consideration:
- H4 time frame, 1st resistance at 1.34841
- H4 time frame, 1st support at 1.33569
OIL:
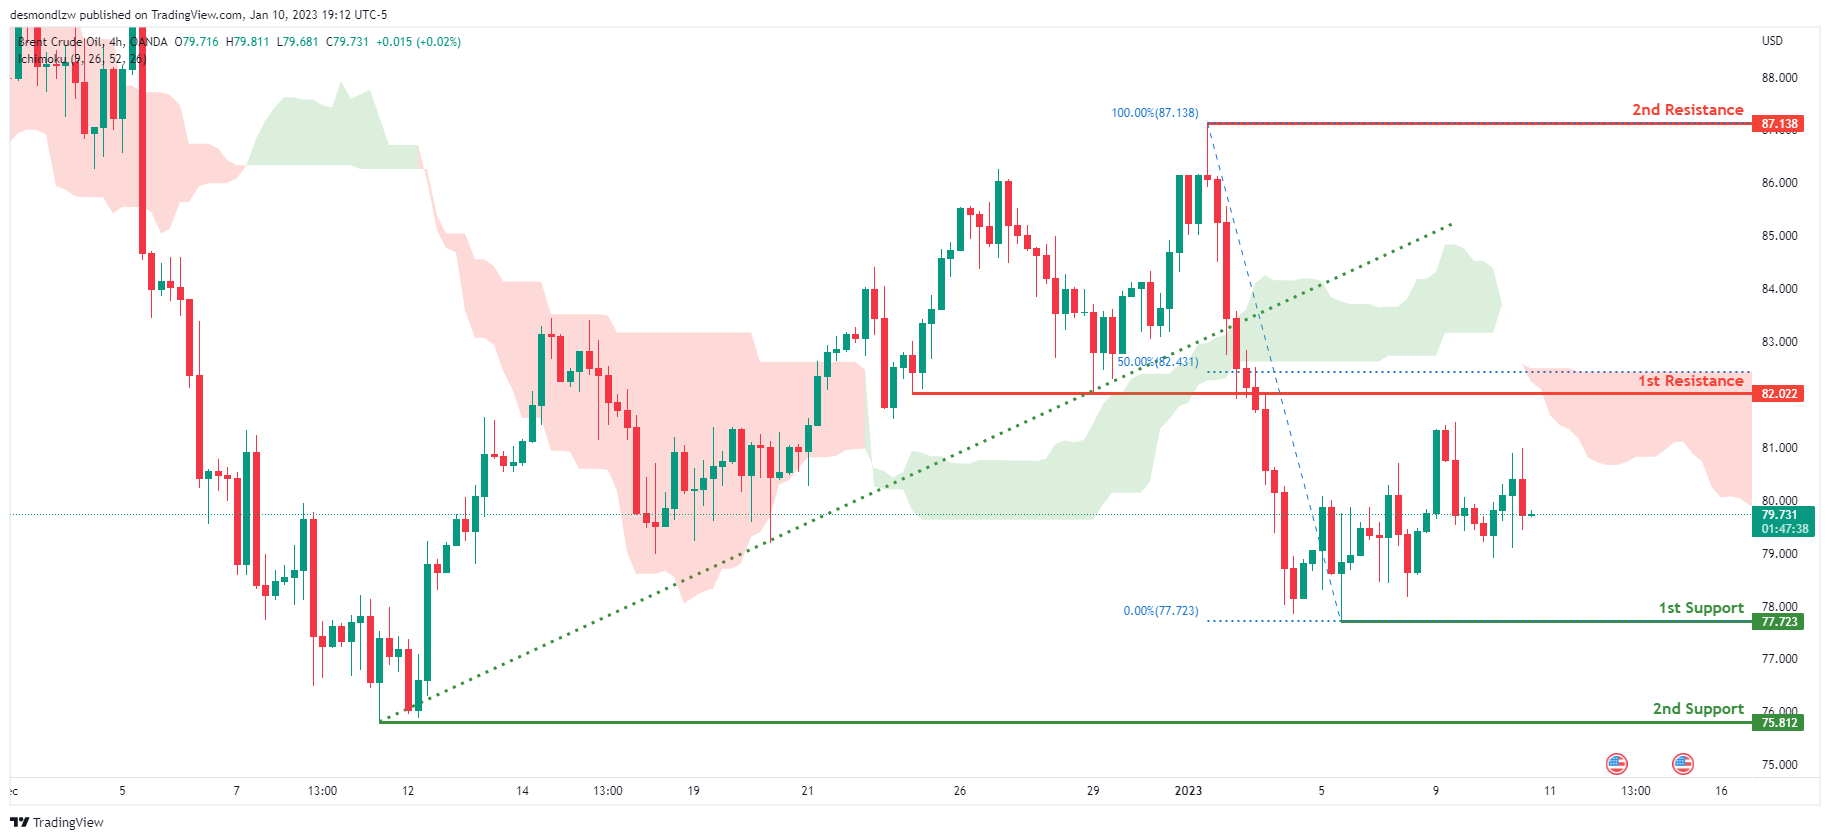
Looking at the H4 chart, my overall bias for BCOUSD is bearish due to the current price crossing below the Ichimoku cloud, indicating a bearish market. Adding more confluence to this bias, price has also broken the ascending trend line. If this bearish momentum continues, expect the price to possibly continue heading towards the 1st support at 77.723, where the recent low is. In an alternate scenario, price could possibly head back up to retest the 1st resistance at 82.022, slightly below where the 50% Fibonacci line is
Areas of consideration:
- H4 time frame, 1st resistance at 82.022
- H4 time frame, 1st support at 77.723
Dow Jones Industrial Average:
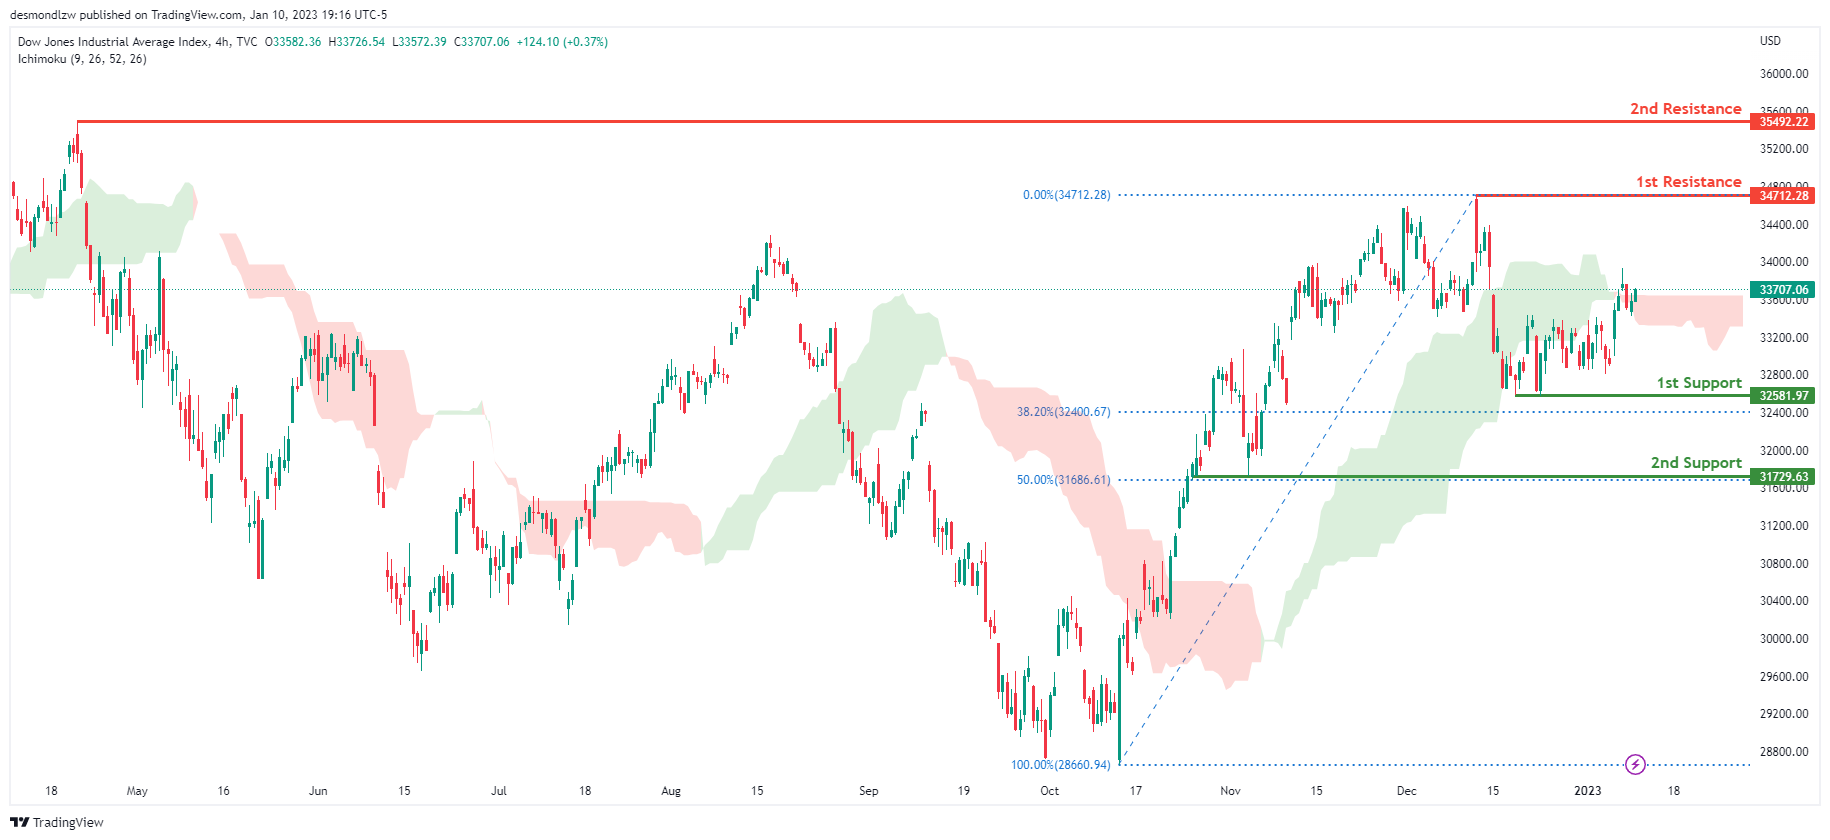
On the H4 chart, the overall bias for DJI is bearish. To add confluence to this, the price is crossing below the Ichimoku cloud which indicates a bearish market. If this bearish momentum continues, expect the price to head back down towards the 1st support at 32581.97, slightly above where the 38.2% Fibonacci line is. In an alternative scenario, price could possibly continue heading towards the 1st resistance line at 34712.28, where the recent swing high is.
Areas of consideration:
- H4 time frame, 1st support at 32581.97
- H4 time frame, 1st Resistance at 34712.28
DAX:
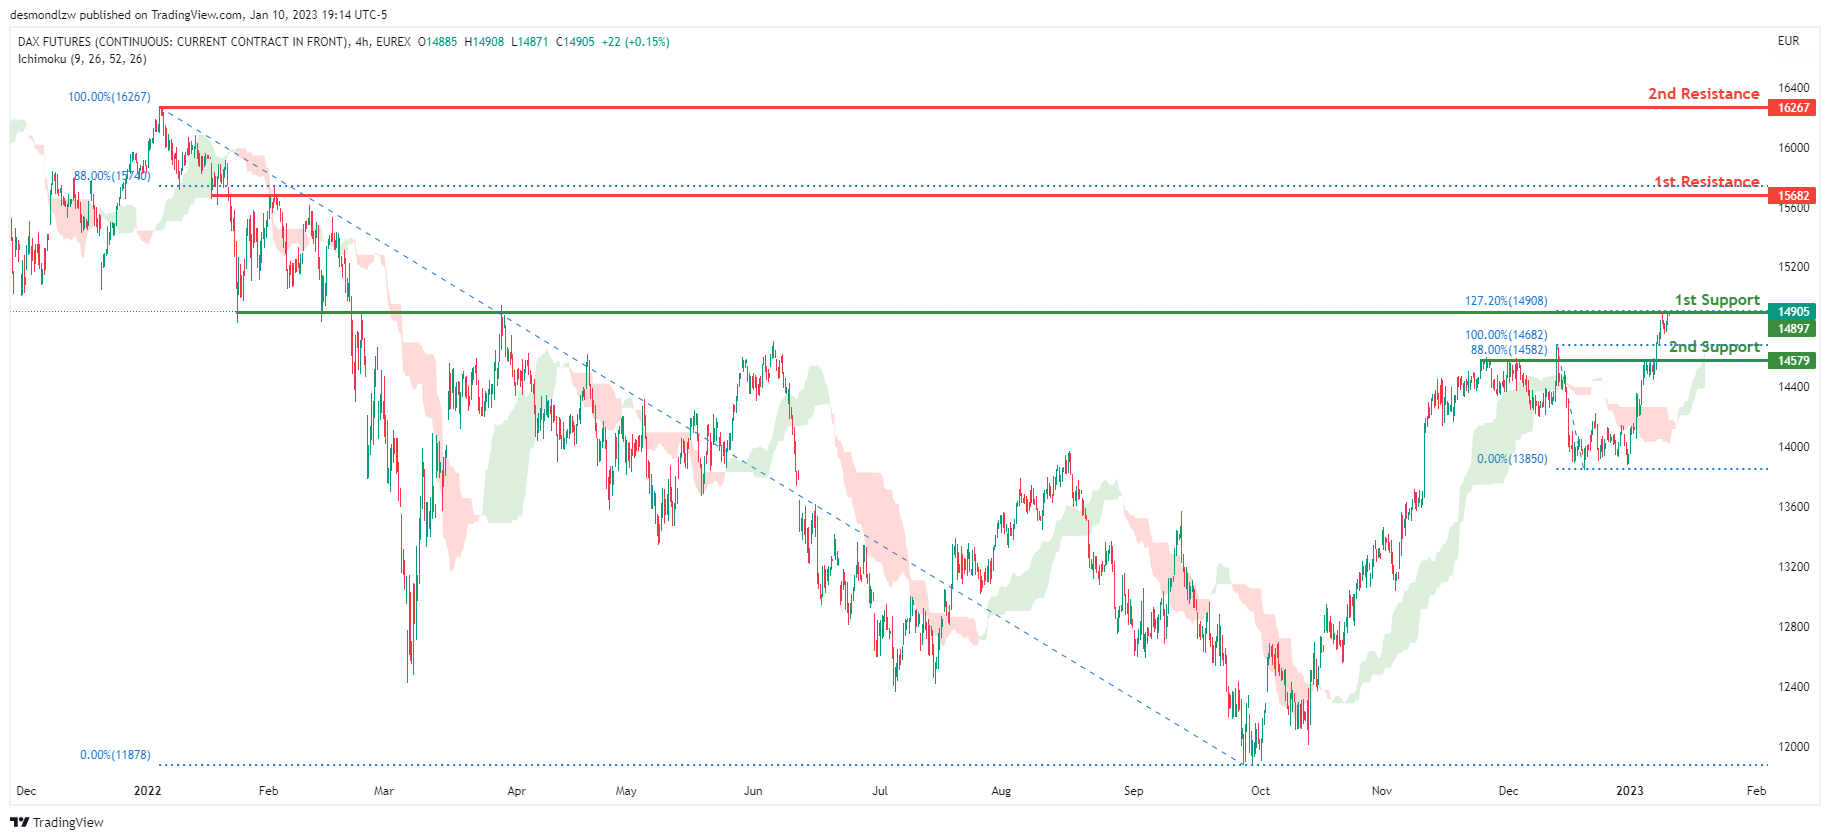
Looking at the H4 chart, my overall bias for DAX is bullish due to the current price crossing above the Ichimoku cloud, indicating a bullish market. If this bullish momentum continues, expect the price to possibly head towards the 1st resistance line at 15682, where the 88% Fibonacci line is. In an alternative scenario, price could possibly head down to break the 1st support at 14897, where the 127.2% Fibonacci extension line is, before heading towards the 2nd support at 14579, where the 88% Fibonacci line is.
Areas of consideration:
- H4 time frame, 1st resistance is at 15682
- H4 time frame, 1st support is at 14897
- H4 time frame, 2nd support is at 14579
ETHUSD:
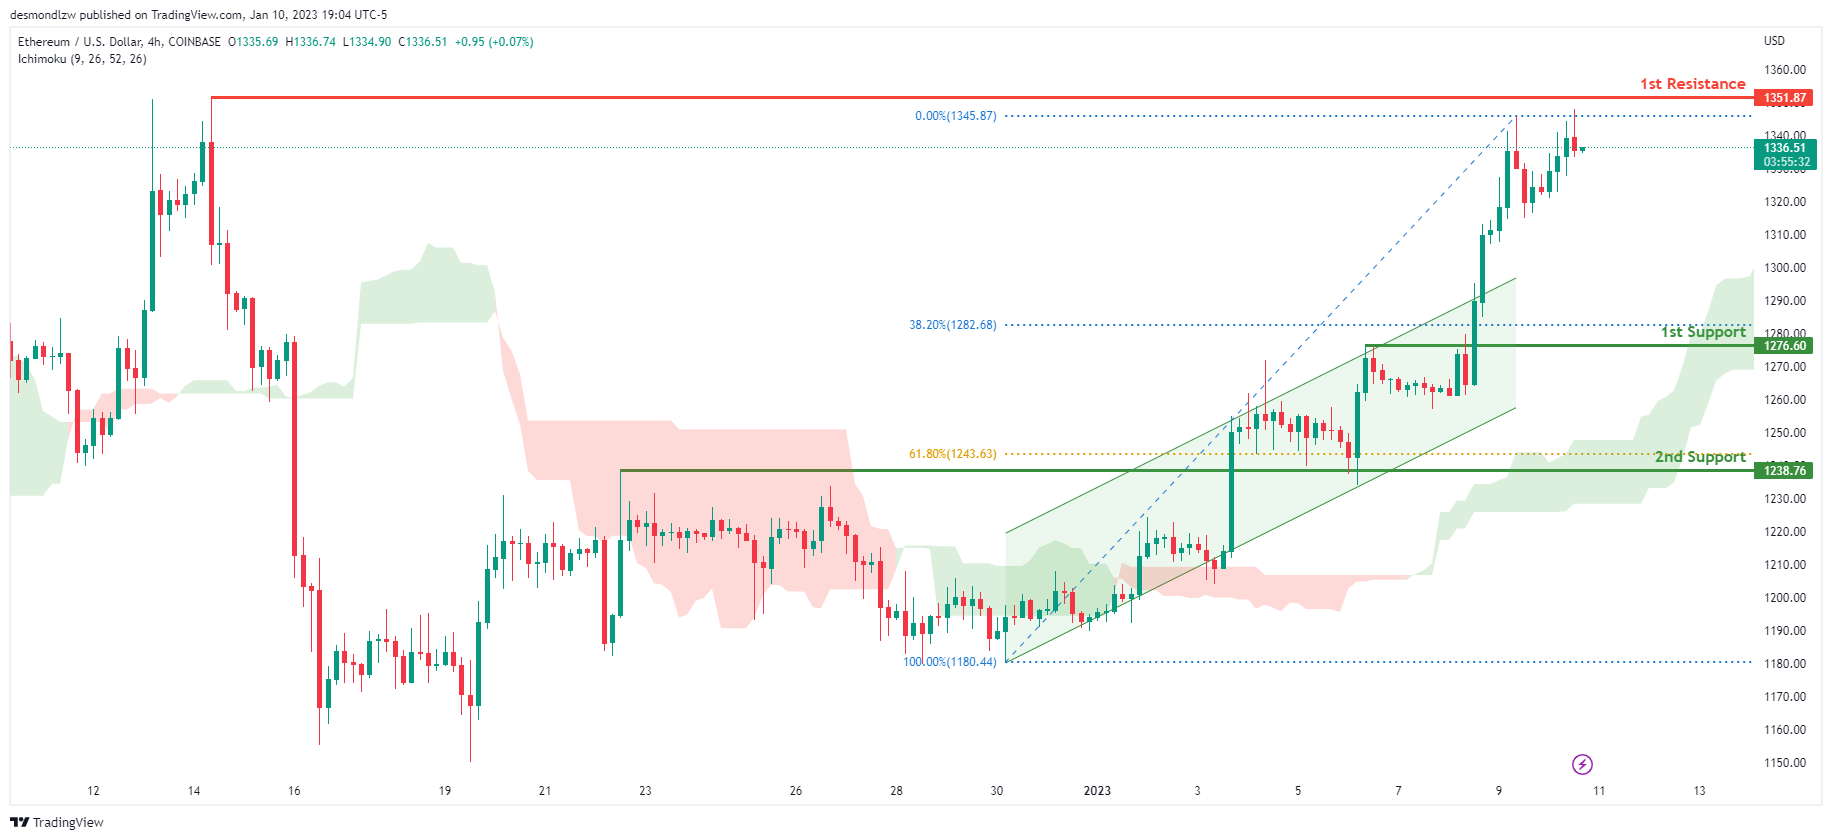
Looking at the H4 chart, my overall bias for ETHUSD is bullish due to the current price crossing above the Ichimoku cloud, indicating a bullish market. To add support to this bias, price is also broken upwards from an ascending channel. If this bullish momentum continues, expect the price to head towards the 1st resistance at 1351.87, where the previous swing high is. In an alternative scenario, price could head back down to retest the 1st support at 1276.60, where the 38.2% Fibonacci line is.
Areas of consideration:
- H4 time frame, 1st resistance of 1351.87
- H4 time frame, 1st support at 1276.60
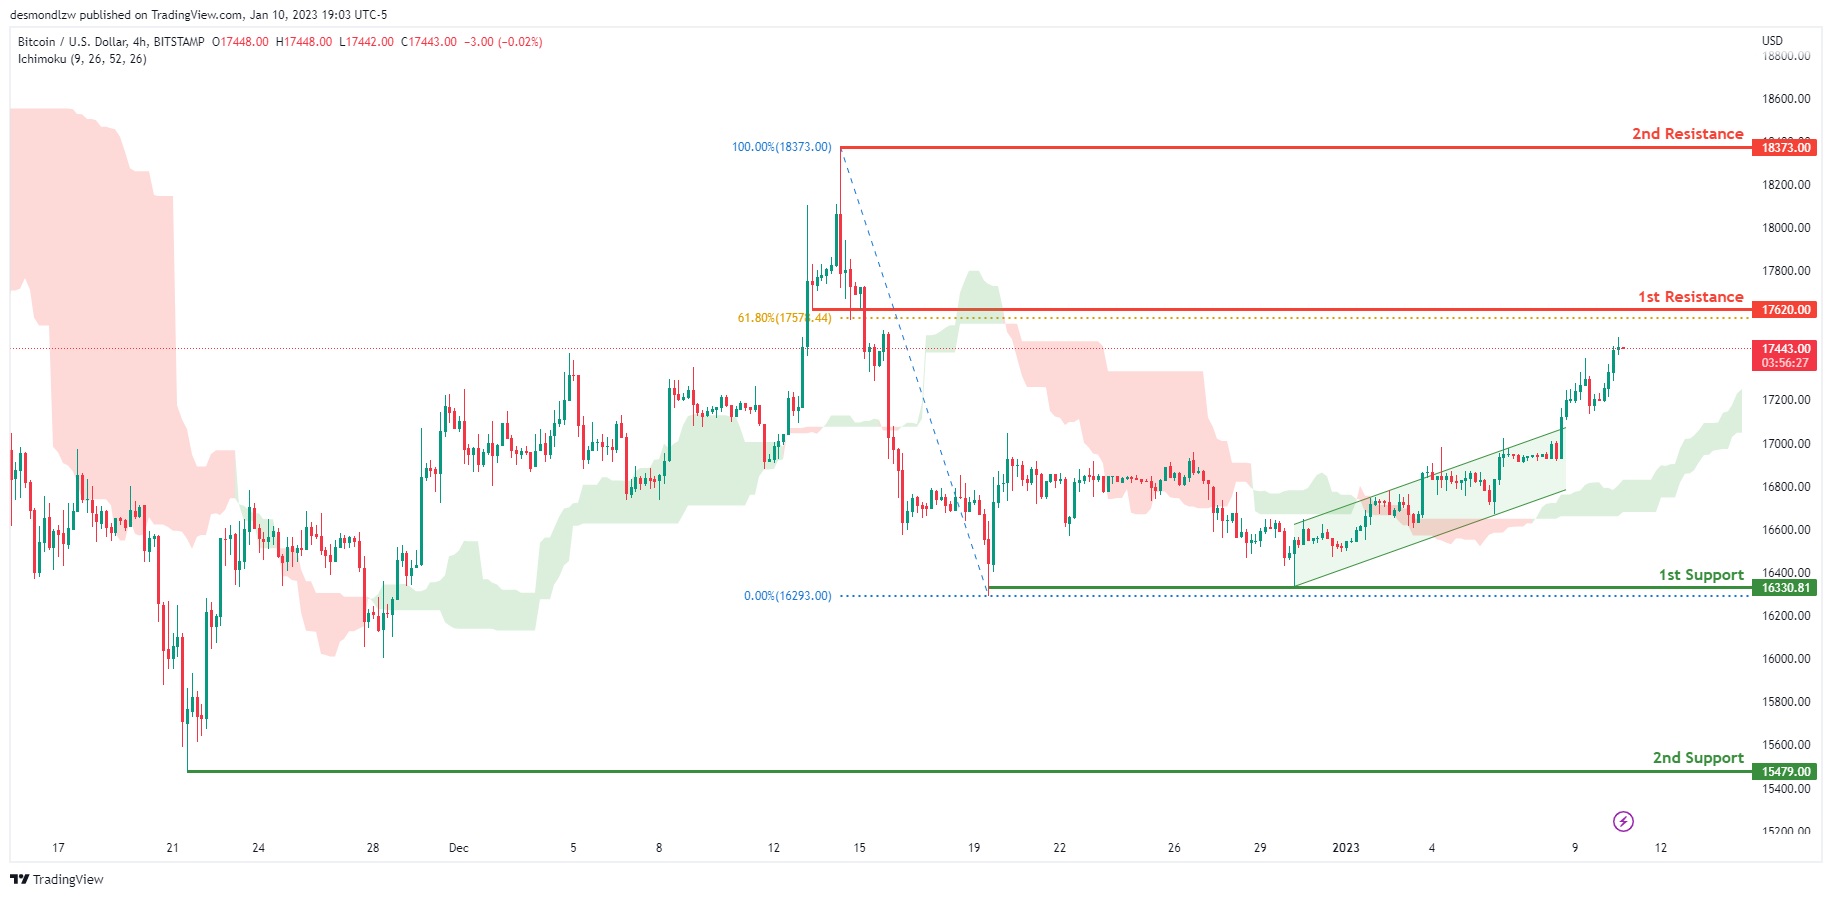
BTCUSD:
Looking at the H4 chart, my overall bias for BTCUSD is bullish due to the current price being above the Ichimoku cloud, indicating a bullish market. To add support to this bias, price is also within a bullish ascending channel. If this bullish momentum continues, expect the price to possibly continue heading towards the 1st resistance at 17620.00, where the 61.8% Fibonacci line is. In an alternative scenario, price could possibly head back down towards the 1st support at 16330.81, where the recent low and liquidity hotspot are.
Areas of consideration:
- H4 time frame, 1st resistance 17620.00
- H4 time frame, 1st support at 16330.81
S&P 500:
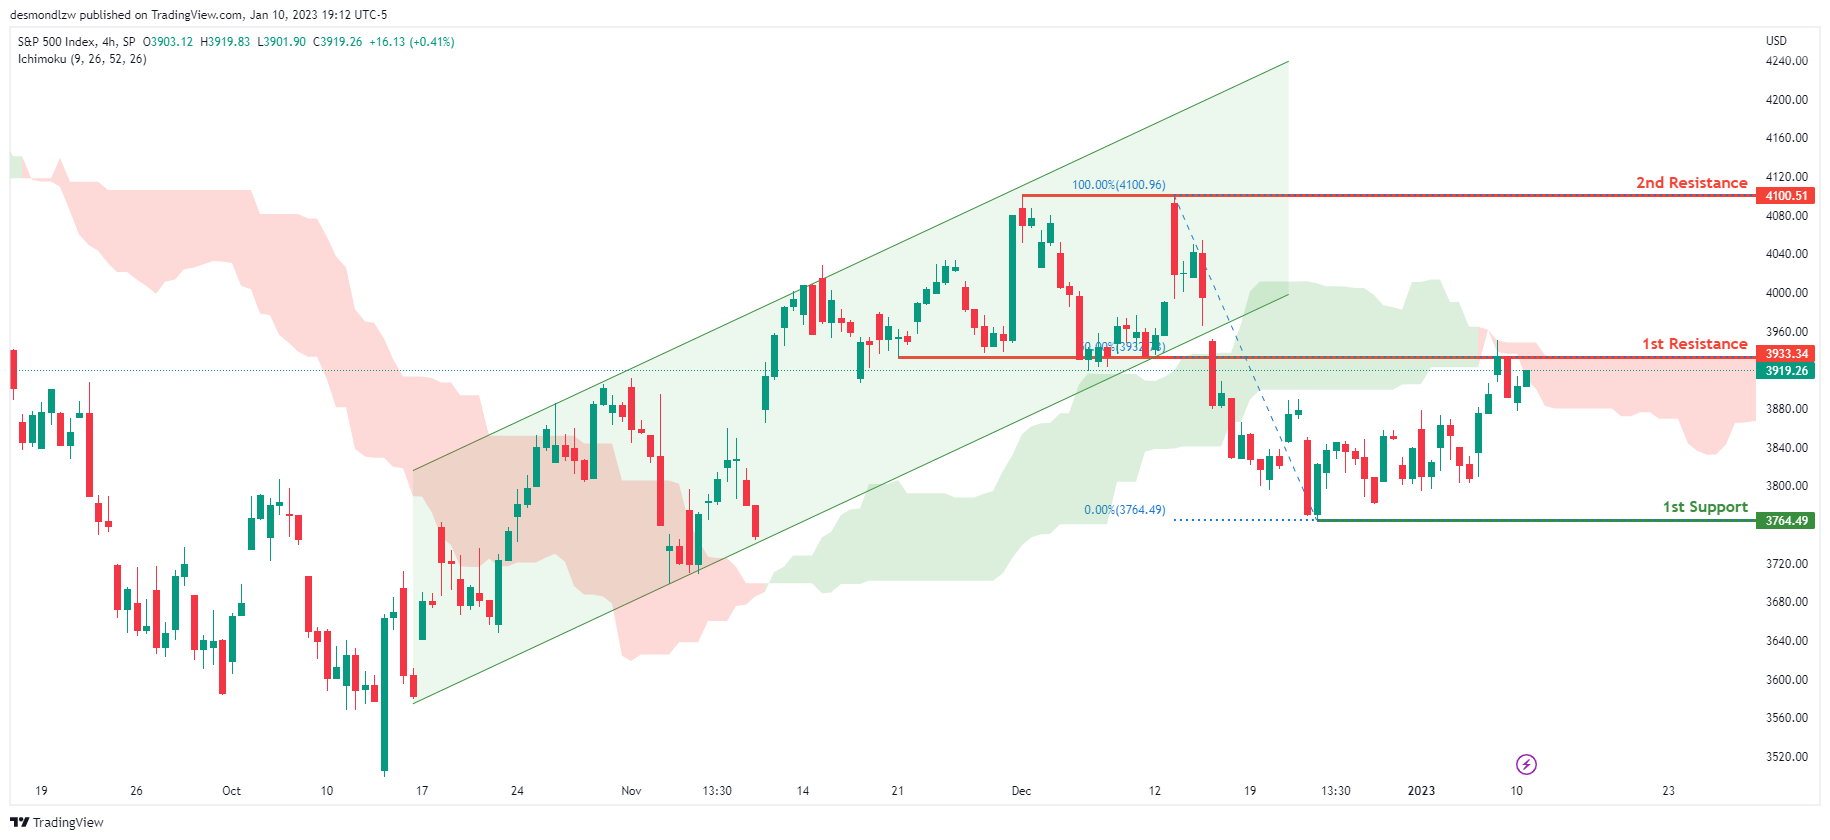
Looking at the H4 chart, my overall bias for S&P500 is bearish due to the current price being below the Ichimoku cloud, indicating a bearish market. If this bearish momentum continues, expect the price to continue heading towards the 1st support at 3764.49, where the recent low is. In an alternative scenario, price could possibly head back up to retest the 1st resistance at 3933.34, where the 50% Fibonacci line is.
Areas of consideration:
- H4 time frame, 1st support at 3764.49
- H4 time frame, 1st resistance at 3933.34
Australia retail sales rose 1.4% mom in Nov on Black Friday sales
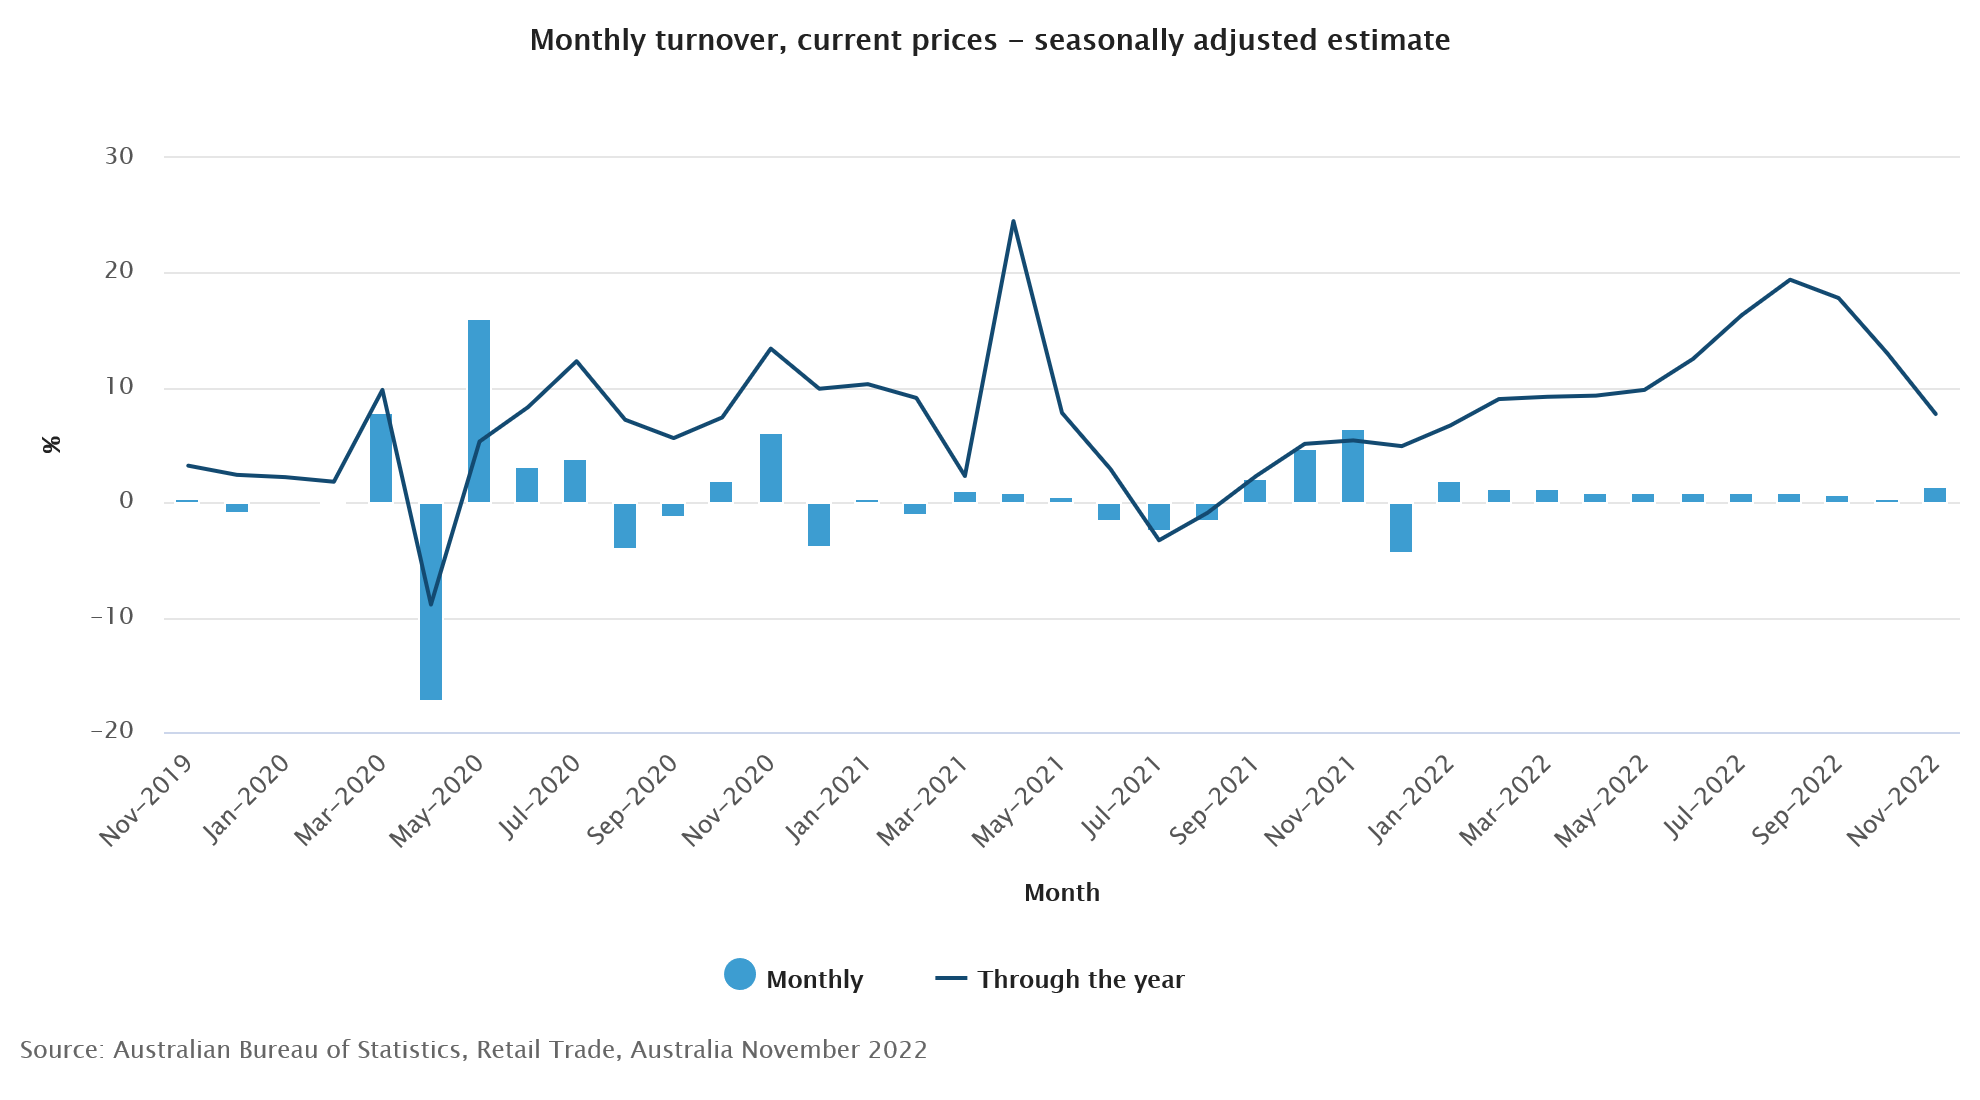
Australia retail sales rose 1.4% mom in November, well above expectation of 0.7% mom. The seasonally adjusted turnover of AUD 35.92B was a new record high.
Ben Dorber, ABS head of retail statistics, said, "While we typically see a rise in spending around Black Friday sales, the strong seasonally adjusted rise in November 2022 shows that the effect is increasing over time, as the event has become more common across retailers and sales periods become longer."
"Given the increasing popularity of Black Friday sales, the smaller increase in October may reflect consumers waiting to take advantage of discounting in November, particularly in light of cost-of-living pressures."
Australia monthly CPI rose back to 7.3% yoy in Nov, ongoing inflationary pressures
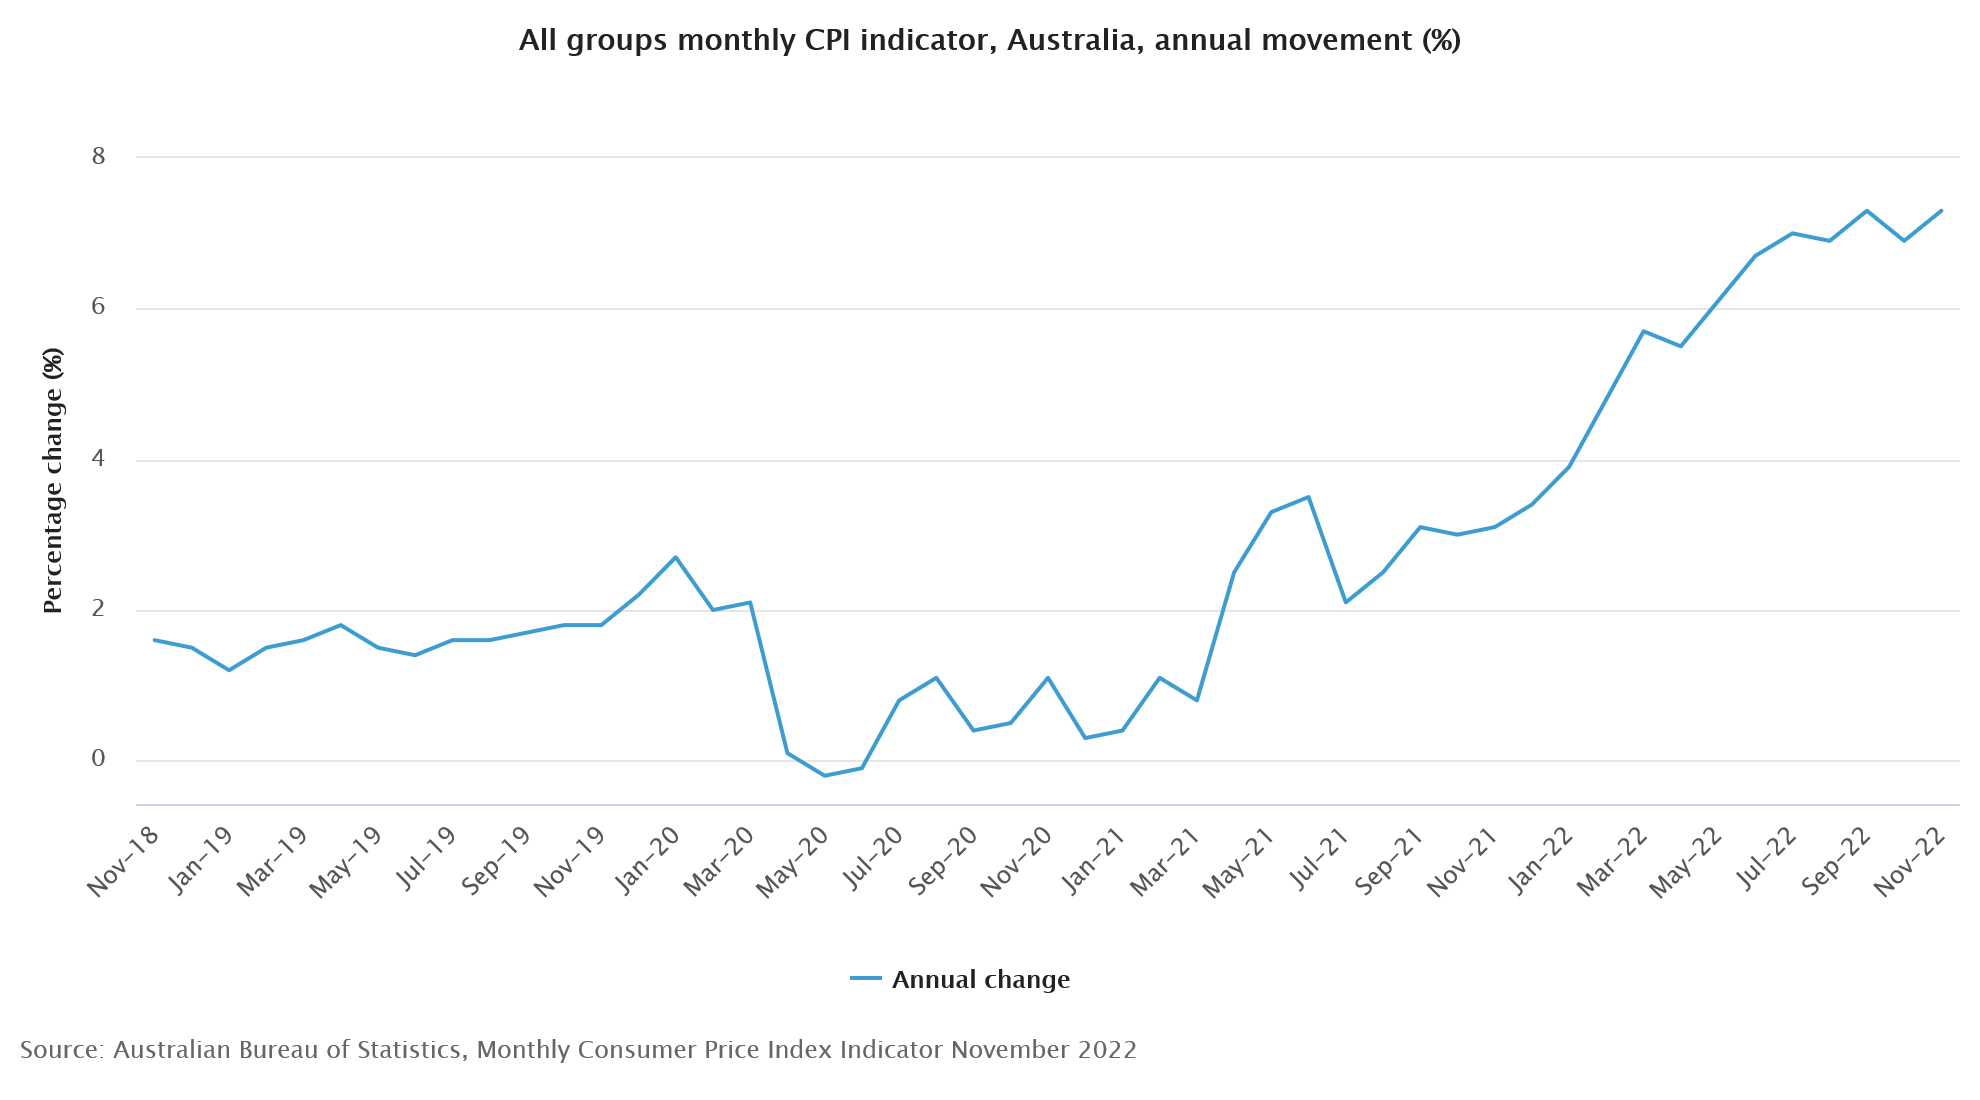
Australia monthly CPI accelerated from 6.9% yoy to 7.3% yoy in November, above expectation of 7.2% yoy.
Michelle Marquardt, ABS Head of Prices Statistics, said "This month's annual movement of 7.3% compares to 6.9% in October and 7.3% in September, indicating ongoing inflationary pressures."
The most significant contributors to the annual rise in November were Housing (+9.6%), Food and non-alcoholic beverages (+9.4 per cent), Transport (+9.0%), Furniture, household equipment and services (+8.4%) and Recreation and culture (+5.8%).
ECB Centeno: Inflation will fall again from March onwards
ECB Governing Council member Mario Centeno said yesterday, "we are approaching the end of the current process of interest rate hikes, I believe that is true."
Centeno said that "wage updates in Europe could make it difficult for prices to continue to fall" in the next two months, but "after that, inflation will fall again from March onwards."
Fed Bowman: Rates to remain at sufficiently restrictive level for some time
Fed Governor Michelle Bowman said in a speech, "In recent months, we've seen a decline in some measures of inflation but we have a lot more work to do, so I expect the FOMC will continue raising interest rates to tighten monetary policy, as we stated after our December meeting."
"My views on the appropriate size of future rate increases and on the ultimate level of the federal funds rate will continue to be guided by the incoming data and its implications for the outlook for inflation and economic activity."
"I will be looking for compelling signs that inflation has peaked and for more consistent indications that inflation is on a downward path, in determining both the appropriate size of future rate increases and the level at which the federal funds rate is sufficiently restrictive."
"I expect that once we achieve a sufficiently restrictive federal funds rate, it will need to remain at that level for some time in order to restore price stability, which will in turn help to create conditions that support a sustainably strong labor market."