Sample Category Title
GBP/USD Daily Outlook
Daily Pivots: (S1) 1.1924; (P) 1.2012; (R1) 1.2181; More...
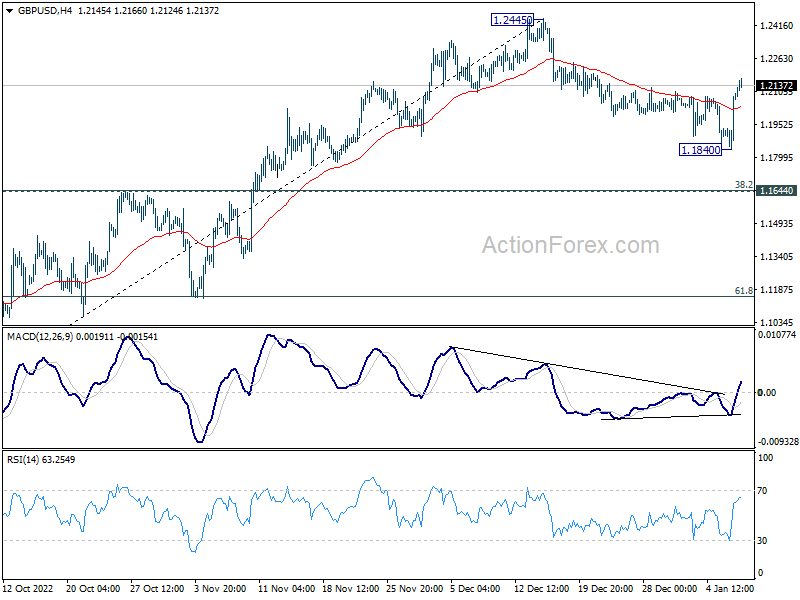
Intraday bias in GBP/USD remains mildly on the upside for the moment. Correction from 1.2445 could have completed after hitting 55 day EMA. Retest of 1.2445 high should be seen next. On the downside, however, break of 1.1840 will resume the decline to 38.2% retracement of 1.0351 to 1.2445 at 1.1645.
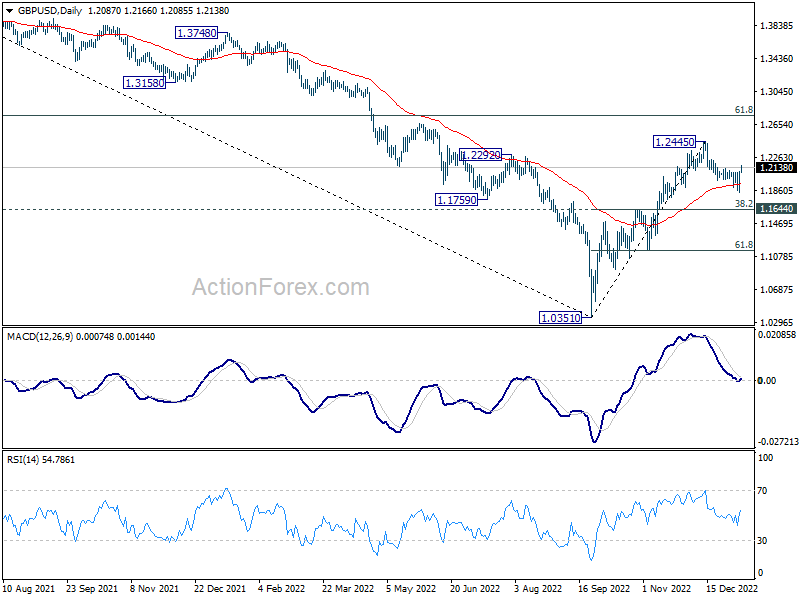
In the bigger picture, rise from 1.0351 medium term bottom is at least correcting whole down trend from 1.4248 (2021 high). Further rise is expected as long as 1.1644 resistance turned support holds. Next target is 61.8% retracement of 1.4248 to 1.0351 at 1.2759. Sustained break there will pave the way back to 1.4248.
USD/CHF Daily Outlook
Daily Pivots: (S1) 0.9228; (P) 0.9319; (R1) 0.9368; More...
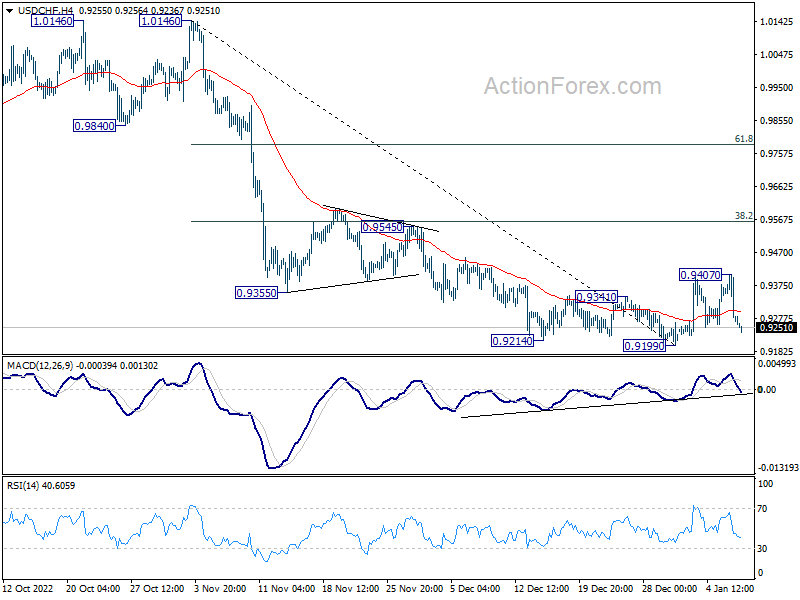
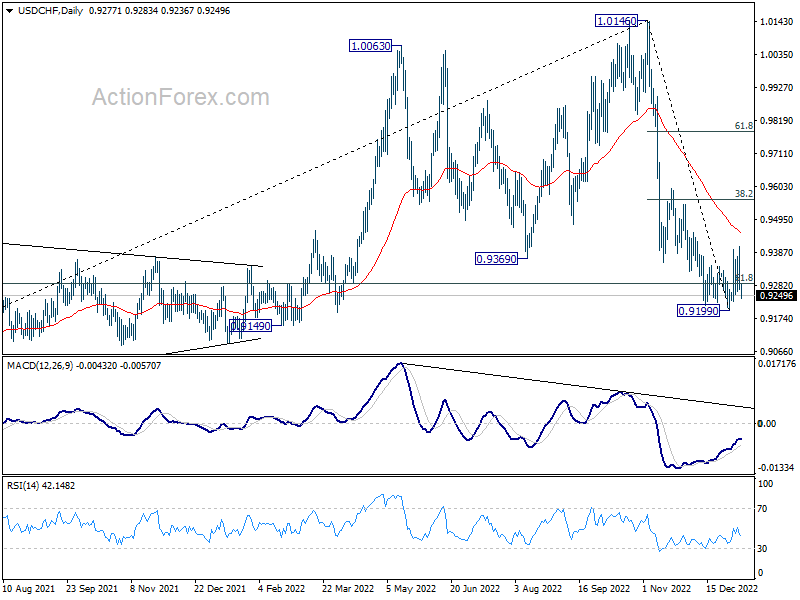
Intraday bias in USD/CHF remains neutral for the moment. On the upside, break of 0.9407 will resume the rebound to 38.2% retracement of 1.0146 to 0.9199 at 0.9561. However, firm break of 0.9199 will resume the whole decline from 1.0146 instead.
In the bigger picture, rise from 0.8756 (2021 low) has completed at 1.0146, well ahead of 1.0342 long term resistance (2016 high). Based on current downside momentum, fall from 1.0146 might be a medium term down trend itself. Sustained break of 61.8% retracement of 0.8756 to 1.0146 at 0.9287 will pave the way to 0.8756. In any case, risk will stay on the downside as long as 0.9545 resistance holds.
USD/JPY Daily Outlook
Daily Pivots: (S1) 131.14; (P) 132.96; (R1) 133.92; More...
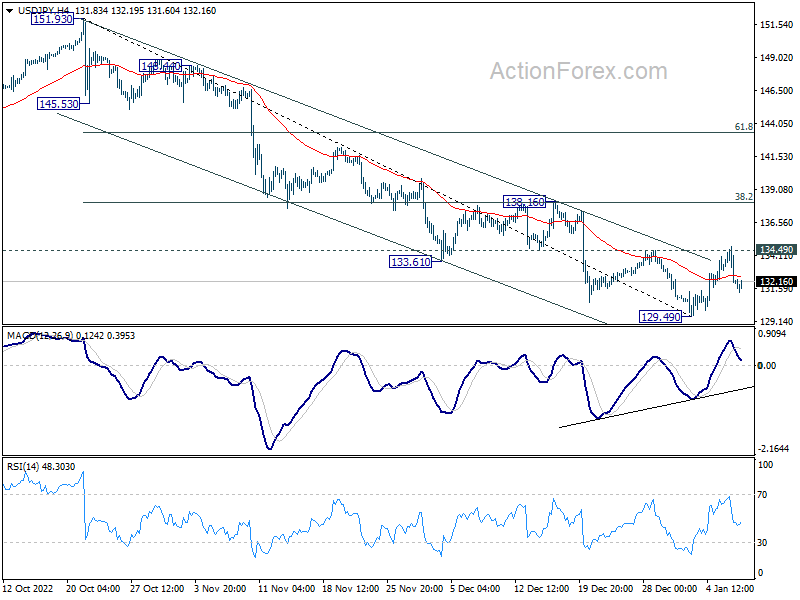
Intraday bias in USD/JPY remains neutral for the moment. On the upside, firm break of 134.49 should confirm short term bottoming, and bring stronger rise to 138.16 cluster resistance (38.2% retracement of 151.93 to 129.49 at 138.06). However, break of 129.49 will resume the whole decline from 151.93 instead.
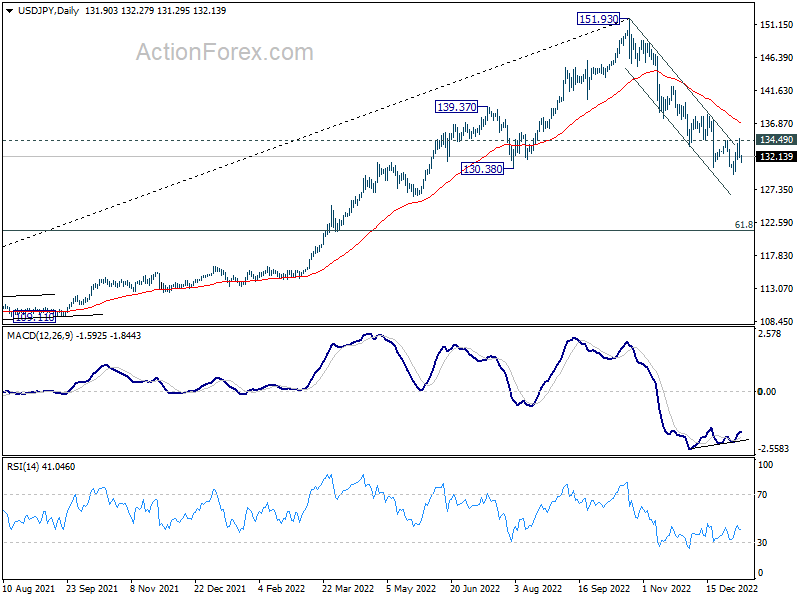
In the bigger picture, a medium term top was in place at 151.93. Sustained trading below 55 week EMA (now at 131.73) would raise the chance of bearish trend reversal. Deeper fall would be seen to 61.8% retracement of 102.58 to 151.93 at 121.43. This will now remain the favored case as long as 55 day EMA (now at 137.08) holds.
USD/CAD Daily Outlook
Daily Pivots: (S1) 1.3365; (P) 1.3515; (R1) 1.3596; More....
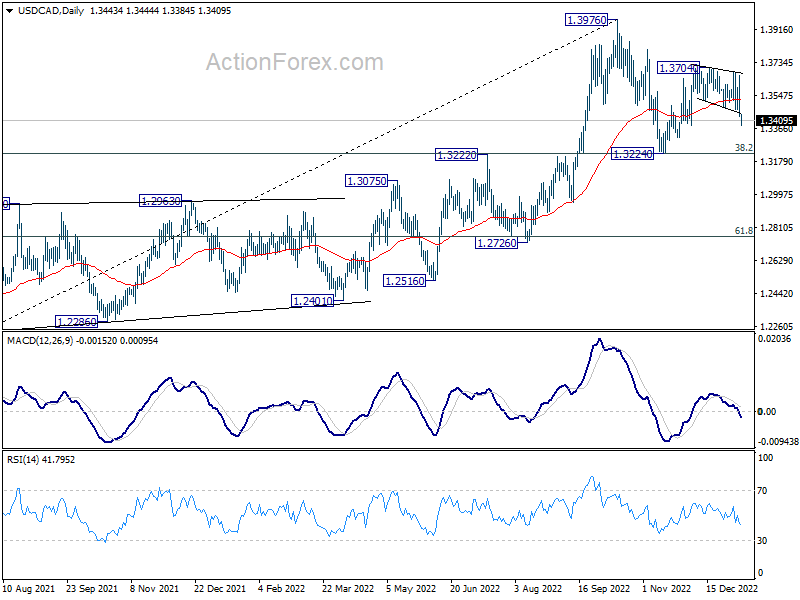
USD/CAD drops further today and intraday bias stays on the downside. For now, price actions from there are still more likely corrective than not. Hence, while deeper decline could be seen, downside should be contained well above 1.3224 low. On the upside, break of 1.3704 will confirm resumption of the rise from 1.3224.
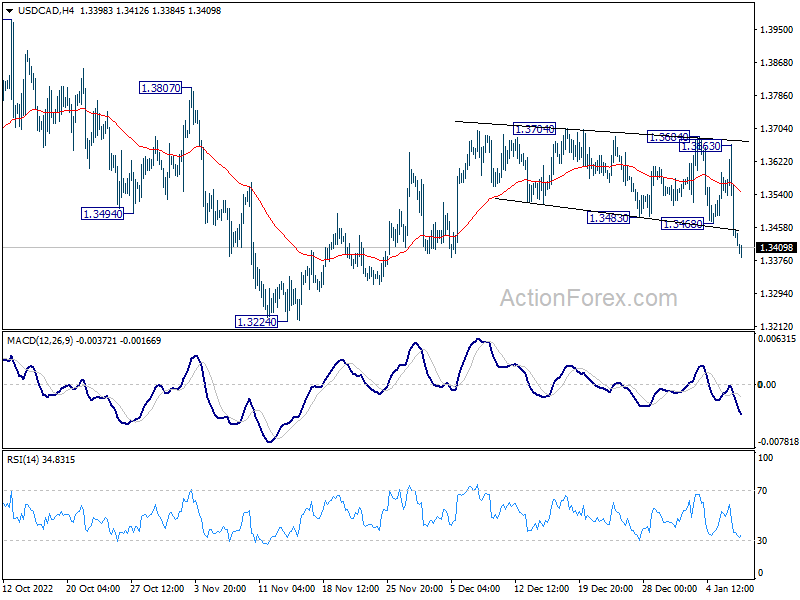
In the bigger picture, as long as 1.3222 cluster support (38.2% retracement of 1.2005 to 1.3976 at 1.3223) holds, larger up trend from 1.2005 (2021 low) is still expected to resume through 1.3976 high at a later stage. However, firm break of 1.3222/3 will indicate that the trend might have reversed. Deeper fall would be seen to next cluster support at 1.2726 (61.8% retracement at 1.2758).
Probability of a 50 bps Fed Rate Hike in February fell
Markets
It was not about the December US payrolls report last Friday, but about the non-manufacturing ISM. The post-payrolls reaction – zooming in on slightly disappointing wage growth rather than on all other strong employment components, especially in the household survey – already suggested a willingness to respond in case of a below-consensus ISM. And that’s exactly what happened when the ISM (49.6 from 56.5) was not only below consensus (55), but also below the lowest estimate from the economic panel (53.3) and even below the 50 boom/bust mark for the first time since May 2020. Details showed a steep decline in overall business activity (54.7 from 64.7) and new orders (45.2 from 56 and also first <50 outcome since May 2020). The employment component returned below par (49.8 from 51.5) with prices paid still high in absolute terms (67.6), but the dynamic slowing. Supplier deliveries fell from 53.8 to 48.8, the lowest since 2015, and suggesting that supply side bottlenecks are evaporating.
Based on US money markets, the probability of a 50 bps Fed rate hike in February fell from roughly 50% to roughly 25%. If Fed chair Powell stresses that core services inflation is the one to follow, then that’s the consequence of the awful services ISM. Looking beyond that early February Fed meeting, money markets put the policy rate peak at 5% while sticking with the view that rate cuts will follow in H2 2023. Both go firmly against all Fed guidance, including in several speeches delivered only a week ago, an our house view. Returning to Friday’s market moves, core bonds leaped higher with US Treasuries outperforming German Bunds. Daily changes on the US yield curve varied between -22.4 bps (3-yr) and -10.7 bps (30-yr) with the curve turning less inverse. German yields lost 5.9 bps (2-yr) to 10.5 bps (10-yr). The dollar lost out against all majors. The trade-weighted greenback closed the week below 104, with the December sell-off lows approaching (103.39). EUR/USD erased all of the early January losses, surging from 1.0522 to 1.0644 and extending the gains this morning. Equity markets embraced their goldilocks scenario (strong labour market, weakening inflation pressure and expectations on near Fed policy reversal), rebounding 2% to 2.5% for all major US indices.
Asian risk sentiment remains buoyant this morning. Japanese markets are closed for Coming-of-age day. Eco calendars are empty on both sides of the Atlantic and across the Channel apart from speeches by central bank governors. It suggests that the post-ISM momentum could be extended. Later this week, we pay attention to the US refinancing operation as well as to EMU (new) supply in light of the ECB’s exit as a net buyer. Eco data include US CPI inflation (Thursday) and University of Michigan consumer confidence (January) on Friday.
News Headlines
Czech Central Bank governor Michl reiterated the CNB baseline scenario that inflation is expected to slow considerably from spring, even as inflation might still go up in the first two months of the year. At the same time, the CNB governor stressed that spending from both consumers and the government needs to ease down in order to tame inflation and prevent that the CNB needs to raise rates further. Consumers should save and wage growth demands should stay moderate. The government should keep the budget deficit as low as possible and be cautious on boosting welfare spending and provide subsidies that go against the restrictive CNB policy. At EUR/CZK 23.96, the Czech korona currently trades near the strongest level since early 2011 when it touched the EUR/CZK 23.93 level.
The Indian government expects economic growth in the fiscal year 2022/23 ending in March to slow to 7%, compared to 8.7% in the fiscal year 2021/22. Earlier, the government expected growth in the 8-8.5% range. Construction growth was projected at 9.1%, electricity at 9% and agriculture at 3.5%. Manufacturing and mining growth were forecast at 1.6% and 2.4%. In an interview with the Financial Times, the governor of the Central Bank of India, Shaktikanta Das, indicated that he was optimistic about India’s growth and financial stability. However, the fall-out of growing debt distress among regional trading partner might have spillovers toward India’s economy. India’s foreign exchanges reserves have declined from a peak in 2021 due to interventions to stabilize the currency. However, at the current level of reserves of about $563 bln, Das sees this as a still ‘very comfortable level’.
Goldilocks?
Friday’s jobs data in the US, and more specifically, the market reaction to Friday’s jobs data helped stock markets to record their best boost since more than a month on Friday.
However, Friday’s jobs report was rather… mixed, and spurred a lot of discussions and debates regarding whether the data was soft enough to convince the Federal Reserve (Fed) officials that the inflation battle is over, or it was strong enough to make them further scratch their heads.
The NFP printed 223’000 nonfarm job additions last month versus 200’000 expected by analysts.
But the average job additions for the last three months of last year was a touch below 250’000, down from 366’000 from the prior three-month stretch, and less than half of around 540’000 jobs added each month in the first quarter of 2022.
Plus, the tech industry shed job - in line with the headlines we have been reading since months. Goldman just announce it will be cutting 3200 positions, on top of 18’000 job cuts announced by Amazon last week, among others.
So, the trend in the US jobs market is on a slowing path, even though, monthly job addition prints above 200’000 are far from numbers you expect to see in recession.
But that’s the good news. The Fed is not looking to push the US economy into recession for fun, it wants to see the jobs market tighter because, in theory, a tighter jobs market should help ease inflation.
But if inflationary pressures ease with little negative impact on jobs, that’s what we call the goldilocks scenario: a soft-landing from the ultra-supportive monetary policy euphoria, easing inflation without too much pain on jobs market.
In other words, it’s jackpot for the Fed!
This is why, the US markets gave such a strong positive reaction to Friday’s jobs data. Both the US 2 and 10-year yields fell more than 4% after the data, pulling the US dollar index lower along with them. The S&P500 jumped around 2.30%, while Nasdaq 100 rallied near 2.80%.
Gold reached our $1880 per ounce medium term target, boosted by lower US yields, which made the opportunity cost of holding the non-interest-bearing gold lower, and increased appetite.
But we should still not forget one thing: the US economy added around 4.5 million jobs last year- That was the second best year on record after 2021 – where 6.4 million Americans found jobs following the pandemic-shattered economy. The unemployment data hit 3.5%, a multi-decade low, and Atlanta Fed President Raphael Bostic said that the central bank still needs to keep raising the rates despite the cooler-than-expected wages data.
‘Good’ bad news is that the December services PMI fell to below 50, the contraction zone, in December, adding some more evidence that the US economic activity is slowing. And that’s something that the Fed is happy to hear.
Activity on Fed funds futures now price in a 25bp hike at the next FOMC meeting at around 75%, but the Fed has not hesitated to disappoint markets since last year to cool down the optimism and send the stocks to turmoil. So the dovish pricing in Fed expectations make the latest gains a bit bitter-sweet, as the slightest news, or hints that the Fed would not step back from its hawkish tone could vanish the latest rally.
So, this week’s US inflation data will be key in either giving the bulls a further boost or bringing back the bears with revenge.
On Tuesday, Fed Chair Jerome Powell will speak, and he may not hesitate to abate the Fed doves on rate expectations.
On Thursday, the US CPI data will likely reveal an encouraging easing. The US CPI is expected to have eased to 6.5% in December from 7.1% printed a month earlier, and from 9.1% printed last summer. If that’s the case, the rapid fall in inflation figures could further boost the Fed hawks and help stocks and bonds extend rally, and the dollar extend drop. But if we see a smaller easing in December inflation, or a figure higher than last month’s, the latest gains could rapidly vanish.
Earnings season kicks off
Earnings season kicks off this week, with Jefferies and Tilray due to report their latest earnings today, Bed, Bath and Beyond – which warned last week that it could go bankrupt – is due to reveal its latest results on Tuesday, while JP Morgan, Bank of America, Wells Fargo, Blackrock, Citigroup, Bank of New York and Delta Air Lines will announce their Q4 earnings on Friday.
For banks, investors will focus on the level of bad loan provisions and mortgages, as rising interest rates are good for earnings, but higher-than-expected interest rates threaten credit quality, loan growth, and net interest margins.
Big CPI Week
Market movers today
It is the big CPI week with US inflation on Thursday as the highlight. It will be yet another key input to whether the Fed hikes 25bp or 50bp at the February meeting. CPI releases are also due in Sweden, Norway and Denmark. More Fed speeches this week will also be interesting to gauge Fed members' interpretation of the last employment report last week.
Today we kick off the week with Euro Sentix, which tends to lead Euro PMI 1-2 months. It has improved the past two months but from low levels. Euro unemployment will give more input to whether weaker activity is feeding through to the tight labour market. Consensus is for an unchanged rate at 6.5%. German industrial production is also due this morning, which follows very weak German factory orders released Friday.
The 60 second overview
Soft US data: While a lower-than-expected average hourly earnings sparked a modest market rally after the Jobs Report release, the main market mover of Friday was the clear downside surprise in December ISM Services, which sent equities and EUR/USD higher amid easing rate hike fears. The new orders index recorded the largest monthly decline since the initial Covid-shock. While private consumption and the service sector have been surprisingly resilient so far, majority of the leading indicators are now on recessionary territory, supporting our call for a modest US recession from Q2. The Jobs Report illustrated that the growth in US wage sum is now returning to more normal levels, which combined with easing economic activity suggests that Fed is moving in the right direction.
However, the easing of financial conditions from lower bond yields, weaker USD and higher equities may challenge the Fed as it could drive an earlier recovery and make inflationary pressures rebound.
Fed speakers cautious: After the data releases, Fed's Bostic and Barkin sounded open to more gradual rate hikes, but still cautioned against prematurely easing monetary policy. Bostic said he still favoured raising rates above 5%, 75bp higher than todays level. The market now prices two hikes of 25bp. We look for a 50bp hike in February, and expect Core CPI to pick up to 0.3% on Thursday, but the recent data has decreased the risk of Fed having to hike much beyond 5%.
ECB's Lane says wages to keep pressure on inflation: ECB's Chief Economist and member of the Governing Council Philip Lane cautioned on Friday against putting too much into the decline in energy prices saying the original energy shock from the Russia's war in Ukraine would feed into wages for two to three years. He also stated, though, that long-term inflation expectations are strongly anchored and stressed that due to the high uncertainty policy will be data-dependant.
Pro-Bolsonary rioters storms government institutions: Tens of thousands of anti-democratic demonstrators on Sunday invaded the Supreme Court, Congress and the presidential palace. Late on Sunday, Brazil's Supreme Court removed the Governor of Brasilia from office for 90 days for flaws in security.
China reopened borders on Sunday: China removed one of the last pieces of the zero-covid policy on Sunday when borders were re-opened for inbound travellers. It is set to boost both inbound and outbound travelling as business people and Chinese living abroad have waited for this to happen and Chinese tourists can now travel again. It is likely to lead to a boost in airline traffic and lift oil demand.
Equities: Not all good news are bad news for markets. A strong job market accompanied by weakening wages sent equities into risk on (478 of all 500 companies in green). Cyclicals led the gains, including materials, tech, real state and industrials adding 3% in the US session. Alike the past three weeks, this did not translate into a growth-vs-value rally, but instead both styles gained in tandem. All in all, a very strong week for equities with Europe and Stockholm up 5% and US and Nordics 2% (basically back at last month's high).
Credit: Last week marked a busy start to the year in terms of primary issuance particularly from FIG issuers, with more than EUR33bn priced in euros as well as some EUR7bn of corporate debt being issued. It seems that issuers are eager to front-load their supply given the well-flagged macro risks lurking ahead, and this also seems to be reflected by the fact that we have already seen five subordinated notes issues as well as several issuers being active in the market in various formats and currencies. Spreads seem to have held up well with iTraxx Main tightening 9bp during the week to 82bp including 5bp on Friday alone, while Xover has tightened by 48bp to 426bp (Friday: tigher by 23bp).
FI: US government bond yields collapsed on Friday after the lower than expected wage growth as well as lower than expected ISM service. Hence, the labour market was not as strong as seen on the surface. 10Y US Treasury declined more than 15bp on Friday, while 2Y yields declined 20bp.
FX: USD dropped following the US jobs report on Friday, where the market took note of slowing wage growth. EUR/USD rebounded above 1.06 and USD/JPY dropped below 132 again. CNH continues to strengthen against USD on China's reopening.
Nordics
There are no key movers today but we await the batch of CPI data coming out this week with Norway and Denmark releases on Tuesday and Sweden on Friday, see Weekly Focus for comments on each country.
AUD/USD Daily Report
Daily Pivots: (S1) 0.6770; (P) 0.6828; (R1) 0.6935; More...
AUD/USD's break of 0.6892 resistance confirms resumption of whole rise from 0.6169. Intraday bias is back on the upside for 61.8% projection of 0.6169 to 0.6892 from 0.6721 at 0.7444. For now, outlook will stay bullish as long as 0.6721 support holds, in case of retreat.
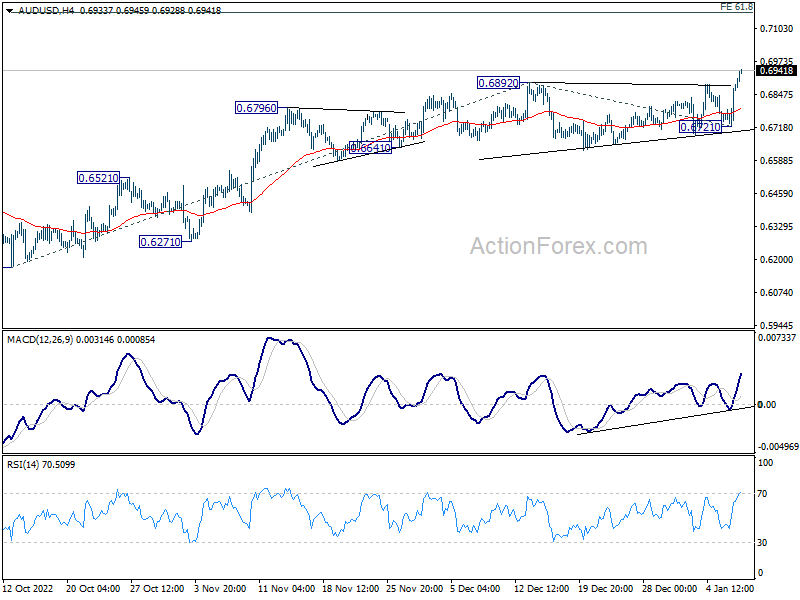
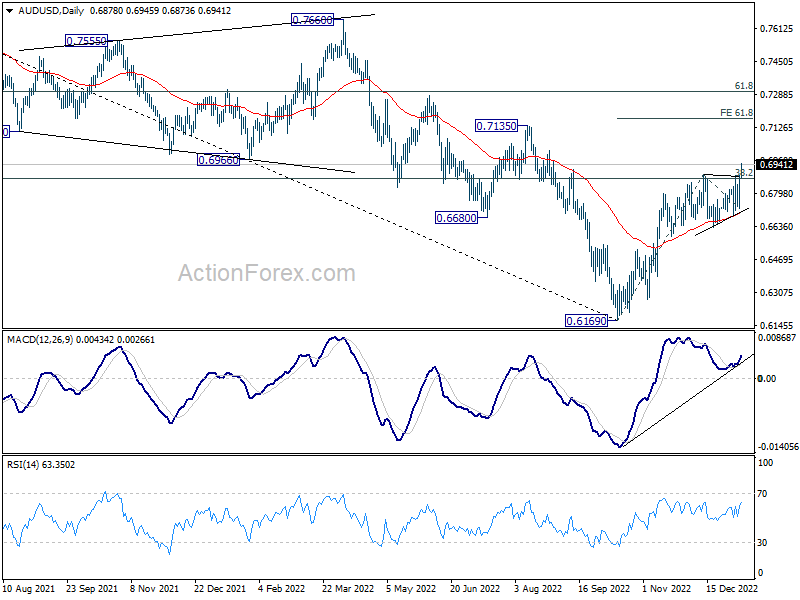
In the bigger picture, the break of 38.2% retracement of 0.8006 (2021 high) to 0.6169 (2022 low) argues that corrective decline from 0.8006 has completed with three waves down to 0.6169. Further rally should be seen to 61.8% retracement at 0.6871. Sustained break there will pave the way to retest 0.8006. This will now remain the favored case as long a s0.6721 support holds.
Aussie Powers Up on Risk-On Sentiment and China Reopening
Australian Dollar rises broadly today as risk-on sentiment carried forward to Asian session. Additionally, the Aussie is lifted by reopening of China, together with Yuan and Hong Kong stocks. Kiwi and Sterling are currently the next strongest. Dollar plunges broadly as a result too, with expectations that Fed to going to slow down the tightening pace further in February. Yen and Swiss Franc are the next weakest, as following broad market movements, while Euro and Loonie are mixed.
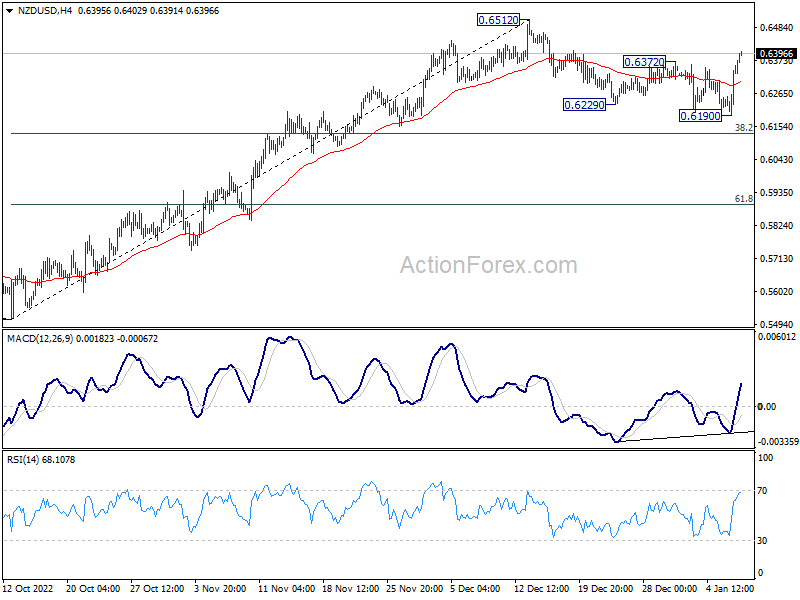
Technically, NZD/USD's break of 0.6372 resistance argues that correction from 0.6512 has completed with three waves down to 0.6190. Further rise is expected to retest 0.6512 high. Judging from the upside break out of AUD/USD today, NZD/USD would like follow and break through 0.6512 soon.
In Asia, Japan was on holiday, Hong Kong HSI is up 1.82%. China Shanghai SSE is up 0.65%. Singapore Strait Times is up 0.60%.
BoE Mann: Energy caps allow reorientation of spending, and higher inflation elsewhere
BoE MPC member Catherine Mann said over the weekend, "The caps on energy prices allow the reorientation of spending to the rest of the consumption basket and thus potentially higher inflation than otherwise would be the case in all those other products... That's something we look at carefully."
"What's going to happen when the caps are removed?" she asked. "Will inflation kind of bounce back? What will the energy prices be at that time? We don't know."
Mann was a hawk who voted for a 75bps rate hike at the December meeting. At the meeting, BoE decided to hike by 50bps in a 6-3 vote, with two members voted for no change.
Yuan surges as China reopens, HSI higher
Asian markets are trading higher (Japan is on holiday), following last week's rally in global markets. Expectations on slower Fed tightening is a factor supporting risk-on sentiment. Meanwhile, China is finally reopening borders, allowing opened sea and land crossings with Hong Kong and ended a requirement for incoming travellers to quarantine. The Chinese Yuan also rises to the highest level since August.
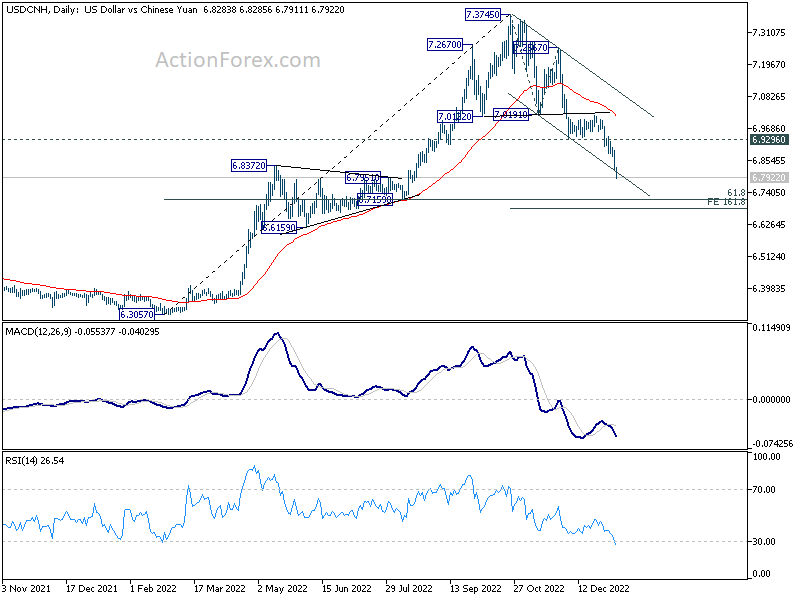
USD/CNH's chart displayed a text-book head and shoulder top development, with recovery capped by the neckline, followed by accelerated downside movement. With break of the medium term channel support, the fall from 7.3745 should be a down trend of the same scale as the rise from 6.3057. Outlook will now stay bearish as long as 6.9296 support turned resistance holds. Next target should be 161.8% projection of 7.3745 to 7.0191 from 7.2567 at 6.6817.
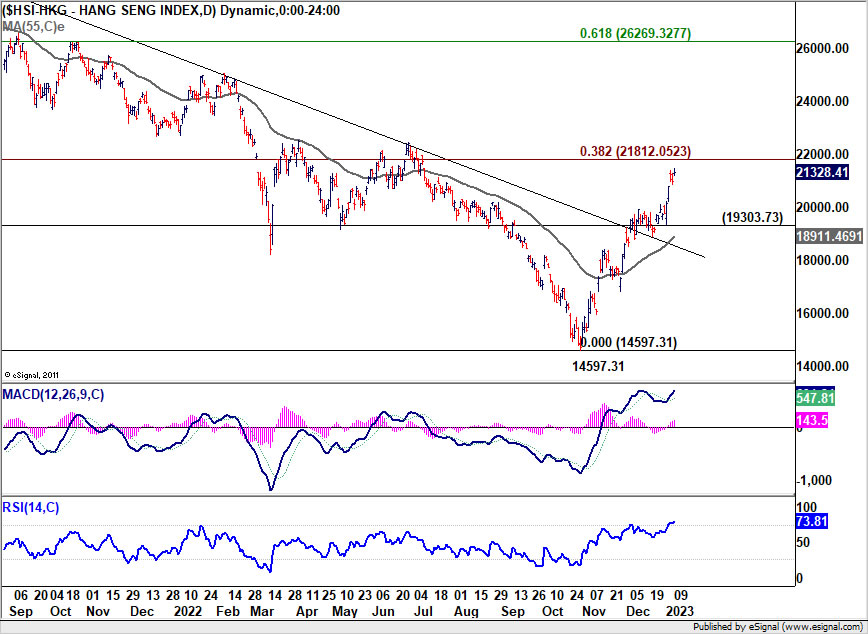
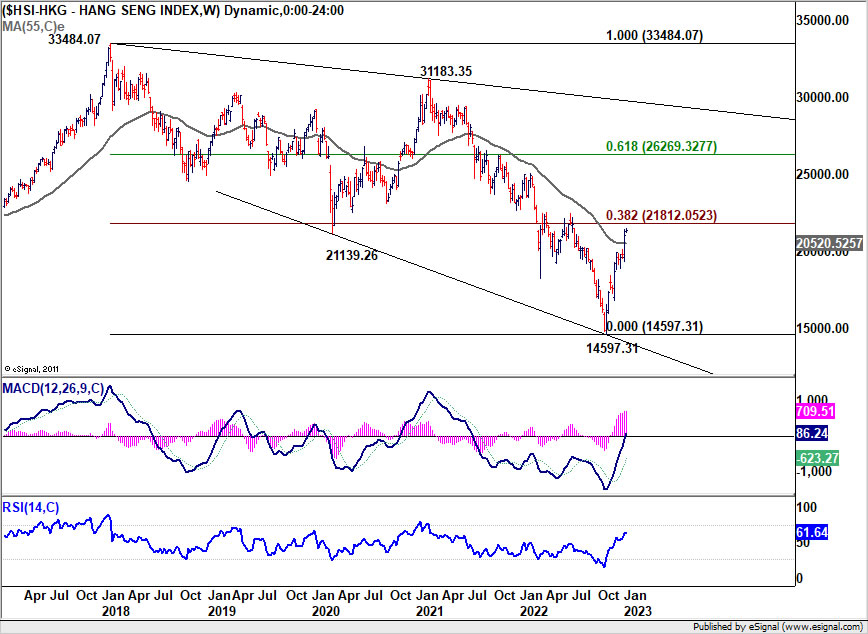
Hong Kong HSI is now extending the rally from 14597.31, but will soon face an important fibonacci level at 21812.05, 38.2% retracement of 33484.07 (2018 high) to 14597.31 (2022 low). Sustained break there will argue that it's already reversing the five-year bear market. Nevertheless, rejection from there, followed by break of 19303.73 support will maintain medium term bearishness for down trend resumption at a later stage.
US CPI and UK GBP to highlight the week
US CPI data will be a major highlight of the week. Markets appear to start to lean towards just a 25bps Fed hike on February 1. Further evidence of cooling in consumer inflation will be needed to solidify such shift in expectations. Meanwhile, traders will look into Fed Chair Jerome Powell's comment too.
Elsewhere, UK GDP will be another highlight of the week, and hopefully it will reaffirm that the current recession is just a shallow one. Some focuses will also be on Eurozone Sentix investor confidence and Australia monthly CPI, retail sales and trade balance
Here are some highlights for the week:
- Monday: Australia building approvals; Swiss unemployment rate, foreign currency reserves; Germany industrial production; France trade balance; Eurozone Sentix investor confidence, unemployment rate; Canada building permits.
- Tuesday: Japan Tokyo CPI, household spending; France industrial production.
- Wednesday: Australia monthly CPI, retail sales; Japan leading indicators.
- Thursday: New Zealand building permits; Australia trade balance; Japan bank lending, current account; China CPI, PPI; ECB monthly bulletin; US CPI, jobless claims.
- Friday: China trade balance; UK GDP, trade balance, productions; Eurozone industrial production, trade balance; US import prices, U of Michigan consumer sentiment.
AUD/USD Daily Report
Daily Pivots: (S1) 0.6770; (P) 0.6828; (R1) 0.6935; More...
AUD/USD's break of 0.6892 resistance confirms resumption of whole rise from 0.6169. Intraday bias is back on the upside for 61.8% projection of 0.6169 to 0.6892 from 0.6721 at 0.7444. For now, outlook will stay bullish as long as 0.6721 support holds, in case of retreat.
In the bigger picture, the break of 38.2% retracement of 0.8006 (2021 high) to 0.6169 (2022 low) argues that corrective decline from 0.8006 has completed with three waves down to 0.6169. Further rally should be seen to 61.8% retracement at 0.6871. Sustained break there will pave the way to retest 0.8006. This will now remain the favored case as long a s0.6721 support holds.
Economic Indicators Update
| GMT | Ccy | Events | Actual | Forecast | Previous | Revised |
|---|---|---|---|---|---|---|
| 00:30 | AUD | Building Permits M/M Nov | -9.00% | 0.10% | -6.00% | |
| 06:45 | CHF | Unemployment Rate Dec | 1.90% | 2.10% | 2.00% | |
| 07:00 | EUR | Germany Industrial Production M/M Nov | 0.20% | 0.20% | -0.10% | |
| 07:45 | EUR | France Trade Balance (EUR) Nov | -11.3B | -12.2B | ||
| 08:00 | CHF | Foreign Currency Reserves (CHF) Dec | 790B | |||
| 09:00 | EUR | Italy Unemployment Nov | 7.80% | 7.80% | ||
| 09:30 | EUR | Eurozone Sentix Investor Confidence (Jan) | -17 | -21 | ||
| 10:00 | EUR | Unemployment Rate Nov | 6.50% | 6.50% | ||
| 13:30 | CAD | Building Permits M/M Nov | 0.40% | -1.40% |
Technical Outlook and Review
USD/JPY:
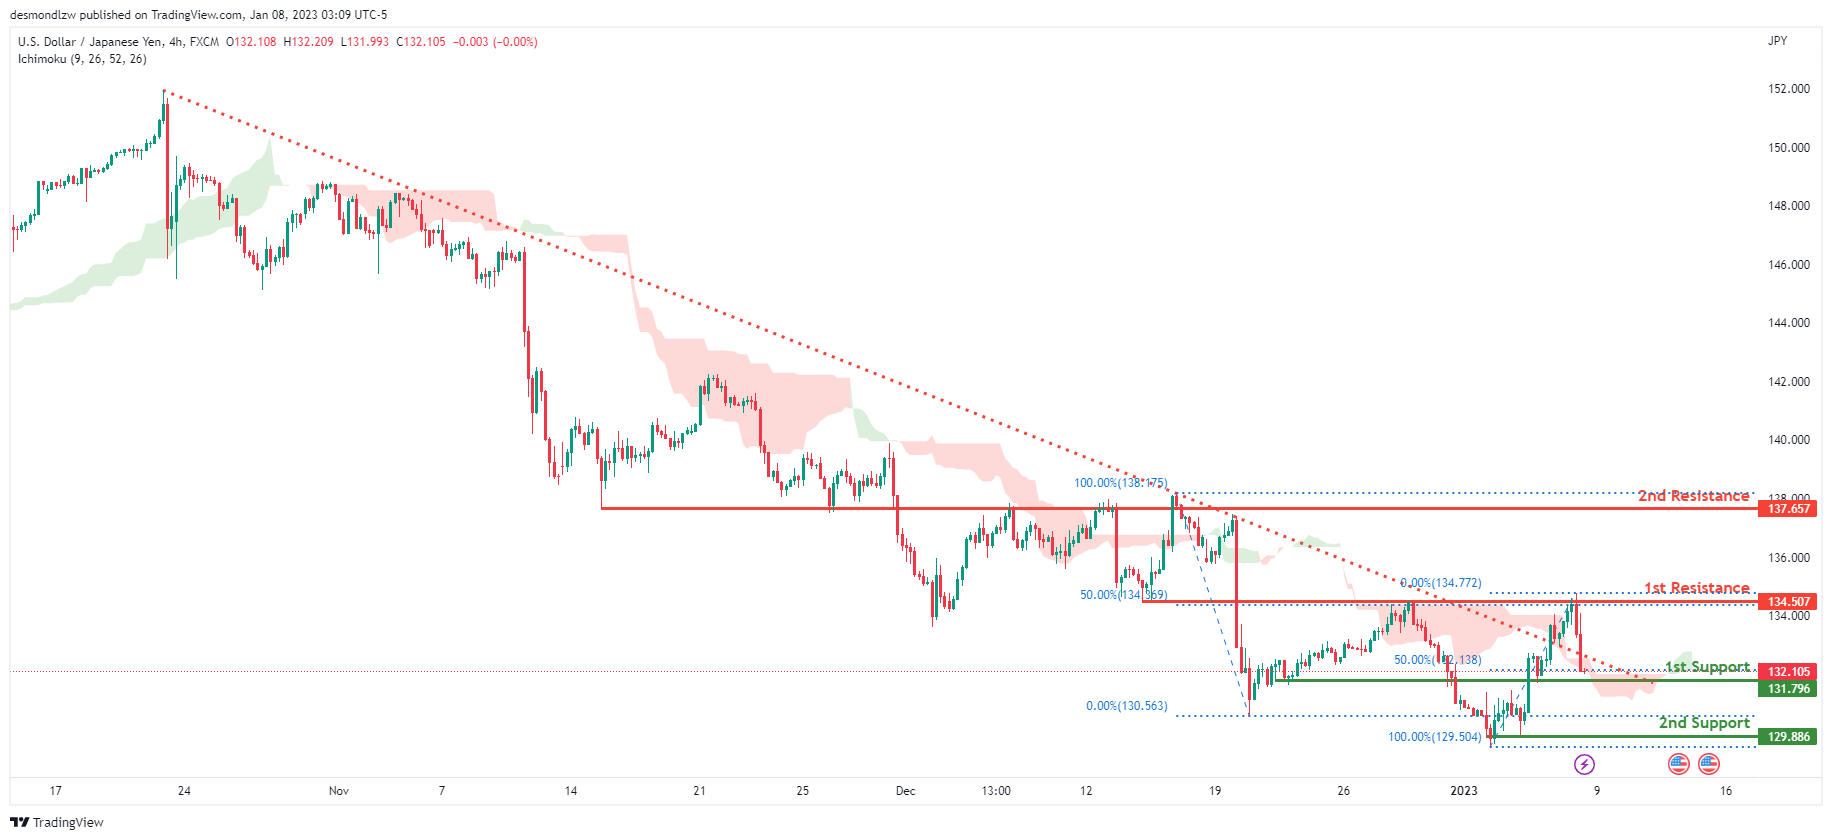
Looking at the H4 chart, my overall bias for USDJPY is bearish due to the current price being below the Ichimoku cloud, indicating a bearish market. To add support to this bias, price has also broken back into the descending trendline.If this bearish momentum continues, expect price to possibly break the 1st support at 131.796, where the 50% Fibonacci line is, before heading towards the 2nd support at 129.886, where the previous swing low is. In an alternate scenario, price could possibly head back up towards the 1st resistance level at 134.528, where the 50% Fibonacci line is.
Areas of consideration:
- H4 time frame, 1st resistance at 134.528
- H4 time frame, 2nd resistance at 137.657
- H4 time frame, 1st support at 131.796
- H4 time frame, 2nd support at 129.886
DXY:
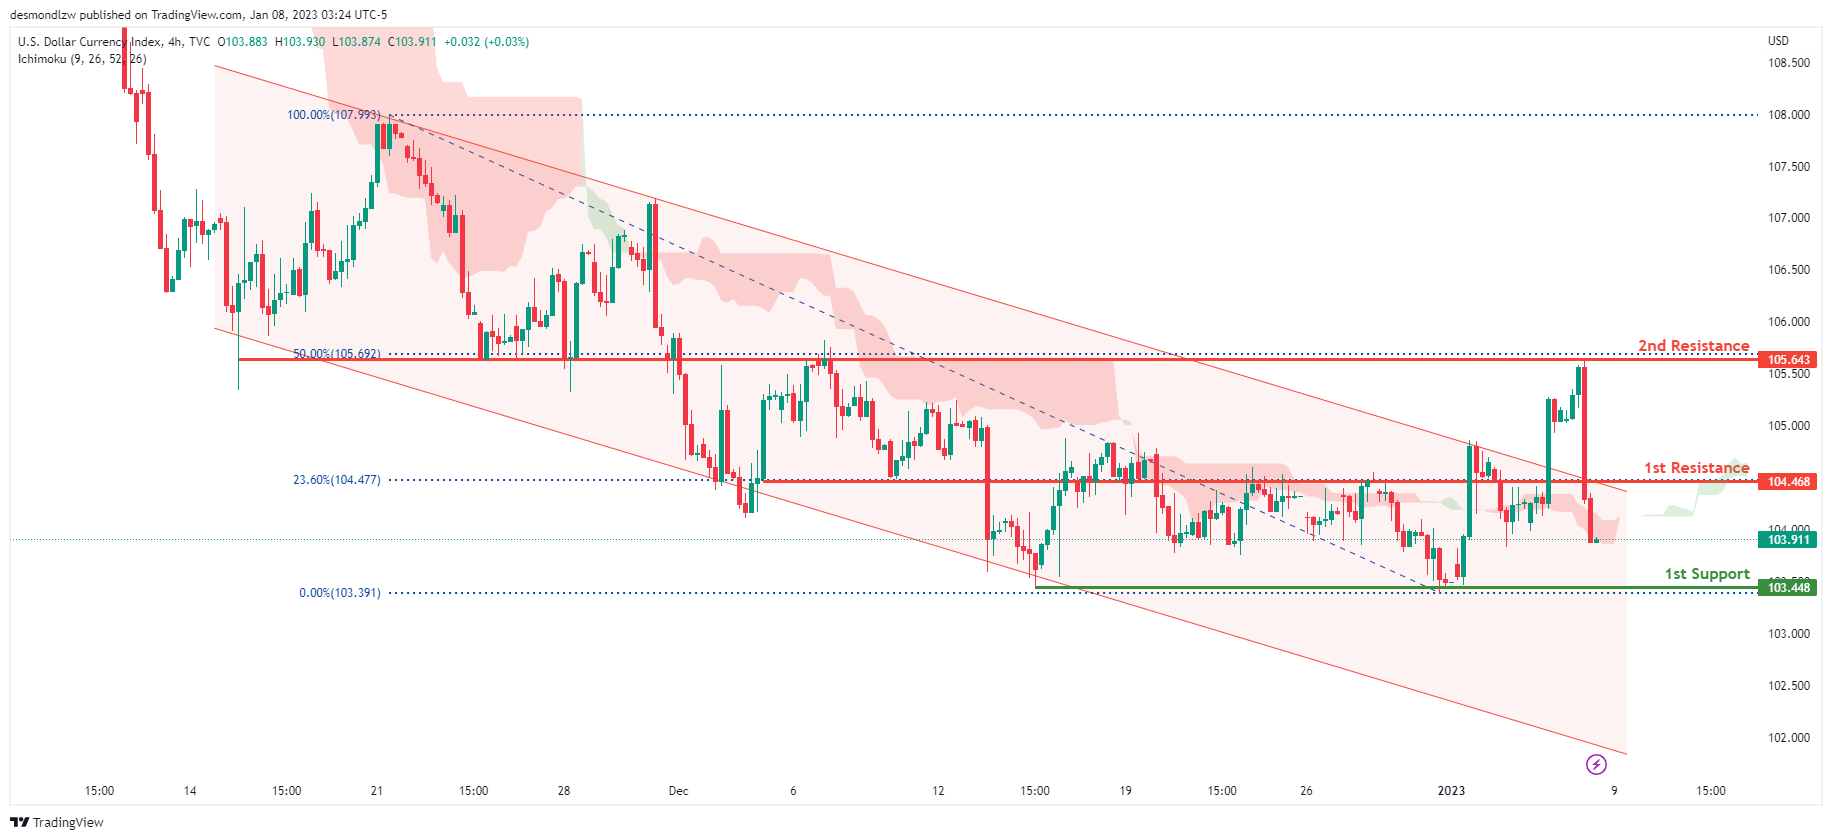
Looking at the H4 chart, my overall bias for DXY is bearish due to the current price being below the Ichimoku cloud, indicating a bearish market. To add confluence to this, price is broken back down within the descending channel which indicates a bearish market. If this bearish momentum continues, expect the price to possibly continue heading towards the 1st support at 103.448, where the previous lows and liquidity hotspots are. In an alternative scenario, price could head back up to retest the 1st resistance at 104.468, where the 23.6% Fibonacci line is.
Areas of consideration:
- H4 time frame, 1st resistance at 104.468
- H4 time frame, 1st support at 103.448
EUR/USD:
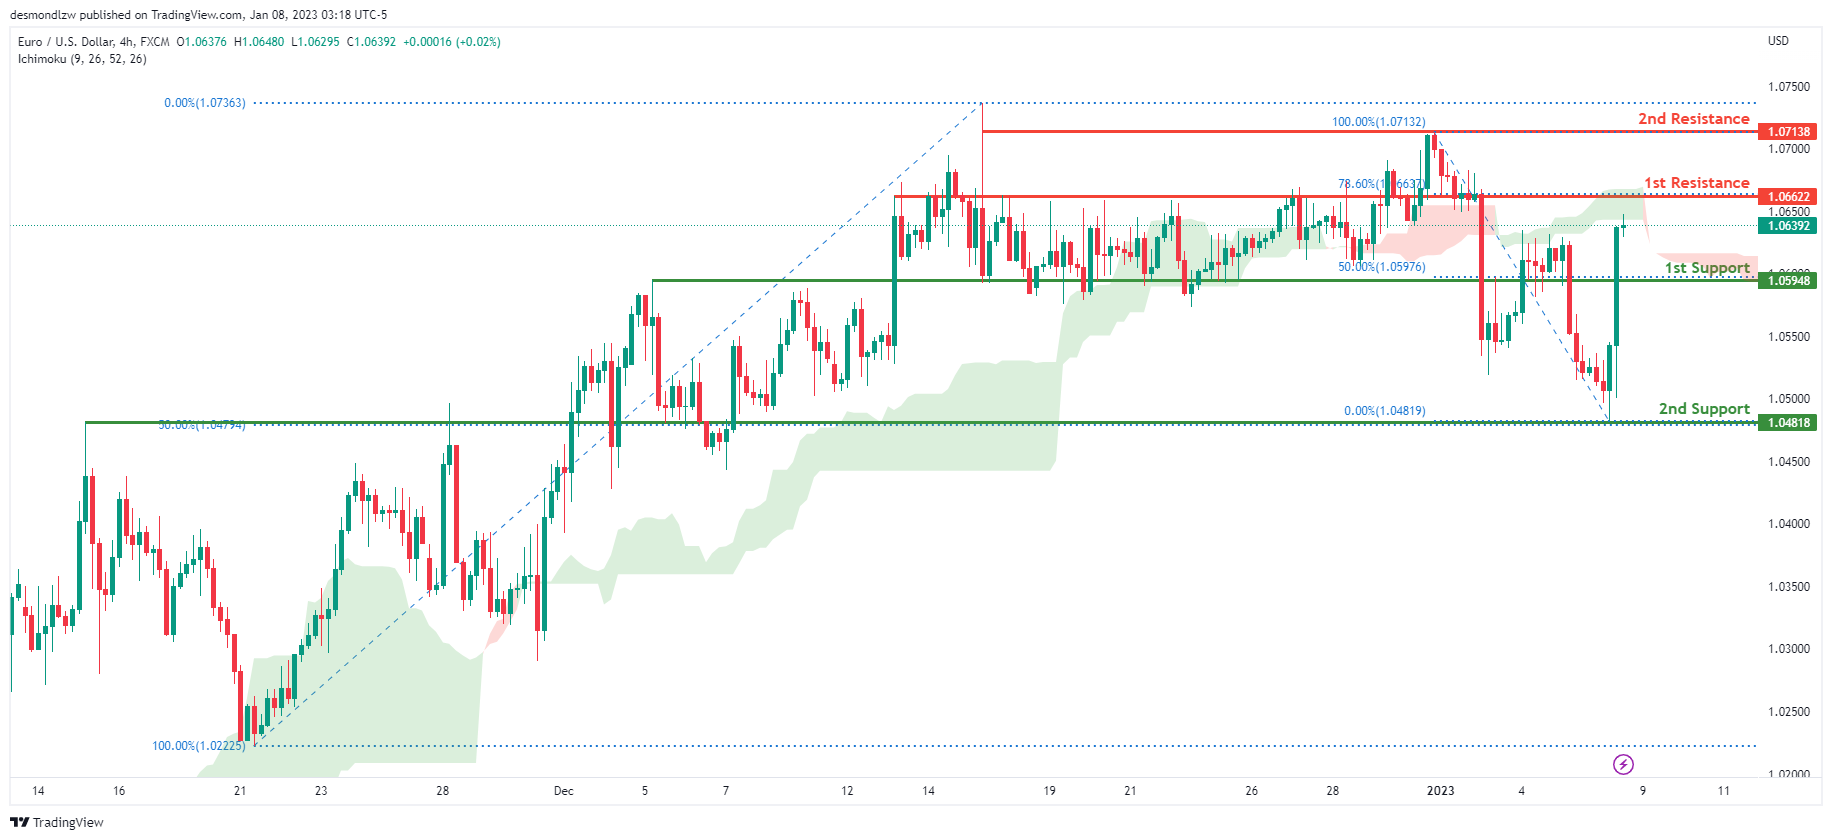
Looking at the H4 chart, my overall bias for EURUSD is bullish due to the current price attempting to cross above the Ichimoku cloud, indicating a possible shift to bullish market structure. If this bullish momentum continues, expect the price to possibly break the 1st resistance at 1.06622, where the 78.6% Fibonacci line is, before heading towards the 2nd resistance at 1.07138, where the previous high and liquidity hotspots are. In an alternate scenario, price could possibly head back down to retest the 1st support level at 1.05948, where the 50% Fibonacci line is.
Areas of consideration :
- H4 1st resistance at 1.06622
- H4 2nd resistance at 1.07138
- H4 1st support at 1.05948
GBP/USD:
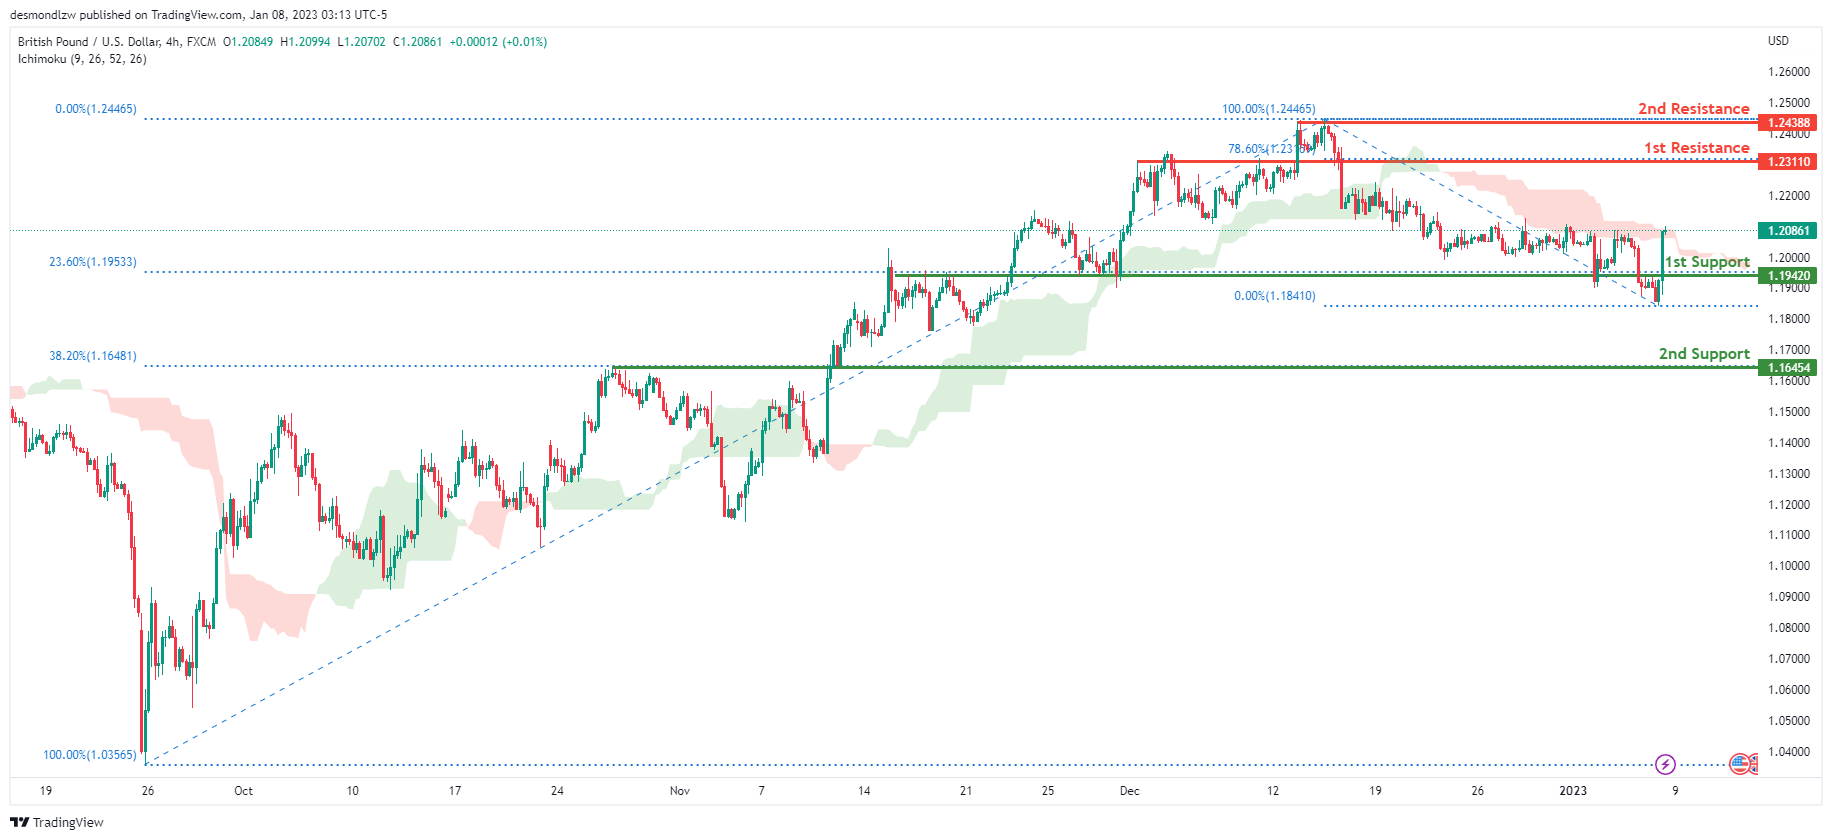
Looking at the H4 chart, my overall bias for GBPUSD is bullish due to the current price being above the Ichimoku cloud, indicating a bullish market. If this bullish momentum continues, expect price to possibly continue heading towards the 1st resistance line at 1.23110, where the 78.6% Fibonacci line is. In an alternate scenario, price could possibly head back down towards the 1st support at 1.19420, where the 23.6% Fibonacci line is
Areas of consideration:
- H4 1st resistance at 1.23110
- H4 1st support at 1.19420
USD/CHF:
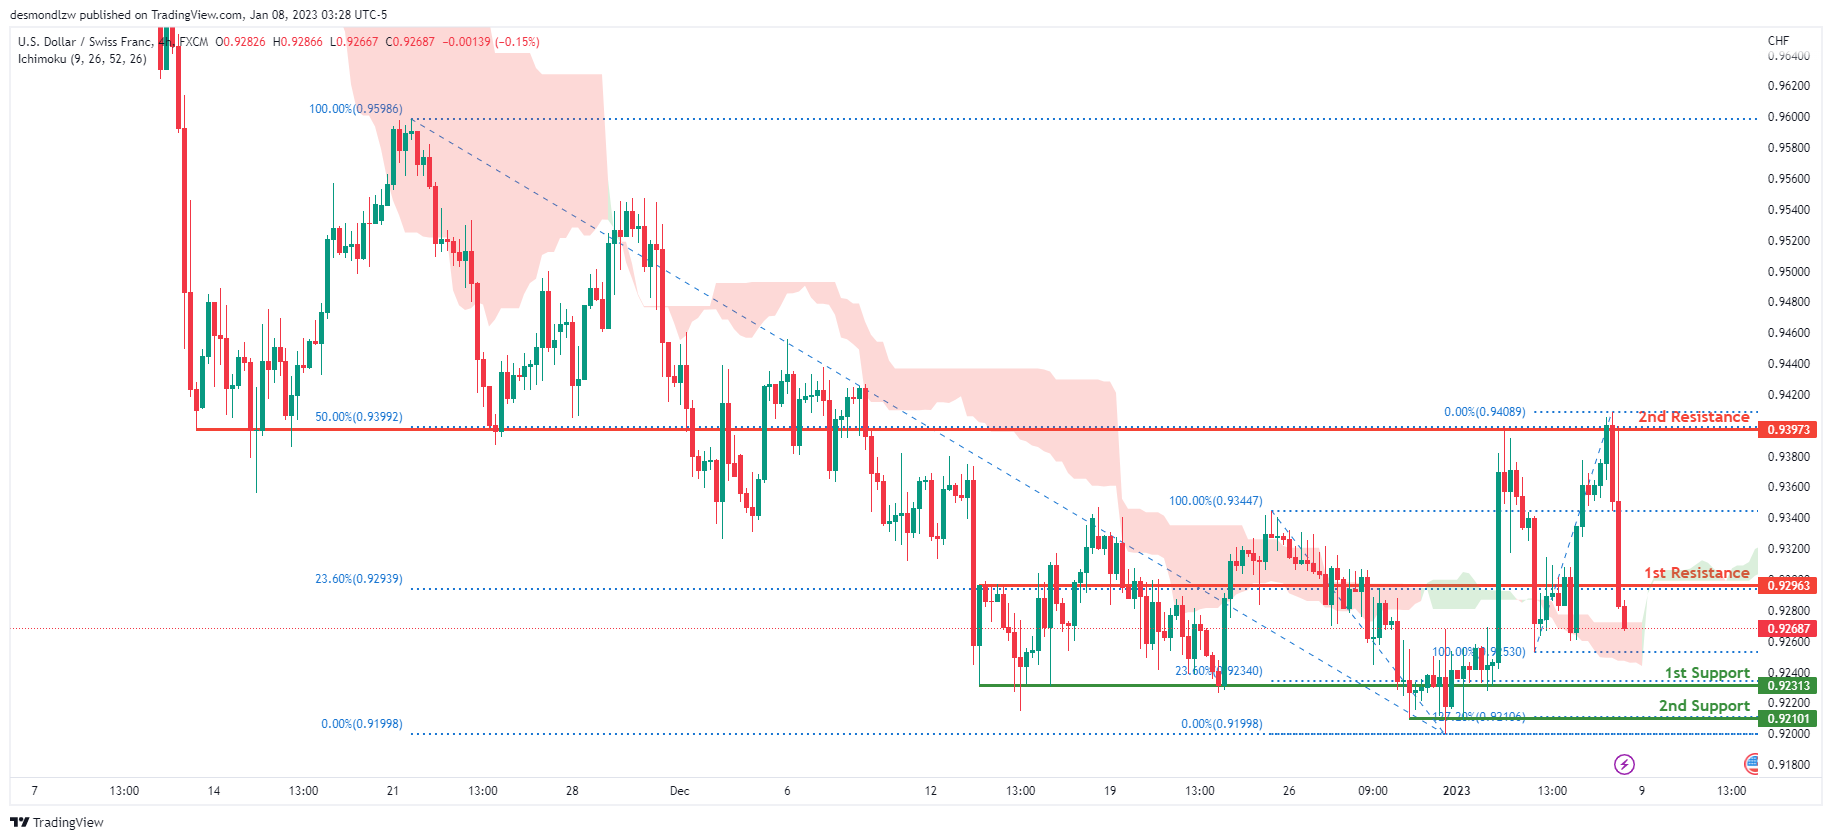
Looking at the H4 chart, my overall bias for USDCHF is bearish due to the current price being below the Ichimoku cloud, indicating a bearish market. If the current bearish trend continues, expect the price to head towards the 1st support at 0.92313, where the 23.6% Fibonacci line is. In an alternative scenario, price could possibly head back up to retest the 1st resistance at 0.92963, where the 23.6% Fibonacci line is.
Areas of consideration
- H4 1st support at 0.92313
- H4 1st resistance at 0.92963
XAU/USD (GOLD):
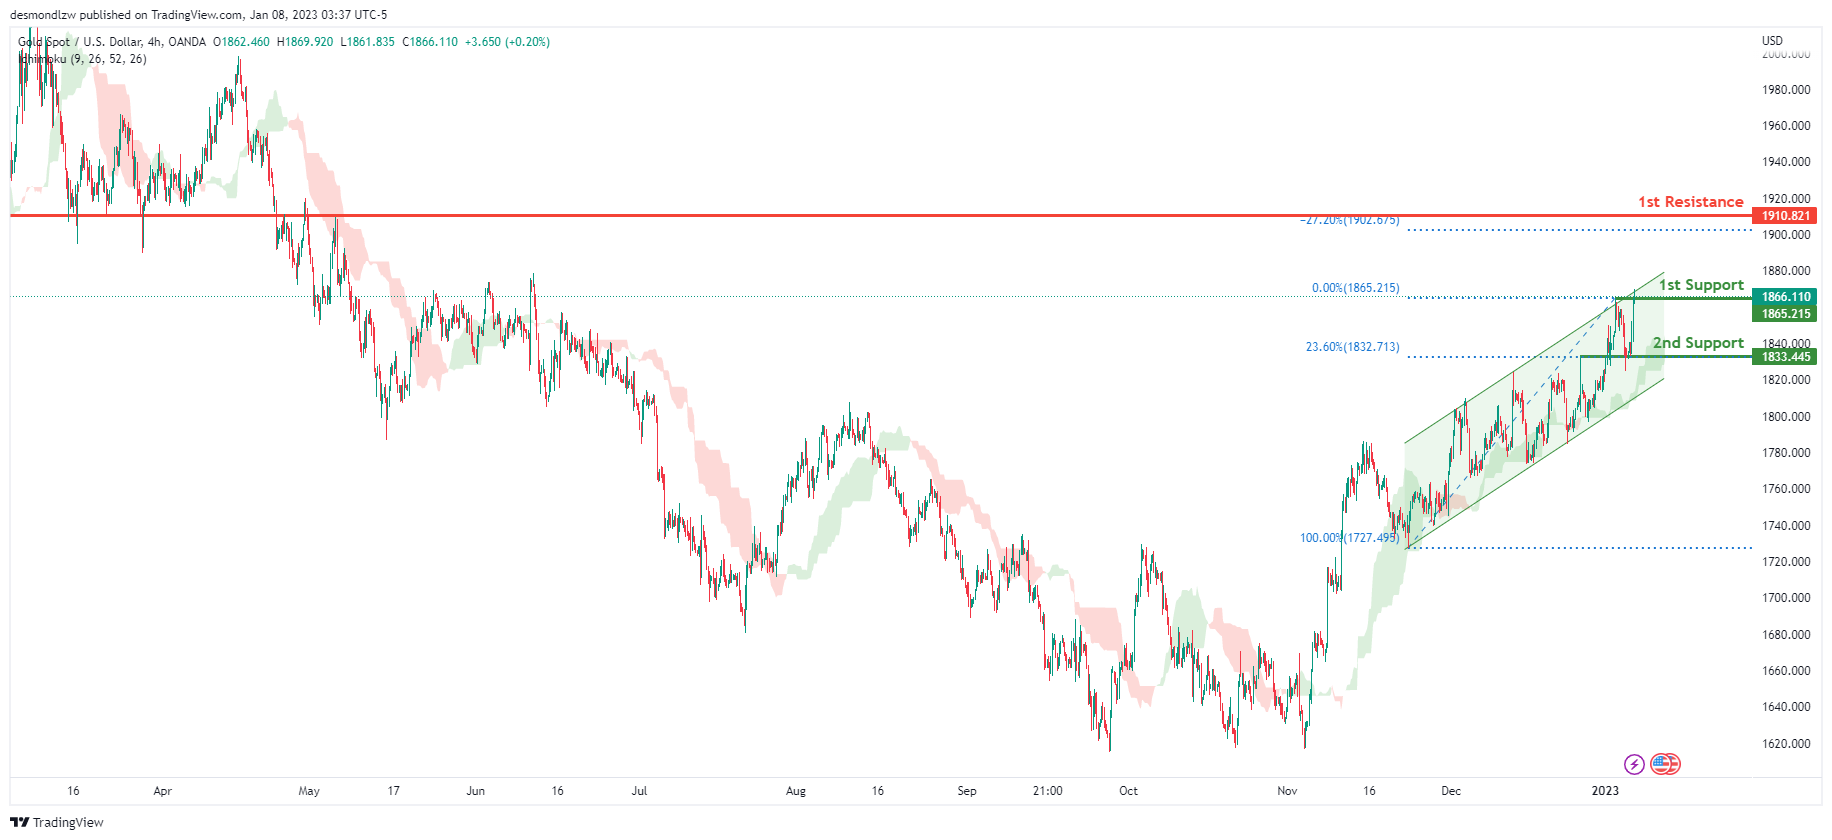
Looking at the H4 chart, my overall bias for XAUUSD is bullish due to the current price crossing above the Ichimoku cloud, indicating a bullish market. To add support to this bias, price is also within a bullish ascending channel. If this bullish momentum continues, expect the price to possibly continue heading towards the 1st resistance at 1910.821 where the -27.2% Fibonacci expansion line is. In an alternative scenario, price could possibly head back down breaking the 1st support at 1833.445, where the 23.6% Fibonacci line is, before heading towards the 2nd support at 1833.445, where the 23.6% Fibonacci line is.
Areas of consideration:
- H4 time frame, 1st resistance at 1910.821
- H4 time frame, 1st support at 1810.010
- H4 time frame, 2nd support at 1833.445
AUD/USD:
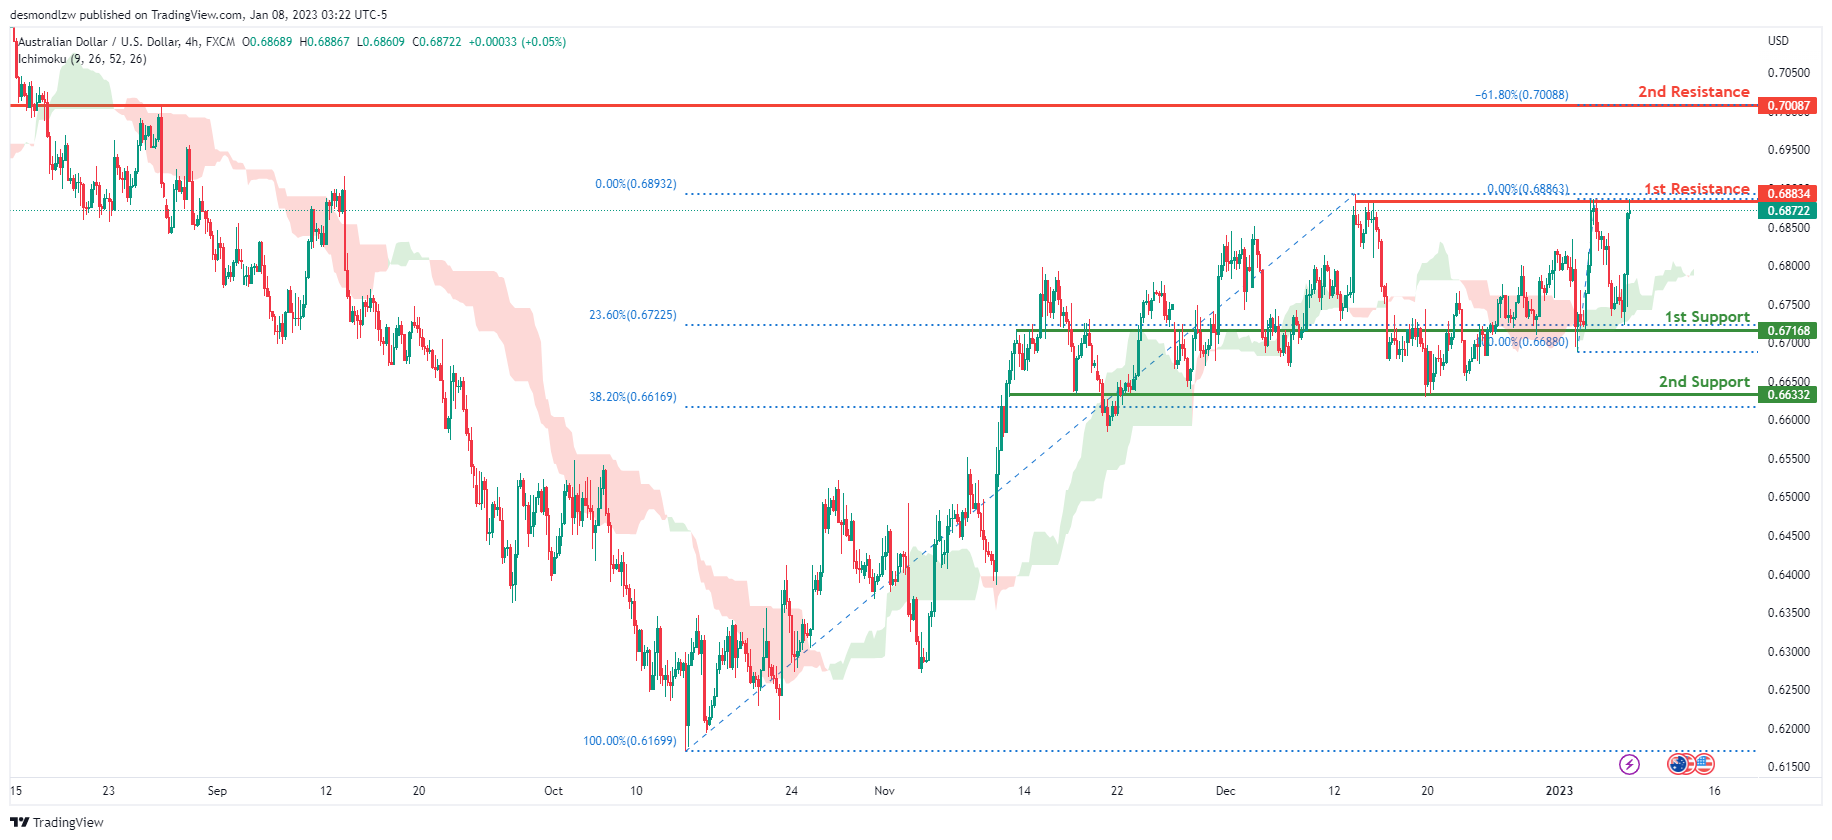
Looking at the H4 chart, my overall bias for AUDUSD is bullish due to the current price being above the Ichimoku cloud, indicating a bullish market. If this bullish momentum continues, expect the price to possibly break the 1st resistance at 0.68834, where the recent swing high is, before heading towards the 2nd resistance at 0.70087, where the -61.8% Fibonacci expansion line is. In an alternative scenario, price could possibly head back down breaking the 1st support at 0.67168, where the 23.6% Fibonacci line is, before heading towards the 2nd support at 0.66332, where the 38.2% Fibonacci line is.
Areas of consideration
- H4, 1st resistance at 0.68932
- H4, 2nd resistance at 0.70087
- H4, 1st support at 0.67168
- H4, 2nd support at 0.66332
NZD/USD:
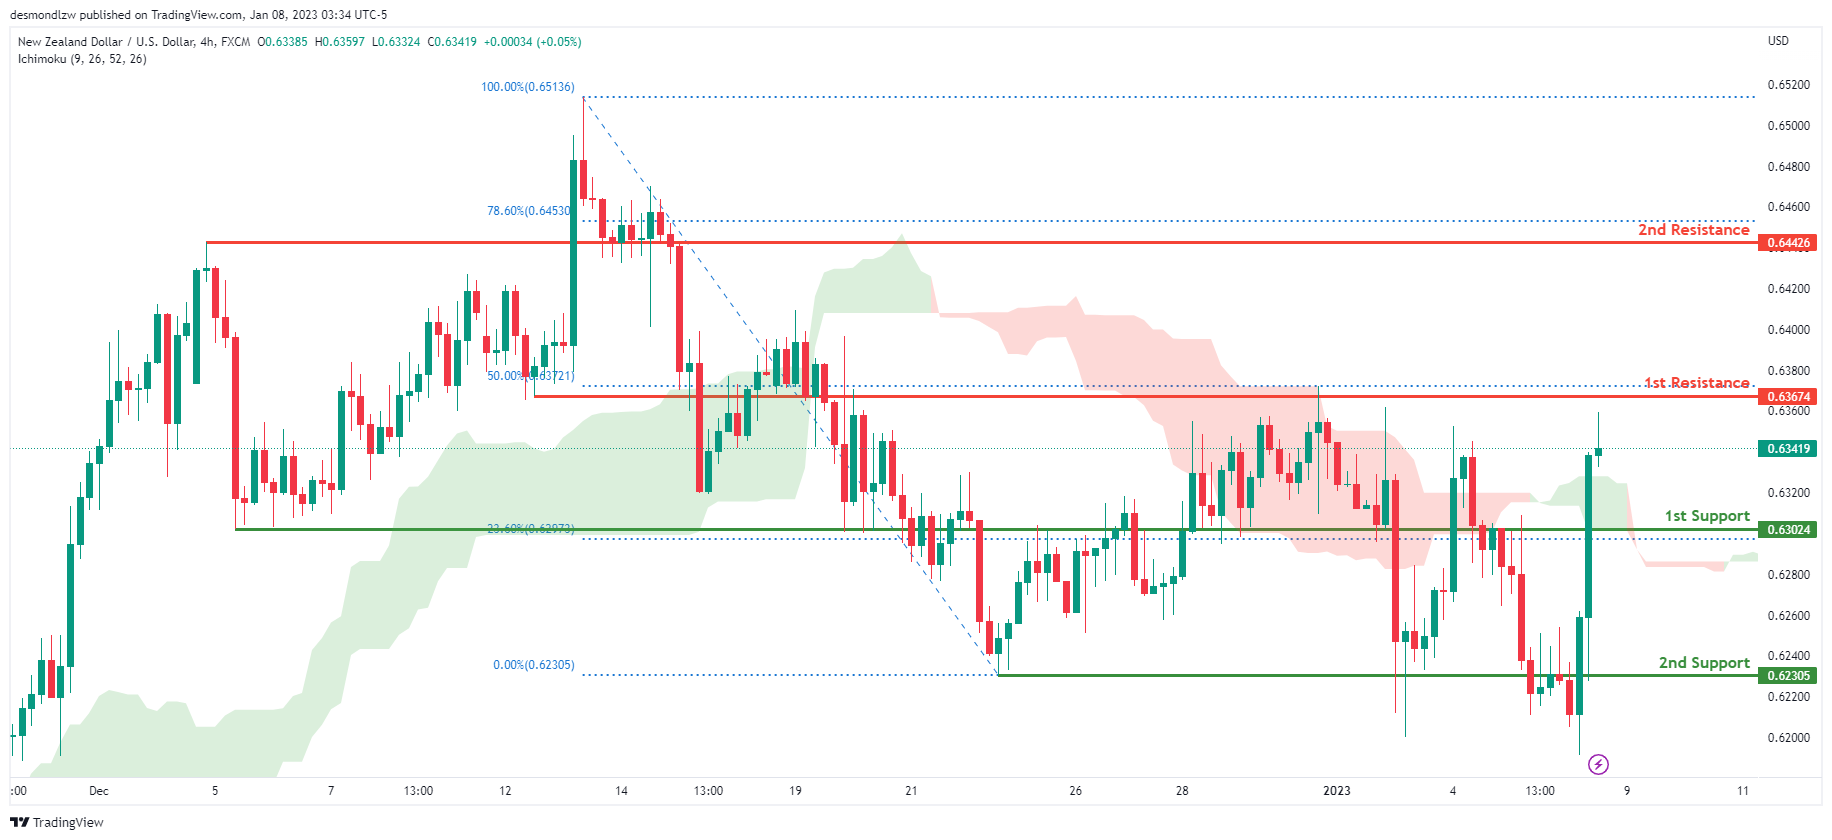
Looking at the H4 chart, my overall bias for NZDUSD is bullish due to the current price being above the Ichimoku cloud, indicating a bullish market. If this bullish momentum continues, expect price to possibly continue heading towards the 1st resistance at 0.63674, where the 50% Fibonacci line is. In an alternate scenario, price could possibly head back down to retest the 1st support at 0.63024, where the 23.6% Fibonacci line is
Areas of consideration:
- H4 time frame, 1st resistance at 0.63674
- H4 time frame, 1st support at 0.63024
USD/CAD:
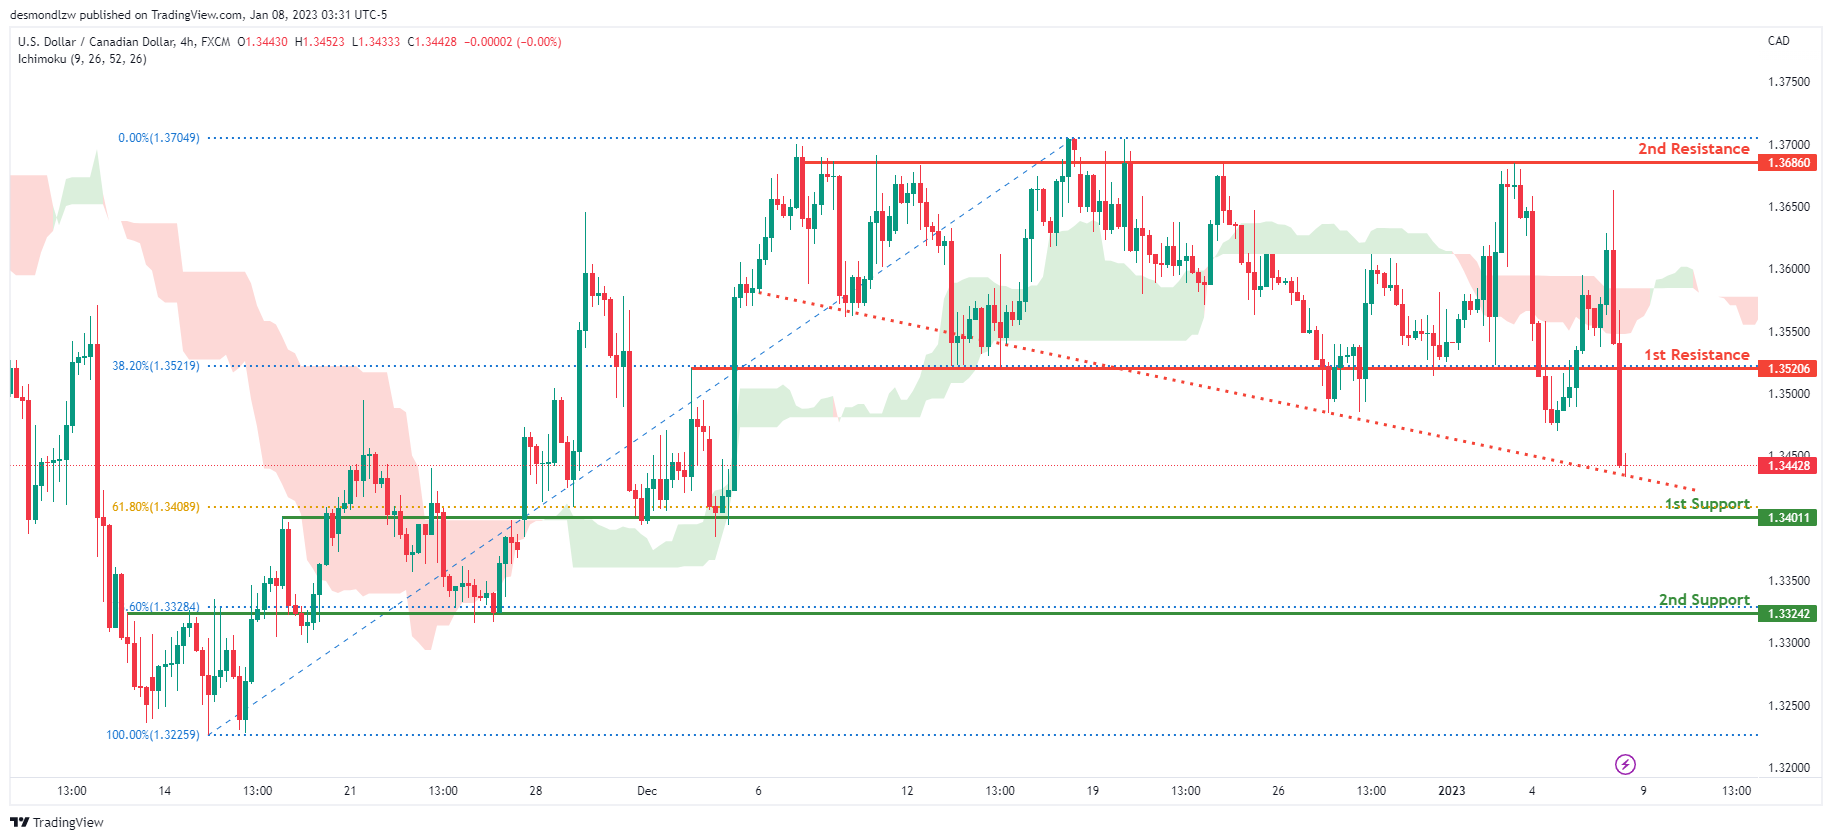
On the H4 chart, the overall bias for USDCAD is bearish. To add confluence to this, the price is below the Ichimoku cloud which indicates a bearish market. To add support to this bias, price is also along a descending trendline. If this bearish momentum continues, expect the price to possibly head towards the 1st support at 1.34011, where the 61.8% Fibonacci line is. In an alternative scenario, price could head back up to retest the 1st resistance at 1.35206, where the 38.2% Fibonacci line is.
Areas of consideration:
- H4 time frame, 1st resistance at 1.35206
- H4 time frame, 1st support at 1.34011
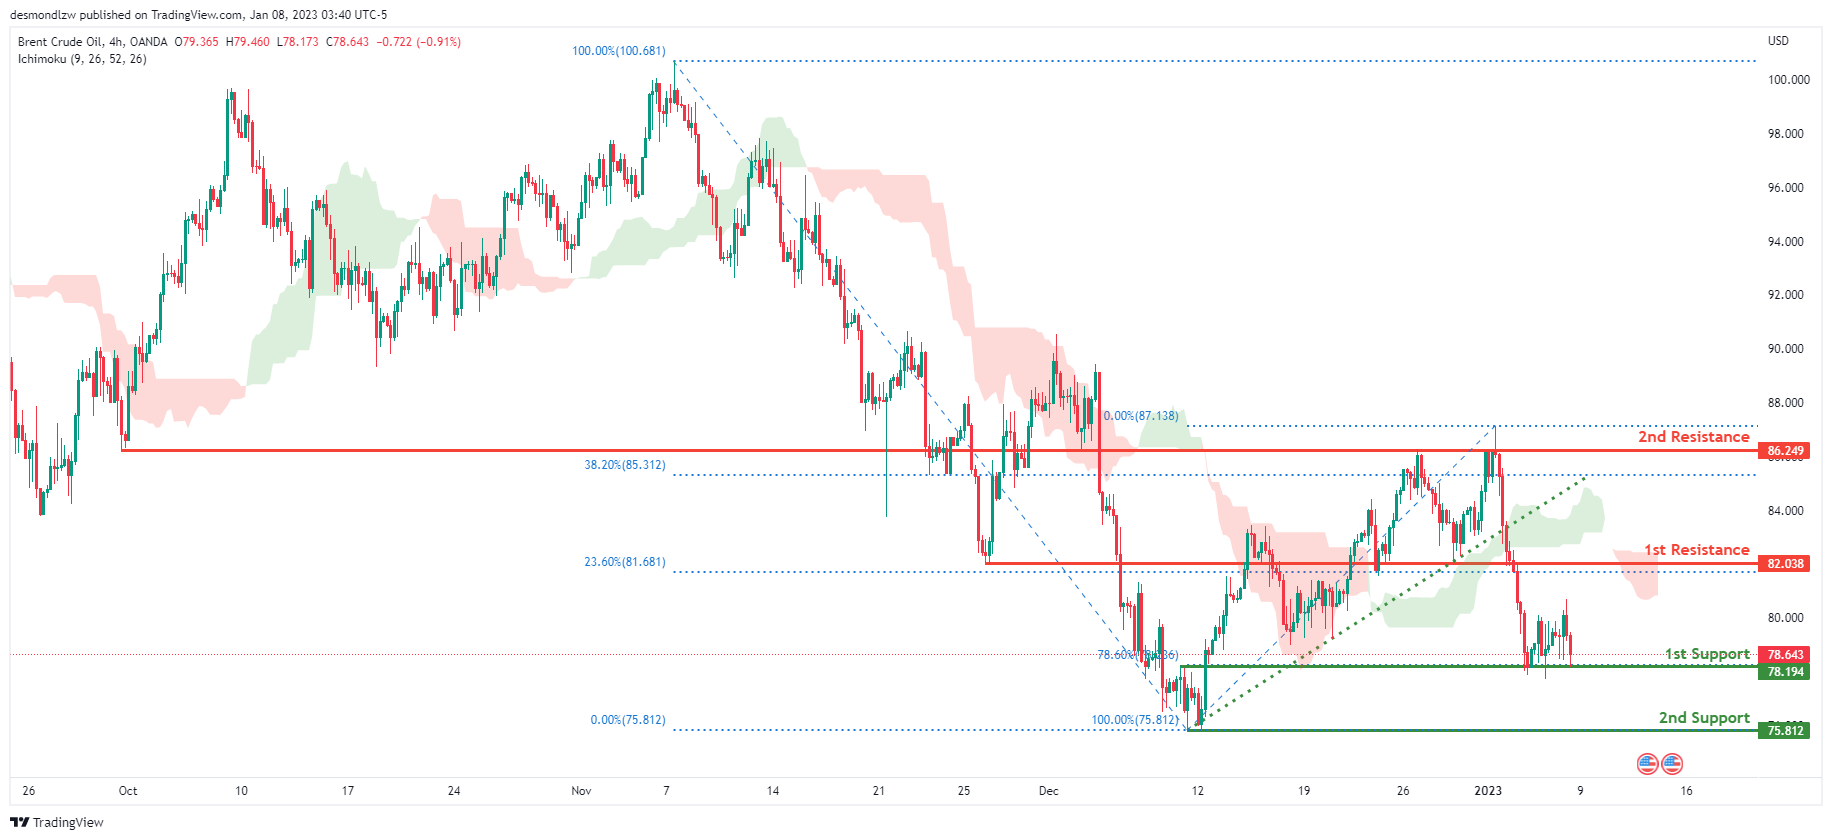
OIL:
Looking at the H4 chart, my overall bias for BCOUSD is bearish due to the current price crossing below the Ichimoku cloud, indicating a bearish market. Adding more confluence to this bias, price has also broken the ascending trend line. If this bearish momentum continues, expect the price to possibly break the 1st support at 78.194, where the 78.6% Fibonacci line is before heading towards the 2nd support at 75.812, where the previous swing low is. In an alternate scenario, price could possibly head back up to retest the 1st resistance at 82.038, where the 23.6% Fibonacci line is
Areas of consideration:
- H4 time frame, 1st resistance at 82.038
- H4 time frame, 1st support at 78.194
- H4 time frame, 2nd support at 75.812
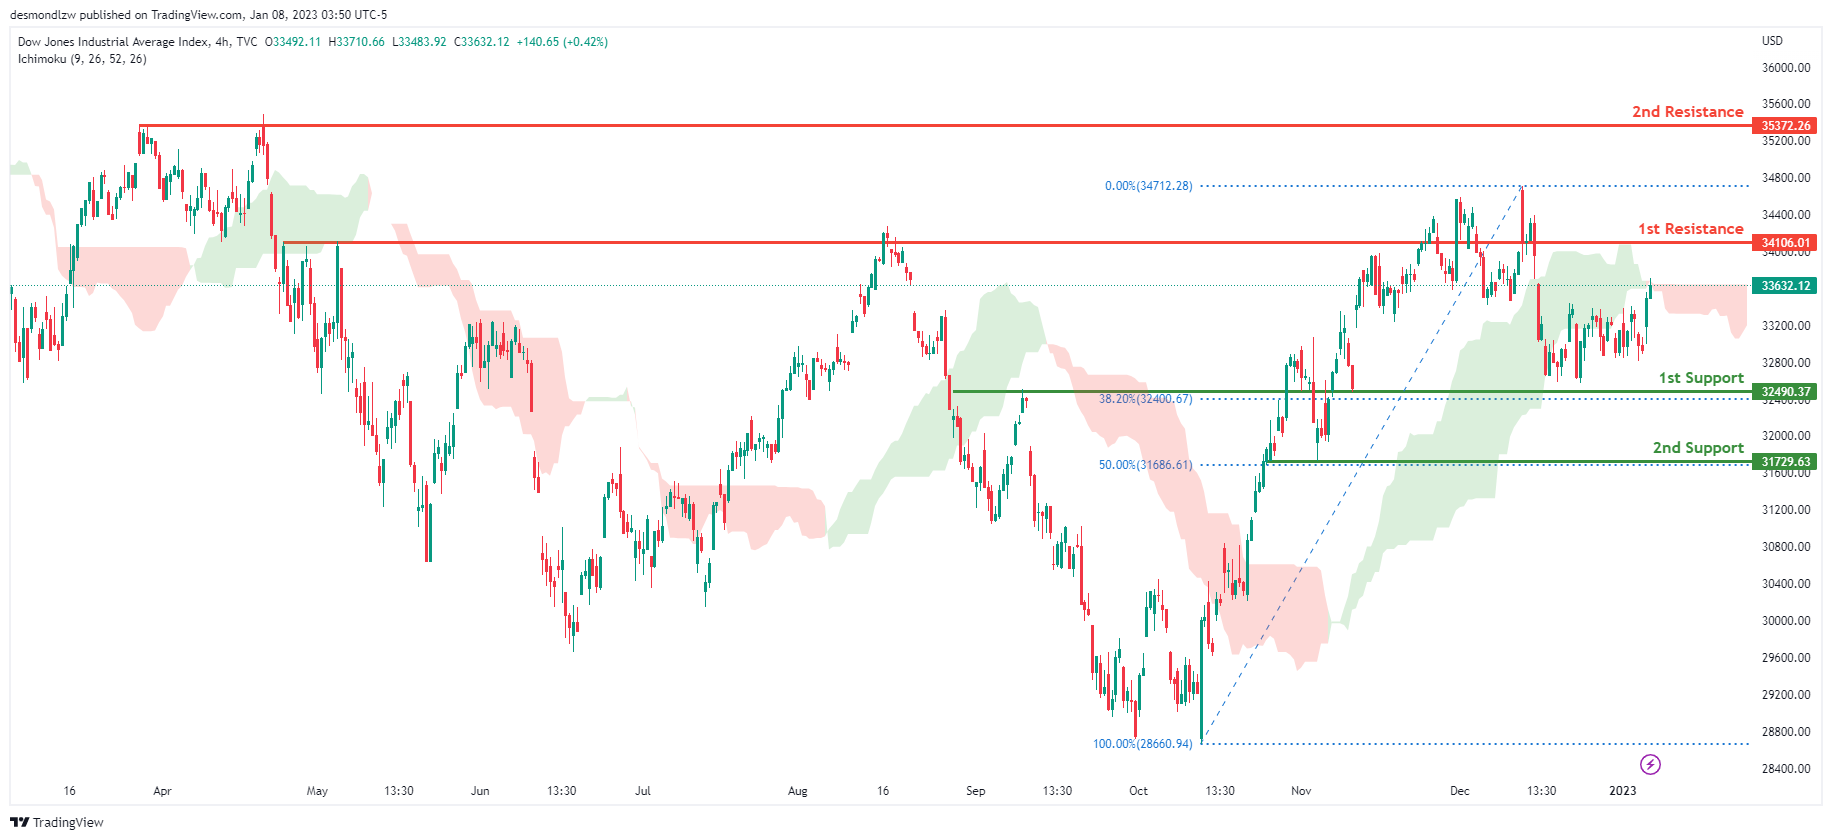
Dow Jones Industrial Average:
On the H4 chart, the overall bias for DJI is bearish. To add confluence to this, the price is crossing below the Ichimoku cloud which indicates a bearish market. If this bearish momentum continues, expect the price to head back down towards the 1st support at 32490.37, where the 61.8% Fibonacci line is. In an alternative scenario, price could possibly break the 1st resistance line at 34106.01, where the previous swing high is before heading towards the 2nd resistance line at 35492.22, where the previous swing high is.
Areas of consideration:
- H4 time frame, 1st support at 32490.37
- H4 time frame, 1st Resistance at 34106.01
- H4 time frame, 2nd Resistance at 35492.22
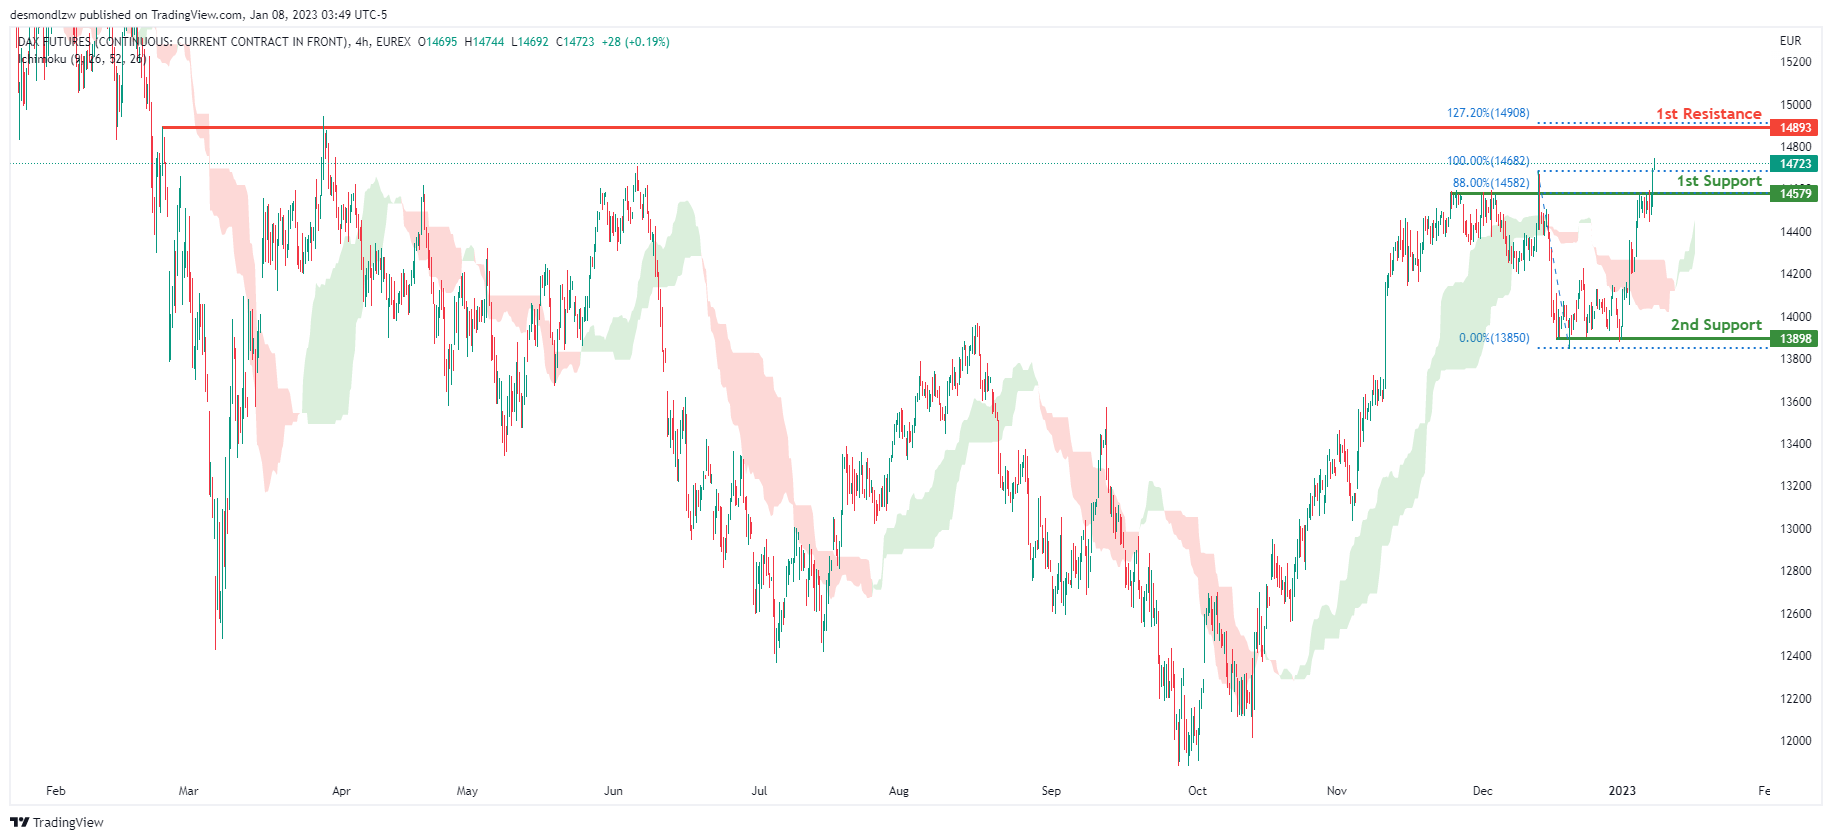
DAX:
Looking at the H4 chart, my overall bias for DAX is bullish due to the current price crossing above the Ichimoku cloud, indicating a bullish market. If this bullish momentum continues, expect the price to possibly head towards the 1st resistance line at 14893, where the 127.2% Fibonacci extension line is. In an alternative scenario, price could possibly head down to retest the 1st support at 14579, where the 88% Fibonacci line is.
Areas of consideration:
- H4 time frame, 1st resistance is at 14893
- H4 time frame, 1st support is at 14579
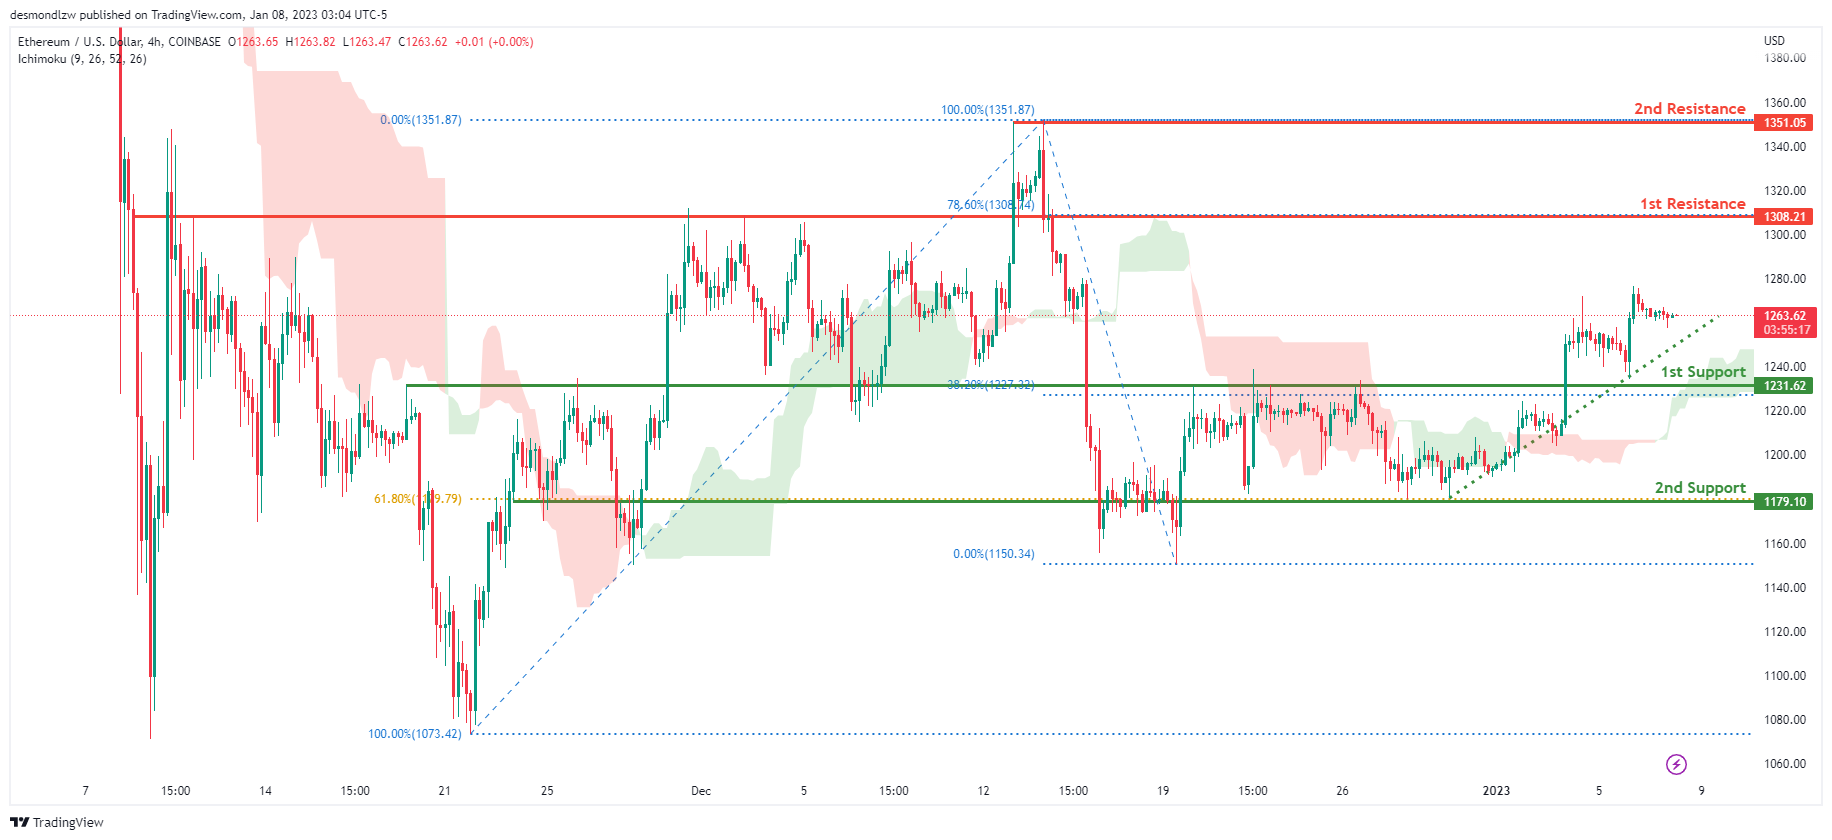
ETHUSD:
Looking at the H4 chart, my overall bias for ETHUSD is bullish due to the current price crossing above the Ichimoku cloud, indicating a bullish market. To add support to this bias, price is also climbing along an ascending trendline. If this bullish momentum continues, expect the price to head towards the 1st resistance at 1308.21, where the 78.6% Fibonacci line is. In an alternative scenario, price could head back down to retest the 1st support at 1231.62, where the 38.2% Fibonacci line is.
Areas of consideration:
- H4 time frame, 1st resistance of 1308.21
- H4 time frame, 1st support at 1231.62
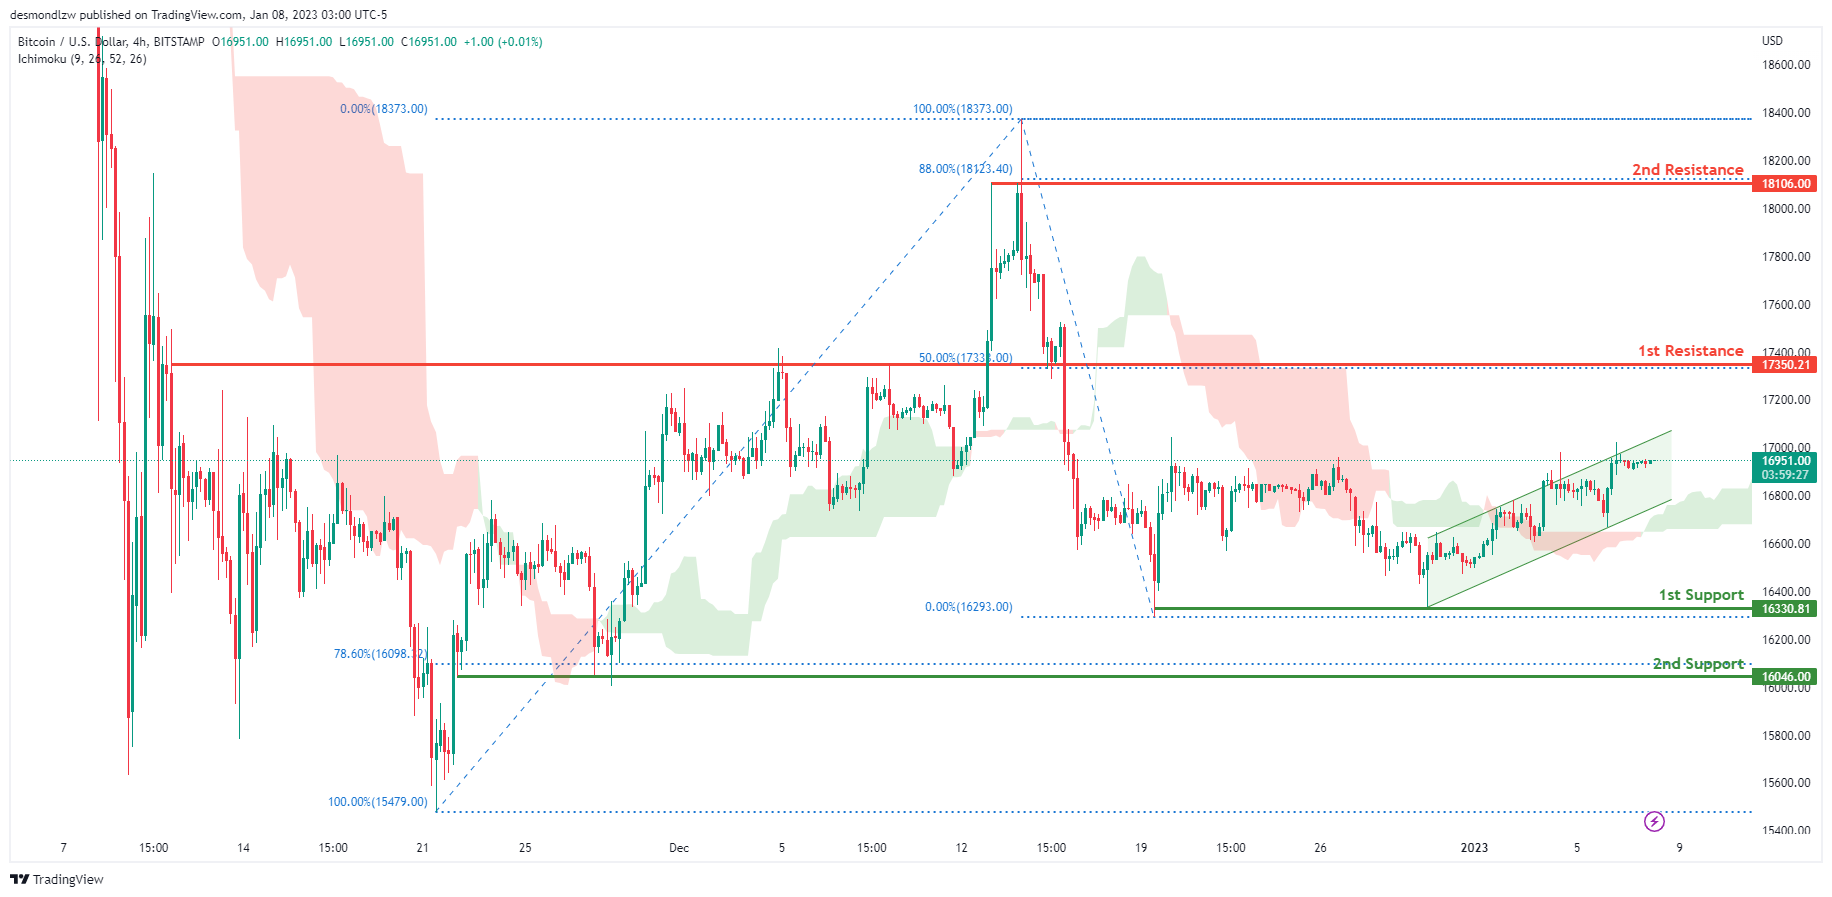
BTCUSD:
Looking at the H4 chart, my overall bias for BTCUSD is bullish due to the current price being above the Ichimoku cloud, indicating a bullish market. To add support to this bias, price is also within a bullish ascending channel. If this bullish momentum continues, expect the price to possibly continue heading towards the 1st resistance at 17350.21, where the 50% Fibonacci line is. In an alternative scenario, price could possibly head back down towards the 1st support at 16330.81, where the recent low and liquidity hotspot are.
Areas of consideration:
- H4 time frame, 1st resistance 17350.21
- H4 time frame, 1st support at 16330.81
S&P 500:
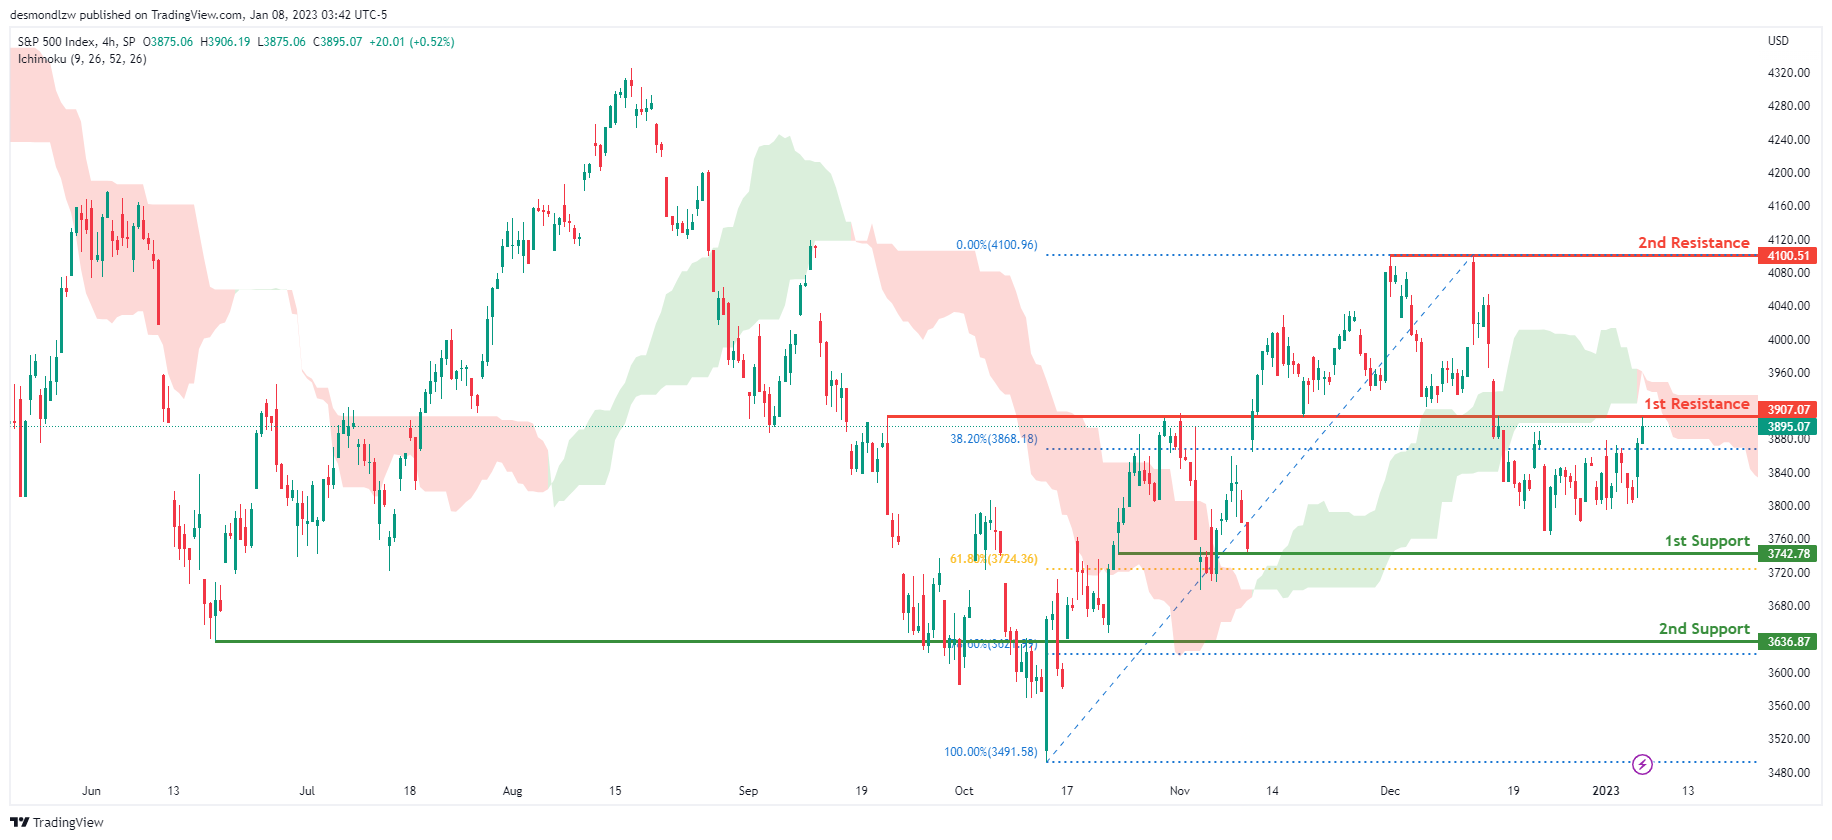
Looking at the H4 chart, my overall bias for S&P500 is bearish due to the current price being below the Ichimoku cloud, indicating a bearish market. If this bearish momentum continues, expect the price to continue heading towards the 1st support at 3742.78, where the 61.8% Fibonacci line is. In an alternative scenario, price could possibly head back up to retest the 1st resistance at 3907.07, where the 38.2% Fibonacci line is.
Areas of consideration:
- H4 time frame, 1st support at 3742.78
- H4 time frame, 1st resistance at 3907.07