Sample Category Title
USD/JPY Daily Outlook
Daily Pivots: (S1) 129.87; (P) 130.64; (R1) 131.76; More...
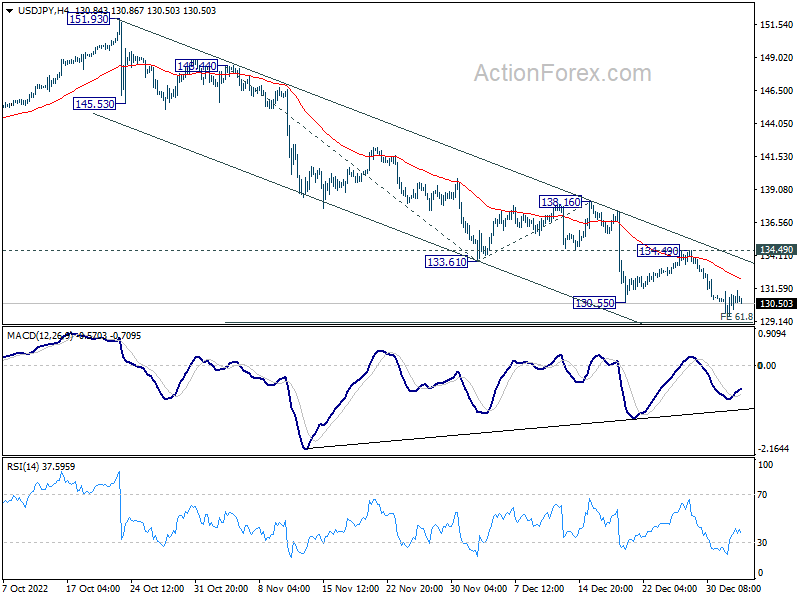
Intraday bias in USD/JPY is turned neutral with 4 hour MACD crossed above signal line. But outlook stays bearish as long as 134.49 resistance holds. On the downside, firm break of 61.8% projection of 148.44 to 133.61 from 138.16 at 128.99 could trigger downside acceleration to 100% projection at 123.33.
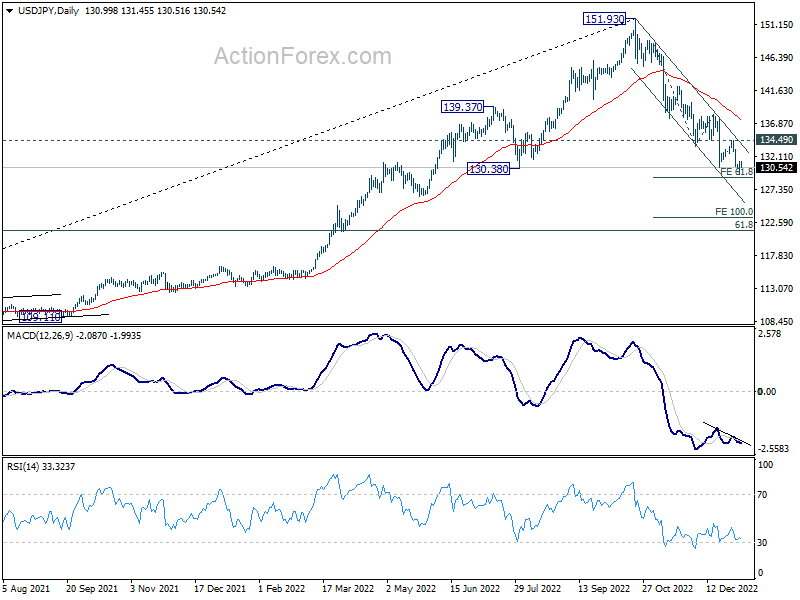
In the bigger picture, a medium term top was in place at 151.93. Sustained trading below 55 week EMA (now at 131.65) would raise the chance of bearish trend reversal. Deeper fall would be seen to 61.8% retracement of 102.58 to 151.93 at 121.43. This will now remain the favored case as long as 55 day EMA (now at 137.54) holds.
USD/CAD Daily Outlook
Daily Pivots: (S1) 1.3567; (P) 1.3626; (R1) 1.3729; More....
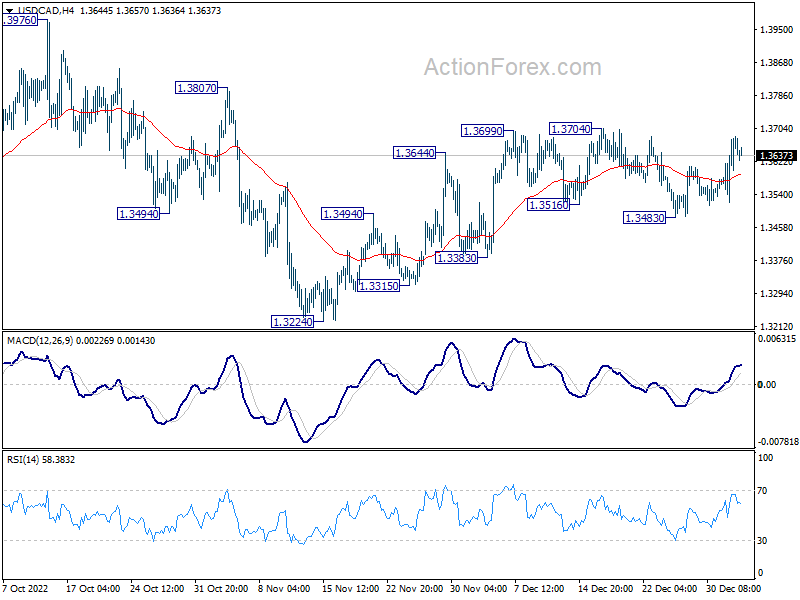
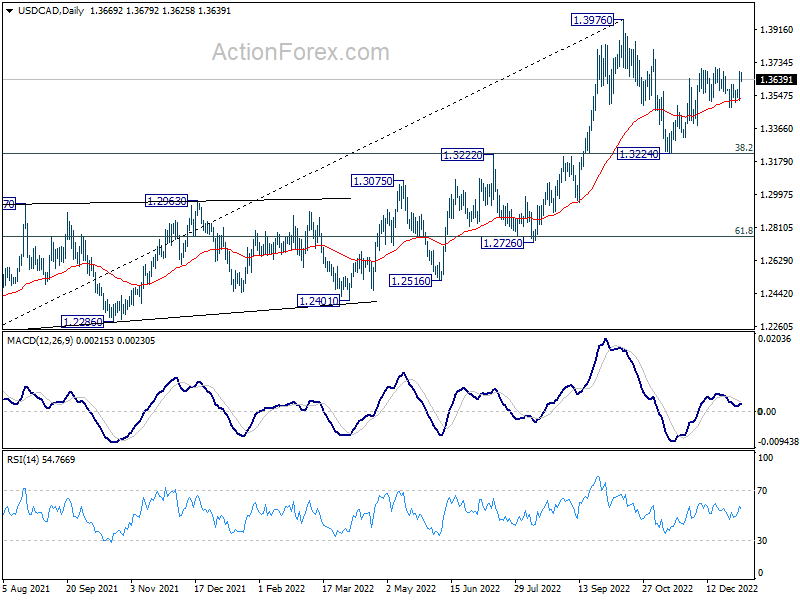
Intraday bias in USD/CAD remains neutral and outlook is unchanged. On the upside, break of 1.3704 will resume the rebound from 1.3224 to retest 1.3976 high. On the downside, break of 1.3483 will turn bias back to the downside for 1.3224 support zone.
In the bigger picture, as long as 1.3222 cluster support (38.2% retracement of 1.2005 to 1.3976 at 1.3223) holds, larger up trend from 1.2005 (2021 low) is still expected to resume through 1.3976 high at a later stage. However, firm break of 1.3222/3 will indicate that the trend might have reversed. Deeper fall would be seen to next cluster support at 1.2726 (61.8% retracement at 1.2758).
AUD/USD Daily Report
Daily Pivots: (S1) 0.6665; (P) 0.6750; (R1) 0.6812; More...
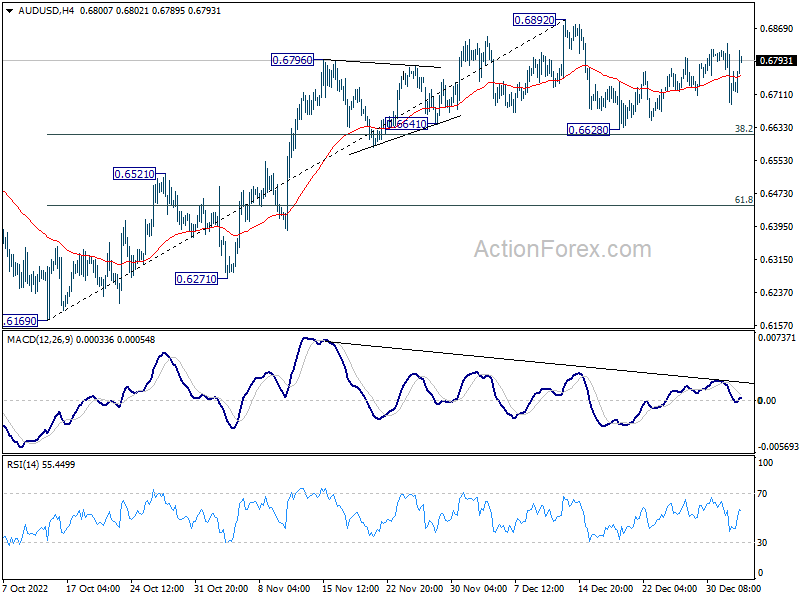
AUD/USD rebounds notably today but stays in range of 0.6628/6892. Intraday bias remains neutral for the moment. On the downside, sustained break of 38.2% retracement of 0.6169 to 0.6892 at 0.6616 will indicate rejection by 0.66871 fibonacci level. Deeper fall should then be seen to 61.8% retracement at 0.6445. On the upside, break of 0.6892 will resume the rally from 0.6169.
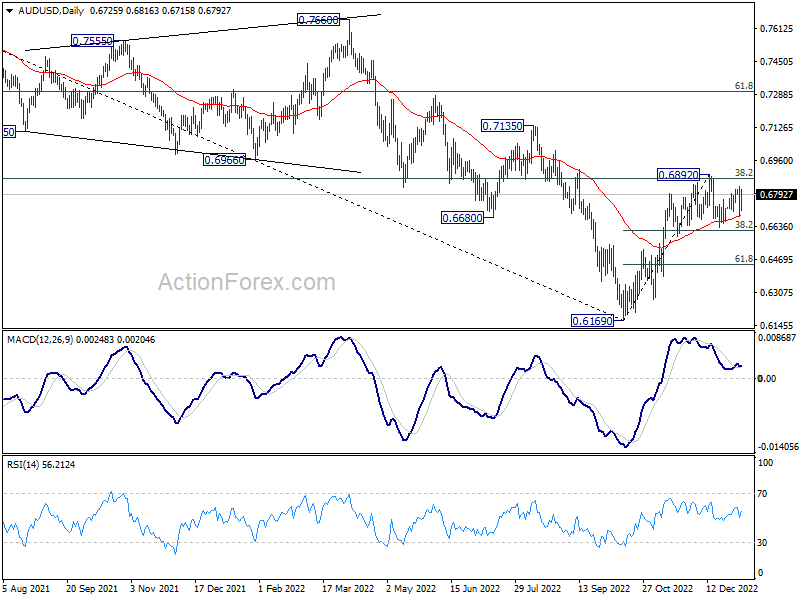
In the bigger picture, it's still unsure if price actions from 0.6169 medium term bottom are developing into a corrective pattern or trend reversal. Rejection by 38.2% retracement of 0.8006 to 0.6169 at 0.6871 will maintain medium term bearishness for another fall through 0.6169 at a later stage. However, firm break of 0.6871, and sustained trading above 55 week EMA (now at 0.6894) will raise the chance of the start of a bullish up trend.
Aussie Rises as China Considers Easing Coal Ban
Aussie rises broadly today on news that China is considering to lift the ban on its coal partially. The move also takes Kiwi higher. On the other hand, Dollar is turning softer together with loonie. Despite yesterday's rally attempt, the greenback is clearly hesitating ahead of today's ISM manufacturing and FOMC minutes, as well as Friday's non-farm payrolls. Yen is still the strongest for the week but it's now consolidating some gains. European majors are mixed, with Euro on the softer side.
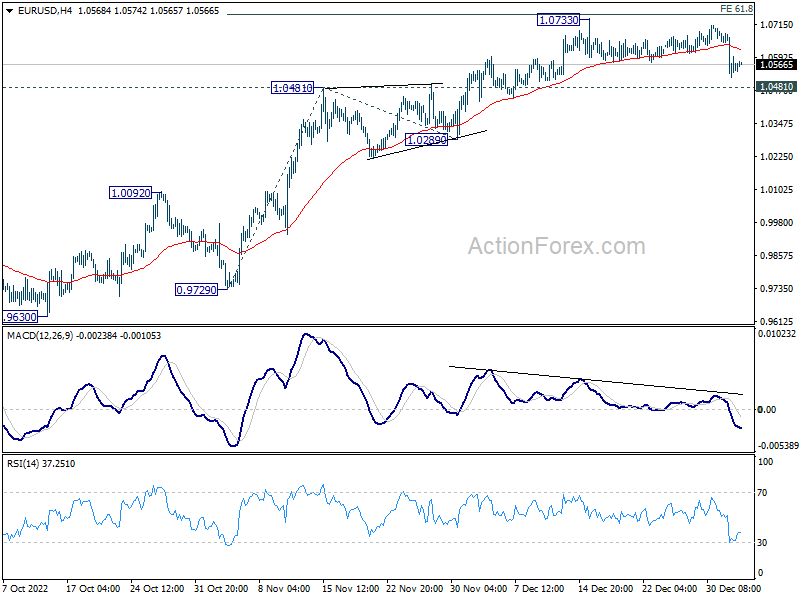
Technically, development in EUR/USD will be a key focus of the week. Conditions are there for the pair to at least correct the whole rally from 0.9534 low. But it needs to break through 1.0481 resistance turned support first. In that case, deeper fall would be seen to 1.0289 support and possibly below. However, strong rebound from 1.0481 will maintain near term bullishness for another rise through 1.0733, sooner rather than later.
In Asia, Nikkei closed down -1.45%. Hong Kong HSI is up 2.48%. China Shanghai SSE is up 0.11%. Singapore Strait Times is down -0.05%. Japan 10-year JGB yield is up 0.0427 at 0.458. Overnight, DOW dropped -0.03%. S&P 500 dropped -0.40%. NASDAQ dropped -0.76%. 10-year yield dropped -0.086 to 3.793.
ECB Kazaks see significant rate increases at Feb and Mar meetings
ECB Governing Council member Martins Kazaks said yesterday, "in the next two meetings I think we can still do quite large steps" on interest rates.
"Of course the steps may become smaller as necessary as we find the level appropriate to bring the inflation down to 2%," he added.
"Currently I would see that at the February and March meetings we will have significant rate increases," he said.
BoJ Kuroda expects economy to grow firmly and stably this year
BoJ Governor Haruhiko Kuroda told the bankers' association that Japan is facing uncertainties "such as inflation and pandemic. Yet, he expects the economy to "firmly and stably this year backed by accommodative monetary conditions."
Kuroda reiterated that the central bank would keep monetary easing to achieve the 2% inflation target accompanied by wage growth.
Separately, Prime Minister Fumio Kishida said on a radio program that aired Tuesday, "raising interest rates has an impact on people's day-to-day lives and small and midsize businesses It's not the case that all that needs to be done is to raise rates. The government and the Bank of Japan each have a role to play."
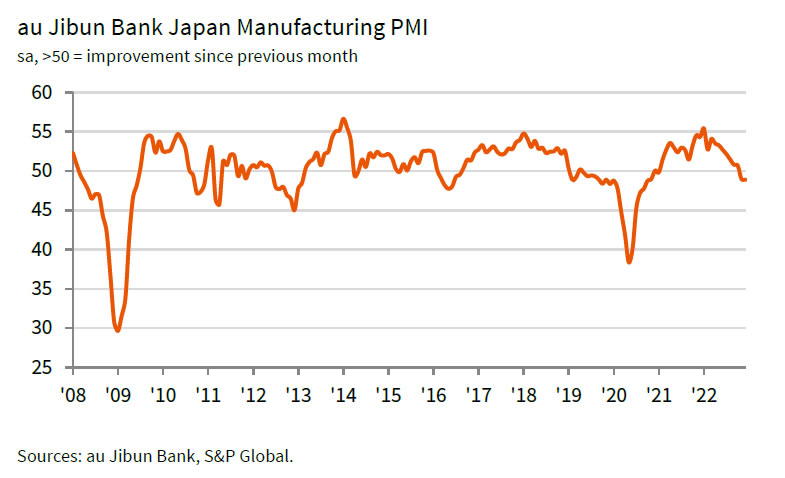
Japan PMI manufacturing finalized at 48.9, slipped further into contraction
Japan PMI Manufacturing was finalized at 48.9 in December, down from November's 49.0. That's the lowest level since October 2020. S&P Global noted there were strong reductions in output volumes and order books. Input buying was cut at strongest rate since September 2020. Supply pressures were the least widespread since February 2021.
Laura Den man, Economist at S&P Global Market Intelligence, said: "December PMI data saw the Japanese manufacturing sector slip further into contraction territory in the final month of 2022. The downturn was largely centred around the current demand environment which is weak both internationally and domestically....
"At the same time, forward looking indicators are increasingly painting a gloomier picture for Japan's manufacturing sector in the future. Companies have cut back input buying sharply, and business sentiment waned to a seven-month low."
China considering to ease Australian coal ban, AUD/NZD jumps
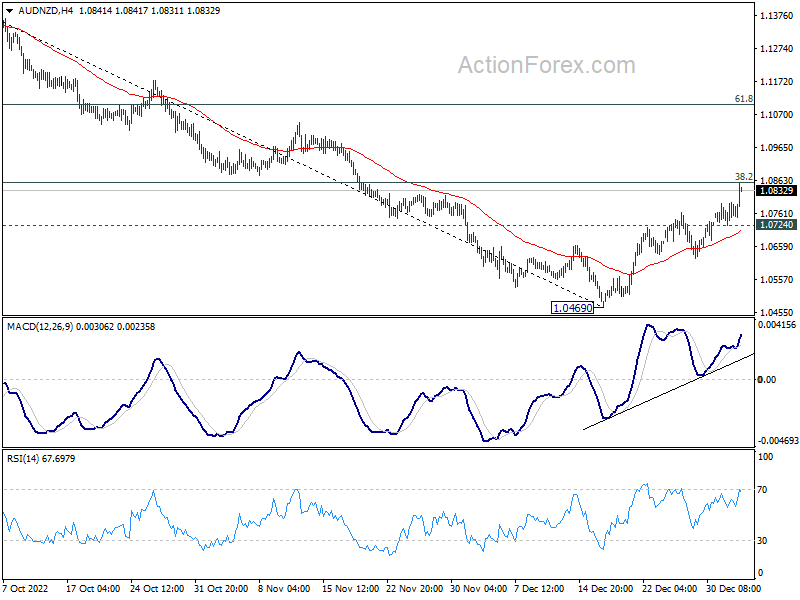
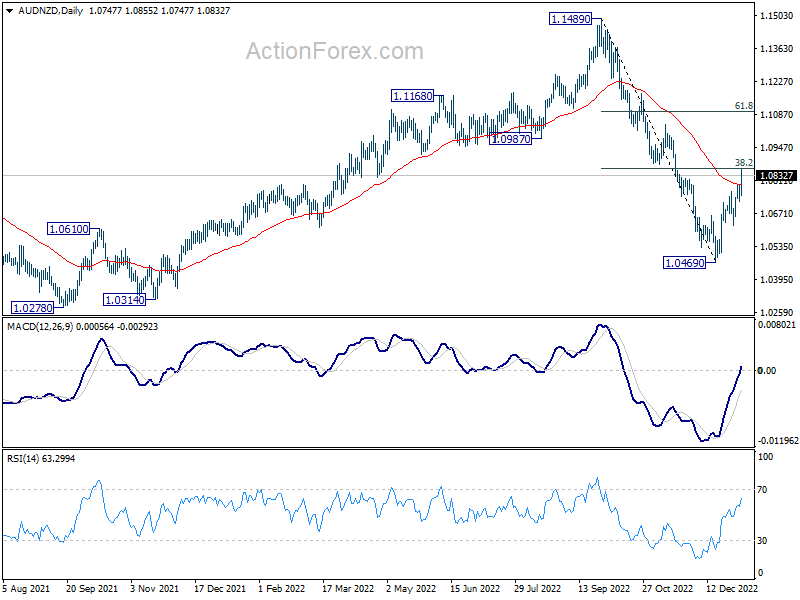
Australian Dollar rises broadly on news that China is considering to partially ease the ban on its coals. Bloomberg reported that China's National Development and Reform Commission held talks yesterday on proposals to allow four major coal importers to make new purchases on Australian coal this year, effective as soon as April 1.
AUD/NZD extends the rebound from 1.0469 and hits as high as 1.0855 so far. For now, further rally is expected in the cross as long as 1.0724 support holds. Sustained trading above 38.2% retracement of 1.1489 to 1.0469 at 1.0859 will pave the way to 61.8% retracement at 1.1099, even as a corrective move.
Looking ahead
Swiss CPI, Eurozone PMI services final, and UK mortgage approvals will be released in European session. US ISM manufacturing and FOMC minutes will be the main features later in the day.
AUD/USD Daily Report
Daily Pivots: (S1) 0.6665; (P) 0.6750; (R1) 0.6812; More...
AUD/USD rebounds notably today but stays in range of 0.6628/6892. Intraday bias remains neutral for the moment. On the downside, sustained break of 38.2% retracement of 0.6169 to 0.6892 at 0.6616 will indicate rejection by 0.66871 fibonacci level. Deeper fall should then be seen to 61.8% retracement at 0.6445. On the upside, break of 0.6892 will resume the rally from 0.6169.
In the bigger picture, it's still unsure if price actions from 0.6169 medium term bottom are developing into a corrective pattern or trend reversal. Rejection by 38.2% retracement of 0.8006 to 0.6169 at 0.6871 will maintain medium term bearishness for another fall through 0.6169 at a later stage. However, firm break of 0.6871, and sustained trading above 55 week EMA (now at 0.6894) will raise the chance of the start of a bullish up trend.
Economic Indicators Update
| GMT | Ccy | Events | Actual | Forecast | Previous | Revised |
|---|---|---|---|---|---|---|
| 00:01 | GBP | BRC Shop Price Index Y/Y Nov | 7.30% | 7.40% | ||
| 00:30 | JPY | Manufacturing PMI Dec F | 48.9 | 48.8 | 48.8 | |
| 07:00 | EUR | Germany Import Price Index M/M Nov | -1.70% | -1.20% | ||
| 07:30 | CHF | CPI M/M Dec | 0.00% | 0.00% | ||
| 07:30 | CHF | CPI Y/Y Dec | 3.40% | 3.00% | ||
| 08:45 | EUR | Italy Services PMI Dec | 47.6 | 49.5 | ||
| 08:50 | EUR | France Services PMI Dec F | 48.1 | 48.1 | ||
| 08:55 | EUR | Germany Services PMI Dec F | 49 | 49 | ||
| 09:00 | EUR | Eurozone Services PMI Dec F | 49.1 | 49.1 | ||
| 09:30 | GBP | Mortgage Approvals Nov | 54K | 59K | ||
| 09:30 | GBP | M4 Money Supply M/M Nov | 0.20% | 0.00% | ||
| 15:00 | USD | ISM Manufacturing PMI Dec | 48.6 | 49 | ||
| 15:00 | USD | ISM Manufacturing Prices Paid Dec | 42.3 | 43 | ||
| 15:00 | USD | ISM Manufacturing Employment Index Dec | 48.4 | |||
| 19:00 | USD | FOMC Minutes |
China considering to ease Australian coal ban, AUD/NZD jumps
Australian Dollar rises broadly on news that China is considering to partially ease the ban on its coals. Bloomberg reported that China's National Development and Reform Commission held talks yesterday on proposals to allow four major coal importers to make new purchases on Australian coal this year, effective as soon as April 1.
AUD/NZD extends the rebound from 1.0469 and hits as high as 1.0855 so far. For now, further rally is expected in the cross as long as 1.0724 support holds. Sustained trading above 38.2% retracement of 1.1489 to 1.0469 at 1.0859 will pave the way to 61.8% retracement at 1.1099, even as a corrective move.
Silver in Last Stage of Elliott Wave Ending Diagonal
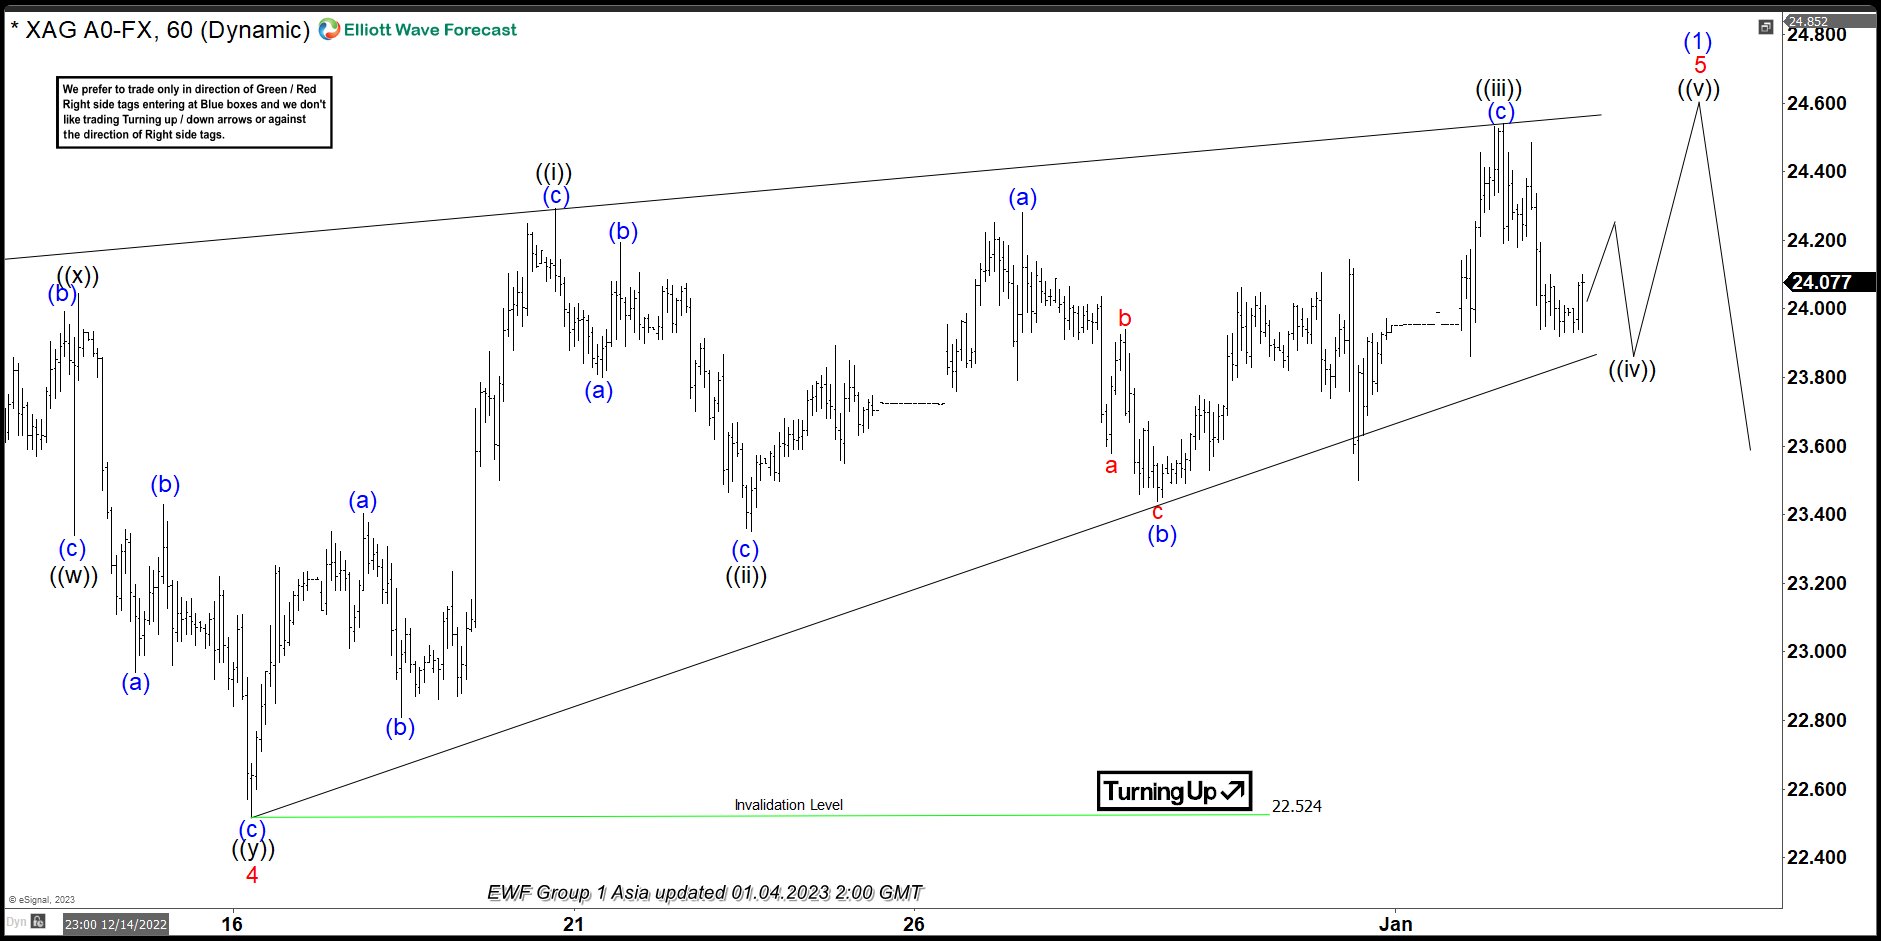
Rally in Silver from 9.1.2022 low is in progress as a 5 waves impulse structure. Up from 9.1.2022 low, wave 1 ended at 20 and pullback in wave 2 ended at 17.97. The metal extends higher in wave 3 towards 24.12, and pullback in wave 4 ended at 22.56. Wave 5 is currently ongoing as an ending diagonal Elliott Wave structure as the 1 hour chart below shows. Ending diagonal is a 5 waves subdivision where each leg subdivides in to 3 swing. Thus, ending diagonal is often called as a 3-3-3-3-3 structure. Up from wave 4, wave ((i)) ended at 24.29 as a 3 waves zigzag (a)-(b)-(c). Pullback in wave ((ii)) ended at 23.35 with internal subdivision also as a zigzag (a)-(b)-(c).
Wave ((iii)) higher ended at 24.54 with internal subdivision as a zigzag (a)-(b)-(c). Expect wave ((iv)) pullback to end soon as a 3 waves, then the metal should extend higher again in wave ((v)). This last move higher should complete wave 5 of (1) in higher degree and end the cycle from 9.1.2022 low. Afterwards, the metal should pullback to correct that cycle in larger degree 3, 7, or 11 swing. Near term, as far as pivot at 22.52 low stays intact, expect Silver to extend higher a bit more to complete the 5 waves ending diagonal before the pullback happens.
XAGUSD 60 Minutes Elliott Wave Chart
https://www.youtube.com/watch?v=odooqkL9EiE
Technical Outlook and Review
USD/JPY:
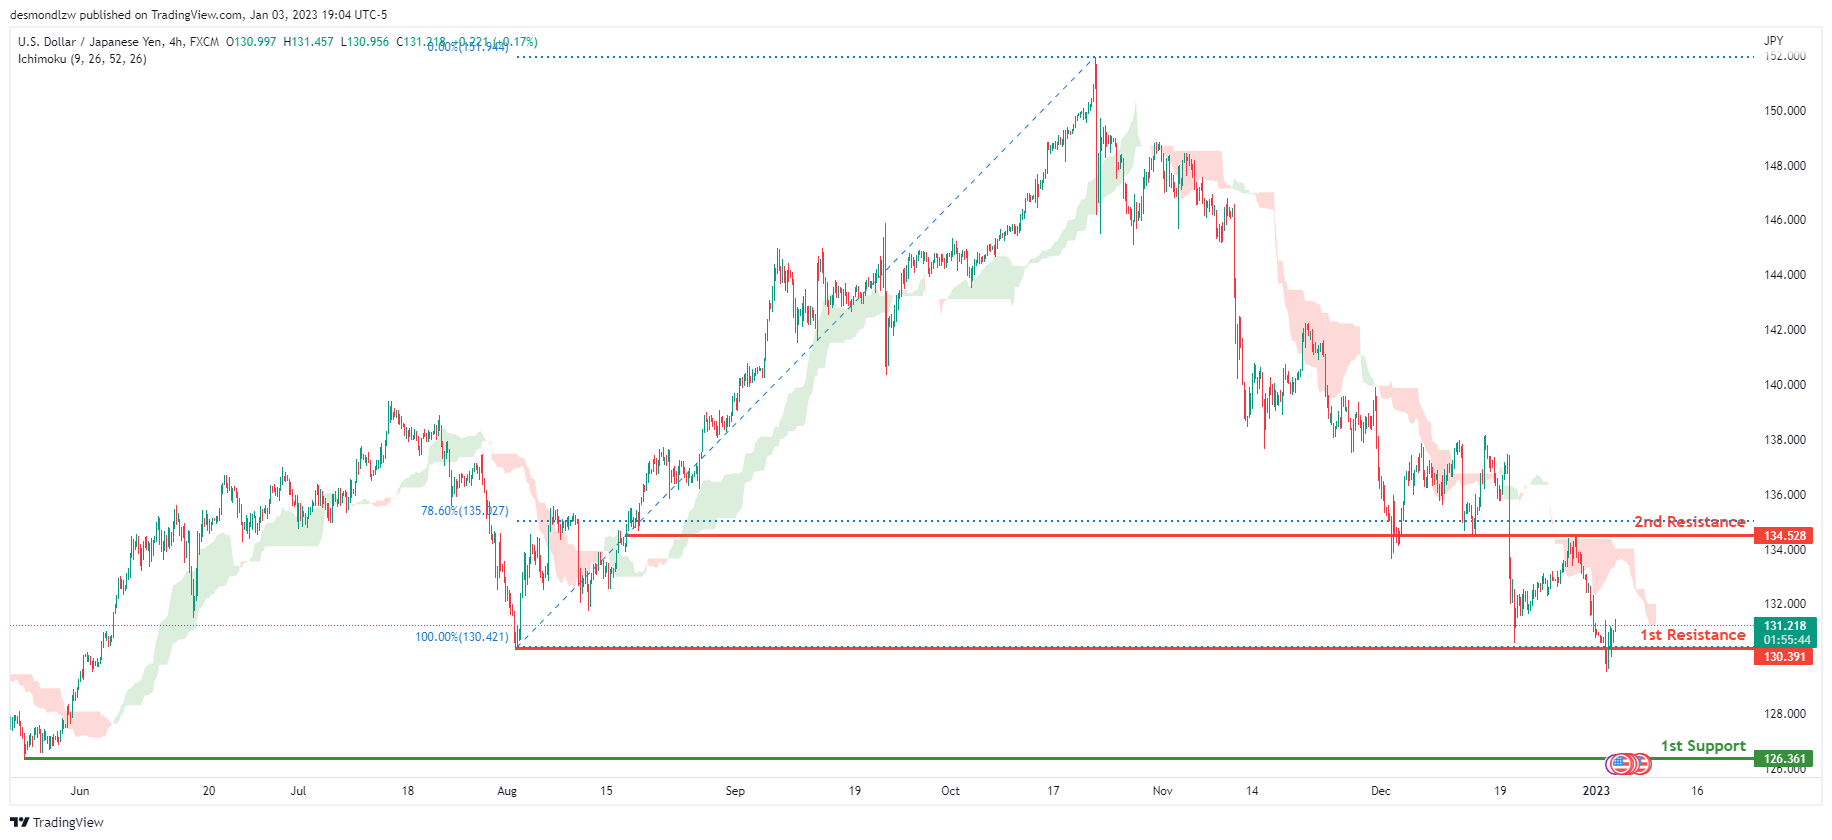
Looking at the H4 chart, my overall bias for USDJPY is bearish due to the current price being below the Ichimoku cloud, indicating a bearish market. If this bearish momentum continues, expect price to possibly continue heading towards the 1st support at 126.361, where the previous swing low is.In an alternate scenario, price could possibly head back up breaking the 1st resistance level at 130.391, where the previous swing low is before heading towards the 2nd resistance at 134.528, where the 78.6% Fibonacci line is.
Areas of consideration:
- H4 time frame, 1st resistance at 130.391
- H4 time frame, 2nd resistance at 134.528
- H4 time frame, 1st support at 126.361
DXY:
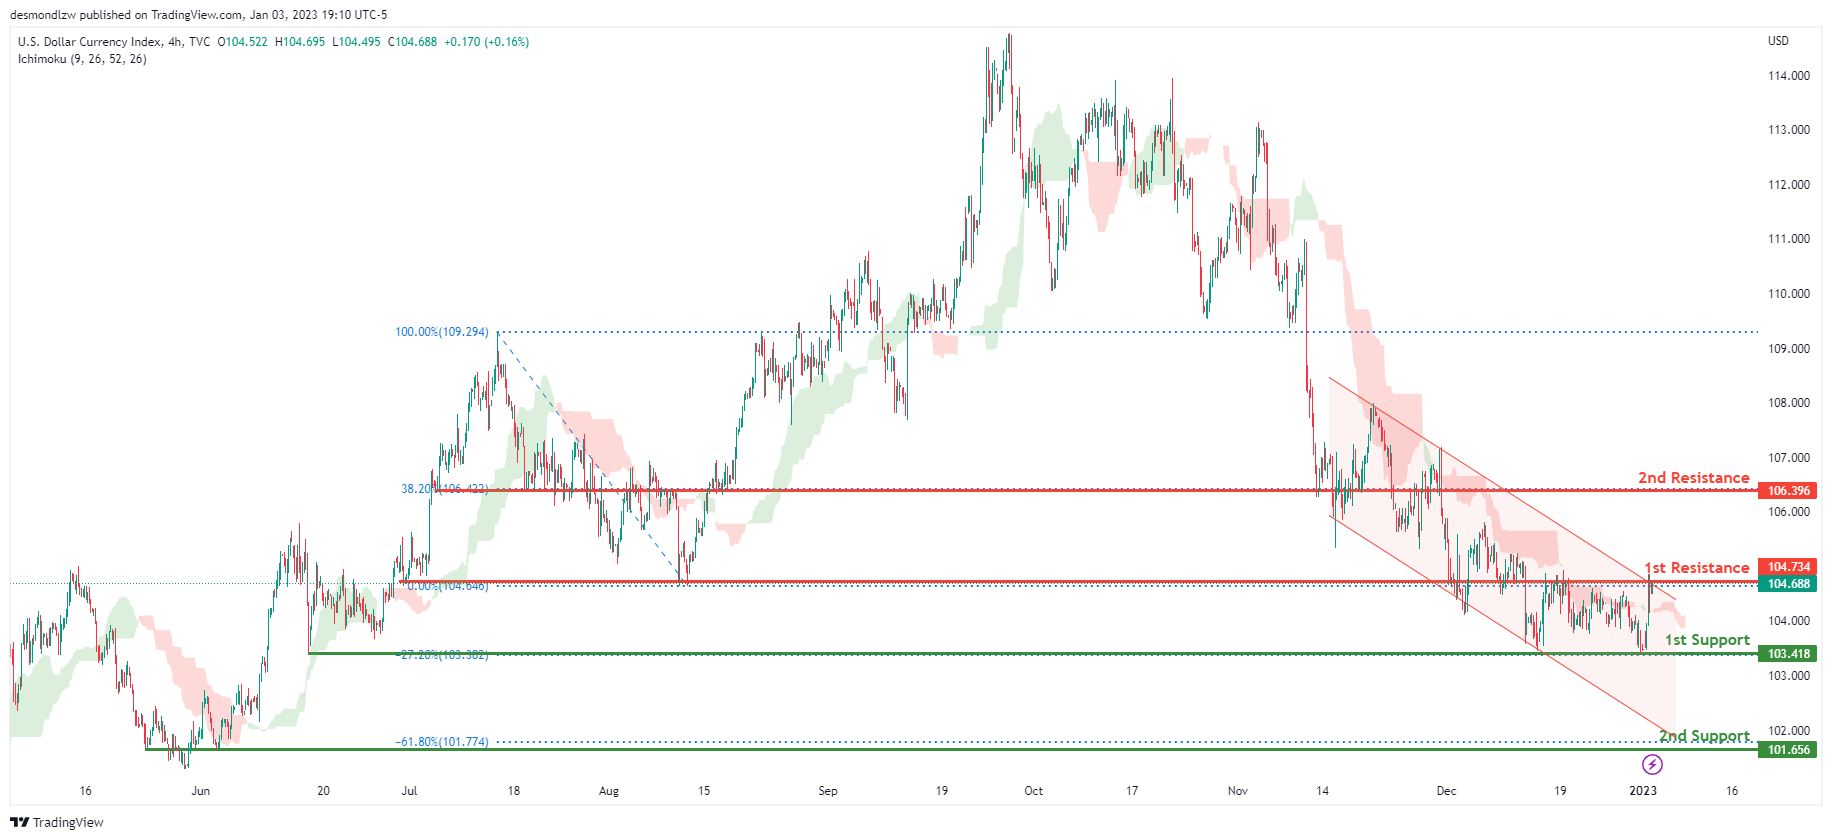
On the H4 chart, the overall bias for DXY is bearish. To add confluence to this, the price is within the descending channel which indicates a bearish market. If this bearish momentum continues, expect the price to possibly break the 1st support line at 103.418, where the -27.2% Fibonacci expansion line is before heading towards the 2nd support at 101.656, where the -61.8% Fibonacci expansion line is. In an alternative scenario, price could head back up and break the 1st resistance line resistance at 104.734, where the previous swing low is before heading towards the 2nd resistance at 106.396, where the 38.2% Fibonacci line is.
Areas of consideration:
- H4 time frame, 1st resistance at 104.734
- H4 time frame, 1st support at 103.418
- H4 time frame, 2nd support at 101.656
EUR/USD:
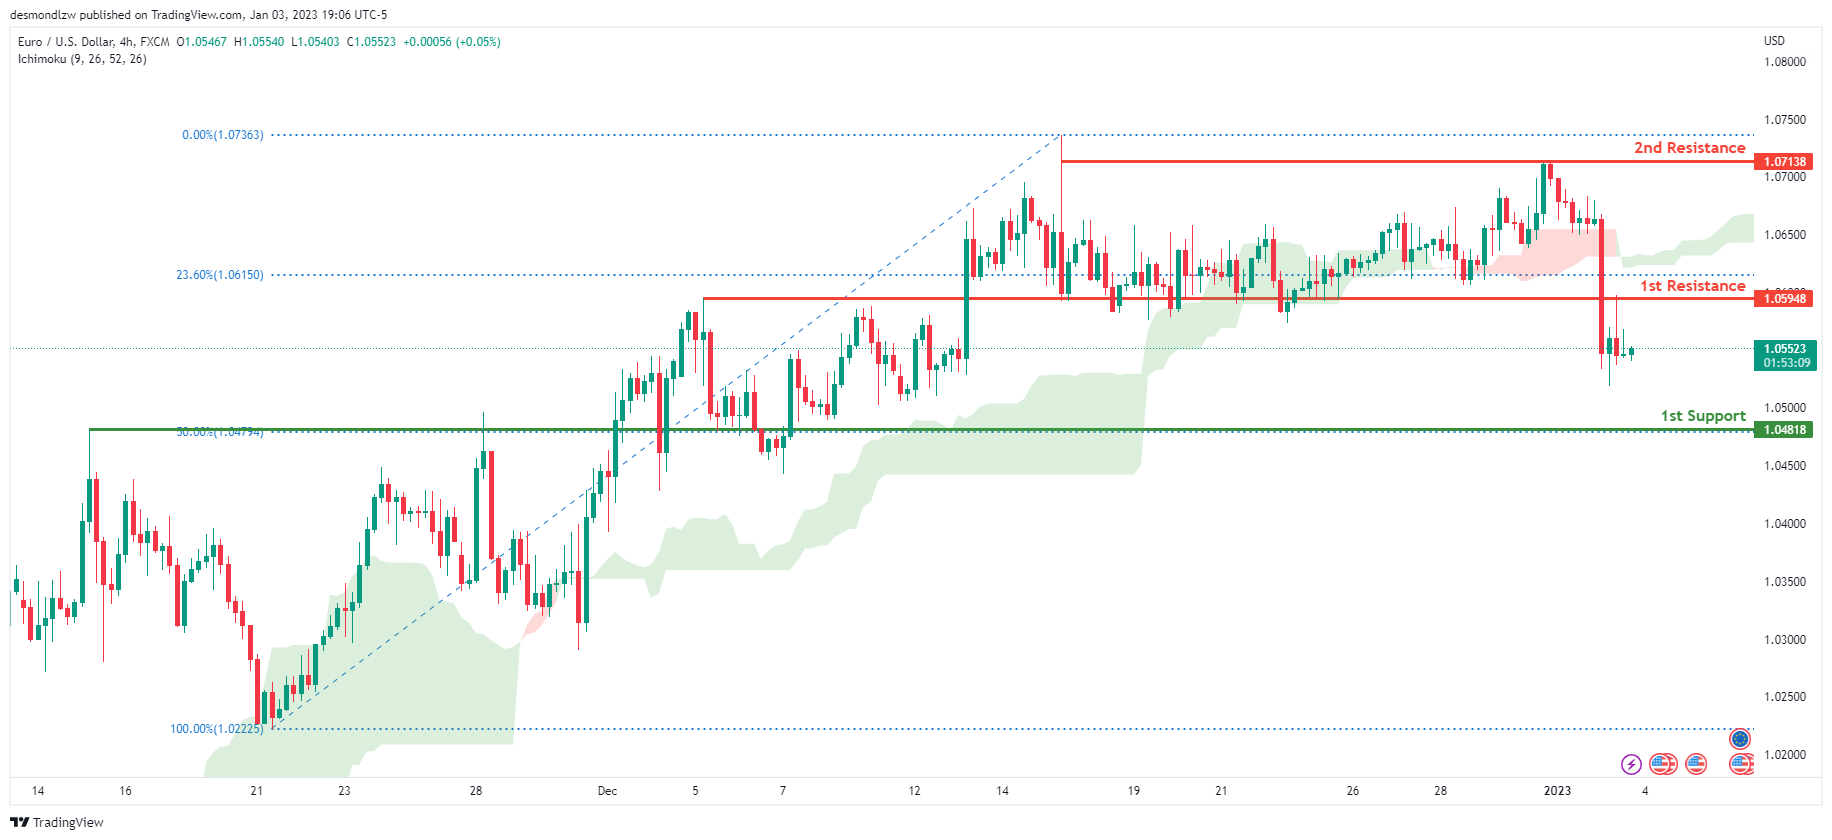
Looking at the H4 chart, my overall bias for EURUSD is bullish due to the current price being above the Ichimoku cloud, indicating a bullish market. If this bullish momentum continues, expect the price to possibly head towards the 1st resistance at 1.05948, where the 23.6% Fibonacci line is. In an alternate scenario, price could possibly head back down towards the 1st support level at 1.04818, where the 50% Fibonacci line is.
Areas of consideration :
- H4 1st resistance at 1.05948
- H4 1st support at 1.04818
GBP/USD:
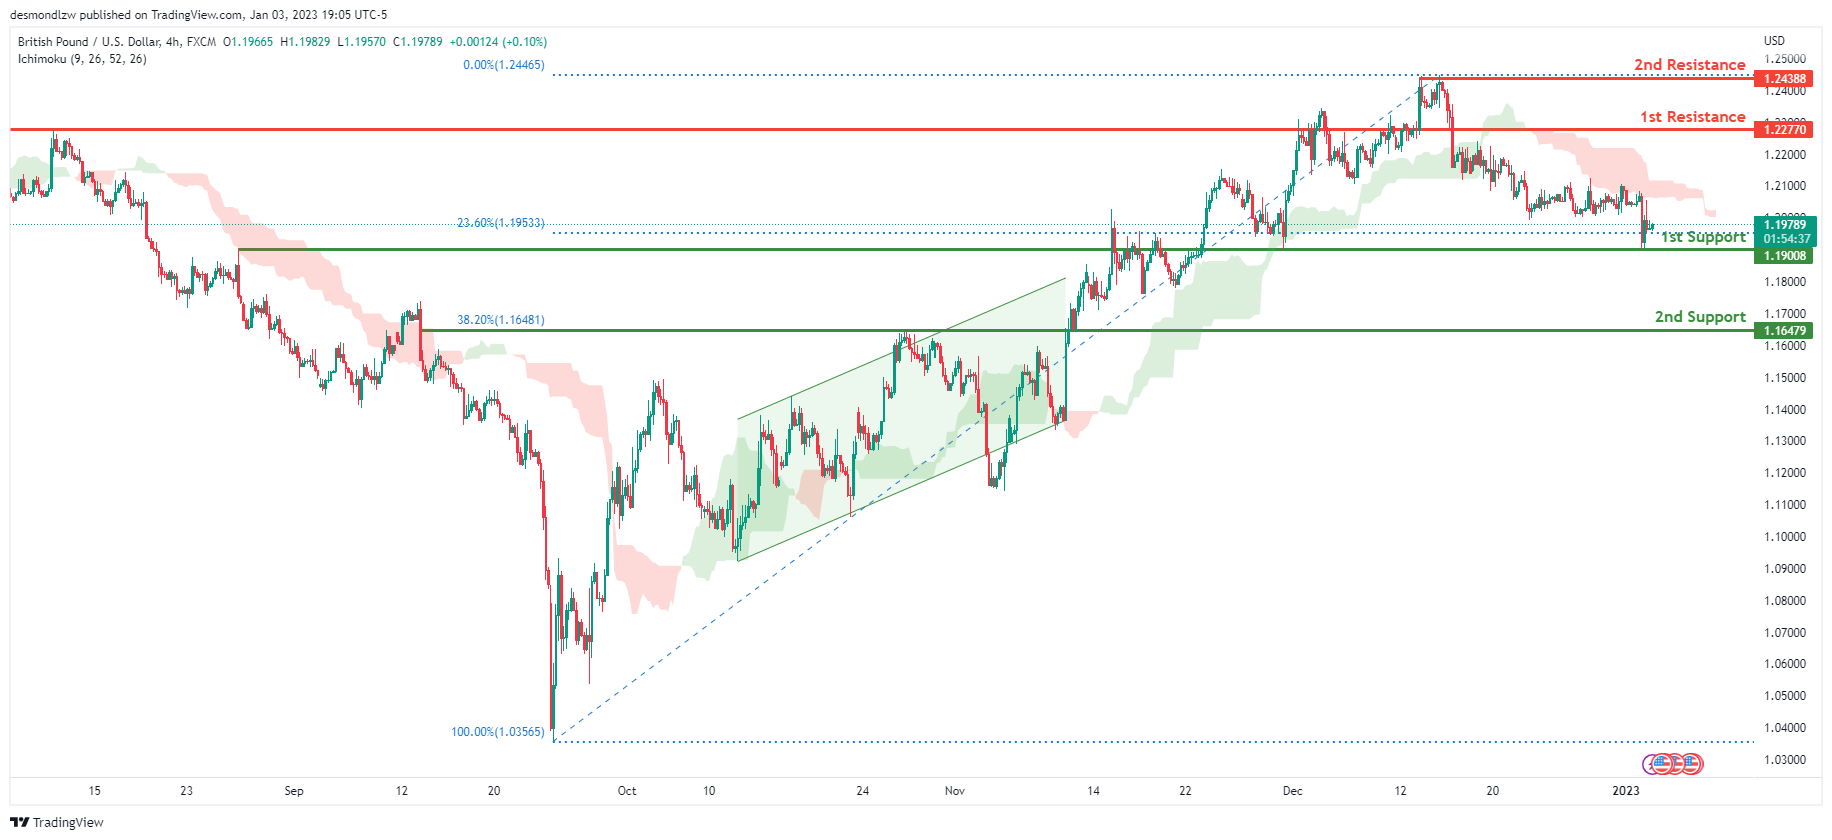
Looking at the H4 chart, my overall bias for GBPUSD is bearish due to the current price being below the Ichimoku cloud, indicating a bearish market. If this bearish momentum continues, expect price to possibly continue heading towards the 1st support at 1.19008, where the 23.6% Fibonacci line is. In an alternate scenario, price could possibly head back up to break the 1st resistance level at 1.22770, where the previous swing high is before heading towards the 2nd support at 1.16479, where the 38.2% Fibonacci line is.
Areas of consideration:
- H4 1st resistance at 1.22770
- H4 1st support at 1.19008
- H4 2nd support at 1.16479
USD/CHF:
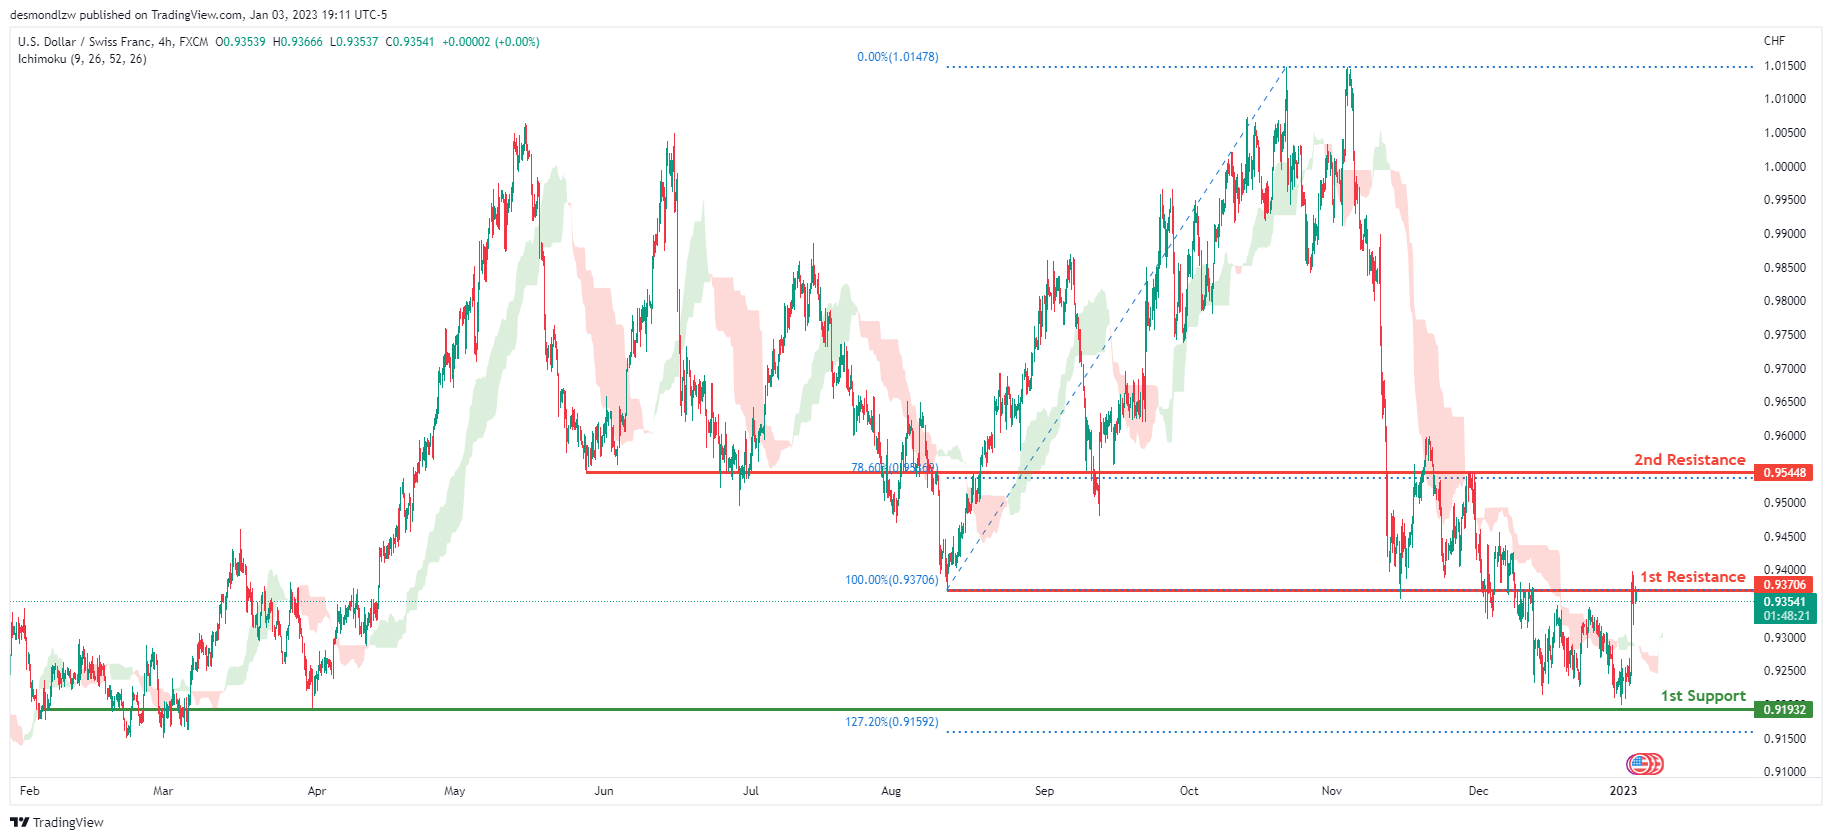
The overall bias for USDCHF on the H4 chart is bearish. In addition, the price is crossing below the Ichimoku cloud, indicating a bearish market. If the current bearish trend continues, expect the price to head back down towards the 1st support line at 0.91932, where the previous swing low and 12.72% Fibonacci extension line is . In an alternative scenario, price could possibly head up breaking the 1st resistance at 0.93706, where the previous swing low is, before heading towards the 2nd resistance at 0.95448, where the 78.6% Fibonacci line is.
Areas of consideration
- H4 1st support at 0.91932
- H4 1st resistance at 0.93706
- H4 2nd resistance at 0.95448
XAU/USD (GOLD):
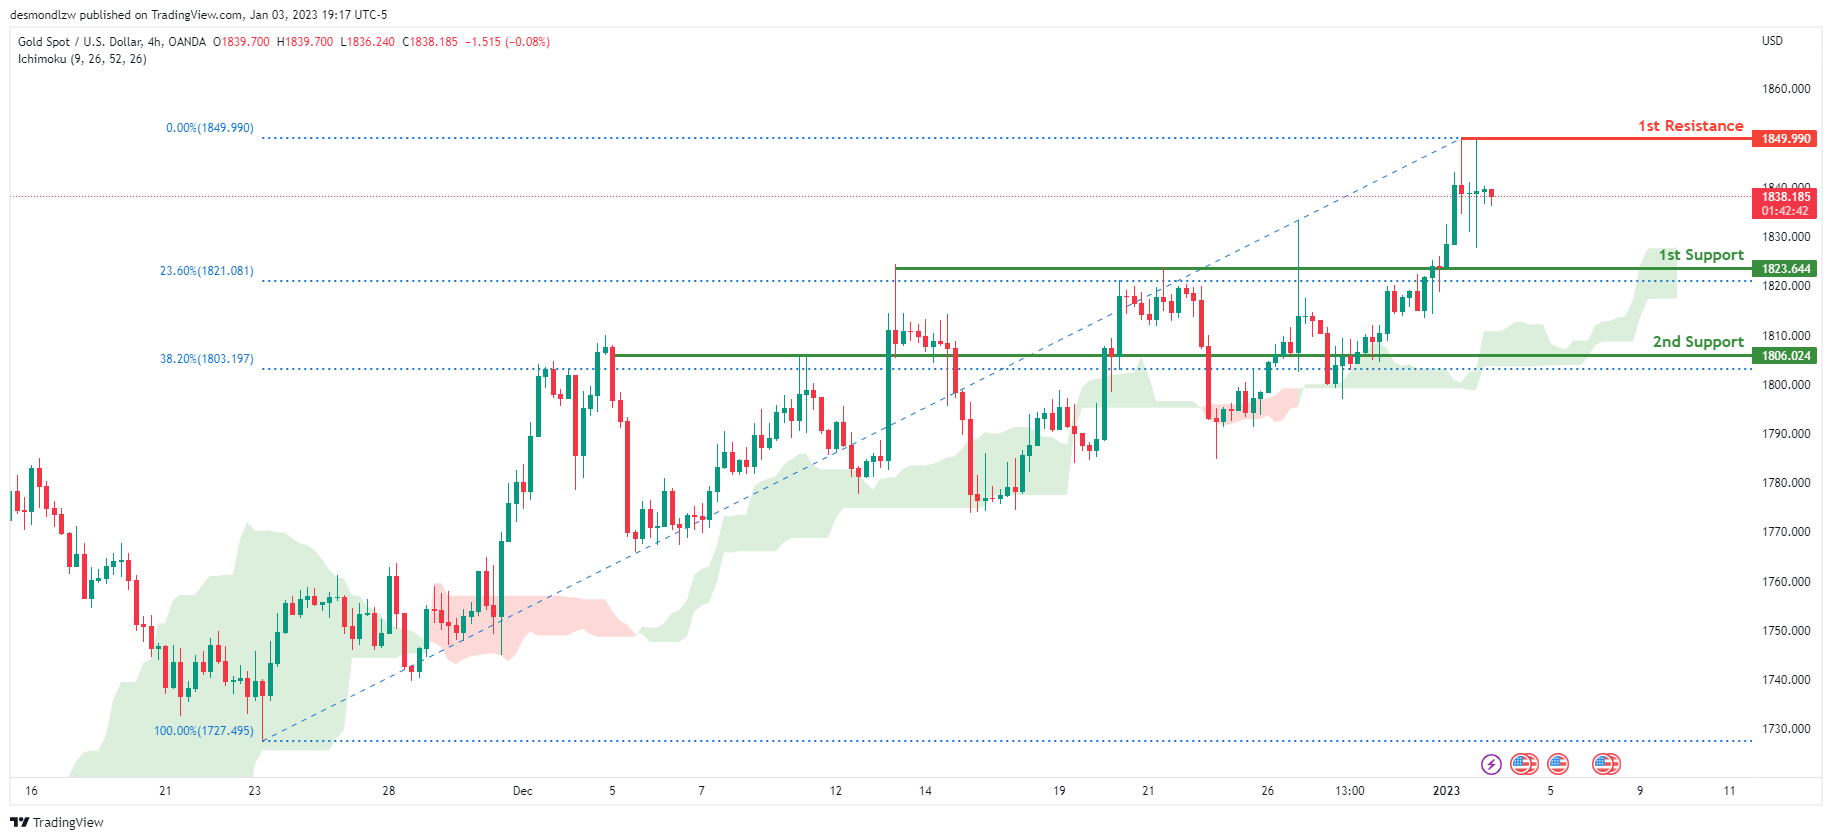
Looking at the H4 chart, my overall bias for XAUUSD is bullish due to the current price crossing above the Ichimoku cloud, indicating a bullish market. If this bullish momentum continues, expect the price to continue heading towards the 1st resistance at 1849.990 where the recent high is. In an alternative scenario, price could possibly head back down towards the 1st support at 1823.644, where the 23.62% Fibonacci line is.
Areas of consideration:
- H4 time frame, 1st resistance at 1849.990
- H4 time frame, 1st support at 1823.644
AUD/USD:
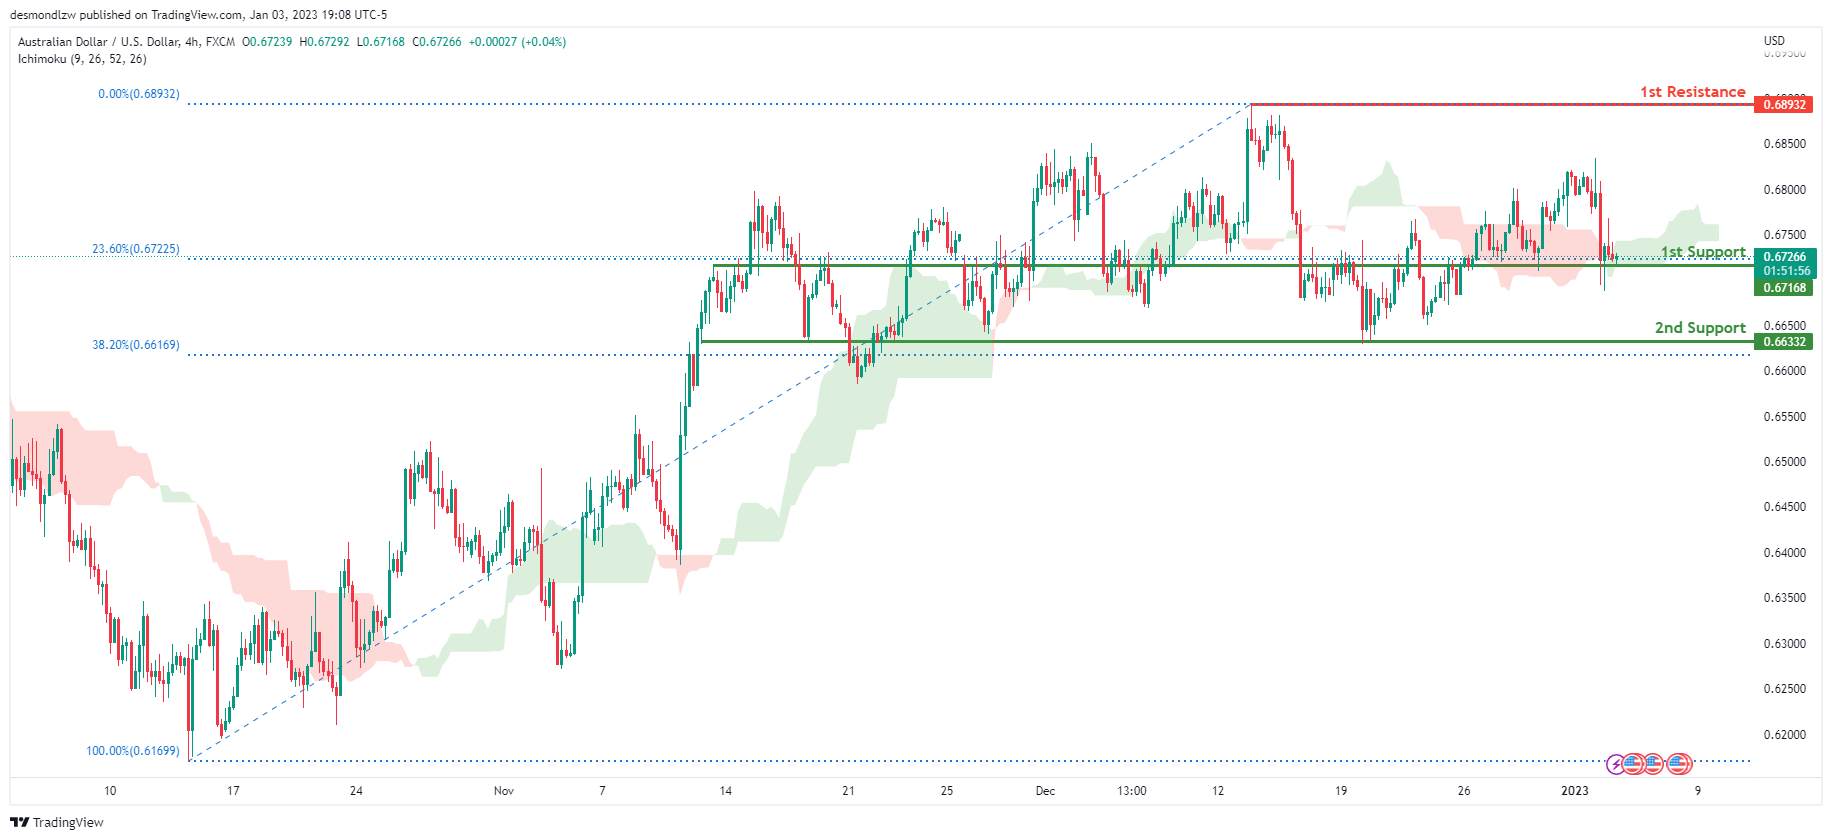
Looking at the H4 chart, my overall bias for AUDUSD is bearish due to the current price crossing below the Ichimoku cloud, indicating a possible shift to bearish market structure. If this bearish momentum continues, expect the price to possibly head back down breaking the 1st support at 0.67168, where the 23.6% Fibonacci line is, before heading towards the 2nd support at 0.66332, where the 38.2% Fibonacci line is. In an alternative scenario, price could possibly head back up towards the 1st resistance at 0.68932, where the recent swing high is.
Areas of consideration
- H4, 1st resistance at 0.68932
- H4, 1st support at 0.67168
- H4, 2nd support at 0.66332
NZD/USD:
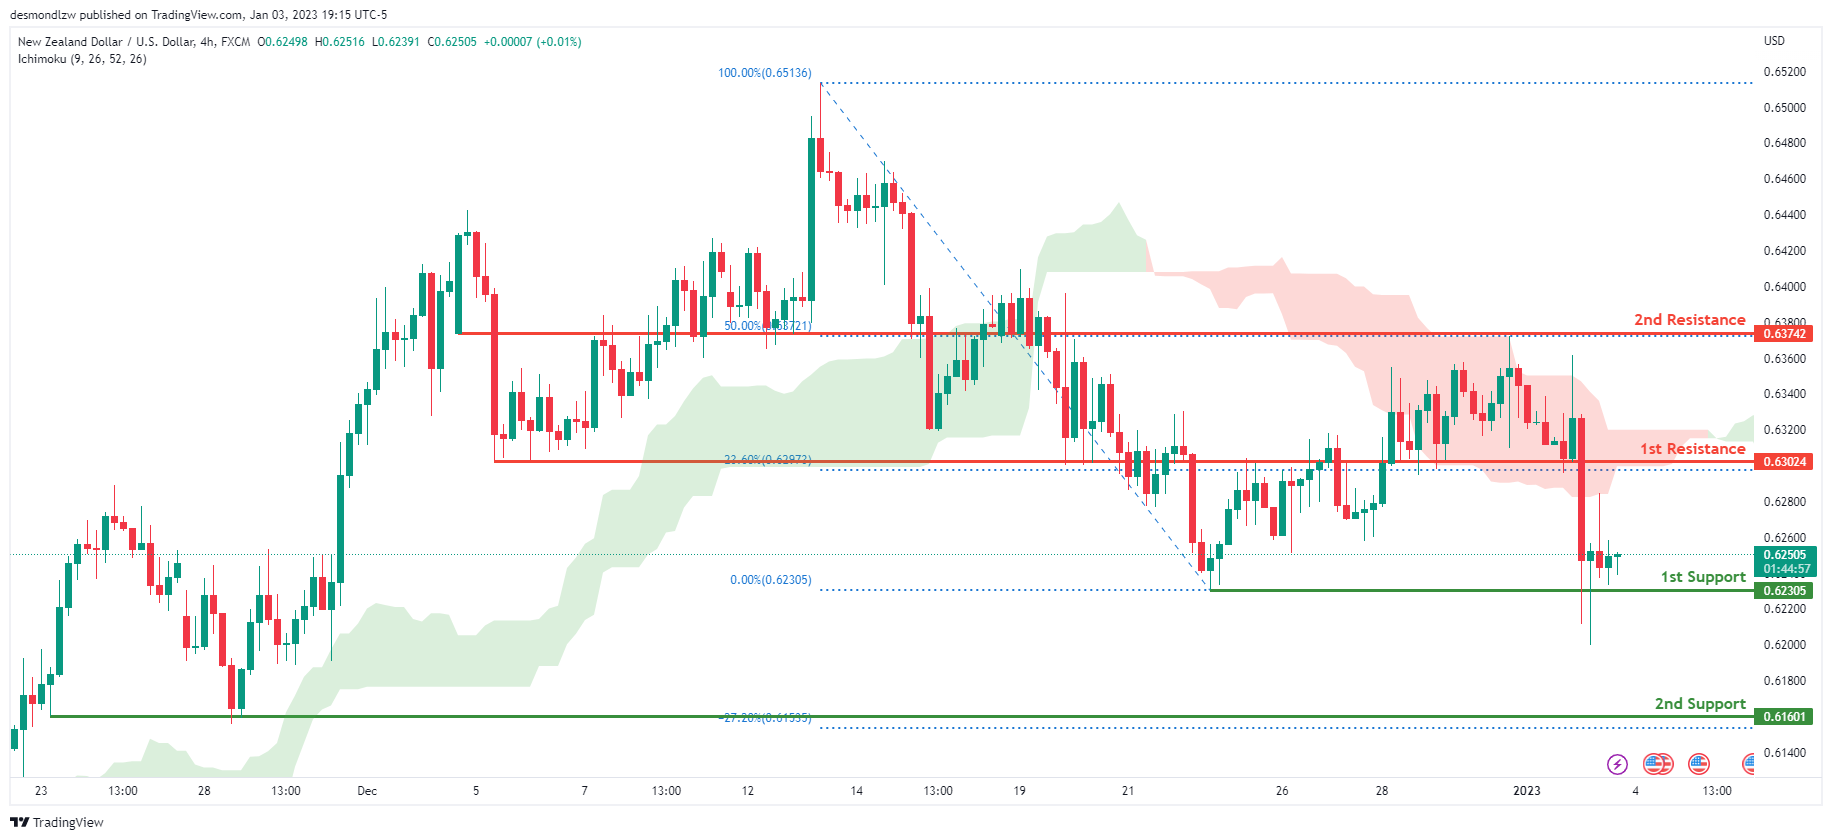
Looking at the H4 chart, my overall bias for NZDUSD is bearish due to the current price crossing below the Ichimoku cloud, indicating a bearish market. If this bearish momentum continues, expect price to possibly break the 1st support at 0.62305, where the previous swing low is, before heading towards the 2nd support at 0.61601, where the -27.2% Fibonacci line is. In an alternate scenario, price could possibly head back up towards the 1st resistance level at 0.63024, where the 23.6% Fibonacci line is
Areas of consideration:
- H4 time frame, 1st resistance at 0.63024
- H4 time frame, 1st support at 0.62305
- H4 time frame, 2nd support at 0.61601
USD/CAD:
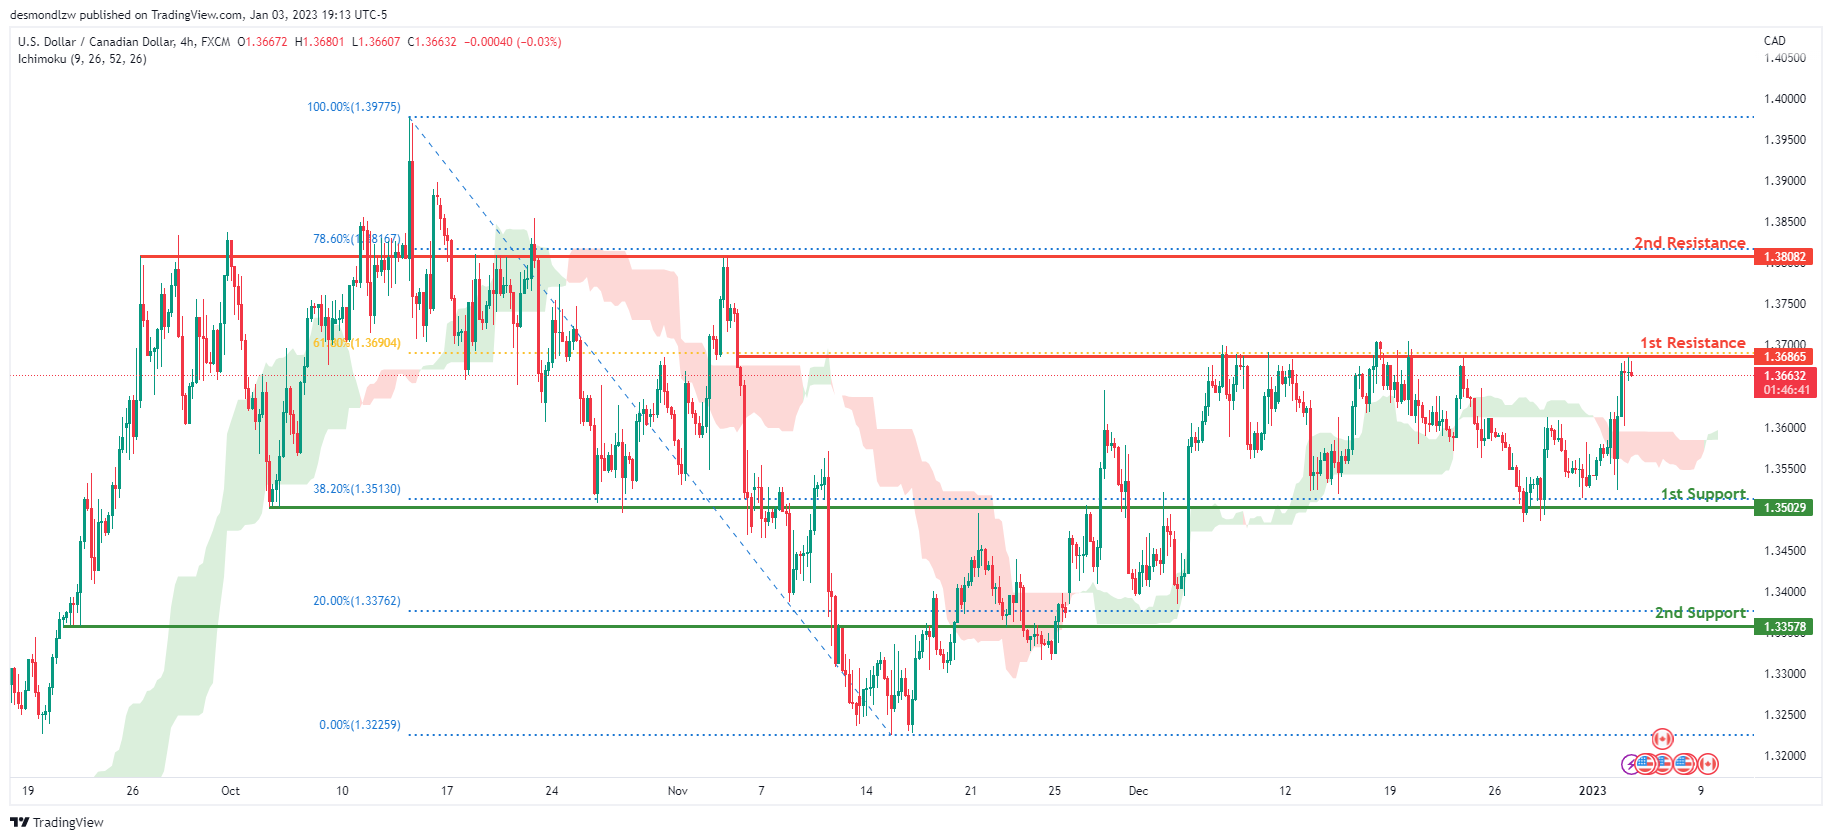
On the H4 chart, the overall bias for USDCAD is bullish . To add confluence to this, the price is above the Ichimoku cloud which indicates a bullish market. If this bullish momentum continues, expect the price to possibly head up and break 1st resistance line at 1.36865, where the 61.8% Fibonacci line is, before heading towards the 2nd resistance line at 1.38082, where the 78.6% Fibonacci line is. In an alternative scenario, price could head back down to break the 1st support at 1.35029, where the 38.2% Fibonacci line is, before heading towards the 2nd support at 1.33578, where the 20% Fibonacci line is.
Areas of consideration:
- H4 time frame, 1st resistance at 1.36865
- H4 time frame, 2nd resistance at 1.38082
- H4 time frame, 1st support at 1.35029
- H4 time frame, 2nd support at 1.33578
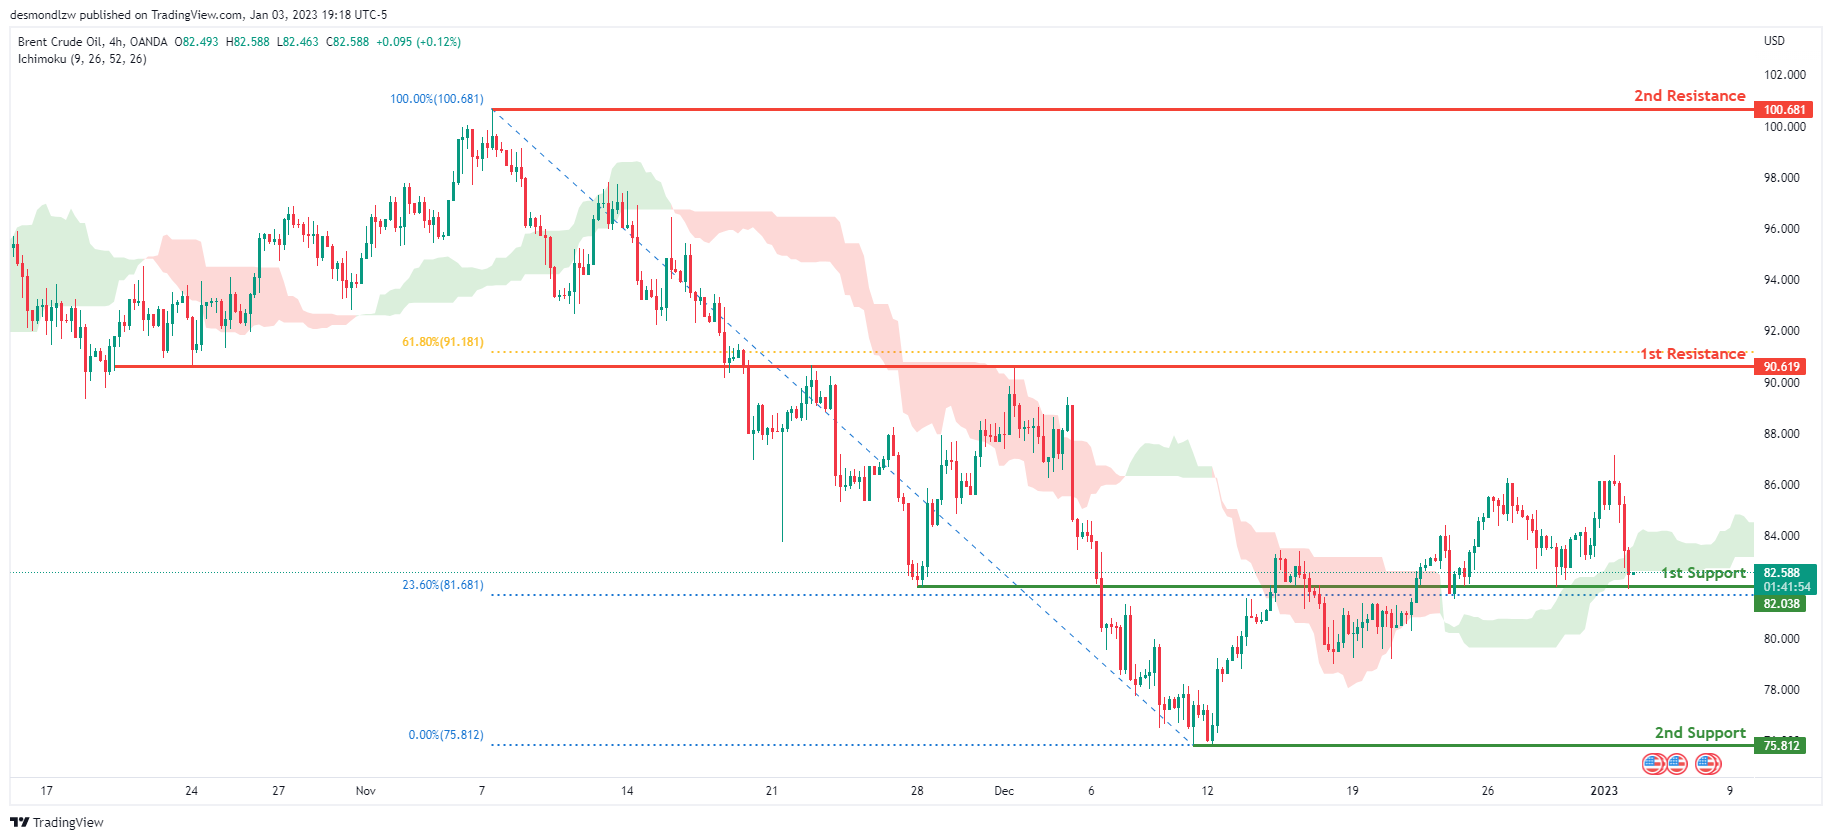
OIL:
Looking at the H4 chart, my overall bias for BCOUSD is bearish due to the current price crossing below the Ichimoku cloud, indicating a bearish market. If this bearish momentum continues, expect the price to possibly break the 1st support level at 82.038, where the 23.6% Fibonacci line is, before heading towards the 2nd support at 75.812, where the previous swing low is. In an alternate scenario, price could possibly head back up towards the 1st resistance at 90.619, where the 61.8% Fibonacci line is.
Areas of consideration:
- H4 time frame, 1st resistance at 90.619
- H4 time frame, 1st support at 82.038
- H4 time frame, 2nd support at 75.812
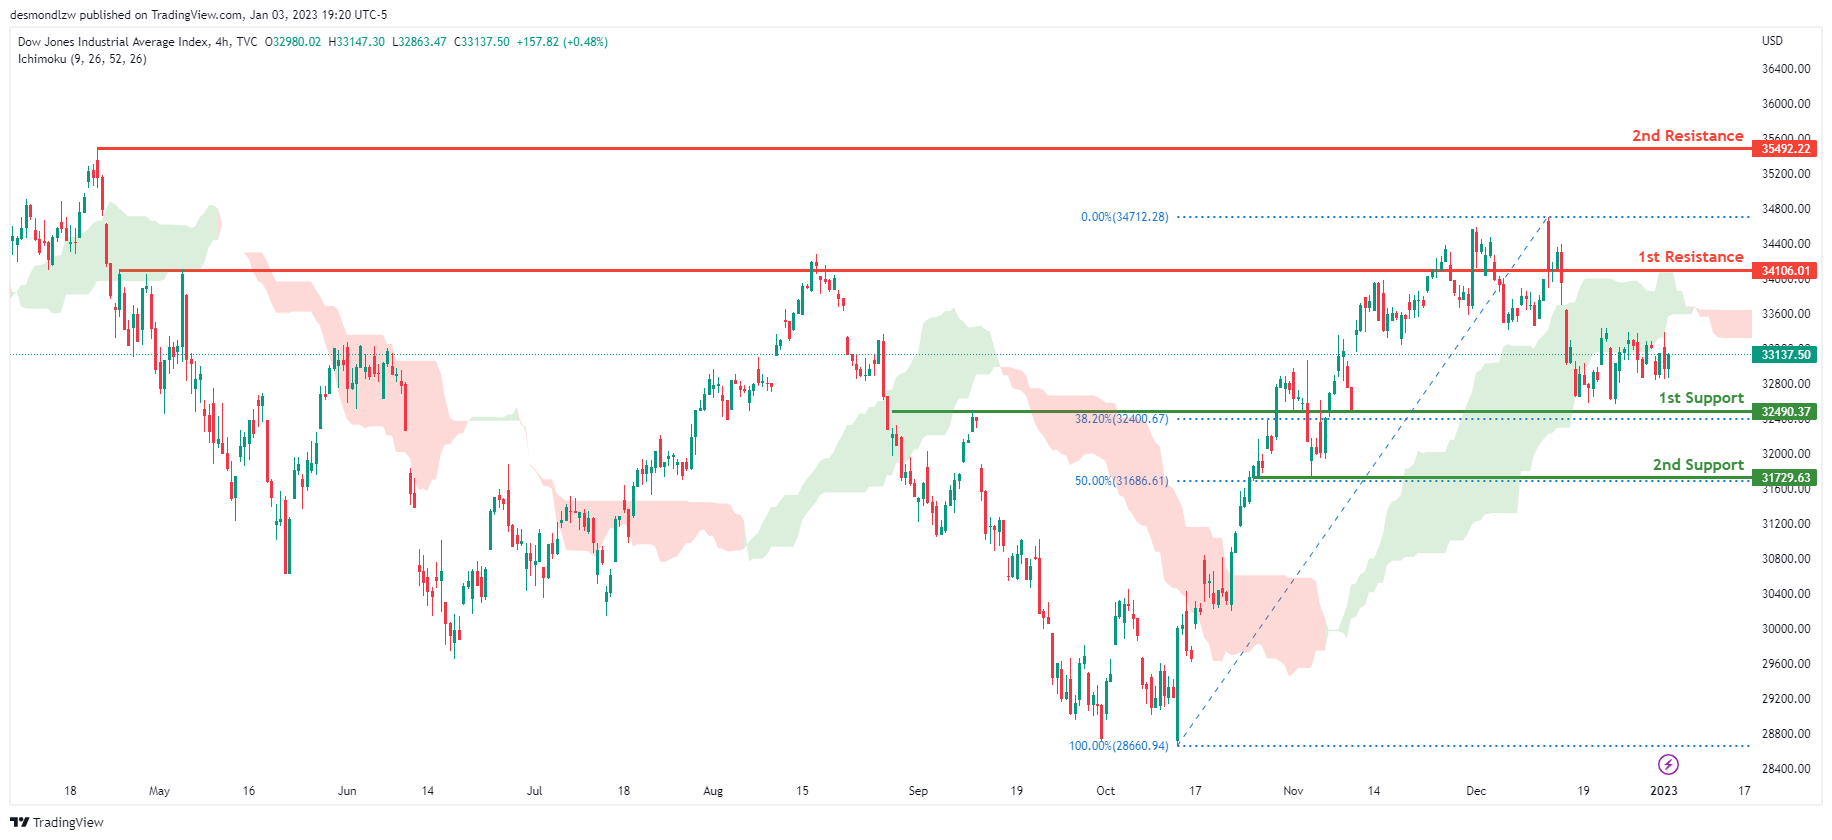
Dow Jones Industrial Average:
On the H4 chart, the overall bias for DJI is bearish. To add confluence to this, the price is below the Ichimoku cloud which indicates a bearish market. If this bearish momentum continues, expect the price to head back down towards the 1st support at 32490.37, where the 61.8% Fibonacci line is. In an alternative scenario, price could possibly break the 1st resistance line at 34106.01, where the previous swing high is before heading towards the 2nd resistance line at 35492.22, where the previous swing high is.
Areas of consideration:
- H4 time frame, 1st support at 32490.37
- H4 time frame, 1st Resistance at 34106.01
- H4 time frame, 2nd Resistance at 35492.22
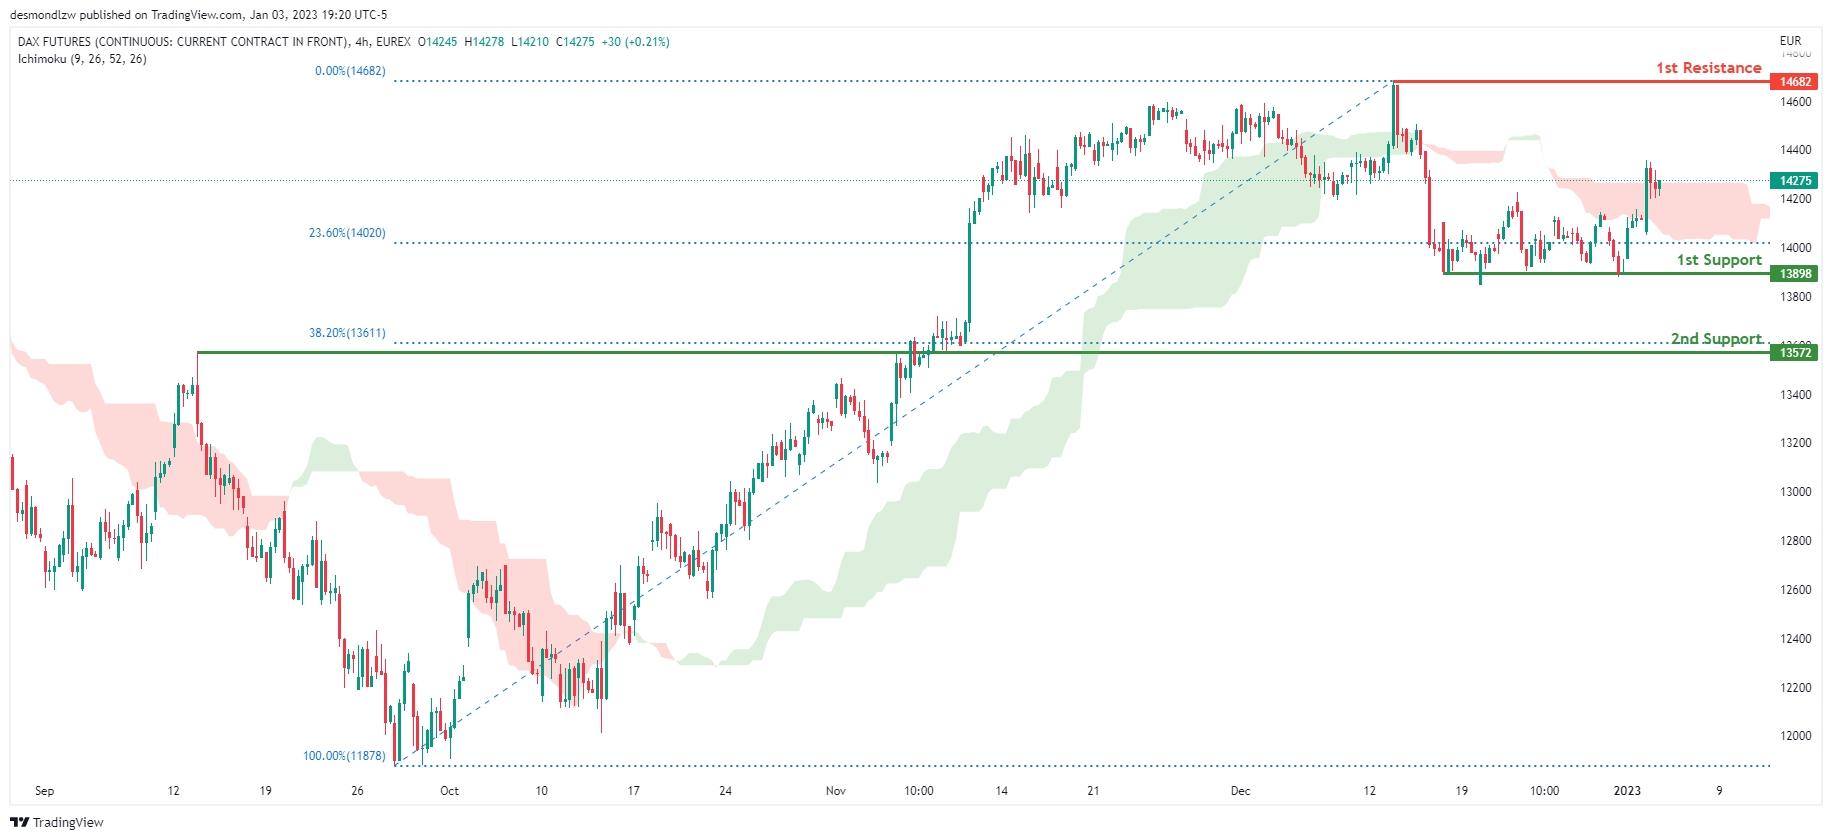
DAX:
Looking at the H4 chart, my overall bias for DAX is bullish due to the current price crossing above the Ichimoku cloud, indicating a bullish market. If this bullish momentum continues, expect the price to possibly head towards the 1st resistance line at 14682, where the previous swing high is. In an alternative scenario, price could possibly head down to retest the 1st support at 13898, where the 23.6% Fibonacci line is.
Areas of consideration:
- H4 time frame, 1st resistance is at 14682
- H4 time frame, 1st support is at 13898
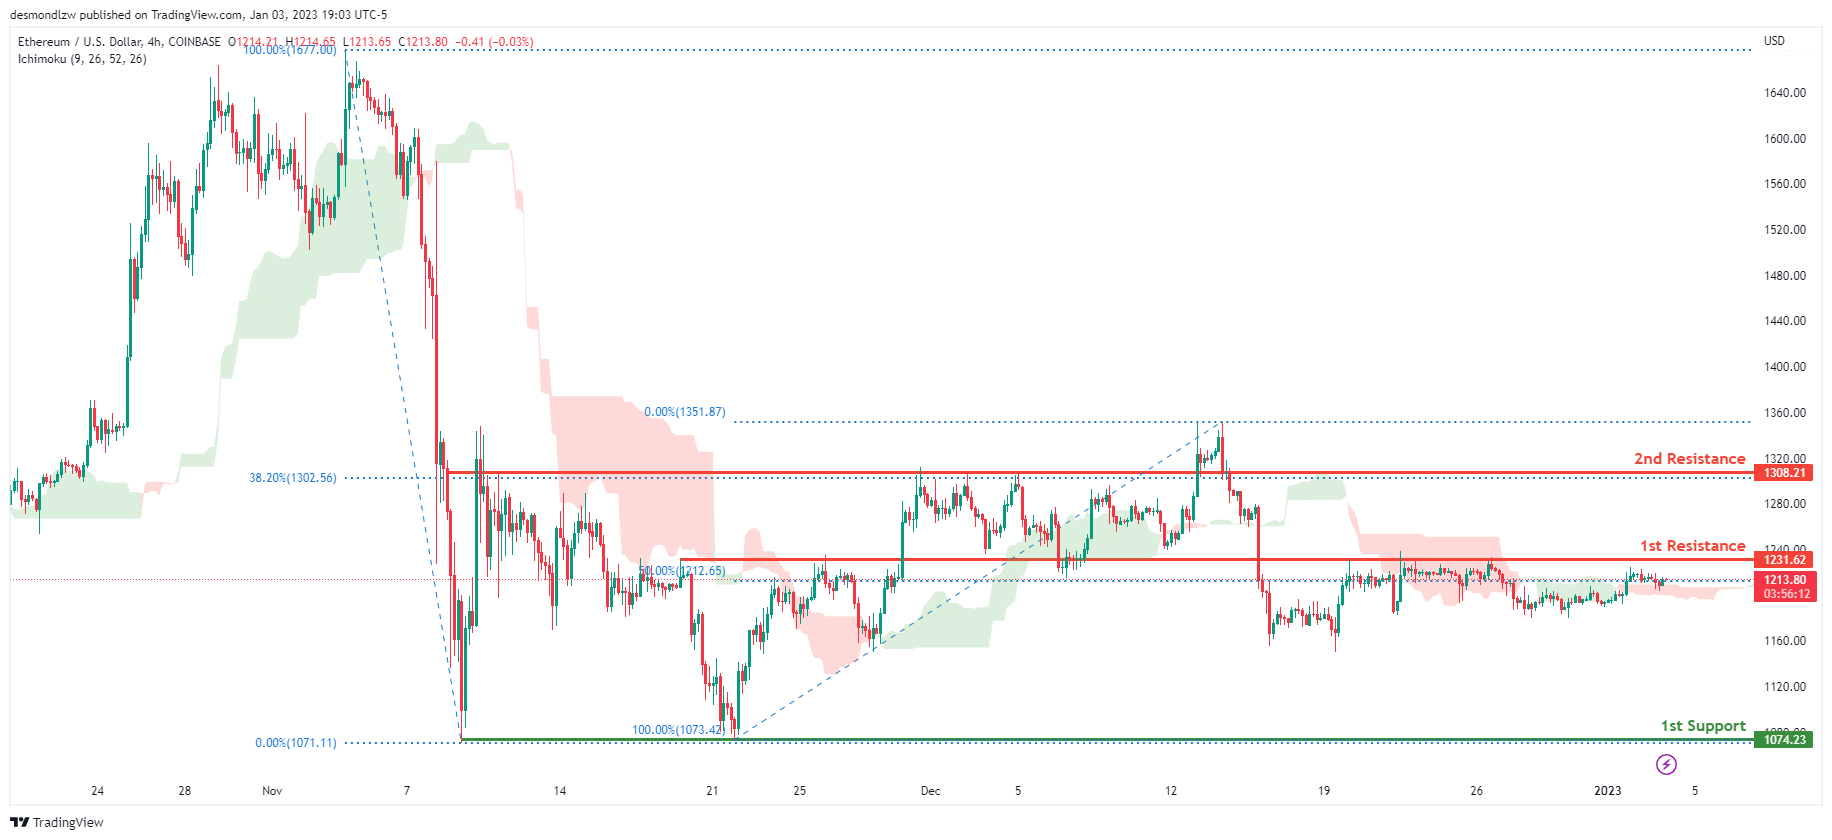
ETHUSD:
Looking at the H4 chart, my overall bias for ETHUSD is bearish due to the current price crossing below the Ichimoku cloud, indicating a bearish market. If this bearish momentum continues, expect price to head towards the 1st support at 1074.23, where the previous swing low is. In an alternative scenario, price could head back up to break the 1st resistance at 1231.62, where the 50% Fibonacci line is, before heading towards the 2nd resistance at 1308.21, where the 38.2% Fibonacci line is.
Areas of consideration:
- H4 time frame, 1st resistance of 1231.62
- H4 time frame, 2nd resistance of 1308.21
- H4 time frame, 1st support at 1074.23
BTCUSD:
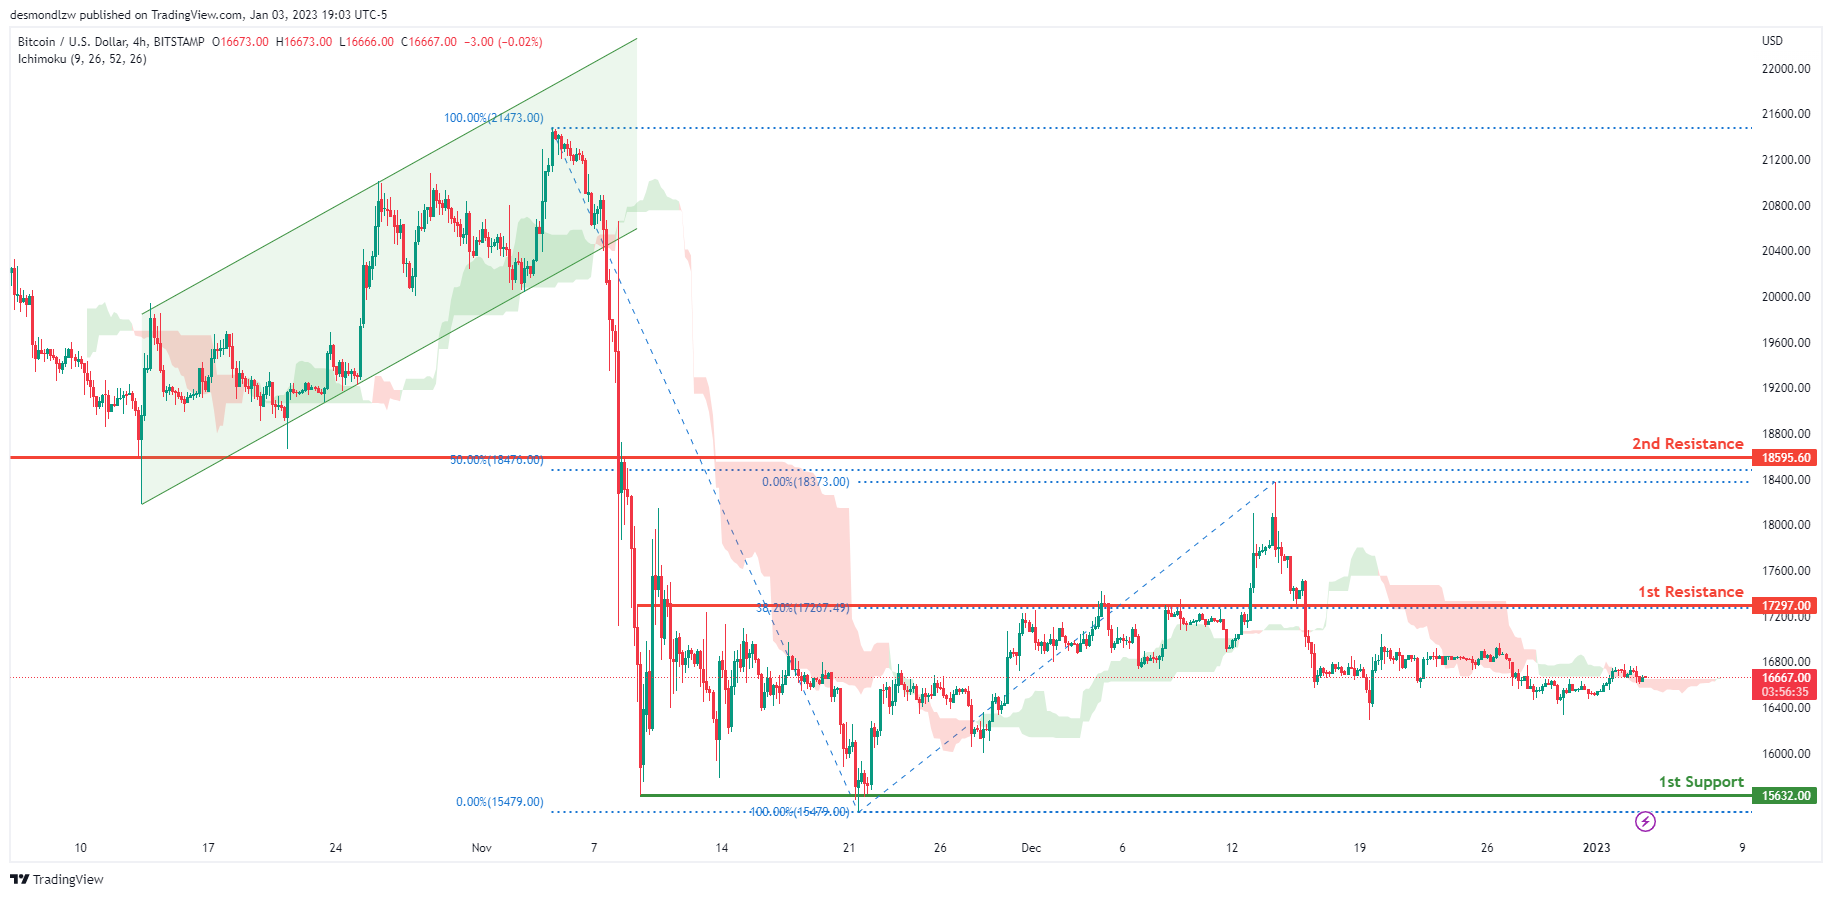
Looking at the H4 chart, my overall bias for BTCUSD is bearish due to the current price crossing below the Ichimoku cloud, indicating a bearish market. To add support to this bias, price has also broken down through the bullish ascending channel. If this bearish momentum continues, expect price to possibly continue heading towards the 1st support at 15632.00, where the previous swing low is. In an alternative scenario, price could possibly head up towards the 1st resistance at 17297.00, where the 38.2% Fibonacci line is.
Areas of consideration:
- H4 time frame, 1st resistance 17297.00
- H4 time frame, 1st support at 15632.00
S&P 500:
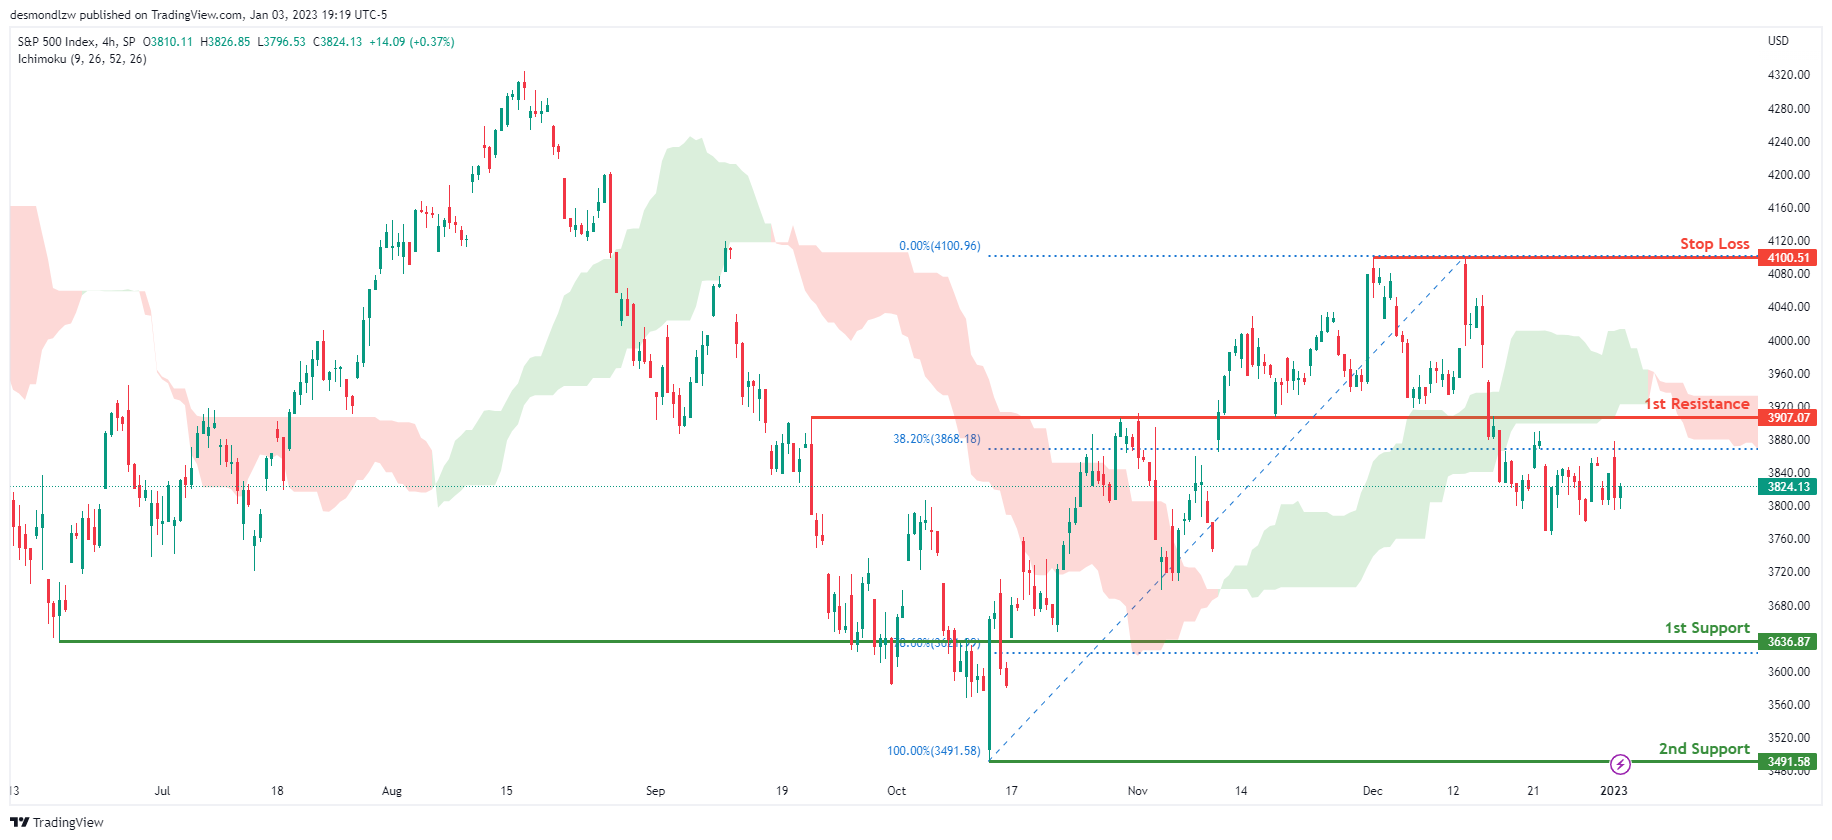
Looking at the H4 chart, my overall bias for S&P500 is bearish due to the current price being below the Ichimoku cloud, indicating a bearish market. If this bearish momentum continues, expect the price to continue heading towards the 1st support at 3636.87, where the 78.6% Fibonacci line is. In an alternative scenario, price could possibly head back up to retest the 1st resistance at 3907.07, where the 38.2% Fibonacci line is.
Areas of consideration:
- H4 time frame, 1st support at 3636.87
- H4 time frame, 1st resistance at 3907.07
Why the Threat of Deflation is Real
I know -- inflation has been grabbing all the headlines for a good while now -- so you may wonder why the subject of deflation is relevant.
First, the definitions of inflation and deflation go beyond commonly accepted meanings.
As Robert Prechter's Last Chance to Conquer the Crash says:
Inflation is an increase in the total amount of money and credit, and deflation is a decrease in the total amount of money and credit. ...
The most common misunderstanding about inflation and deflation ... is the idea that inflation is rising prices and deflation is falling prices. General price changes, though, are simply effects.
That said, let's start off with an occurrence which is quite rare. Here's a chart and commentary from the December Elliott Wave Theorist, a monthly publication which covers major financial and cultural trends:

The chart, published by the Fed, shows that absolute M2 has been declining on a month-by-month basis for the first time in many decades, probably since the 1930s or 1940s. This trend is deflationary.
Keep in mind that M2 is a measure of the U.S. money stock that includes M1 (currency and coins held by the non-bank public, checkable deposits, and travelers' checks) plus savings deposits (including money market deposit accounts), small time deposits under $100,000, and shares in retail money market mutual funds.
Another factor regarding deflation has to do with the Fed.
The November Global Forecast Service, an Elliott Wave International publication which analyzes 50-plus worldwide financial markets, showed this chart and noted:

The Federal Reserve is forging ahead with its balance sheet reduction, as the chart shows. This reduction in the central bank's assets which were paid for by money created out of thin air constitutes disinflation, and deflation (when the balance sheet is contracting on an annualized basis) will likely come by the end of the year.
So, now you see why deflation is very much on the radar screen of Elliott Wave International's Global Forecast Service, which can help you to prepare for what may be next.
Understanding the Elliott wave price patterns of global stock market indexes can also be of help in anticipating what's next for major economies around the globe.
You see, the economy tends to follow the stock market, in each country.
Getting back to the Wave Principle, here are some insights from Frost & Prechter's book, Elliott Wave Principle: Key to Market Behavior:
The Wave Principle is governed by man's social nature, and since he has such a nature, its expression generates forms. As the forms are repetitive, they have predictive value.
Sometimes the market appears to reflect outside conditions and events, but at other times it is entirely detached from what most people assume are causal conditions. The reason is that the market has a law of its own. It is not propelled by the external causality to which one becomes accustomed in the everyday experiences of life. The path of prices is not a product of news. Nor is the market the cyclically rhythmic machine that some declare it to be. Its movement reflects a repetition of forms that is independent both of presumed causal events and of periodicity.
The market's progression unfolds in waves. Waves are patterns of directional movement.
Would you like to read the entire online version of this Wall Street classic -- for free?
You may do so once you become a member of Club EWI, the world's largest Elliott wave educational community.
A Club EWI membership is also free (no obligations whatsoever) and allows for complimentary access to a wealth of Elliott wave resources on investing and trading.
So, get started now by following this link: Elliott Wave Principle: Key to Market Behavior.
This article was syndicated by Elliott Wave International and was originally published under the headline Why the Threat of Deflation is Real. EWI is the world's largest market forecasting firm. Its staff of full-time analysts led by Chartered Market Technician Robert Prechter provides 24-hour-a-day market analysis to institutional and private investors around the world.
BoJ Kuroda expects economy to grow firmly and stably this year
BoJ Governor Haruhiko Kuroda told the bankers' association that Japan is facing uncertainties "such as inflation and pandemic. Yet, he expects the economy to "firmly and stably this year backed by accommodative monetary conditions."
Kuroda reiterated that the central bank would keep monetary easing to achieve the 2% inflation target accompanied by wage growth.
Separately, Prime Minister Fumio Kishida said on a radio program that aired Tuesday, "raising interest rates has an impact on people's day-to-day lives and small and midsize businesses It's not the case that all that needs to be done is to raise rates. The government and the Bank of Japan each have a role to play."
Japan PMI manufacturing finalized at 48.9, slipped further into contraction
Japan PMI Manufacturing was finalized at 48.9 in December, down from November's 49.0. That's the lowest level since October 2020. S&P Global noted there were strong reductions in output volumes and order books. Input buying was cut at strongest rate since September 2020. Supply pressures were the least widespread since February 2021.
Laura Den man, Economist at S&P Global Market Intelligence, said: "December PMI data saw the Japanese manufacturing sector slip further into contraction territory in the final month of 2022. The downturn was largely centred around the current demand environment which is weak both internationally and domestically....
"At the same time, forward looking indicators are increasingly painting a gloomier picture for Japan's manufacturing sector in the future. Companies have cut back input buying sharply, and business sentiment waned to a seven-month low."