

Sample Category Title
NZDUSD Ticks Up From Falling Trend Line
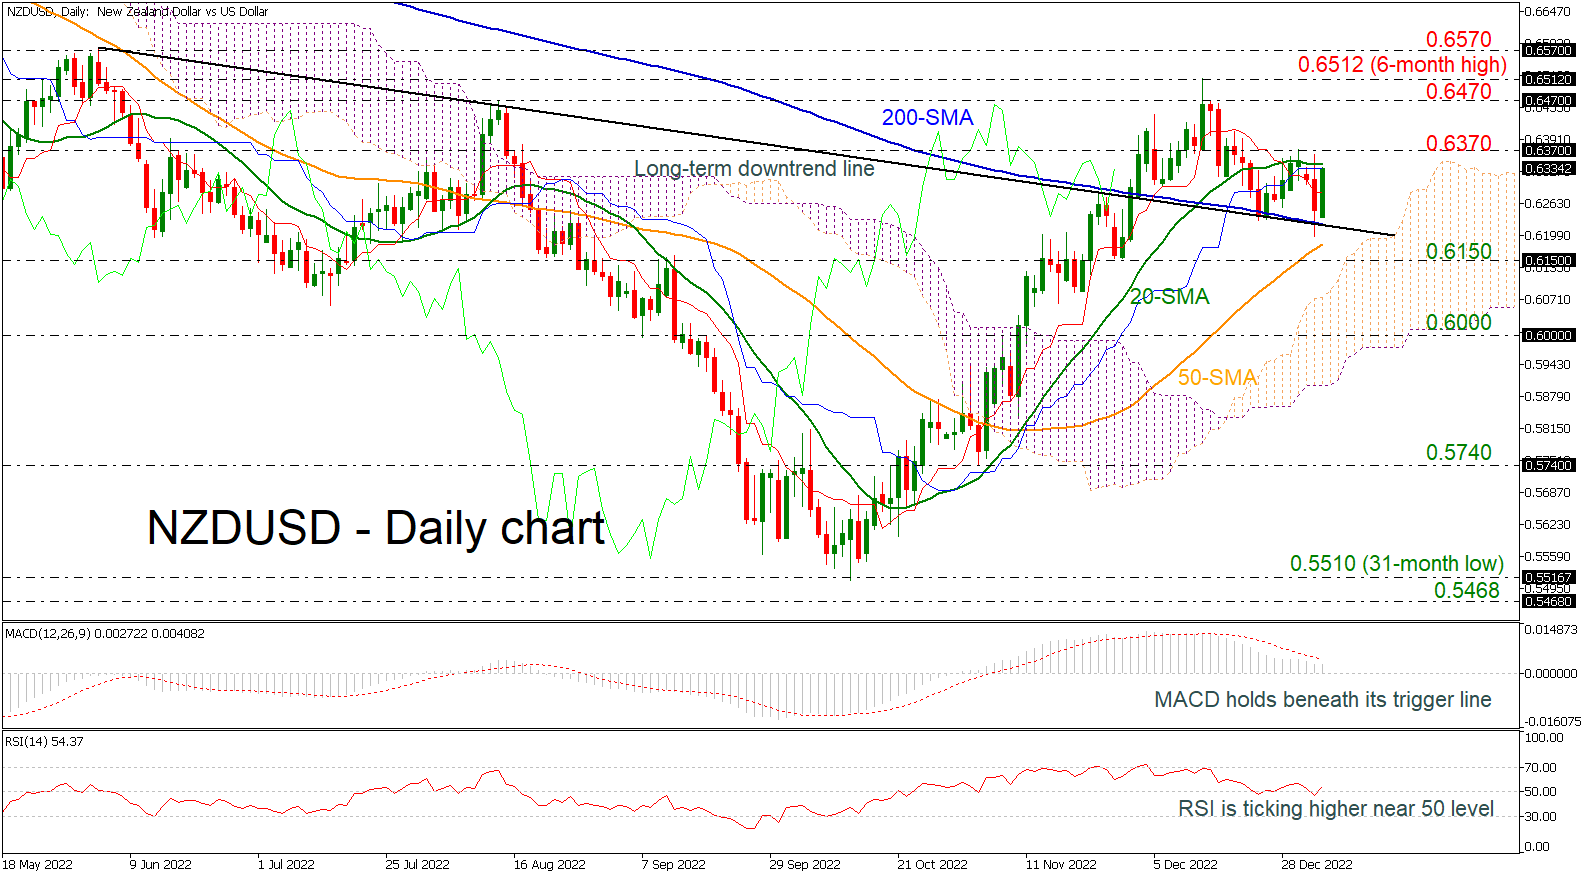
NZDUSD is rising after bouncing off the long-term descending trend line and the 200-day simple moving average (SMA) but is still hovering beneath the 20-day SMA.
The negatively aligned Tenkan-sen line serves as a testament to the negative short-term momentum. The Chikou Span, though, is signaling a potentially oversold market; a near-term reversal should thus not be ruled out. The MACD oscillator is still declining beneath its trigger line in the positive region; however, the RSI is pointing upwards above the neutral threshold of 50.
Immediate support to further declines may take place around the 200-day SMA at 0.6220 ahead of the 50-day SMA at 0.6180, while the 0.6150 barrier could provide additional support in case of steeper losses.
A move to the upside may meet resistance around the 20-day SMA at 0.6340 and the 0.6370 hurdle. More gains could open the way towards the 0.6470 barrier and the six-month peak of 0.6512, while any increases above the latter level would endorse the medium-term bullish outlook.
Overall, NZDUSD is still standing above the downtrend line, suggesting that upside pressures may come next.
AUD/USD: Aussie Surges to Three-Week High on Risk Appetite, Fundamentals
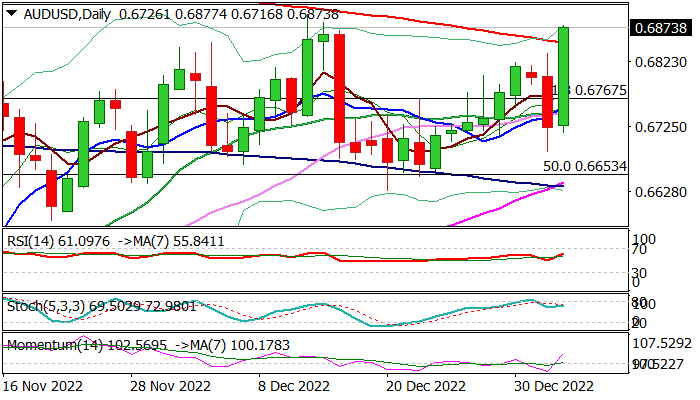
The Australian dollar surged in early Wednesday’s trading, driven by higher stocks and rumors that China is discussing easing of ban on Australia coal imports.
Aussie advanced over 2% in Asia, early Europe and cracked pivotal barrier at 0.6854 (200DMA), eyeing next key levels at 0.6893/0.6908 (Dec 13 former high/Fibo 76.4% of 0.7136/0.6170).
Clear break of these barriers is needed to signal a continuation of larger advance from 0.6170 (Oct 13 low) and expose psychological 0.70 resistance.
Strong rise of positive momentum on daily chart and studies turning into full bullish setup, support fresh advance.
Broken Fibo 61.8% (0.6767) offers solid support and expected to keep the downside protected.
Res: 0.6893; 0.6908; 0.7000; 0.7072.
Sup: 0.6834; 0.6796; 0.6767; 0.6687.
USDJPY Plummets to Fresh 7-Month Low
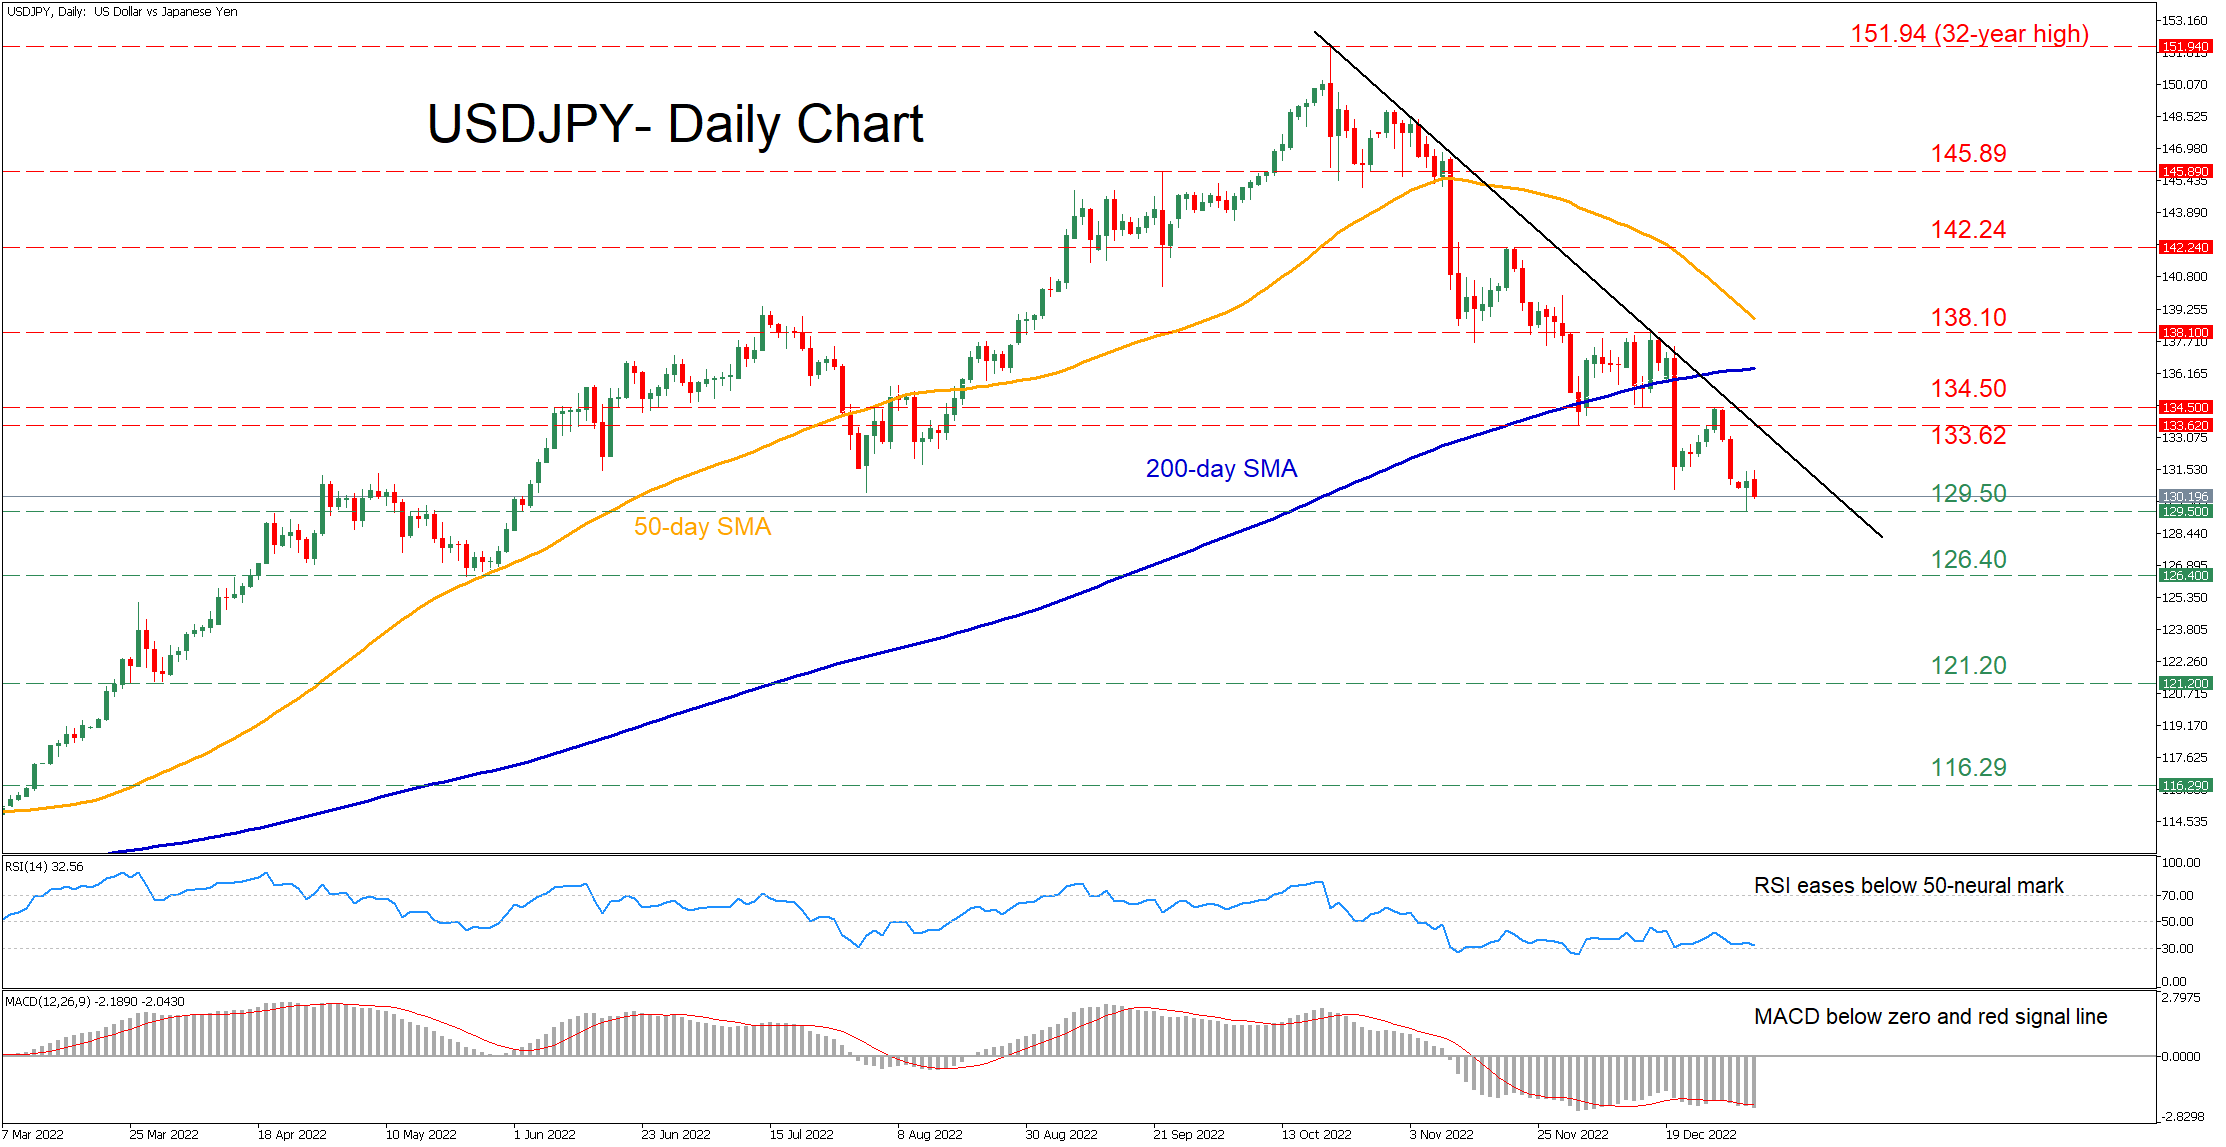
USDJPY had experienced a significant uptrend in the past year, climbing to a 32-year high of 151.94 in mid-October. However, the pair has been experiencing a prolonged downside correction since then, with the price hitting a fresh seven-month low of 129.50 in the previous daily session.
The short-term oscillators currently suggest that bearish forces have gained total control. Specifically, the RSI is declining near its 30-oversold zone, while the MACD histogram is retreating further below both zero and its red signal line.
Should the downfall persist, the price could retest its recent seven-month low of 129.50. Sliding beneath that floor, the pair might descend to form fresh multi-month lows, where the May 2022 low of 126.40 could provide downside protection. A violation of the latter could turn the spotlight to the March 2022 support of 121.20.
Alternatively, should the buying interest intensify, the December support of 133.62 could now act as the initial resistance region. Violating that zone, the bulls may then aim for 134.50 before the 138.10 resistance zone comes under examination. Breaking above the latter, the price could then ascend to challenge 142.24.
In brief, USDJPY appears set to post fresh lows as the technical picture is constantly deteriorating and downside risks are intensifying. What’s more, the descending 50-day simple moving average (SMA) is closing the gap with the 200-day SMA, where a potential death cross could accelerate the decline.
FTSE 100 Tests Major Ceiling
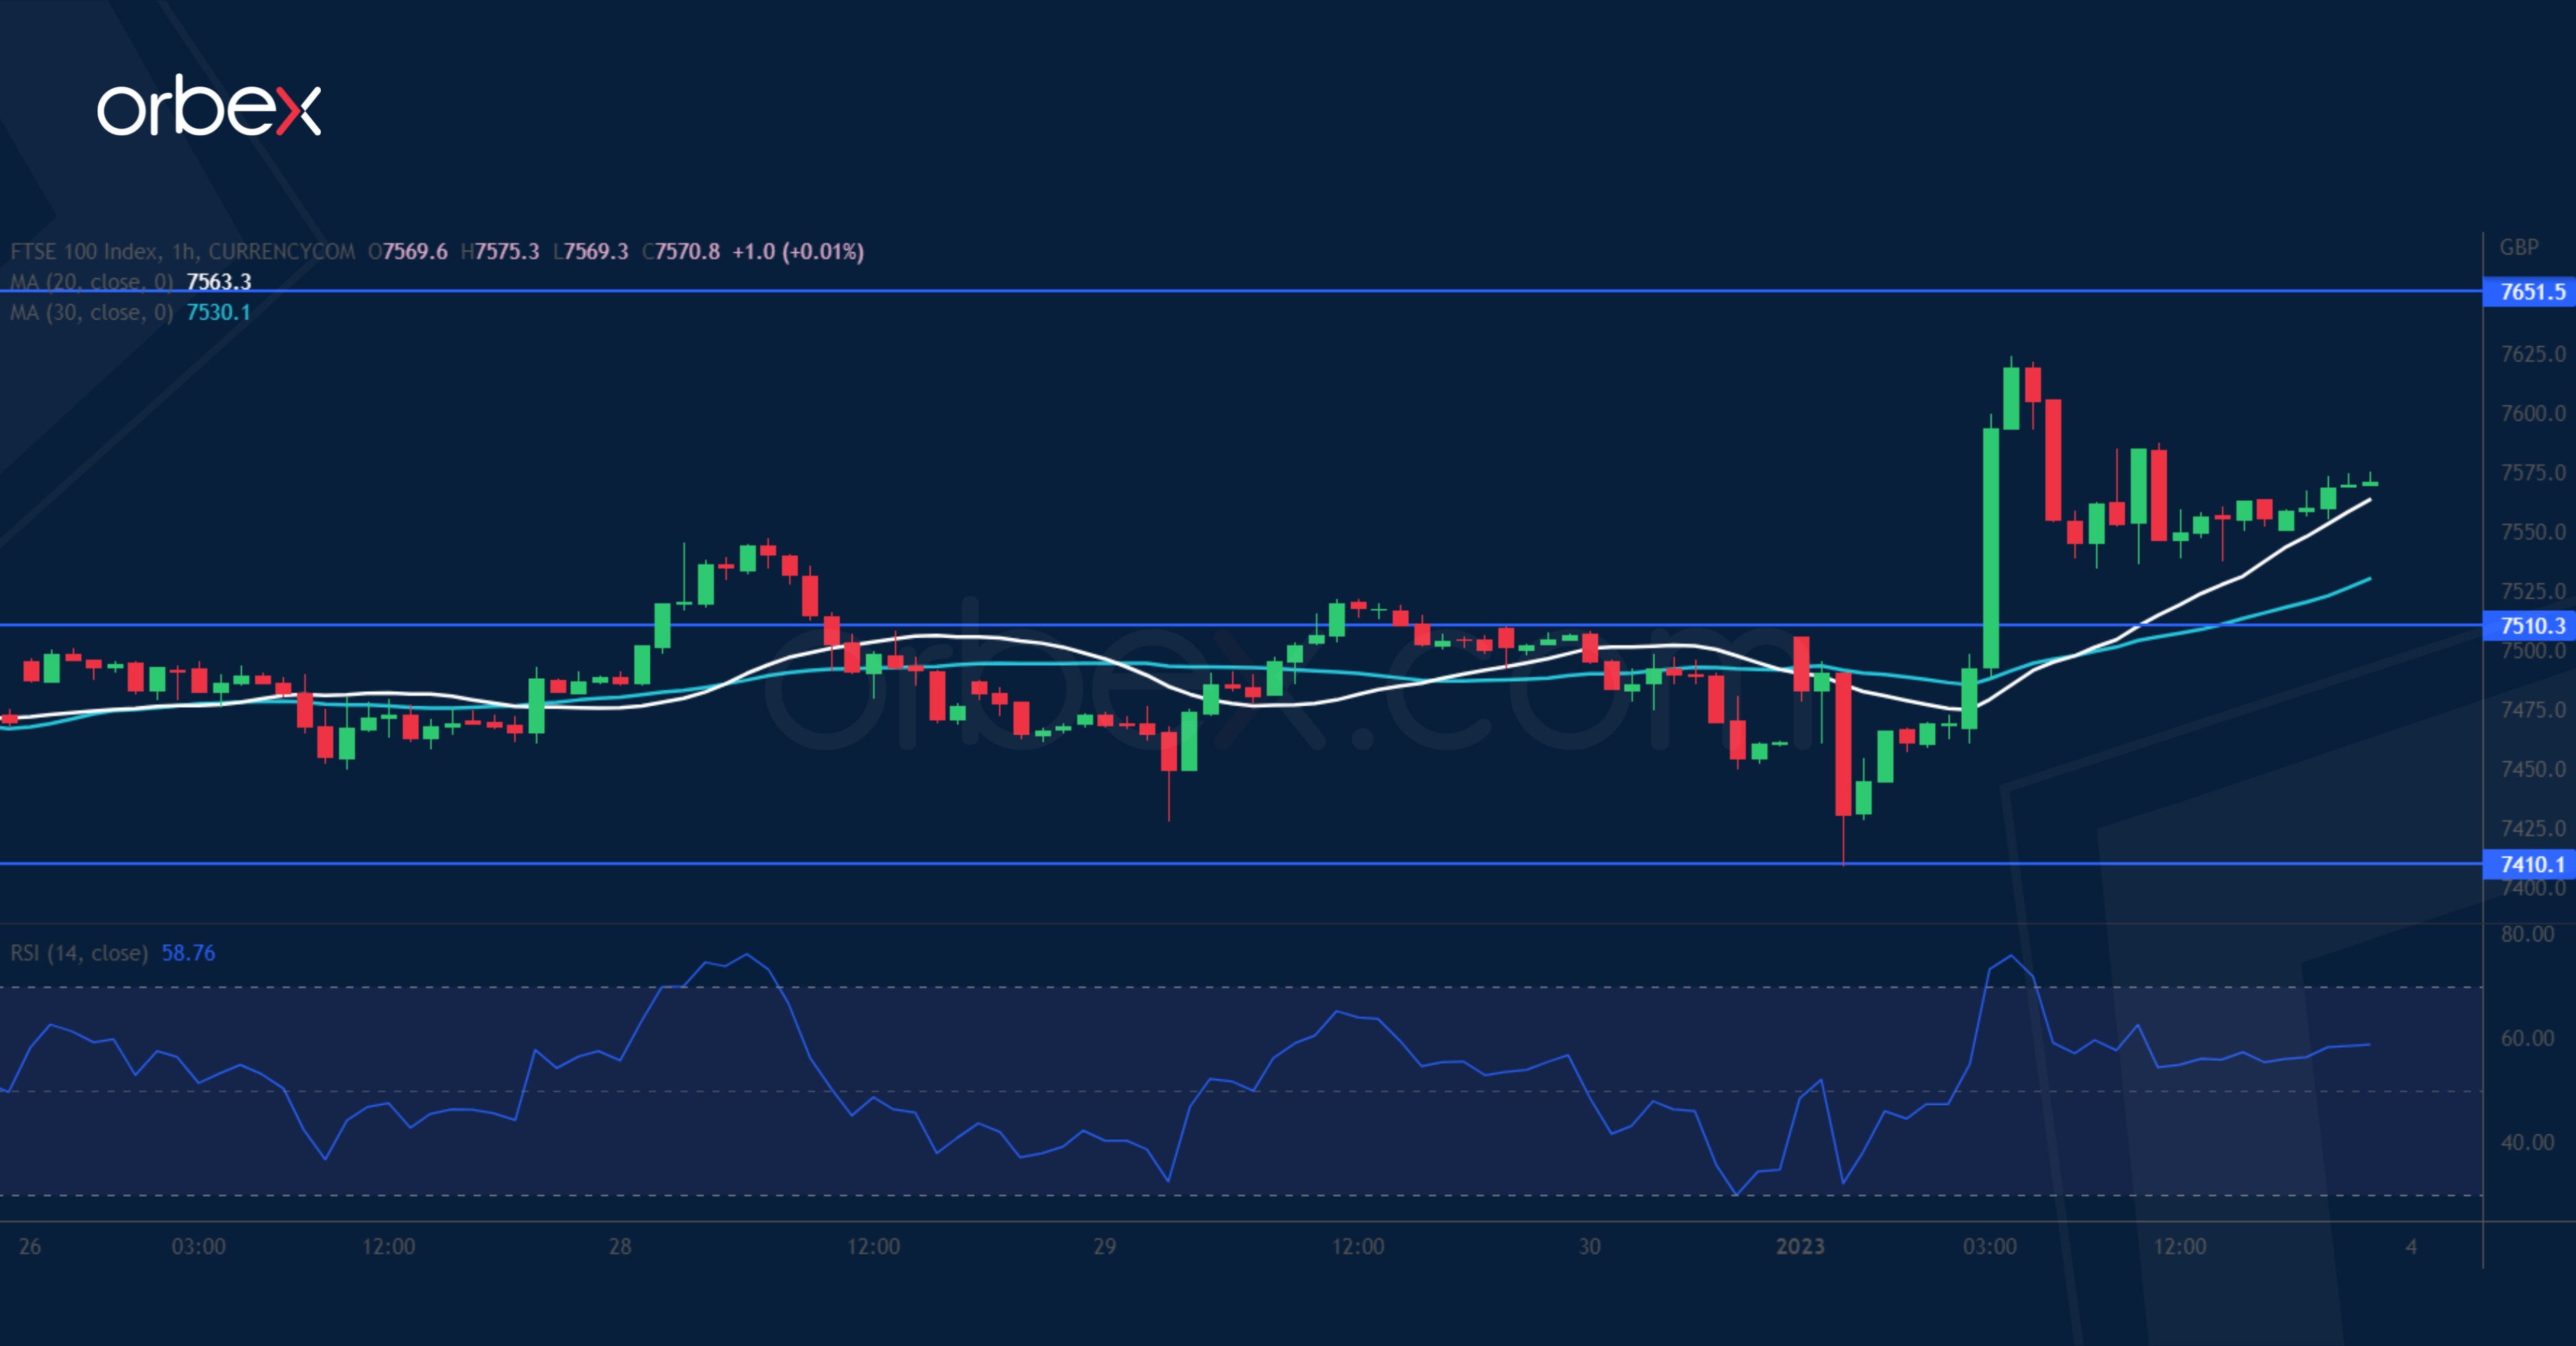
The resources heavy FTSE 100 outperformed thanks to energy stocks. A pop above 7550 may have put the index back on track, sending sellers to cover their bets. 2022’s top around 7650 is the last obstacle and a bullish breakout could trigger a runaway rally with momentum buyers joining the party. Then a new high above 7800 could be in store. After the RSI shows an overbought situation, a limited pullback may attract buyers in the former supply zone near 7510. 7410 is a key level to keep the bounce intact.
USD/CAD Bounces Back
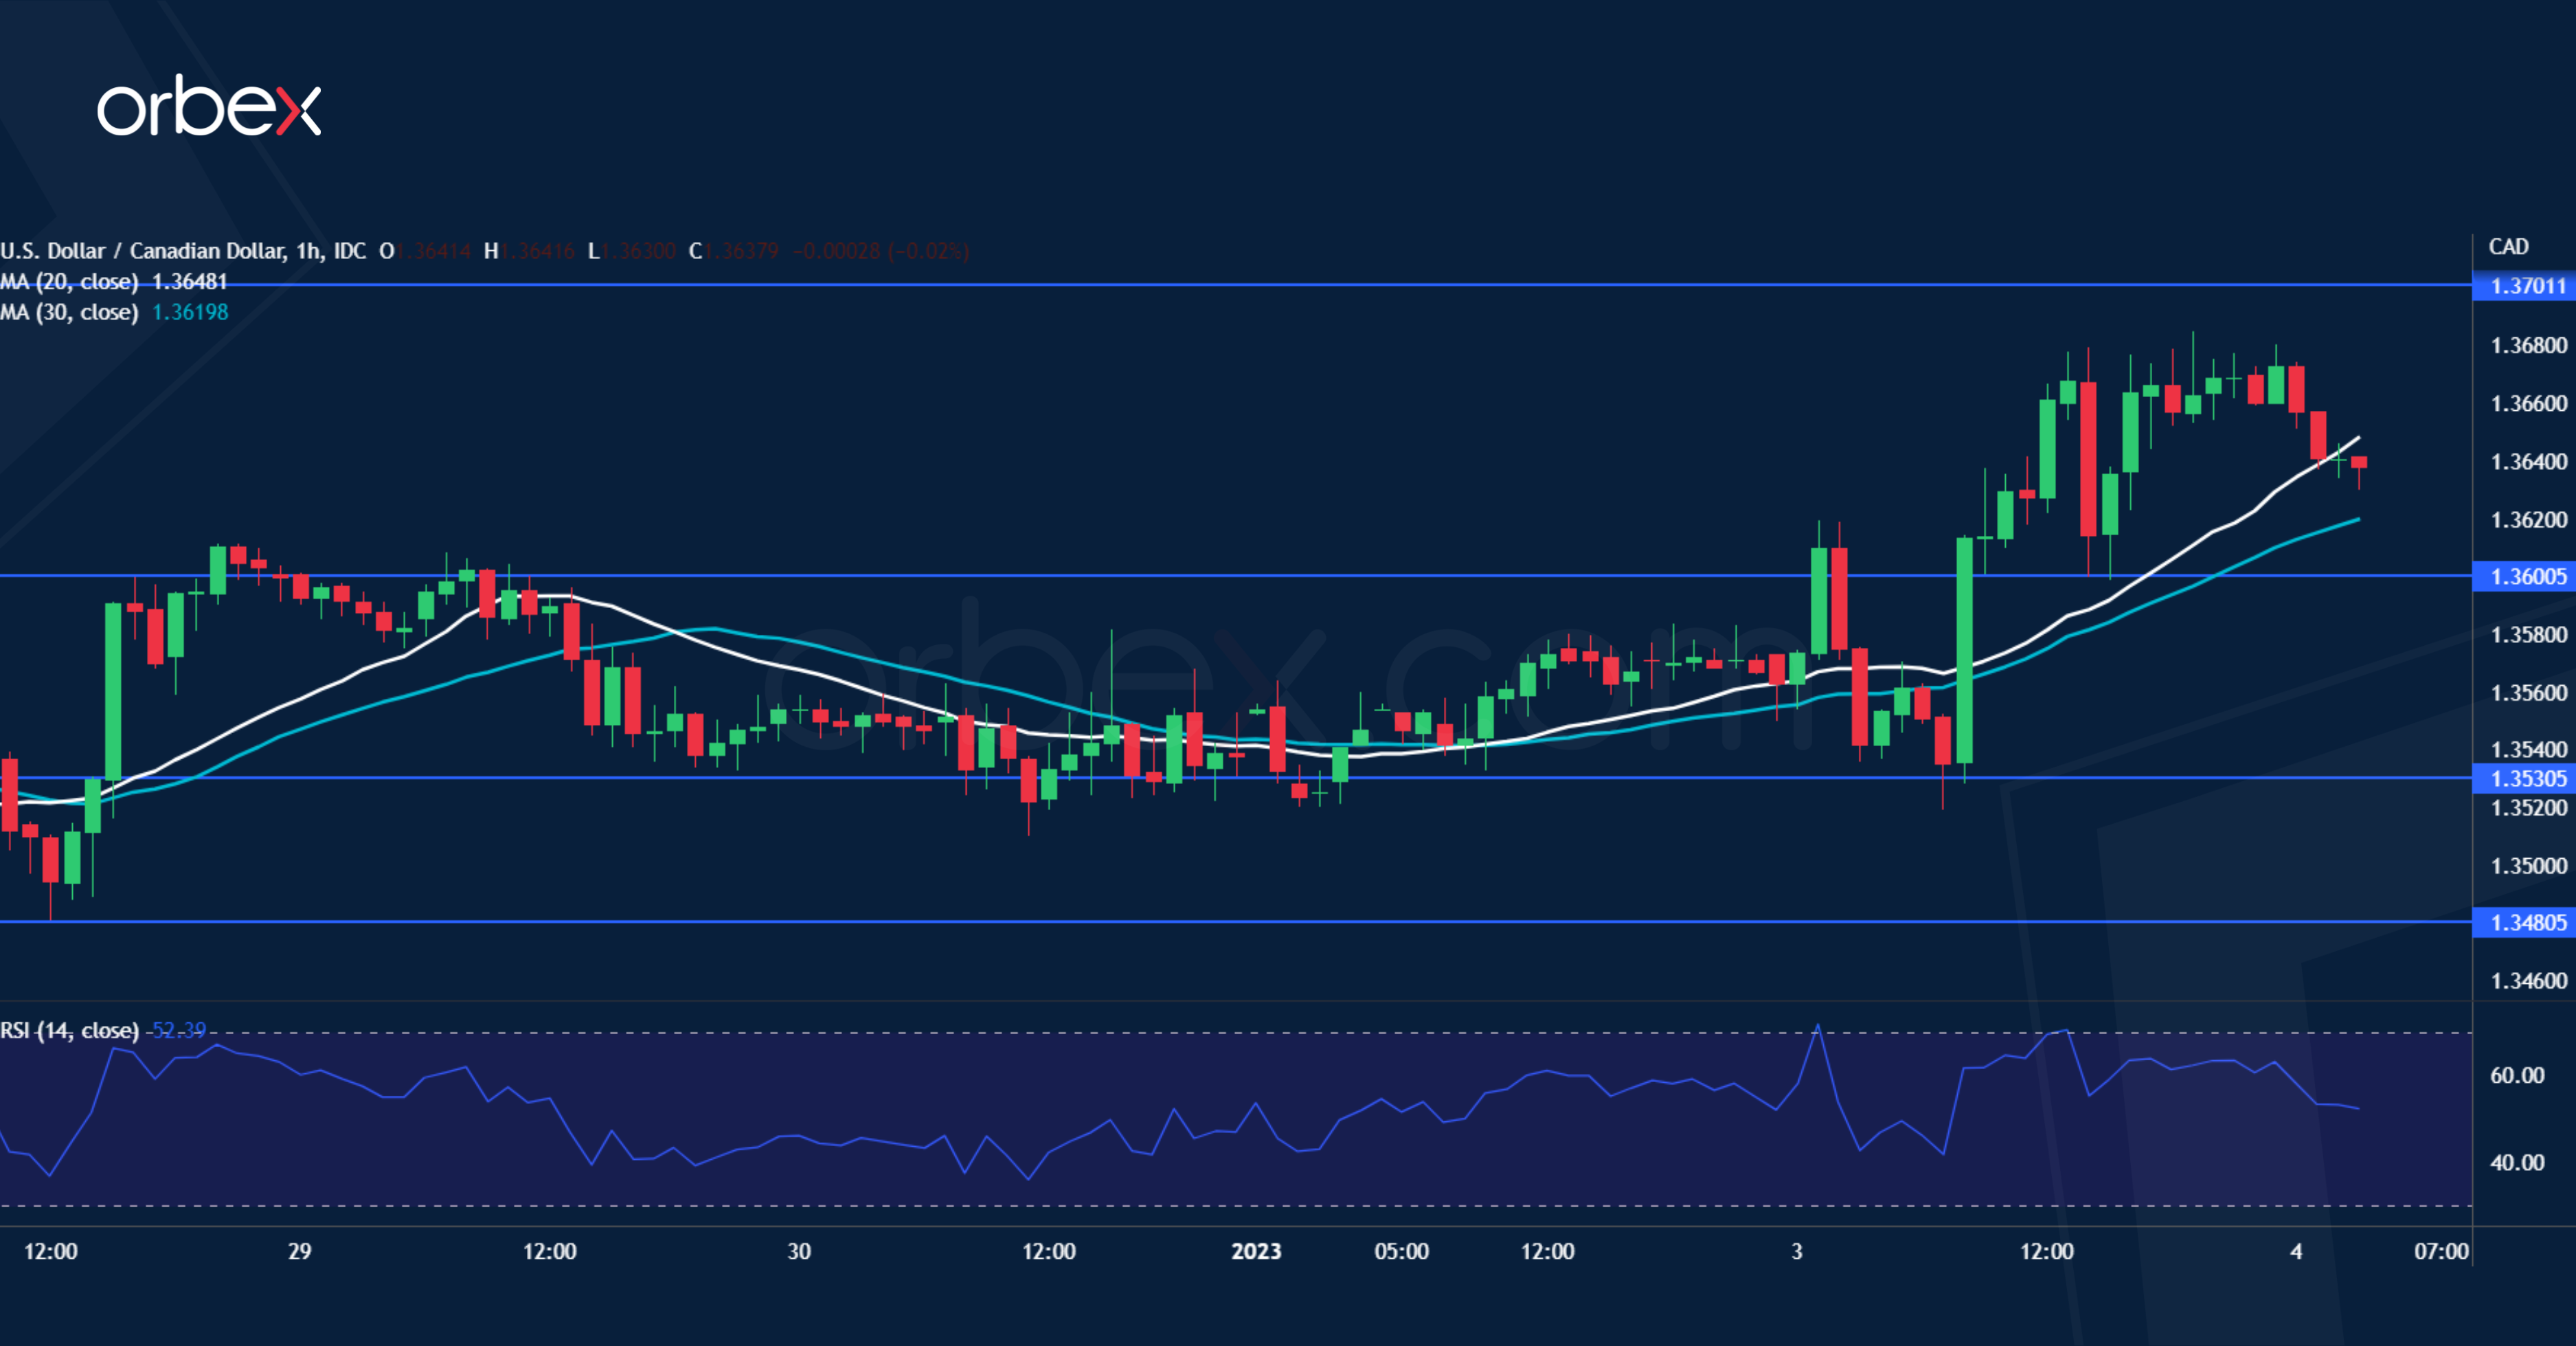
The Canadian dollar softens as risk-sensitive currencies take a backseat amid the greenback’s rally. From the daily chart’s perspective, the medium-term bias remains upward and the bulls have been waiting for an opportunity to stake in. A quick swing between 1.3510 and 1.3610 has narrowed the trading range, paving the way for the next one. A bullish breakout indicates that the path of least resistance is up and 1.3700 is a major obstacle ahead. Its breach would help the bulls regain control. 1.3600 is the closest support.
EUR/USD on Corrective Path
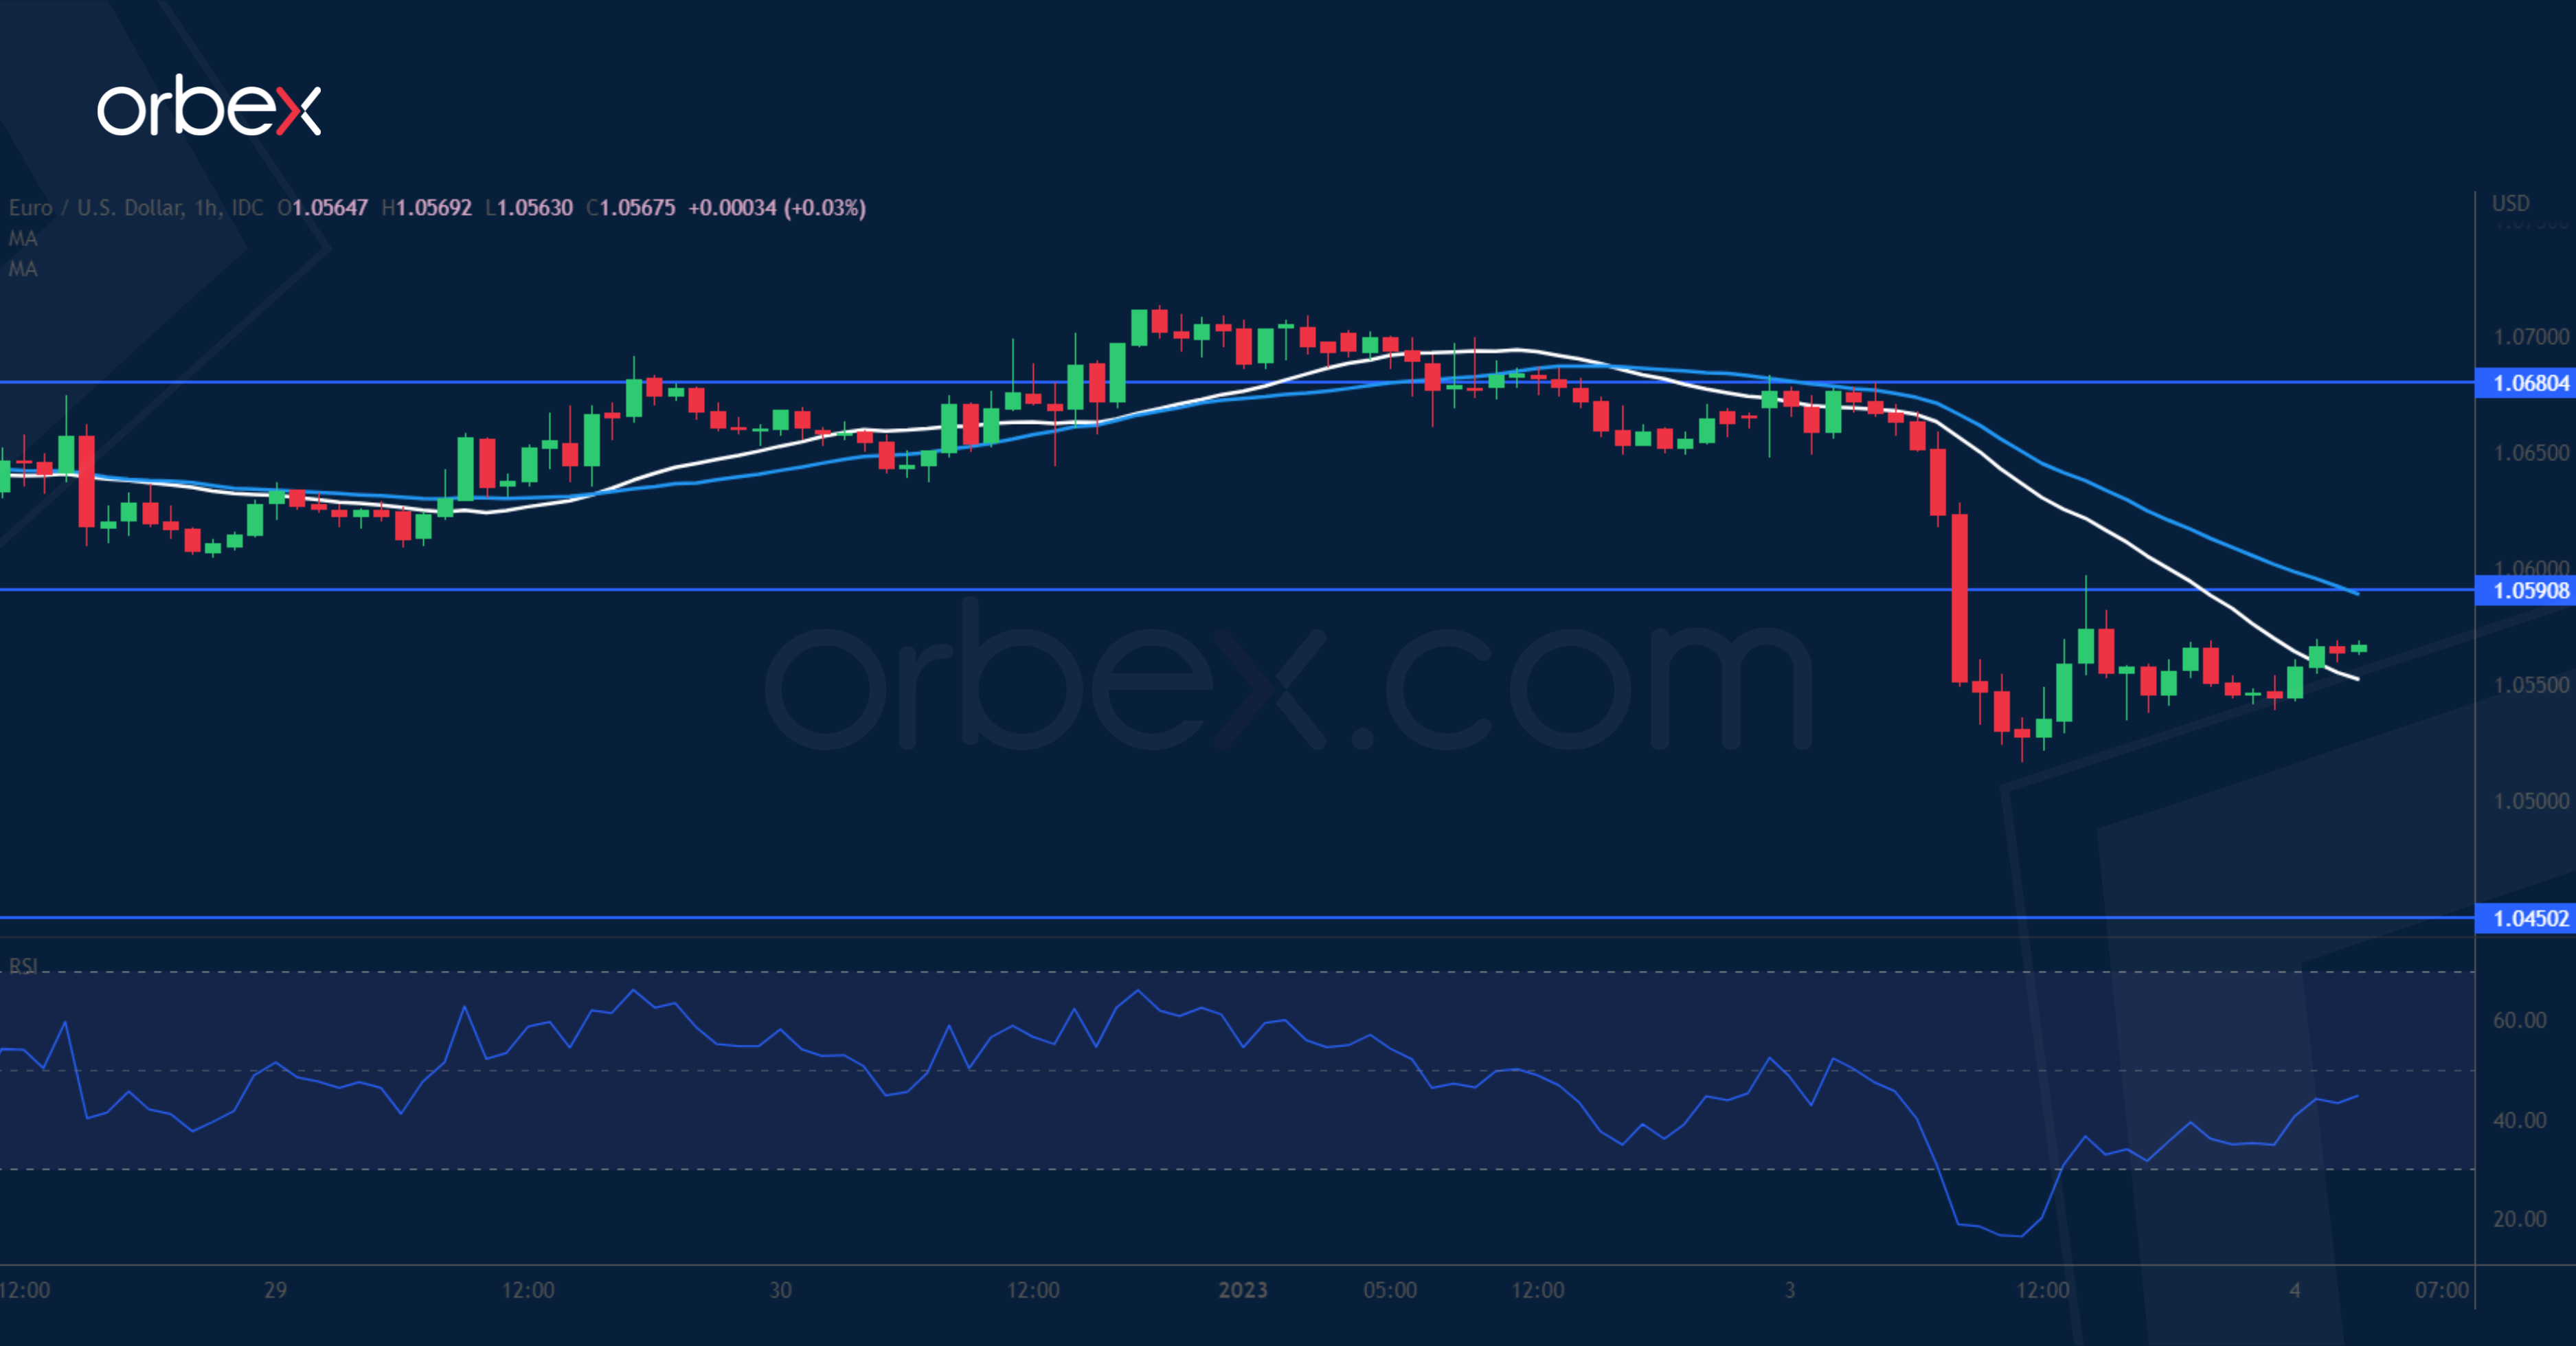
The US dollar jumped as traders made room for the Fed minutes later in the day. The euro’s consolidation at the end of December has failed to achieve a new high. A sharp drop below the demand zone 1.0580-1.0610 confirms exhaustion and is typical of a liquidation after the pair enjoyed a two-month long uninterrupted rally. The daily support at 1.0450 is the level to see if buyers start to come back. Otherwise, the correction could send the price to 1.0300. The support-turned-resistance at 1.0590 is the first hurdle to clear.
FX Market Showed a Mixed Picture
Markets
In line with the start of the new year on Monday in Europe, US investors apparently prepared/hoped for inflationary pressures to gradually ease in the upcoming year. Even with few data to support this view, US yields joined the European bond market rally with US yields declining between 5.6 bps (2-y) and 13.7 bps (10-y). European bonds enjoyed follow-through gains too, supported by a faster-than-excepted slowing in December German inflation. Headline HICP inflation dropped 1.2 % M/M ‘easing’ the Y/Y price rise to 9.6%, down from 11.3% Y/Y in November. However, a big part of the decline was due to government measures to mitigate consumers’ energy bills. At the same time, food prices continue to rise. Next to the inflation data, December German unemployment data pointed the persistent labour market resilience with a decline in the number of unemployed (-15k) lowering the unemployment rate to 5.5%. This suggests a risk of ongoing upside wage pressures. At least for now, investors were happy to embrace the lower-than-expected headline inflation. A decline in oil and European gas prices, supported this narrative. German yields eased another 3.9 bps (2-y) to 8.7 bps (30-y). Contrary to what happened in Europe, the bond rally didn’t help US equities with the Dow closing little changed (-0.03%) and the Nasdaq ceding 0.76%. Europe again outperformed (EuroStoxx50 +0.68%). FX market showed a mixed picture. A combination of USD strength and euro softness pushed EUR/USD off a cliff (close 1.0548 from an open of 1.0667). Sterling declined against the dollar (cable close 1.1968) but gained against the euro (close 0.8813). The yen initially continued its outperformance, but returned gains later the session, closing at 131.02. The test of the key 130.41/58 support area continues.
This morning, Hong Kong, South Korean and Australian shares gain, amongst others, supported by headlines that China might provide additional support for its ailing property sector. Japanese equities decline on a strong yen. The positive risk sentiment arrests further USD gains (DXY 104.5). The yuan (USD/CNY 6.894) and the yen (USD/JPY 130.80) remain well bid. EUR/USD (1.0565) gains modestly.
Later today, French CPI data (expected 0.40% and 7.30% from 7.10%) probably will show slightly different dynamics from the German data. In the US, the manufacturing ISM (expected at 48.5 from 49.0) and the JOLTS job openings will bring new insights on the pace of slowdown in the US economy. Later, the Fed will publish the minutes of ‘hawkish’ December 14 Fed policy meeting. The day-to-day momentum clearly is bond-friendly. At the same time, US markets already discount quite some ‘softness’ (only a 30% chance of a 50 bps early February rate hike vs 25 bps). In this context, data showing economic resilience might slow the bond market rally. On FX markets, the dollar might remain better bid short term. It probably will take really negative US data surprises for EUR/USD to return to the 1.0735 resistance soon.
News Headlines
Chinese officials are mulling to resume some imports of Australian coal after a more than two-year ban, Bloomberg news agency reported. Beijing imposed the restrictions in late 2020 following amongst others Australia’s call for an independent investigation into the origins of the coronavirus which further damaged an already strained relationship. Australian foreign minister Penny Wong traveled to China in December for the first official visit in years in tentative signs of a thaw. By lifting the ban, China seeks to prevent any repeat of the broad power outages in 2021 and to a lesser extent in 2022 while Europe’s Russian oil restrictions could significantly increase demand/competition for coal from other key Chinese suppliers including Indonesia. The Aussie dollar soared on the news, outperforming in the G10 area. AUD/USD is testing the 0.68 big figure, up from 0.6727.
The since the midterms Republican-led US House of Representatives adjourned after Kevin McCarthy failed to secure a simple majority during the election for Speaker. He was shy 15 votes in the first round, making him the first majority party leader in a century to fail. Two subsequent rounds of voting didn’t yield a result either. Because of the ultra-thin Republican majority, the group of people voting against McCarthy have an outsized influence in the ballot. They were left disappointed after the predicted red wave during the midterms did not materialize and press for change in the party. The House cannot function without a Speaker and the process could drag on for days until McCarthy is able to garner enough support or steps aside in the race.
Swiss CPI down to 2.8% yoy, but core rose to 2.0% yoy
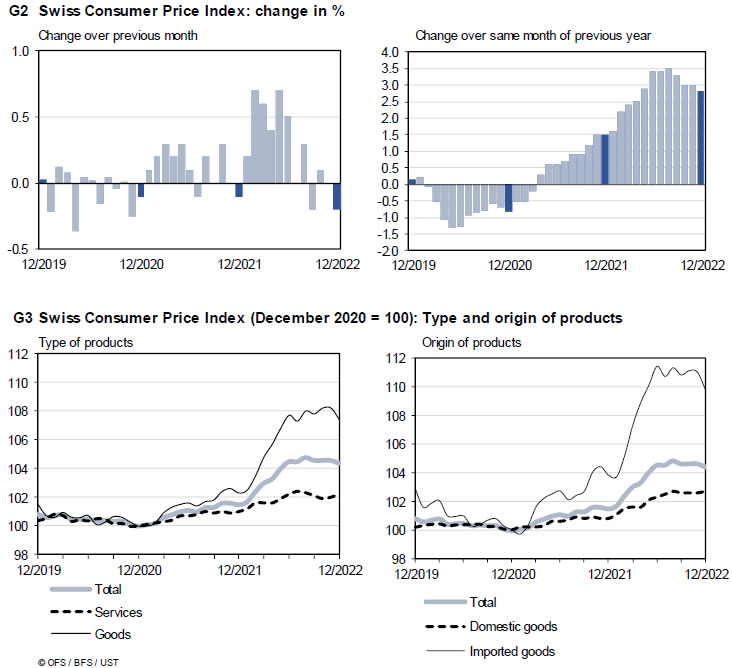
Swiss CPI dropped -0.2% mom in December, due to several factors including falling prices for fuels and heating oil, fruiting vegetables and medicines. On the other hand, rents for holiday flats and the hire of private means of transport increased.
Annually, CPI slowed from 3.0% yoy to 2.8% yoy in December, below expectation of 2.9% yoy. Core inflation (excluding fresh and seasonal products, energy and fuel), accelerated from 1.9% yoy to 2.0% yoy.
Domestic products inflation rose from 1.8% yoy to 1.9% yoy. Imported products inflation slowed notably from 6.3% yoy to 5.8% yoy.
GBP/USD Started a Downward Move
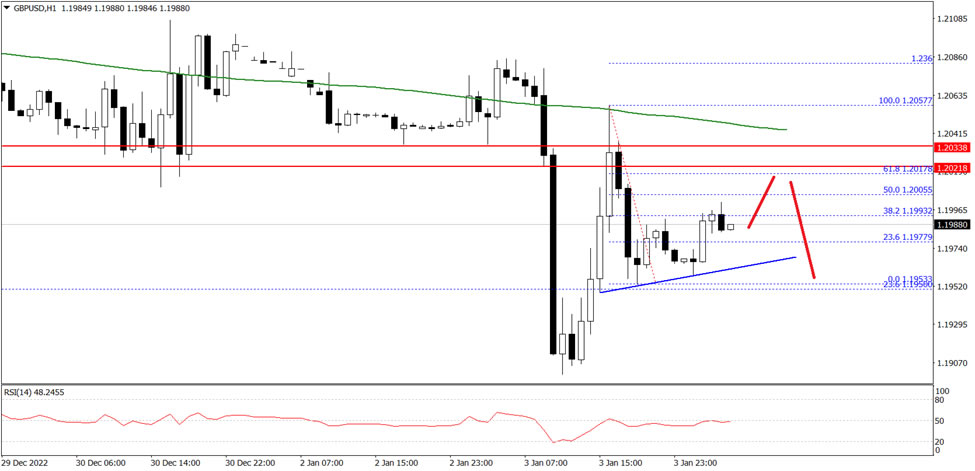
The British Pound started a downward move from the 1.2100 zone against the US Dollar. The GBP/USD pair declined below 1.2020 to move into a short-term bearish zone.
The pair even settled below the 1.2000 level and the 50 hourly simple moving average. It is now consolidating near the 1.1990 level on FXOpen, with an immediate resistance at 1.2020.
The first major resistance is near the 1.2040 level and the 50 hourly simple moving average. If there is a clear upside break above the 1.2040 resistance, the pair could rise steadily towards the 1.2080 level in the near term. The next major resistance sits near the 1.2120 level.
On the downside, the first major support is near the 1.1980 level. The main support is forming near the 1.1955 level. A break below the 1.1955 support could push the pair towards the 1.1900 support.
What Could Bring Negative Stock-Bond Correlation Back?
European investors got an energy boost from lower inflation reads, and the falling nat gas futures, but US investors didn’t follow up on the cheery market mood.
However, US sovereign bonds gained yesterday as an indication that the latest market moves were backed by recession fears, rather than hawkish Federal Reserve (Fed) expectations… And that could be a gamechanger for the stock-bond correlation this year.
Softer inflation won’t change ECB’s stance
If European stocks were cheery yesterday, it was certainly due to an unexpected drop in German inflation below the 10% mark, a softer Spanish inflation, and a further slide in nat gas futures due to an abnormally mild winter – which also boosted the idea that inflation could further ease if energy prices – which are mostly responsible for the sky-high European inflation eased.
And if inflation starts falling at this speed in Europe, the European Central Bank (ECB) won’t need to worry about fighting it so aggressively.
As such, the softer ECB expectations were mostly responsible for yesterday’s rally in the European stocks. The DAX gained 0.80%, while EuroStoxx50 jumped 1%.
The problem with all this is, a single data point won’t change the ECB’s policy stance.
More importantly, yesterday’s German CPI data was because the government paid some energy bills, and the headline figure obscured the increase in food costs across the country, along with tighter than expected job conditions, which could also make inflation stickier than ideal.
And finally, if we think that the euro appreciation helped the European stocks gain weight since October, the slowing appreciation may pull the rug from under their feet.
Could negative stock-bond correlation come back?
The US indices didn’t follow up on their European peers’ gains… at all. And the pain for the US risk assets started in the European session.
Combined to the dovish ECB bets, the EURUSD was trading 1.50% down at some point yesterday, Cable slipped below the 1.20 and tested the 50-DMA to the downside, while the Japanese yen couldn’t extend strength below the 130 against the US dollar.
What’s interesting in all this is that the US yields were lower, meaning that investors bought treasuries while selling stocks, and the US dollar didn’t really react to softer yields.
If the first trading day of the year is any indication, could we see the holy negative correlation between stocks and bonds come back in 2023? This is what many investors think will happen. The risk-off investors will likely continue exiting stocks on profit recession – and not on hawkish Fed expectations, and they could go back to bonds instead.
In summary, if the major market catalyzer becomes recession, rather than hawkish Fed, we could see the negative correlation between stocks and bonds come back.
And, if the falling yields couldn’t boost sentiment in the US stocks yesterday, they certainly boosted appetite in the non-interest-bearing gold, which saw the opportunity cost of holding the yellow metal fall. The price of an ounce rallied to $1823, and could well benefit from a further fall in US yields – in which case we would also see gold become an effective hedge against fresh market routs.
Data watch
But let’s not cry victory so fast, because the US economic data will say the last word on whether the Fed expectations will remain on the back seat. Due today, the ISM manufacturing index will reveal if and how fast US manufacturing contracted last month. If yesterday’s PMI is any hint, we could see a fastening contraction in ISM manufacturing, which would then boost recession worries, hit the stocks, but not necessarily the bonds and gold.
Also, JOLTS data will show if, and by how much the US job openings fell in November.
But regardless of the ISM data, and the US job openings, the FOMC minutes will likely confirm that the Fed remains serious about further tightening policy, even if it slows the pace of interest rate hikes. Remember, if the Fed decided to go slower on its rate hikes, it’s to be able to go higher! And the more resilient the US economy and the US jobs market, the more eager the Fed will be to continue its journey north.