Sample Category Title
Dollar and Yen Down in a Typical Risk-On Day, But What Next?
It's looks like a rather typical risk-on day today, with Dollar and Yen trading broadly lower, while Aussie leads commodity currencies higher. Major European indexes are firmly up while US futures also point to higher open. US and European benchmark yields are trading down again. Gold is extending recent rebound, but oil prices are falling notably. Nevertheless, it should be reminded that there will be key events ahead, including ISM manufacturing and FOMC minutes today, and Eurozone CPI and US non-farm payrolls on Friday. So, the roller-coaster ride is just starting.
Technically, Dollar remains largely in range for now despite today's selloff. Key levels to watch to prove the greenback's weakness include 1.0733 resistance in EUR/USD, 0.6892 resistance in AUD/USD, 0.9199 low in USD/CHF and 1.3483 support in USD/CAD. Let's see if these levels will finally be violated before the week ends.
In Europe, at the time of writing, FTSE is up 0.38%. DAX is up 1.62%. CAC is up 1.75%. Germany 10-year yield is down -0.1074. Earlier in Asia, Nikkei dropped -1.45%. Hong Kong HSI rose 3.22%. China Shanghai SSE rose 0.22%. Singapore Strait Times dropped -0.10%. Japan 10-year JGB yield rose 0.0486 to 0.464.
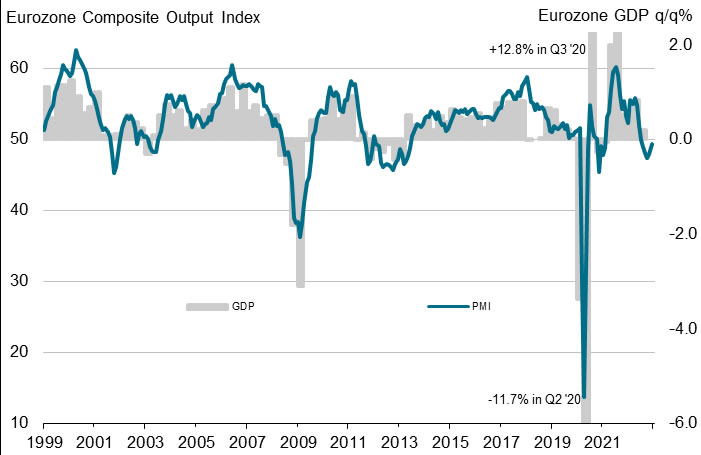
Eurozone PMI composite finalized at 49.3, downturn moderated further
Eurozone PMI Services was finalized at 49.8, in December, up from November's 48.5. PMI Composite was finalized at 49.3, up from prior month's 47.8. Looking at PMI Composite readings of some member states, Spain (49.9), Italy (49.6), France (49.1) and Germany (49.0) were all in contraction.
Joe Hayes, Senior Economist at S&P Global Market Intelligence said:
"The eurozone economy continued to deteriorate in December, but the strength of the downturn moderated for a second successive month, tentatively pointing to a contraction in the economy that may be milder than was initially anticipated....
"Cooling price pressures have helped temper the decline in economic activity levels....
"Nevertheless, there is little evidence across the survey results to suggest the eurozone economy may return to meaningful and stable growth any time soon."
Swiss CPI down to 2.8% yoy, but core rose to 2.0% yoy
Swiss CPI dropped -0.2% mom in December, due to several factors including falling prices for fuels and heating oil, fruiting vegetables and medicines. On the other hand, rents for holiday flats and the hire of private means of transport increased.
Annually, CPI slowed from 3.0% yoy to 2.8% yoy in December, below expectation of 2.9% yoy. Core inflation (excluding fresh and seasonal products, energy and fuel), accelerated from 1.9% yoy to 2.0% yoy.
Domestic products inflation rose from 1.8% yoy to 1.9% yoy. Imported products inflation slowed notably from 6.3% yoy to 5.8% yoy.
BoJ Kuroda expects economy to grow firmly and stably this year
BoJ Governor Haruhiko Kuroda told the bankers' association that Japan is facing uncertainties "such as inflation and pandemic. Yet, he expects the economy to "firmly and stably this year backed by accommodative monetary conditions."
Kuroda reiterated that the central bank would keep monetary easing to achieve the 2% inflation target accompanied by wage growth.
Separately, Prime Minister Fumio Kishida said on a radio program that aired Tuesday, "raising interest rates has an impact on people's day-to-day lives and small and midsize businesses It's not the case that all that needs to be done is to raise rates. The government and the Bank of Japan each have a role to play."
Japan PMI manufacturing finalized at 48.9, slipped further into contraction
Japan PMI Manufacturing was finalized at 48.9 in December, down from November's 49.0. That's the lowest level since October 2020. S&P Global noted there were strong reductions in output volumes and order books. Input buying was cut at strongest rate since September 2020. Supply pressures were the least widespread since February 2021.
Laura Den man, Economist at S&P Global Market Intelligence, said: "December PMI data saw the Japanese manufacturing sector slip further into contraction territory in the final month of 2022. The downturn was largely centred around the current demand environment which is weak both internationally and domestically....
"At the same time, forward looking indicators are increasingly painting a gloomier picture for Japan's manufacturing sector in the future. Companies have cut back input buying sharply, and business sentiment waned to a seven-month low."
EUR/USD Mid-Day Outlook
Daily Pivots: (S1) 1.0485; (P) 1.0584; (R1) 1.0648; More...
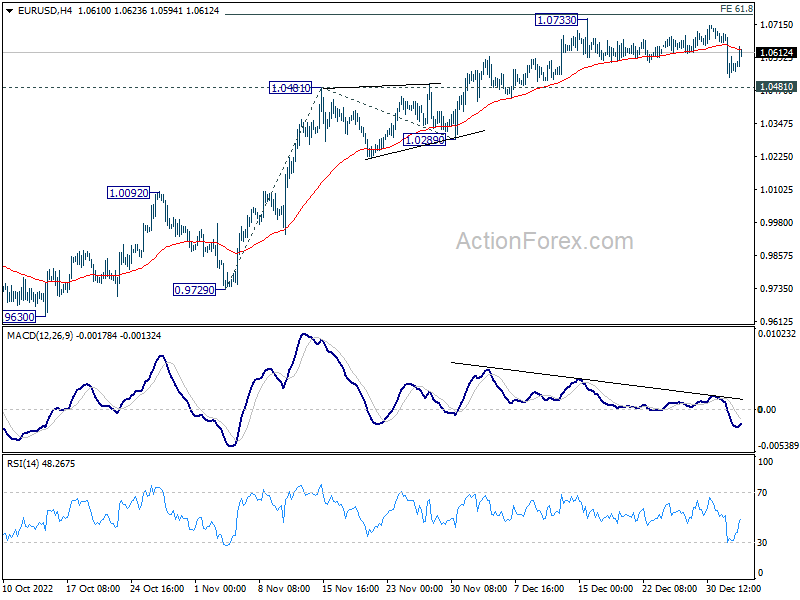
EUR/USD recovered ahead of 1.0481 resistance turned support but stays below 1.0733 resistance. Intraday bias remains neutral at this point. On the downside, break of 1.0481 will confirm short term topping, on bearish divergence condition in 4 hour MACD. Deeper fall would be seen back to 1.0289 support and below. On the upside, however, firm break of 61.8% projection of 0.9729 to 1.0481 from 1.0289 at 1.0754 will pave the way to 100% projection at 1.1041.
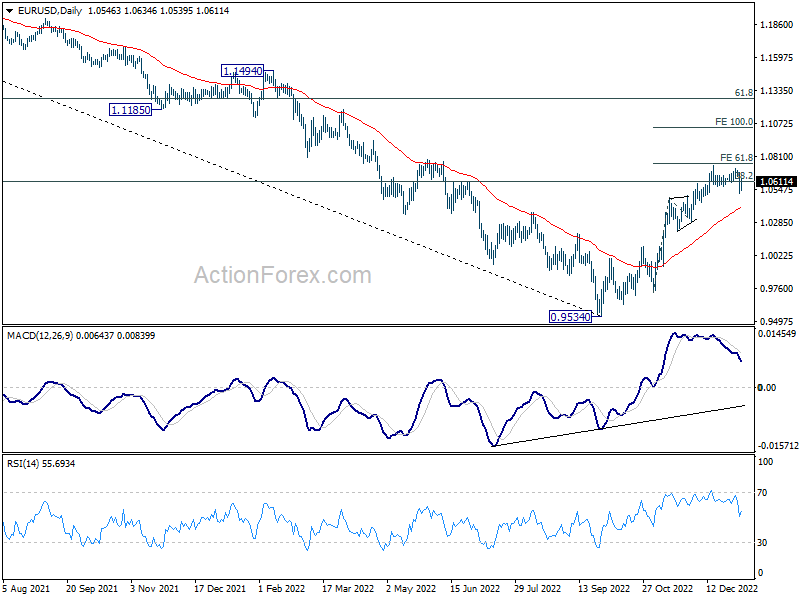
In the bigger picture, focus stays on 38.2% retracement of 1.2348 (2021 high) to 0.9534 at 1.0609. Rejection by 1.0609 will suggest that price actions from 0.9534 medium term bottom are developing into a corrective pattern. Thus, medium bearishness is retained for another fall through 0.9534 at a later stage. However, sustained break of 1.0609 will raise the chance of trend reversal and target 61.8% retracement at 1.1273.
Economic Indicators Update
| GMT | Ccy | Events | Actual | Forecast | Previous | Revised |
|---|---|---|---|---|---|---|
| 00:01 | GBP | BRC Shop Price Index Y/Y Nov | 7.30% | 7.40% | ||
| 00:30 | JPY | Manufacturing PMI Dec F | 48.9 | 48.8 | 48.8 | |
| 07:00 | EUR | Germany Import Price Index M/M Nov | -4.50% | -1.70% | -1.20% | |
| 07:30 | CHF | CPI M/M Dec | -0.20% | 0.00% | 0.00% | |
| 07:30 | CHF | CPI Y/Y Dec | 2.80% | 2.90% | 3.00% | |
| 08:45 | EUR | Italy Services PMI Dec | 49.9 | 47.6 | 49.5 | |
| 08:50 | EUR | France Services PMI Dec F | 49.5 | 48.1 | 48.1 | |
| 08:55 | EUR | Germany Services PMI Dec F | 49.2 | 49 | 49 | |
| 09:00 | EUR | Eurozone Services PMI Dec F | 49.8 | 49.1 | 49.1 | |
| 09:30 | GBP | Mortgage Approvals Nov | 46K | 54K | 59K | 58K |
| 09:30 | GBP | M4 Money Supply M/M Nov | -1.60% | 0.20% | 0.00% | 0.10% |
| 15:00 | USD | ISM Manufacturing PMI Dec | 48.6 | 49 | ||
| 15:00 | USD | ISM Manufacturing Prices Paid Dec | 42.3 | 43 | ||
| 15:00 | USD | ISM Manufacturing Employment Index Dec | 48.4 | |||
| 19:00 | USD | FOMC Minutes |
Gold Rallies to 7-month Peak, Stretching the Bullish Structure
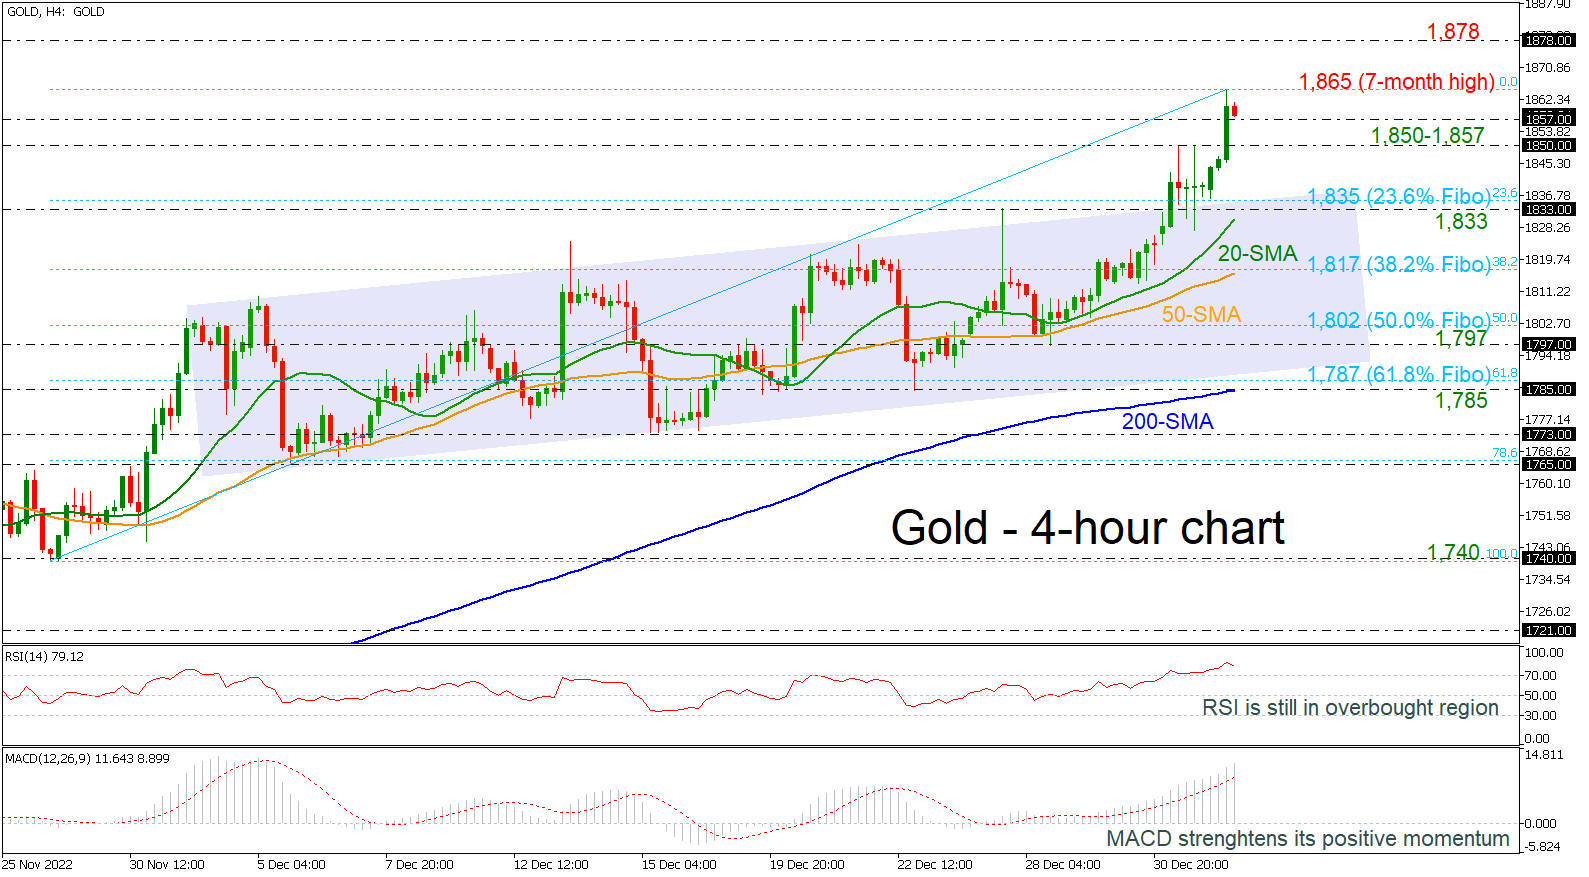
Gold skyrocketed to a new seven-month high of 1,865, exiting from the medium-term ascending channel, suggesting that the recent uptrend is likely to stay in place for now. The RSI is standing in the overbought territory, while the MACD is extending its bullish momentum above its trigger and zero lines.
In case the pair continues its direction to the upside, the bulls will probably challenge the previous top at 1,878. A break higher, could last until the 2,000 psychological mark, registered in April 2022.
Alternatively, any declines may drive the price towards the 1,850-1,857 support area before the 23.6% Fibonacci retracement level of the up leg from 1,740 to 1,865 at 1,835. Beneath the latter, the 1,833 barrier and the 20-period simple moving average (SMA) at 1,835 come into view. Even lower, the 38.2% Fibonacci of 1,817, which overlaps with the 50-day SMA may attract bears attention.
Turning to the medium-term picture, the pair switched to strongly bullish after the rally towards 1,865 despite the latest fall in the 4-hour chart.
NZD/USD Looking to Find a Support in this Pullback – Elliott Wave Forecast
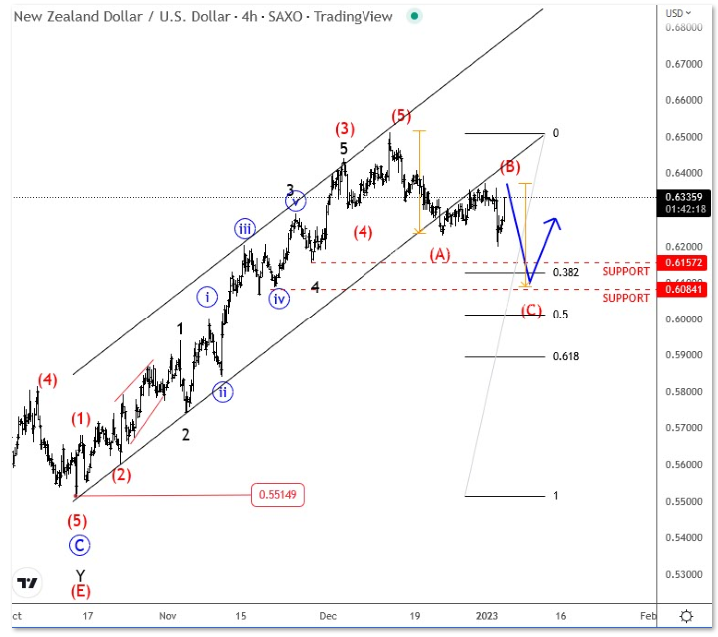
NZDUSD turned bullish as expected after we spotted a completed five-wave bearish cycle within wave C back in October. Notice that the recent rise is much more extended and clearly by five waves up without overlaps up from October lows, so it's an impulse; a change in trend that will send prices even higher in 2023. However, nothing moves in straight lines. We know that after every five waves, a three-wave correction occurs, so so after current (A)-(B)-(C) set-back with interesting support at 0.615-0.6080 area, be aware of a bullish resumption. Next deeper support would be around 0.60 - 0.59 zone.
Could Canadian Data Steal the Spotlight from US Jobs Report?
The first week of the new trading year tends to be very busy with data releases, but the market's attention usually falls on the US employment report, non-farm payrolls in particular. The Canadian labour market statistics tend to stay away from the spotlight, but nevertheless remain significant for overall market sentiment. Especially as the Bank of Canada is hosting its first meeting for 2023 in just three weeks on January 25 – the Bank of Japan meets a week earlier on January 18.
Labour market increasingly important for the market
It is obvious that inflation was the buzzword for 2022. The geopolitical developments along with the Chinese issues pushed oil prices higher and complicated supply lines forcing central banks globally in an unprecedented rate hiking cycle. The BoC raised rates by 400 bps to the current level of 4.25%, with the last 50 bps move coming on December 12. Since the market seems eager to distance itself from inflation and turn its focus to the recession fears, employment data could potentially provide some indication of the possible troubles ahead. Traditionally, the unemployment rate is a lagging indicator, but market participants and central bankers would be examining the entire labour market statistics suite.
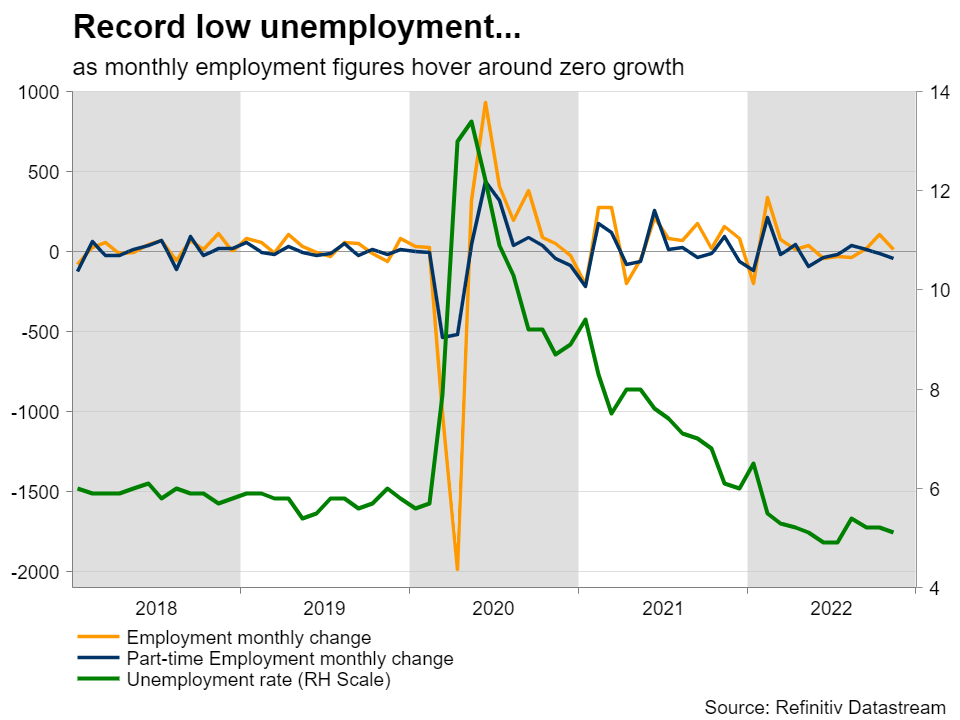
On Friday, the December unemployment rate is expected to rise just a tad to 5.2% from 5.1% in November, while the participation rate is seen stable at 64.8%. Monthly employment is forecast to jump by just 8k following the 10k print in November, and miles lower than the 108k increase in October. A possible surprise in the latter could trouble the minds of central bankers on January 25. The market is currently pricing in a 59% probability of a 25-bps rate hike – the most conservative market pricing among the main central banks, excluding the uber-bearish BoJ. In the meantime, the market is fully pricing in a 25-bps increase from the Fed and assigns a respectable 31% chance of an even stronger move of 50-bps at the February 1 meeting. If we get a plethora of upside surprises in this set of data, there could be renewed chatter about further tightening ahead. On the other hand, a negative bunch of data could add fuel to the recession fire currently spreading across the developed economies.
Secondary data – further evidence that inflation could drop further
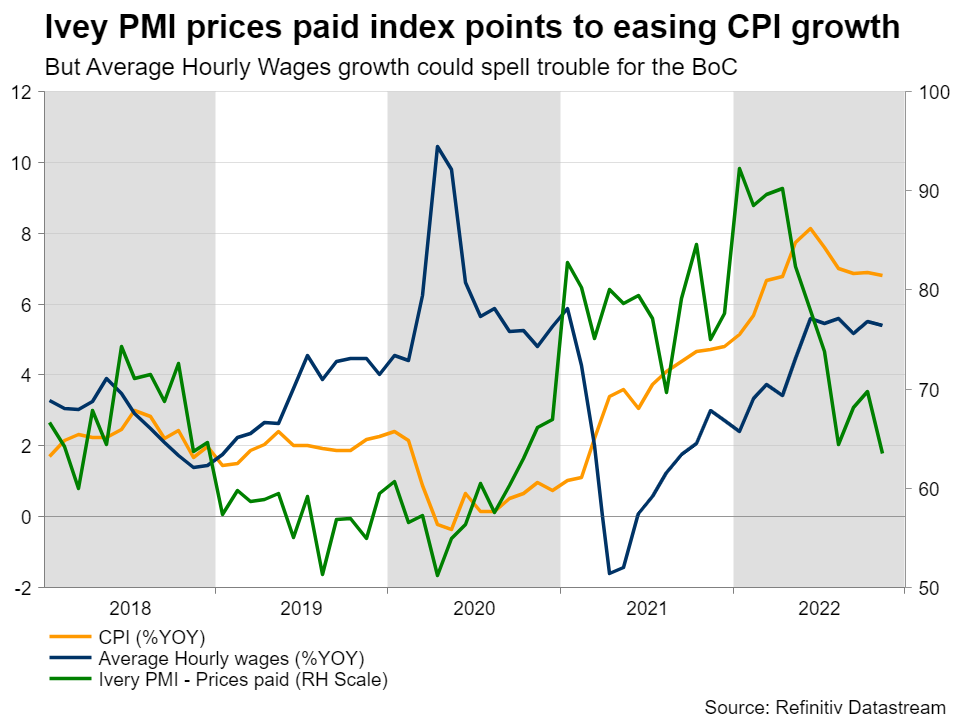
On the same day we also get the less-advertised average hourly wages year-on-year changes and the Ivey PMI. The latter is less known than its S&P Global manufacturing PMI counterpart, but as it covers the overall Canadian economy, it tends to give a more accurate depiction of the underlying economic forces in play. While the manufacturing PMI yesterday managed to record another small drop to 49.2, the Ivey PMI is seen remaining above 50. Interestingly, the prices paid subindex could continue its downward trend, partially confirming market expectations for lower headline inflation going forward, but also reducing fears for a secondary round of effects on inflation from increased wages.
Could the loonie finally record and hold gains against the dollar?
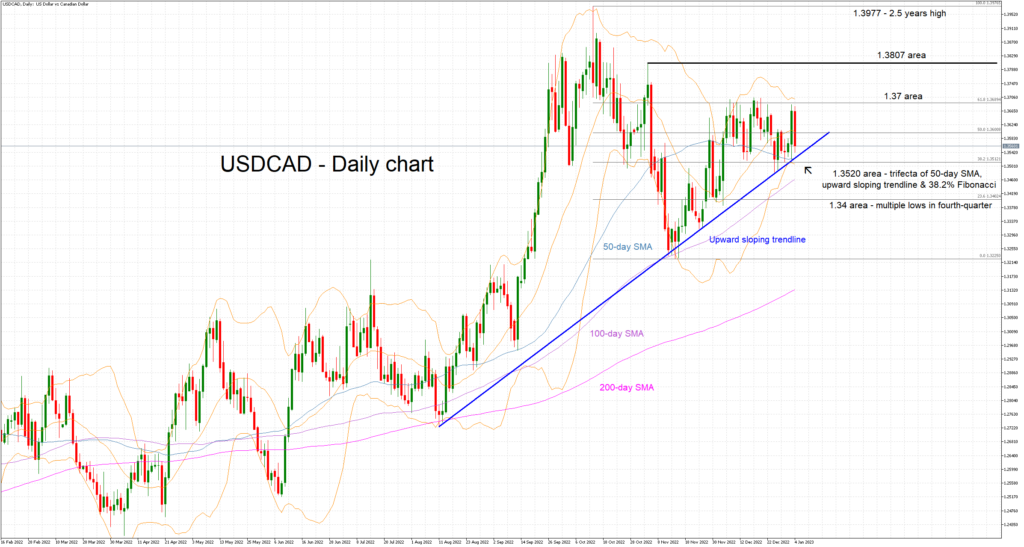
The dollar/loonie pair has been a one-way street since the middle of 2021, climbing to a 2½-year high of 1.3977 on October 13. The loonie has since been trying to make gains but the tide does not appear to have turned in its favour yet. An upside surprise at Friday’s data could allow the CAD bulls to attempt a comeback and thus push the pair towards 1.3520 where the trifecta of the upward sloping trendline, the 50-day simple moving average and the 38.2% Fibonacci retracement of the October 13 downtrend all reside. If successful, the next target could be the 1.34 area. On the other hand, weaker data prints on Friday could inspire the CAD bears to finally break the 1.37 area and potentially, then aim for the 1.3807 level.
Where Next for Natural Gas Futures?
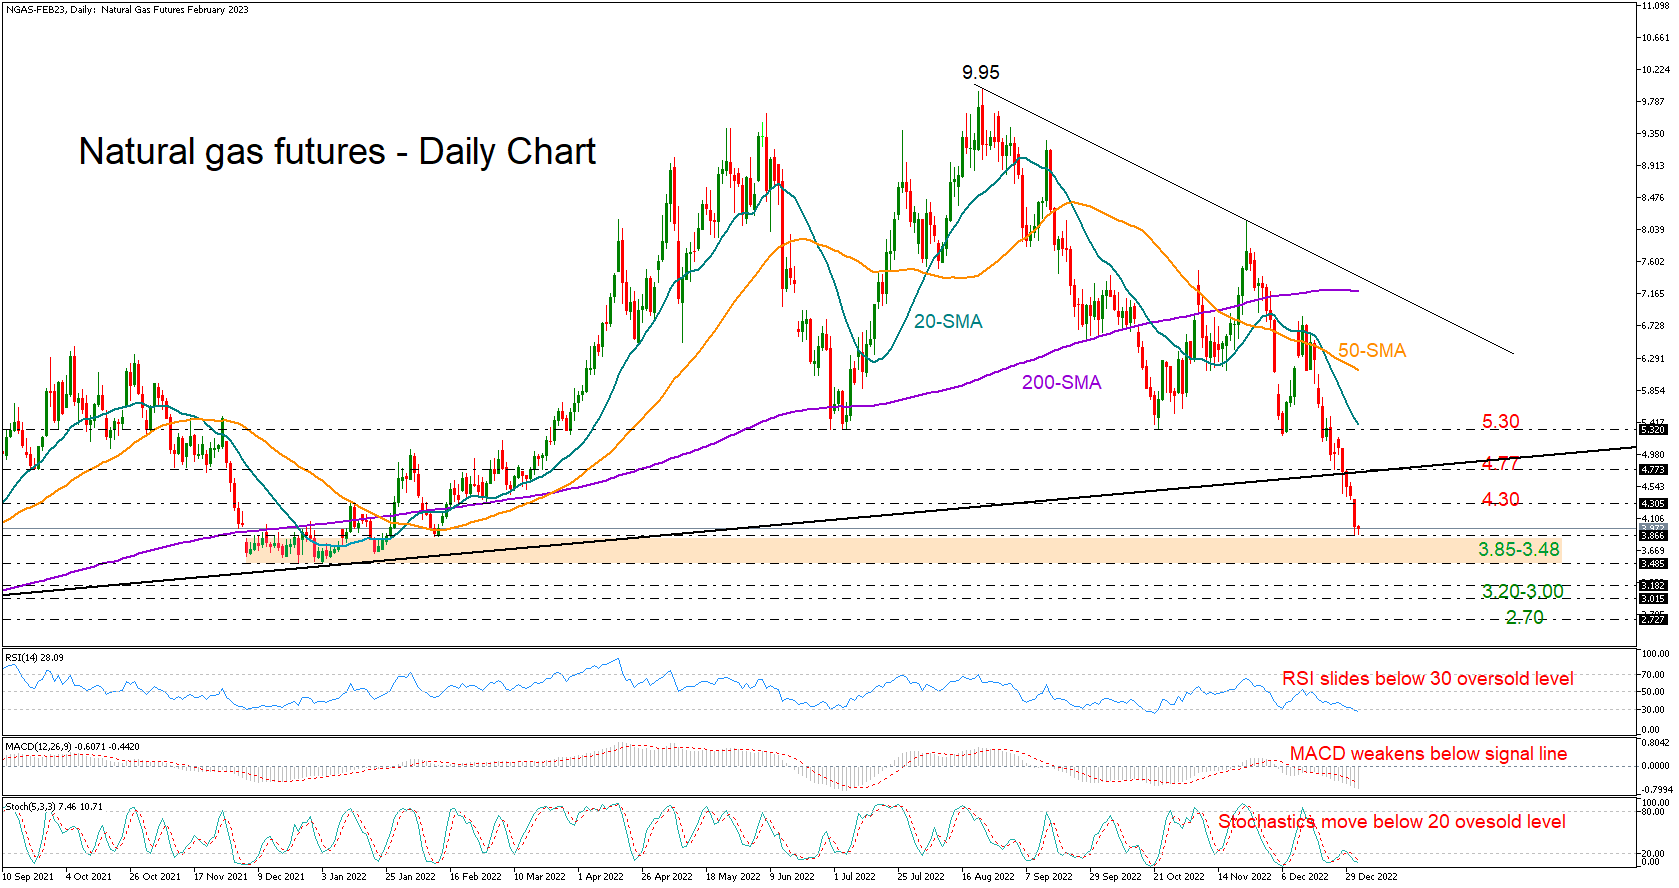
Natural gas futures (February delivery) have been in the red almost every single day since mid-December, having almost snapped the 2022 ascent to chart a new low of 3.88 on Tuesday.
The price is currently trading 60% below the August peak of 9.95, but hopes for an upside reversal are now gaining strength as the market is nearing its 2022 base of 3.85-3.48 and the RSI and the stochastics are fluctuating within the oversold territory.
If the bears stay in power, squeezing the market below that threshold, selling tendencies may intensify towards the 3.20-3.00 zone, where the price pivoted a couple of times during 2021. Even lower, some congestion could emerge near the 2.70 handle.
Should the price bounce on 2022 lows, the bulls will initially push for a close above the nearby 4.30 border and then attempt to pierce through the broken support trendline from 2020 lows at 4.77. If they succeed, the recovery could pick up steam towards the 2022 key support area of 5.30, where the 20-day simple moving average (SMA) currently lies. Another victory at this point could trigger a sharp increase to 6.00.
In brief, although the bearish trajectory in natural gas futures remains well intact, some recovery cannot be ruled out as the decline looks overdone near the 2022 bottom area.
Eurozone PMI composite finalized at 49.3, downturn moderated further
Eurozone PMI Services was finalized at 49.8, in December, up from November's 48.5. PMI Composite was finalized at 49.3, up from prior month's 47.8. Looking at PMI Composite readings of some member states, Spain (49.9), Italy (49.6), France (49.1) and Germany (49.0) were all in contraction.
Joe Hayes, Senior Economist at S&P Global Market Intelligence said:
"The eurozone economy continued to deteriorate in December, but the strength of the downturn moderated for a second successive month, tentatively pointing to a contraction in the economy that may be milder than was initially anticipated....
"Cooling price pressures have helped temper the decline in economic activity levels....
"Nevertheless, there is little evidence across the survey results to suggest the eurozone economy may return to meaningful and stable growth any time soon."
USDCHF Loses Ground after Exciting Rally
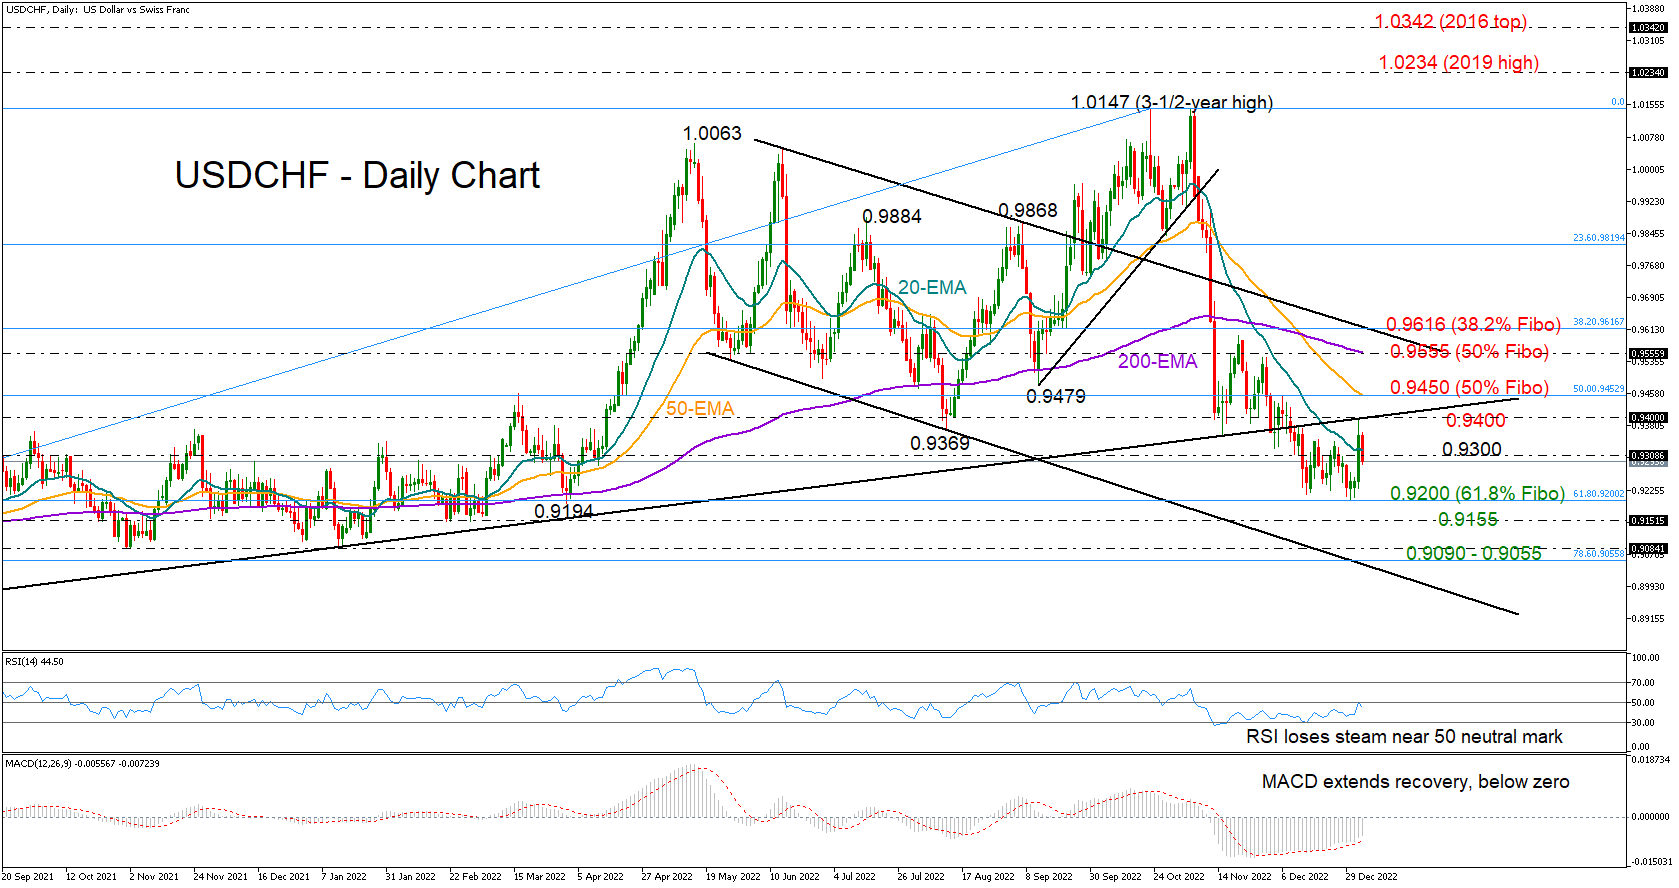
USDCHF experienced its fastest daily rally in a couple of months on Tuesday, advancing by 1.2% to chart an almost one-month high of 0.9397.
Despite the strong bullish momentum, the price could not crawl back above the broken support trendline from the 2021 lows, sliding back to the red zone on Wednesday.
A bullish bias has yet to be confirmed as the RSI keeps hovering below its 50 neutral mark, while the MACD, although above its red signal line, is still dipped in the negative area.
If the decline continues below the 0.9300 psychological mark, the bears will attempt to re-activate the downtrend from November’s highs below the 0.9200 level. This is where the 61.8% Fibonacci retracement of the 2021-2022 uptrend is positioned. Hence, an extension lower could fortify selling pressures likely towards the 0.9155 constraining zone, while a more aggressive decline could retest the 2022 bottom around 0.9090 and the 78.6% Fibo zone of 0.9055.
Alternatively, a bounce back above the key support-turned-resistance trendline and the 0.9400 number could initially take a rest near the 50% Fibonacci barricade of 0.9450 before accelerating towards the 200-day exponential moving average (EMA) at 0.9555. Running higher, the pair will push for a close above the 38.2% Fibonacci number of 0.9616, where the constraining line from June happens to be.
In short, USDCHF has not escaped the bearish area yet despite its latest exciting upturn. For that to happen, the price will need a sustainable recovery above 0.9400 and beyond 0.9450.
NZDUSD Ticks Up From Falling Trend Line
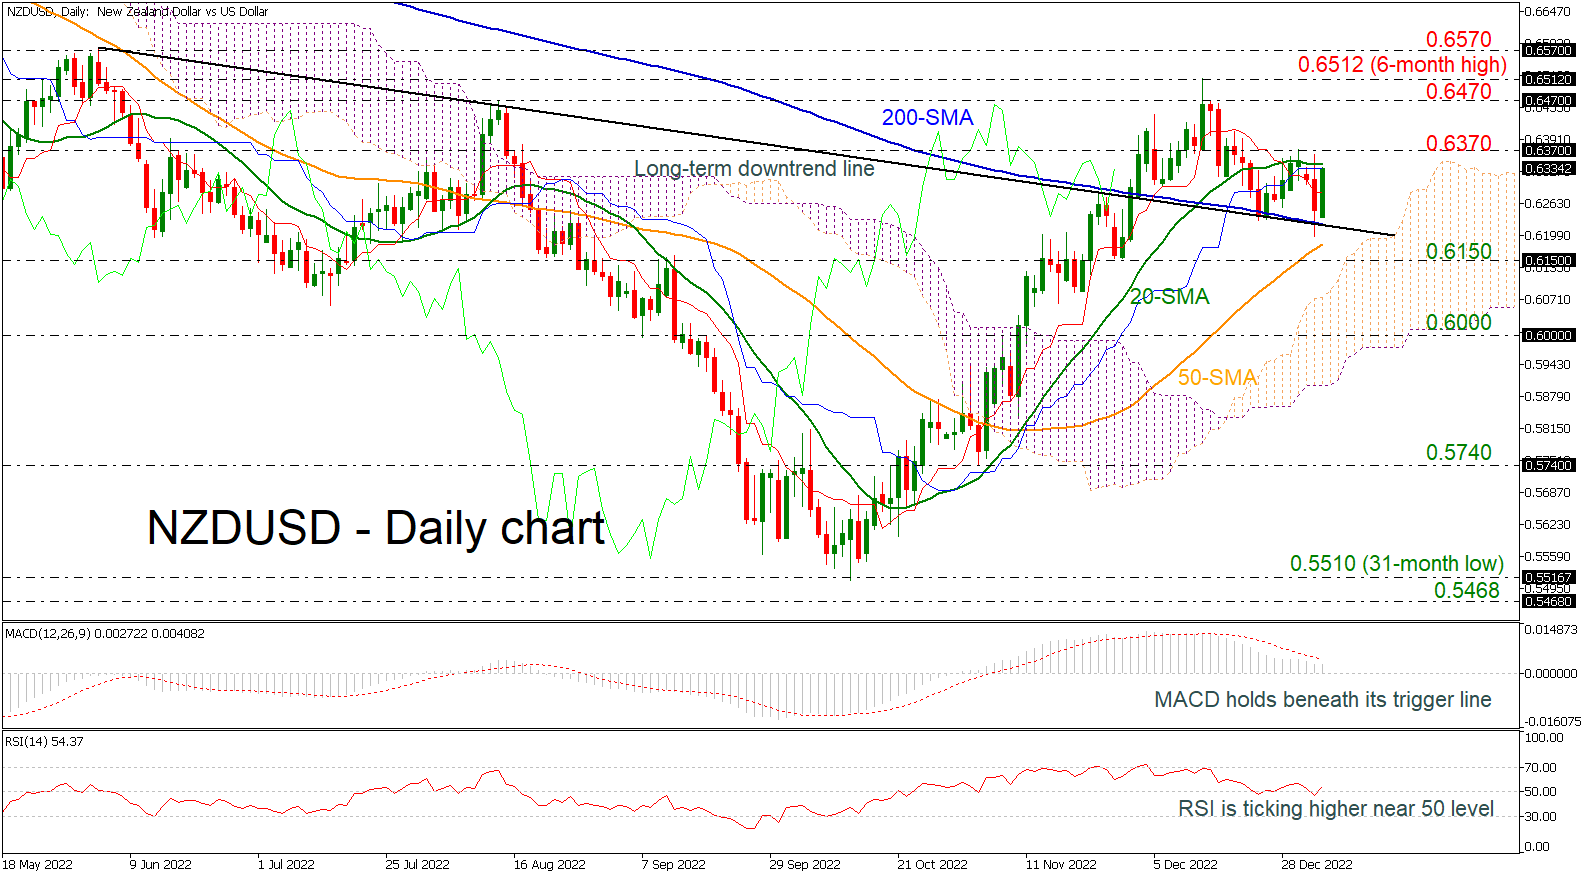
NZDUSD is rising after bouncing off the long-term descending trend line and the 200-day simple moving average (SMA) but is still hovering beneath the 20-day SMA.
The negatively aligned Tenkan-sen line serves as a testament to the negative short-term momentum. The Chikou Span, though, is signaling a potentially oversold market; a near-term reversal should thus not be ruled out. The MACD oscillator is still declining beneath its trigger line in the positive region; however, the RSI is pointing upwards above the neutral threshold of 50.
Immediate support to further declines may take place around the 200-day SMA at 0.6220 ahead of the 50-day SMA at 0.6180, while the 0.6150 barrier could provide additional support in case of steeper losses.
A move to the upside may meet resistance around the 20-day SMA at 0.6340 and the 0.6370 hurdle. More gains could open the way towards the 0.6470 barrier and the six-month peak of 0.6512, while any increases above the latter level would endorse the medium-term bullish outlook.
Overall, NZDUSD is still standing above the downtrend line, suggesting that upside pressures may come next.
AUD/USD: Aussie Surges to Three-Week High on Risk Appetite, Fundamentals
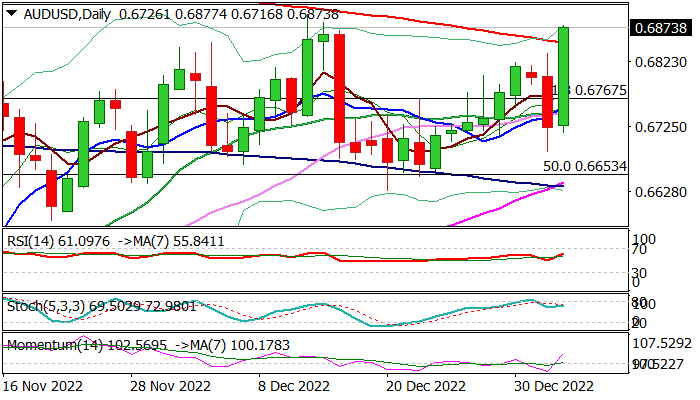
The Australian dollar surged in early Wednesday’s trading, driven by higher stocks and rumors that China is discussing easing of ban on Australia coal imports.
Aussie advanced over 2% in Asia, early Europe and cracked pivotal barrier at 0.6854 (200DMA), eyeing next key levels at 0.6893/0.6908 (Dec 13 former high/Fibo 76.4% of 0.7136/0.6170).
Clear break of these barriers is needed to signal a continuation of larger advance from 0.6170 (Oct 13 low) and expose psychological 0.70 resistance.
Strong rise of positive momentum on daily chart and studies turning into full bullish setup, support fresh advance.
Broken Fibo 61.8% (0.6767) offers solid support and expected to keep the downside protected.
Res: 0.6893; 0.6908; 0.7000; 0.7072.
Sup: 0.6834; 0.6796; 0.6767; 0.6687.
USDJPY Plummets to Fresh 7-Month Low
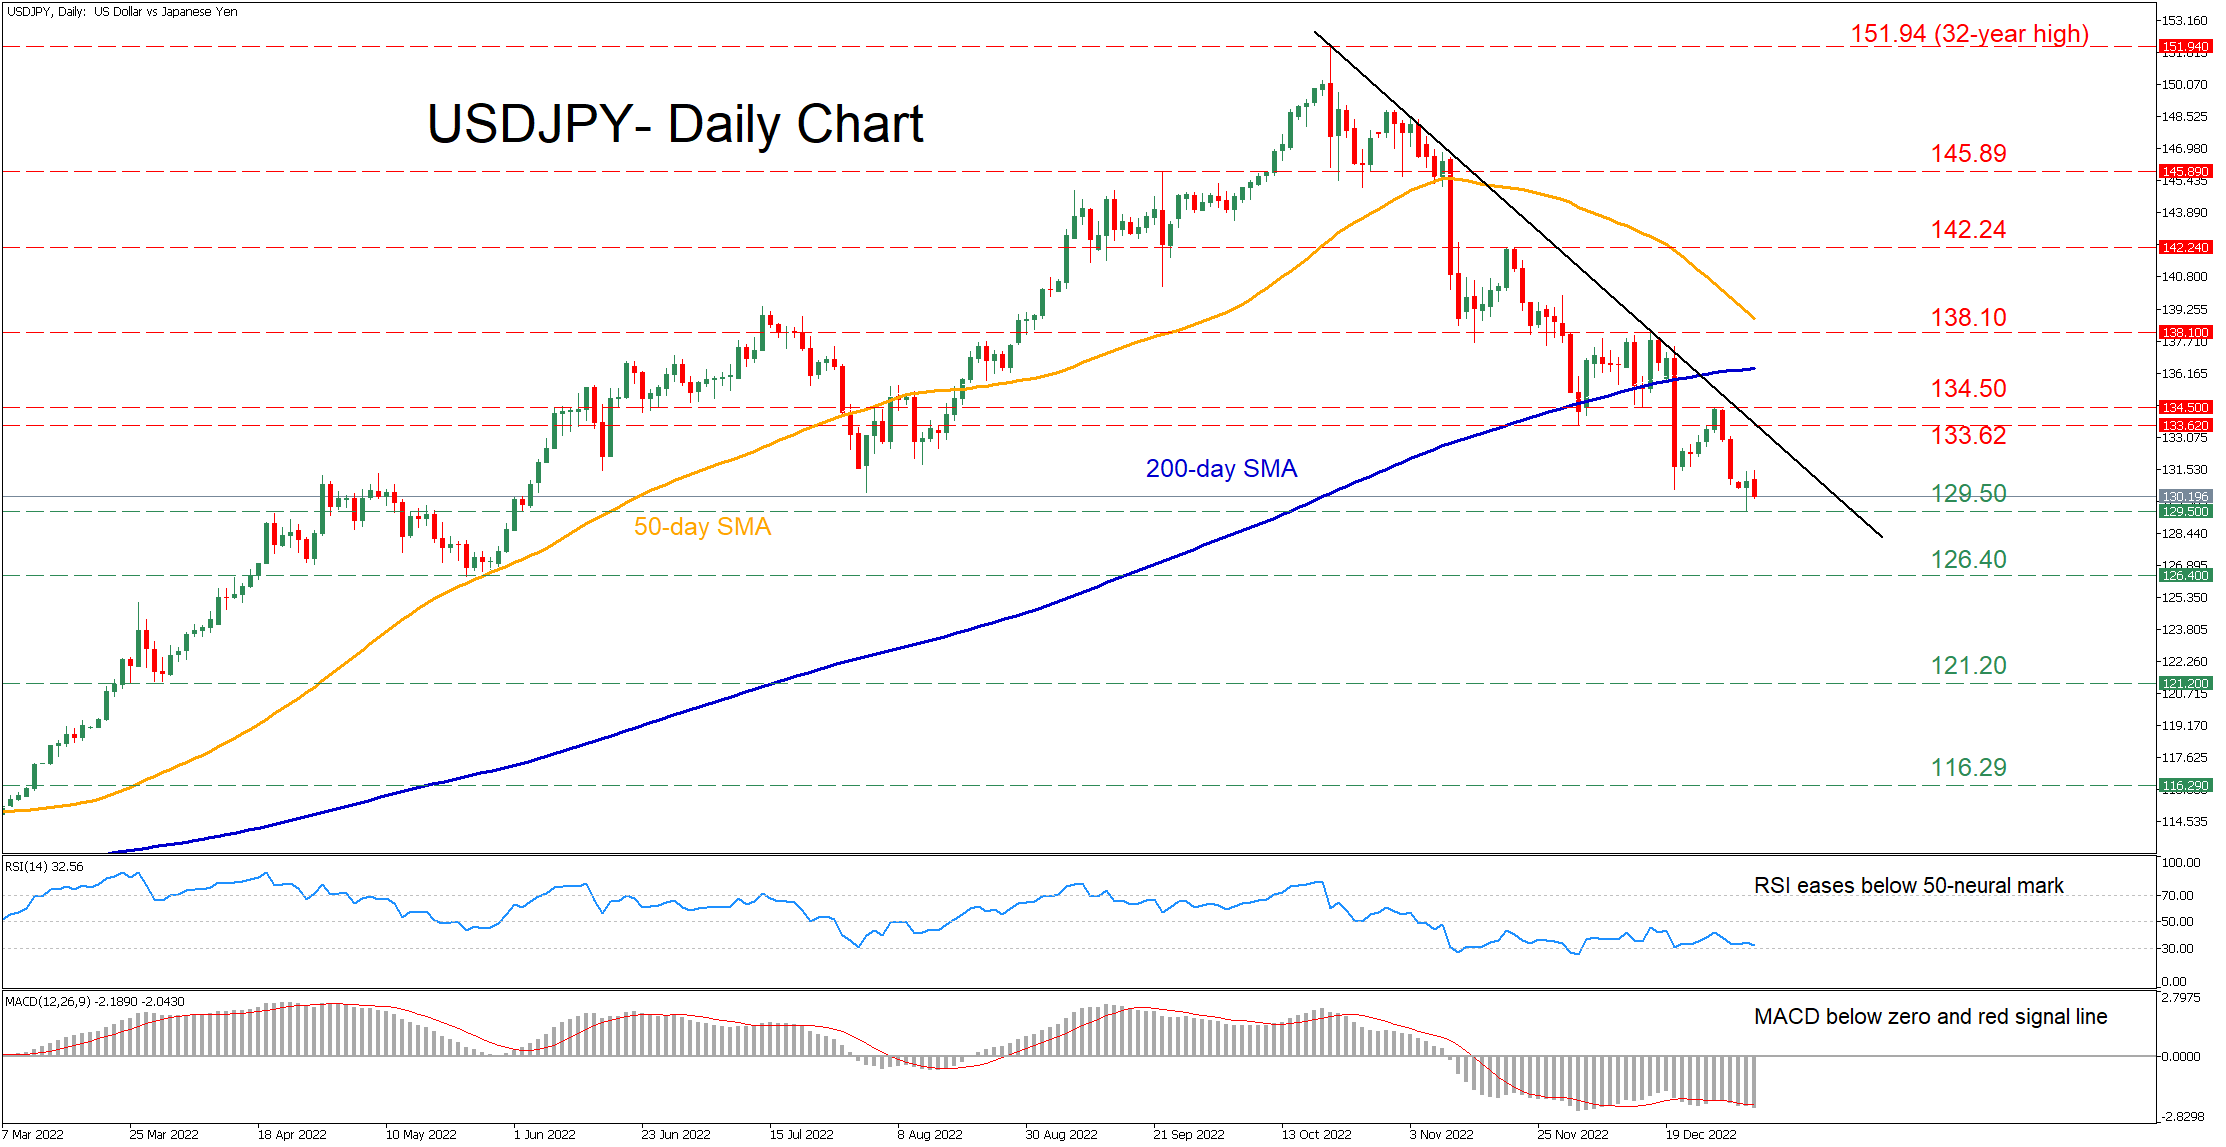
USDJPY had experienced a significant uptrend in the past year, climbing to a 32-year high of 151.94 in mid-October. However, the pair has been experiencing a prolonged downside correction since then, with the price hitting a fresh seven-month low of 129.50 in the previous daily session.
The short-term oscillators currently suggest that bearish forces have gained total control. Specifically, the RSI is declining near its 30-oversold zone, while the MACD histogram is retreating further below both zero and its red signal line.
Should the downfall persist, the price could retest its recent seven-month low of 129.50. Sliding beneath that floor, the pair might descend to form fresh multi-month lows, where the May 2022 low of 126.40 could provide downside protection. A violation of the latter could turn the spotlight to the March 2022 support of 121.20.
Alternatively, should the buying interest intensify, the December support of 133.62 could now act as the initial resistance region. Violating that zone, the bulls may then aim for 134.50 before the 138.10 resistance zone comes under examination. Breaking above the latter, the price could then ascend to challenge 142.24.
In brief, USDJPY appears set to post fresh lows as the technical picture is constantly deteriorating and downside risks are intensifying. What’s more, the descending 50-day simple moving average (SMA) is closing the gap with the 200-day SMA, where a potential death cross could accelerate the decline.