

Sample Category Title
The Fed Keeps a Close Eye on the Labour Market
Market movers today
Today's data calendar is thin. After yesterday's bunch of data releases and Fed minutes, markets will probably listen closely to Fed's Bostic in the afternoon.
While waiting for Friday's US payrolls, we get a few US tier-2 employment indicators with the release of ADP employment, initial jobless claims and Challenger job cuts.
The 60 second overview
Nordic Outlook: This morning we published our Nordic Outlook - Time to get inflation down with new economic forecasts for the Nordic countries. We have downgraded the growth outlook for 2023, as higher inflation means both reduced spending power and higher interest rates than in our October outlook. We expect inflation to come down more quickly in the Nordics than in the wider euro area, and growth to return to more normal levels during 2024. Nordic housing markets, especially in Sweden, are under pressure from the sharp rise in interest rates, and we expect prices to decline further. The Swedish Riksbank is expected to hike rates further as the weak SEK causes inflation concerns, while we expect Norges Bank to be done hiking for now.
FOMC minutes: The minutes of the December FOMC meeting provided little new information for the markets yesterday. The Fed continues to focus on labour markets and price developments in the most wage-sensitive sectors to gauge the underlying inflation pressures. On a more hawkish note, some members suggested that 'unwarranted easing in financial conditions' driven by premature speculation of future rate cuts could push Fed towards taking a more hawkish stance.
Good news is bad news: Yesterday, we highlighted how the recent uptick in some US leading indicators points towards a turnaround in macro momentum amid easing financial conditions, which is tricky for Fed as they are still far away from reaching their price stability objective. Read more in Research US - Good news is bad news for the Fed, 4 January
Hawkish Fed member: Speaking of hawkish stance, President of Minneapolis Fed Neel Kashkari (voter, hawk) yesterday said, that he favoured raising rates to 5.4%, much higher than where the market currently prices the peak just below 5%. He added that "any sign of slow progress that keeps inflation elevated for longer will warrant, in my view, taking the policy rate potentially much higher".
Mixed US data: Yesterday's US macro data was a mixed bag, with ISM manufacturing continuing its decline, but JOLTs Job Openings surprising to the upside. Notably, also the ISM employment index and JOLTs voluntary quits rose, further supporting the view of a resilient labour market. Current level of job openings is consistent with employment costs rising some 4-5% annually, clearly too fast to be consistent with Fed's inflation target.
Oil prices lower: Oil prices plunged yesterday below USD80 per barrel - unexpectedly and at odds with the faster reopening of Chinese economy that should support global oil demand. We think it is too early to disregard a positive effect on oil prices from China ending hard lockdown measures, but it may not come before after it has passed the current big wave of infections.
Equities: US and European stocks were higher yesterday, partly supported by the China reopening, which continues to fuel a strong rally in Chinese stocks, where offshore stocks this morning reached the highest level since July. They are still 30% below pre-pandemic levels, though, leaving potential for more upside as the economy recovers, see China Outlook: Earlier reopening to driver faster rebound, 3 January.
Credit: The flow of new deals continued yesterday also in the EUR corporate segment with French utility Engie bringing a landmark EUR2.75bn triple-tranche deal to the market. Within the FIG segment, issuance of senior debt slowed a bit with EUR4bn printed, yet there were some signs of lower investor demand following the heavy issuance on Tuesday. Nonetheless, the two AT1 capital trades executed saw solid demand. Also, CDS indices performed with iTraxx Main tighter by 5bp to 85bp, while Xover tightened 22bp to 440bp.
FI: Global yields continue to decline and take out the rate increase seen before New Year. This is driven by the lower than expected French headline inflation data. However, the core-inflation remains sticky and thus we could a rebound in the headline inflation later on.
FX: The NOK continues to underperform amid downward pressure on oil. EUR/NOK trades just above 10.70 this morning and is vulnerable for further upside. Meanwhile, EUR/SEK briefly tested 11.20, possibly due to NOK contagion, but is back in the range, currently at 11.15. In majors, there were big moves in JPY crosses yesterday. USD/JPY and EUR/JPY alike gained two figures. EUR/USD relative stable around 1.06.
Nordics
There are no market movers in Nordics today.
EUR/GBP Daily Outlook
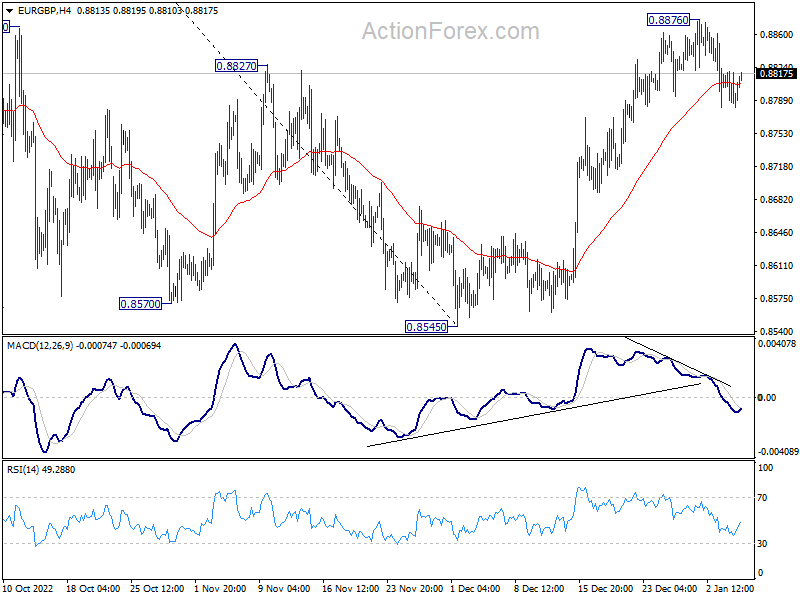
Daily Pivots: (S1) 0.8779; (P) 0.8800; (R1) 0.8816; More...
Intraday bias in EUR/GBP is turned neutral first. As long as 55 day EMA (now at 0.8714) holds, rise from 0.8545 is still in favor to continue. Above 0.8876 will resume the rally and target 61.8% retracement of 0.9276 to 0.8545 at 0.8997 and possibly above.
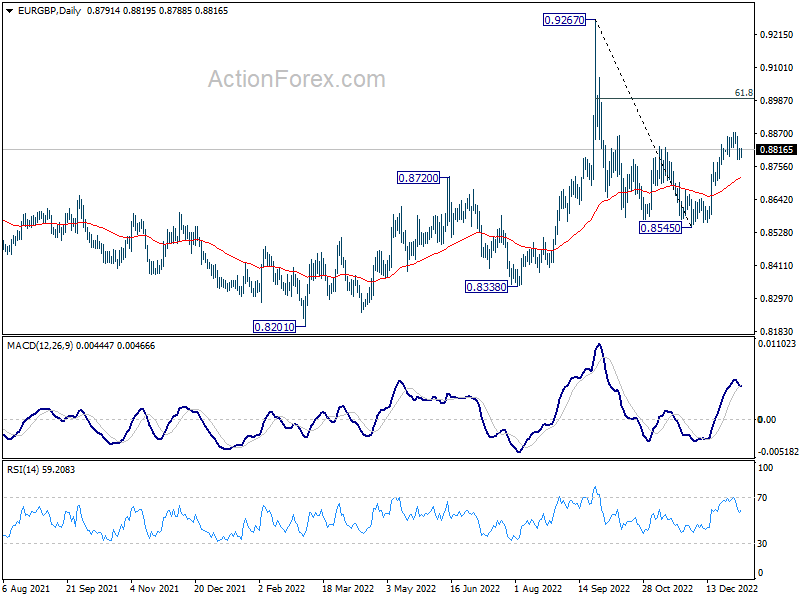
In the bigger picture, fall from 0.9267 is seen as a down leg inside long term range pattern. Deeper fall could be seen towards 0.8201/8338 support zone. But strong support should be seen there to bring reversal. Nevertheless, firm break of 0.8827 resistance will turn favor to the case that such decline is merely a correction in the up trend from 0.8201. That is, further rally would be seen at a later stage through 0.9267.
EUR/AUD Daily Outlook
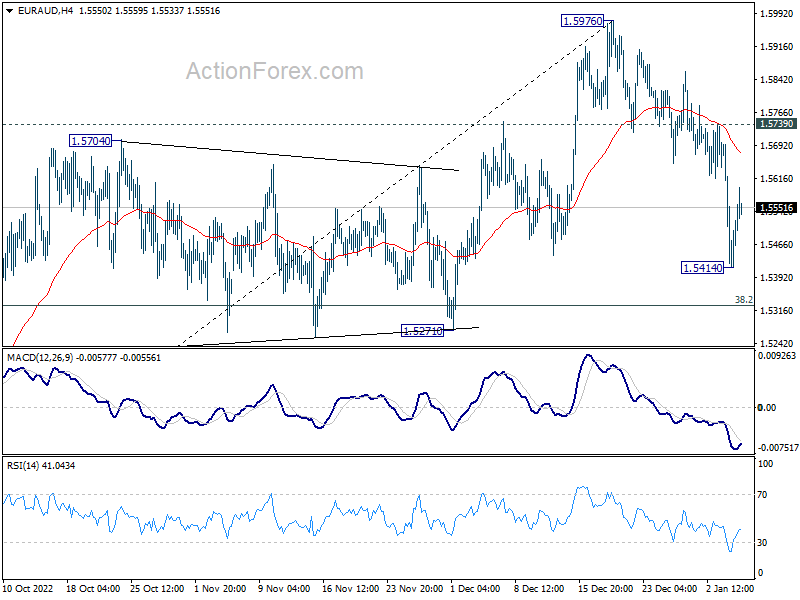
Daily Pivots: (S1) 1.5385; (P) 1.5542; (R1) 1.5666; More...
Intraday bias in EUR/AUD is turned neutral first, as it recovered after dipping to 1.5414. On the downside, below 1.5414 will extend the fall form 1.5976 to 38.2% retracement of 1.4281 to 1.5976 at 1.5329. Nevertheless, on the upside, above 1.5739 minor resistance will suggest that the pull back has finished, and bring retest of 1.5976 high.
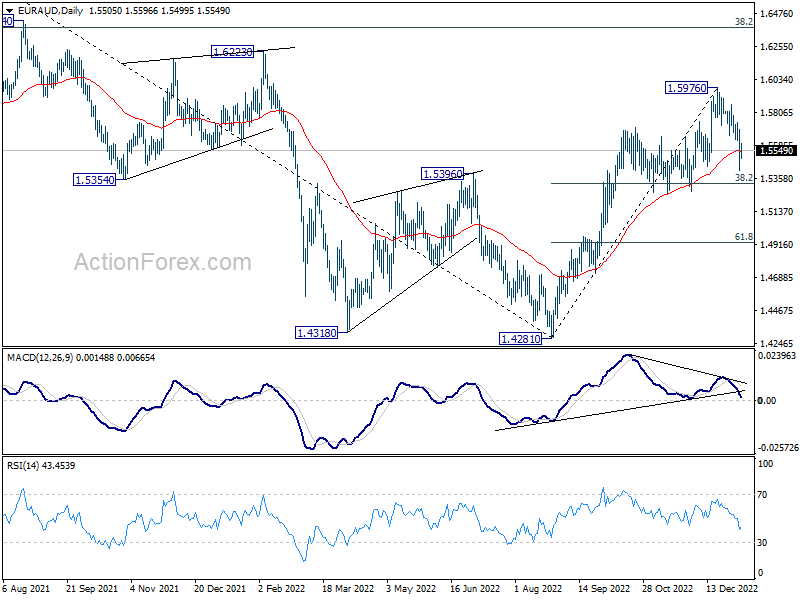
In the bigger picture, strong support from 55 week EMA affirms underlying bullishness. As long as 1.5271 support holds, rise from 1.4281 medium term bottom is expected to continue to 1.6434 key resistance next. Decisive break there should confirm medium term bullish trend reversal.
EUR/CHF Daily Outlook
Daily Pivots: (S1) 0.9841; (P) 0.9873; (R1) 0.9905; More....
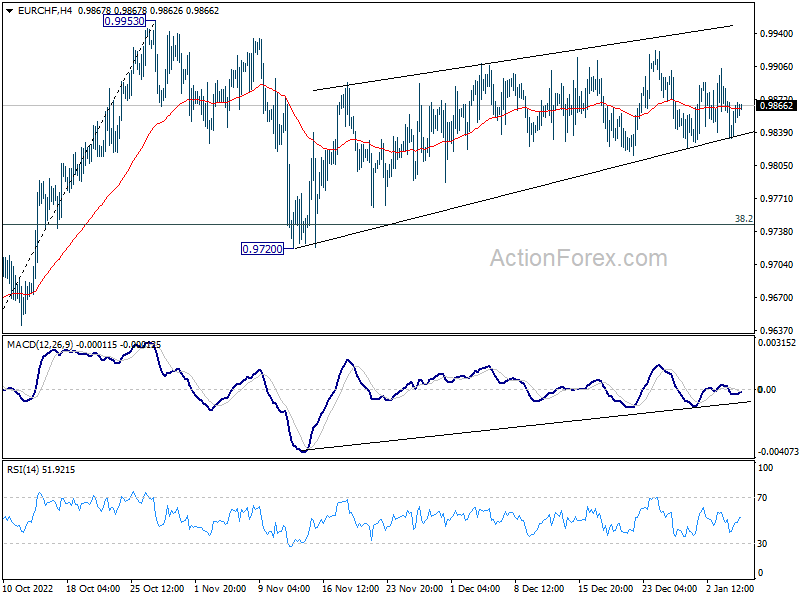
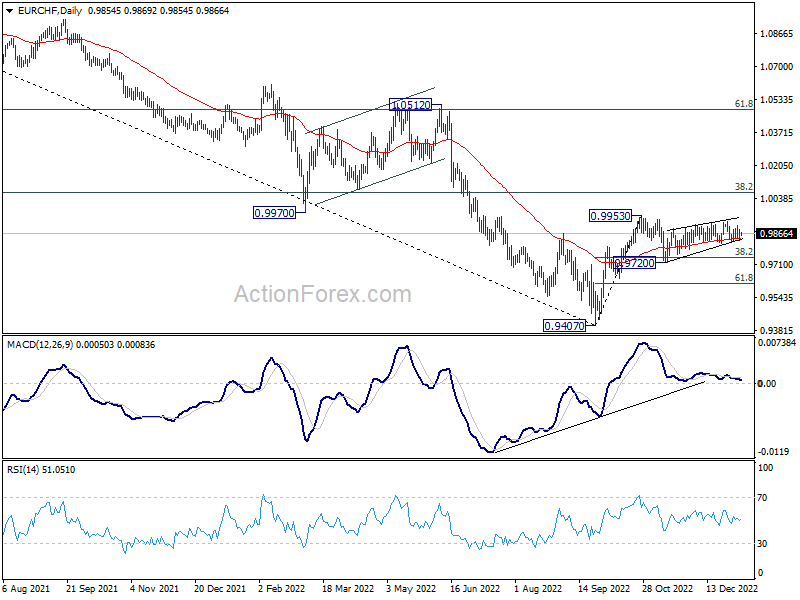
EUR/CHF is still extending the consolidation pattern from 0.9953 and intraday bias remains neutral. On the upside, firm break of 0.9953 resistance will resume larger rally from 0.9407 to 1.0072 fibonacci level. However, break of 0.9720 will extend the decline from 0.9953 to 61.8% retracement of 0.8407 to 0.9953 at 0.9616.
In the bigger picture, as long as 38.2% retracement of 1.1149 to 0.9407 at 1.0072 holds, price actions from 0.9407 medium term bottom will be treated as a corrective pattern. That is, long term down trend would resume through this low at a later stage. Nevertheless, firm break of 1.0072 will also have 55 week EMA (now at 1.0053) taken out. That would be an initial sign of long term bullish reversal.
EUR/JPY Daily Outlook
Daily Pivots: (S1) 138.80; (P) 139.78; (R1) 141.68; More....
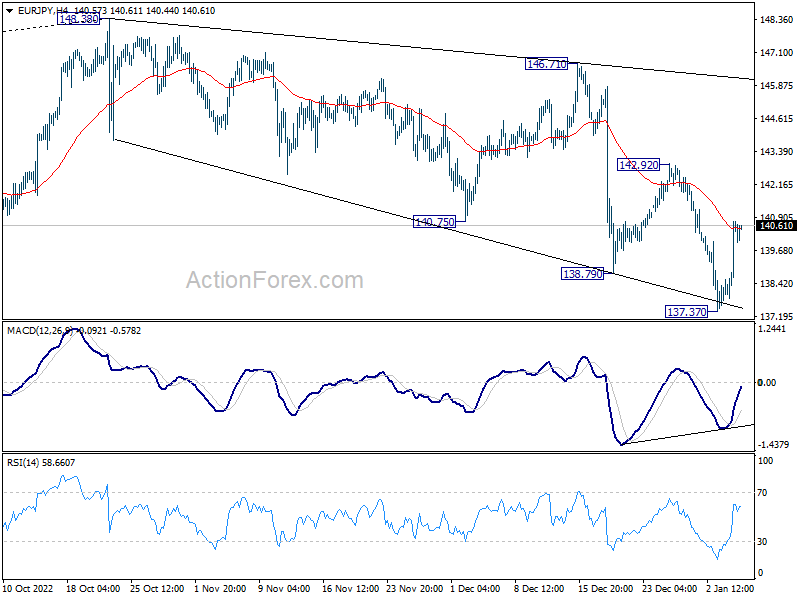
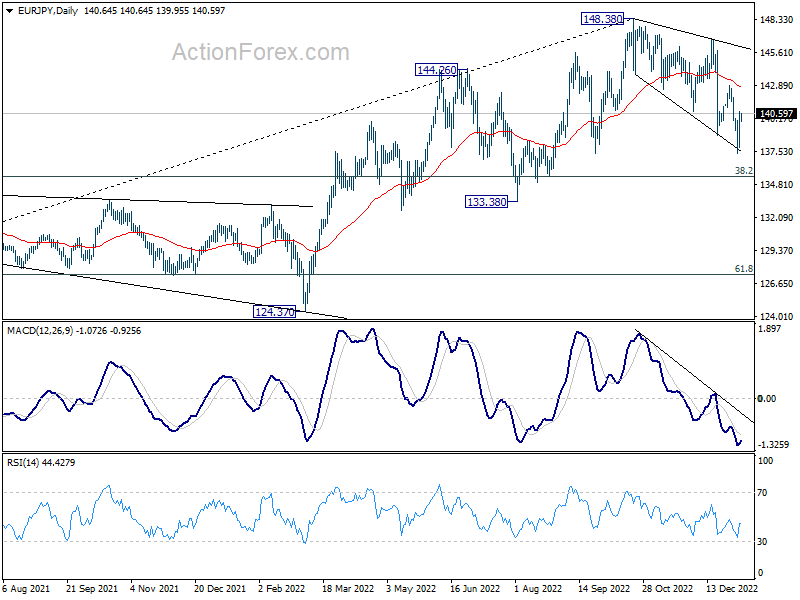
Intraday bias in EUR/JPY is turned neutral first with current recovery. Outlook stays bearish as long as 142.92 resistance holds. Break of 137.37 will resume the decline from 148.38 to 135.40 fibonacci level. However, considering bullish convergence condition in 4 hour MACD, break of 142.92 will argue that the correction from 148.38 might have completed. Intraday bias will be turned back to the upside for 146.71 resistance.
In the bigger picture, as long as 55 week EMA (now at 138.54) holds, larger up trend from 114.42 (2020 low) is still in progress for 149.76 long term resistance. However, firm break of 55 week EMA will bring deeper fall to 38.2% retracement of 114.42 to 148.38 at 135.40. Sustained break there will raise the chance of trend reversal, and target 61.8% retracement at 127.39.
GBP/JPY Daily Outlook
Daily Pivots: (S1) 157.61; (P) 158.89; (R1) 161.28; More...
Intraday bias in GBP/JPY is turned neutral first with current recovery. Further decline is still expected as long as 162.32 resistance holds. Break of 155.33 will resume the fall from 172.11 to 153.70 fibonacci level. Nevertheless, considering bullish convergence condition in 4 hour MACD, firm break of 162.32 will argue that such decline has completed, and turn bias back to the upside for 55 day EMA (now at 163.71) and above.
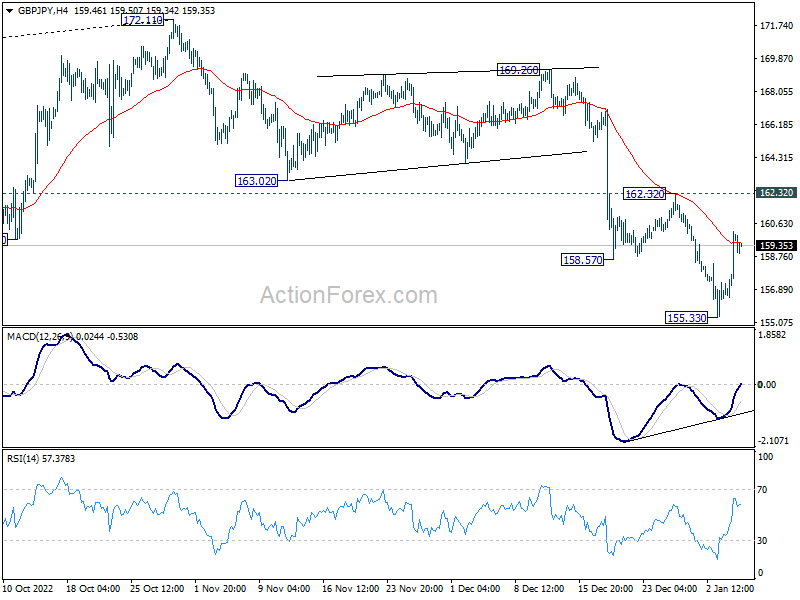
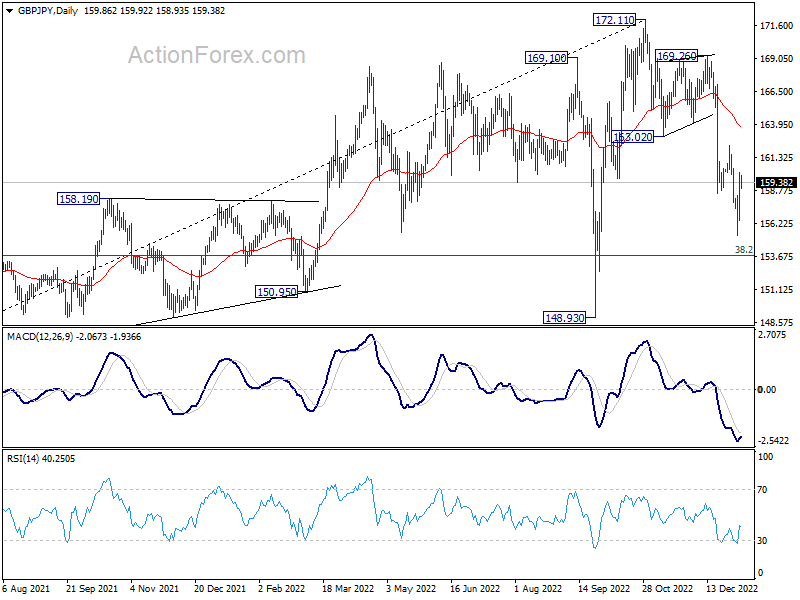
In the bigger picture, a medium term top was in place at 172.11 on on bearish divergence condition in weekly MACD. Decline from there should target 38.2% retracement of 123.94 to 172.11 at 153.70. Sustained break there will raise the change of trend reversal and target 61.8% retracement at 142.34. Nevertheless, break of 153.02 support turned resistance will argue that the decline has completed, and retain medium term bullishness.
Dollar Shrugs FOMC Minutes, Yen Continues to Reverse
Overall, the movements in the markets remain indecisive. Yen is staying soft after reversing all of earlier gains in the week, but holds above near term support levels. Dollar is stuck in familiar range against European majors and commodity currencies. The hawkish FOMC minutes provided no inspiration to the greenback. While Aussie surged yesterday, there is no follow through buying so far. Traders are generally on the sideline awaiting tomorrow's non-farm payroll data from the US.
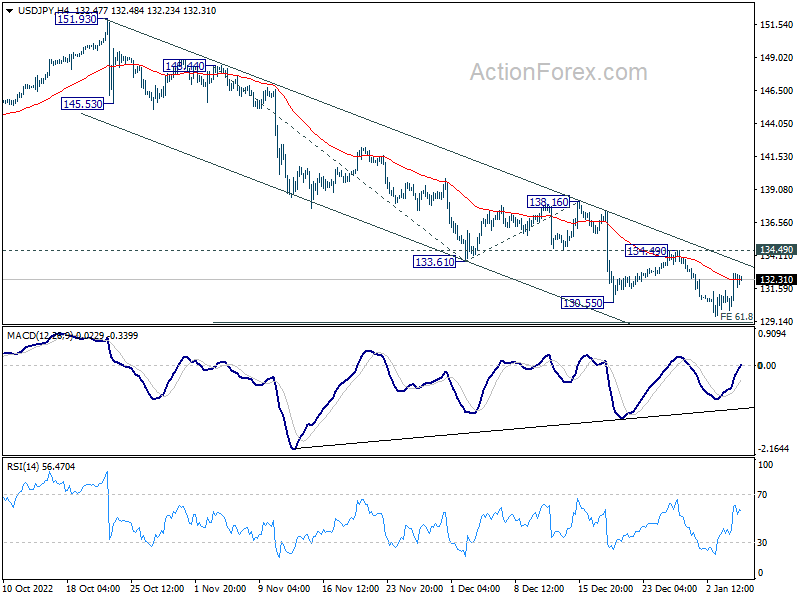
Technically, as Yen crosses are rebounding, attention will be on some near term resistance levels, including 134.49 resistance in USD/JPY, 142.92 resistance in EUR/JPY and 162.32 resistance in GBP/JPY. As long as these levels hold, more downside is still expected in these crosses ahead. However, firm break of these levels together will argue that Yen is under some persistent selling pressure.
In Asia, at the time of writing, Nikkei is up 0.38%. Hong Kong HSI is up 1.38%. China Shanghai SSE is up 1.06%. Singapore Strait Times is up 1.54%. Japan 10-year JGB yield is down -0.0313 at 0.433. Overnight, DOW rose 0.40%. S&P 500 rose 0.75%. NASDAQ rose 0.69%. 10-year yield dropped -0.084 to 3.709.
FOMC Minutes: Anticipate ongoing rate hikes appropriate
In the minutes of the December FOMC meeting, the participants agreed that inflation was "unacceptably high". They "concurred" that inflation data showed "welcome reductions in the monthly pace of price increases", but "stressed that it would take substantially more evidence of progress to be confident that inflation was on a sustained downward path."
Also, participants noted that risk to inflation outlook remained "tilted to the upside", with possibility of "more persistent than anticipate" price pressures. Meanwhile, risks to economic activity outlook were "weighted to the downside".
Participants continued to anticipate that "ongoing increases in the target range for the federal funds rate would be appropriate". "No participant" anticipated that it's appropriate to start lowering rates in 2023. They generally observed that a "restrictive policy stance would need to be maintained" for some time. Also, "several participants commented that historical experience cautioned against prematurely loosening monetary policy."
China Caixin PMI composite improved to 48.3, continuing contraction
China Caixin PMI Services rose from 46.7 to 48.0 in December, above expectation of 47.5. PMI Composite rose from 47.0 to 48.3, pointing to contraction in business activity for the fourth straight month.
Wang Zhe, Senior Economist at Caixin Insight Group said: "Both manufacturing and services sectors' supply and demand contracted due to the pandemic, with manufacturing demand taking a harder hit than in November. Overseas demand was weak, employment remained sluggish, but inflationary pressure was modest, and optimism among businesses significantly improved.
"Covid outbreaks rapidly spread across China in November, causing a number of macroeconomic indicators to fall sharply. On Dec. 7, China announced 10 new measures to further optimize Covid containment. In the short term, infections are expected to explode, which will disrupt production and everyday life. How to effectively coordinate Covid controls with economic and social development has once again become a crucial question."
Looking ahead
Germany trade balance, Eurozone PPI, UK PMI Services final will be released in European session. Later in the day, Canada will release trade balance. US will release ADP employment, jobless claims, trade balance and PMI services final.
GBP/JPY Daily Outlook
Daily Pivots: (S1) 157.61; (P) 158.89; (R1) 161.28; More...
Intraday bias in GBP/JPY is turned neutral first with current recovery. Further decline is still expected as long as 162.32 resistance holds. Break of 155.33 will resume the fall from 172.11 to 153.70 fibonacci level. Nevertheless, considering bullish convergence condition in 4 hour MACD, firm break of 162.32 will argue that such decline has completed, and turn bias back to the upside for 55 day EMA (now at 163.71) and above.
In the bigger picture, a medium term top was in place at 172.11 on on bearish divergence condition in weekly MACD. Decline from there should target 38.2% retracement of 123.94 to 172.11 at 153.70. Sustained break there will raise the change of trend reversal and target 61.8% retracement at 142.34. Nevertheless, break of 153.02 support turned resistance will argue that the decline has completed, and retain medium term bullishness.
Economic Indicators Update
| GMT | Ccy | Events | Actual | Forecast | Previous | Revised |
|---|---|---|---|---|---|---|
| 23:50 | JPY | Monetary Base Y/Y Dec | -6.10% | -3.20% | -6.40% | |
| 01:45 | CNY | Caixin Services PMI Dec | 48 | 47.5 | 46.7 | |
| 05:00 | JPY | Consumer Confidence Index Dec | 30.3 | 29.1 | 28.6 | |
| 07:00 | EUR | Germany Trade Balance (EUR) Nov | 7.5B | 6.9B | ||
| 09:30 | GBP | Services PMI Dec F | 50 | 50 | ||
| 10:00 | EUR | Eurozone PPI M/M Nov | -0.80% | -2.90% | ||
| 10:00 | EUR | Eurozone PPI Y/Y Nov | 28.20% | 30.80% | ||
| 12:30 | USD | Challenger Job Cuts Y/Y Dec | 416.50% | |||
| 13:15 | USD | ADP Employment Change Dec | 145K | 127K | ||
| 13:30 | USD | Initial Jobless Claims (Dec 30) | 230K | 225K | ||
| 13:30 | USD | Trade Balance (USD) Nov | -74.6B | -78.2B | ||
| 13:30 | CAD | Trade Balance (CAD) Nov | 1.2B | 1.2B | ||
| 14:45 | USD | Services PMI Dec F | 44.4 | 44.4 | ||
| 15:30 | USD | Natural Gas Storage | -230B | -213B | ||
| 16:00 | USD | Crude Oil Inventories | 1.5M | 0.7M |
Technical Outlook and Review
USD/JPY:
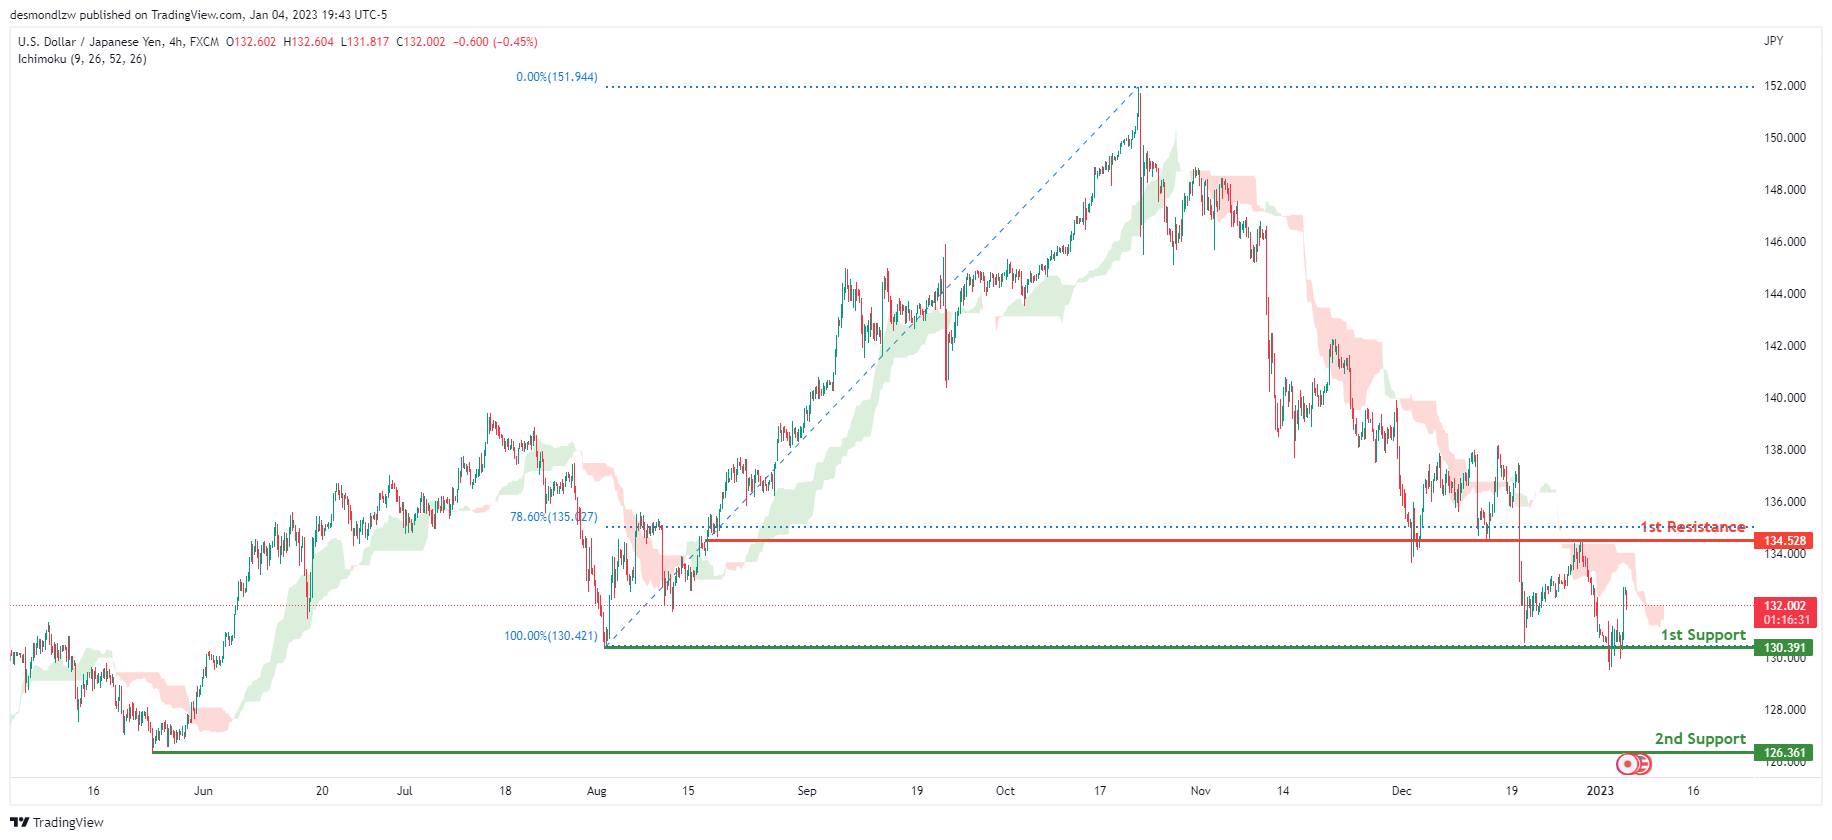
Looking at the H4 chart, my overall bias for USDJPY is bearish due to the current price being below the Ichimoku cloud, indicating a bearish market. If this bearish momentum continues, expect price to possibly continue heading towards the 1st support at 130.391, where the previous swing low is. In an alternate scenario, price could possibly head back up towards the 1st resistance level at 134.528, where the 78.6% Fibonacci line is.
Areas of consideration:
- H4 time frame, 1st resistance at 134.528
- H4 time frame, 1st support at 130.391
DXY:
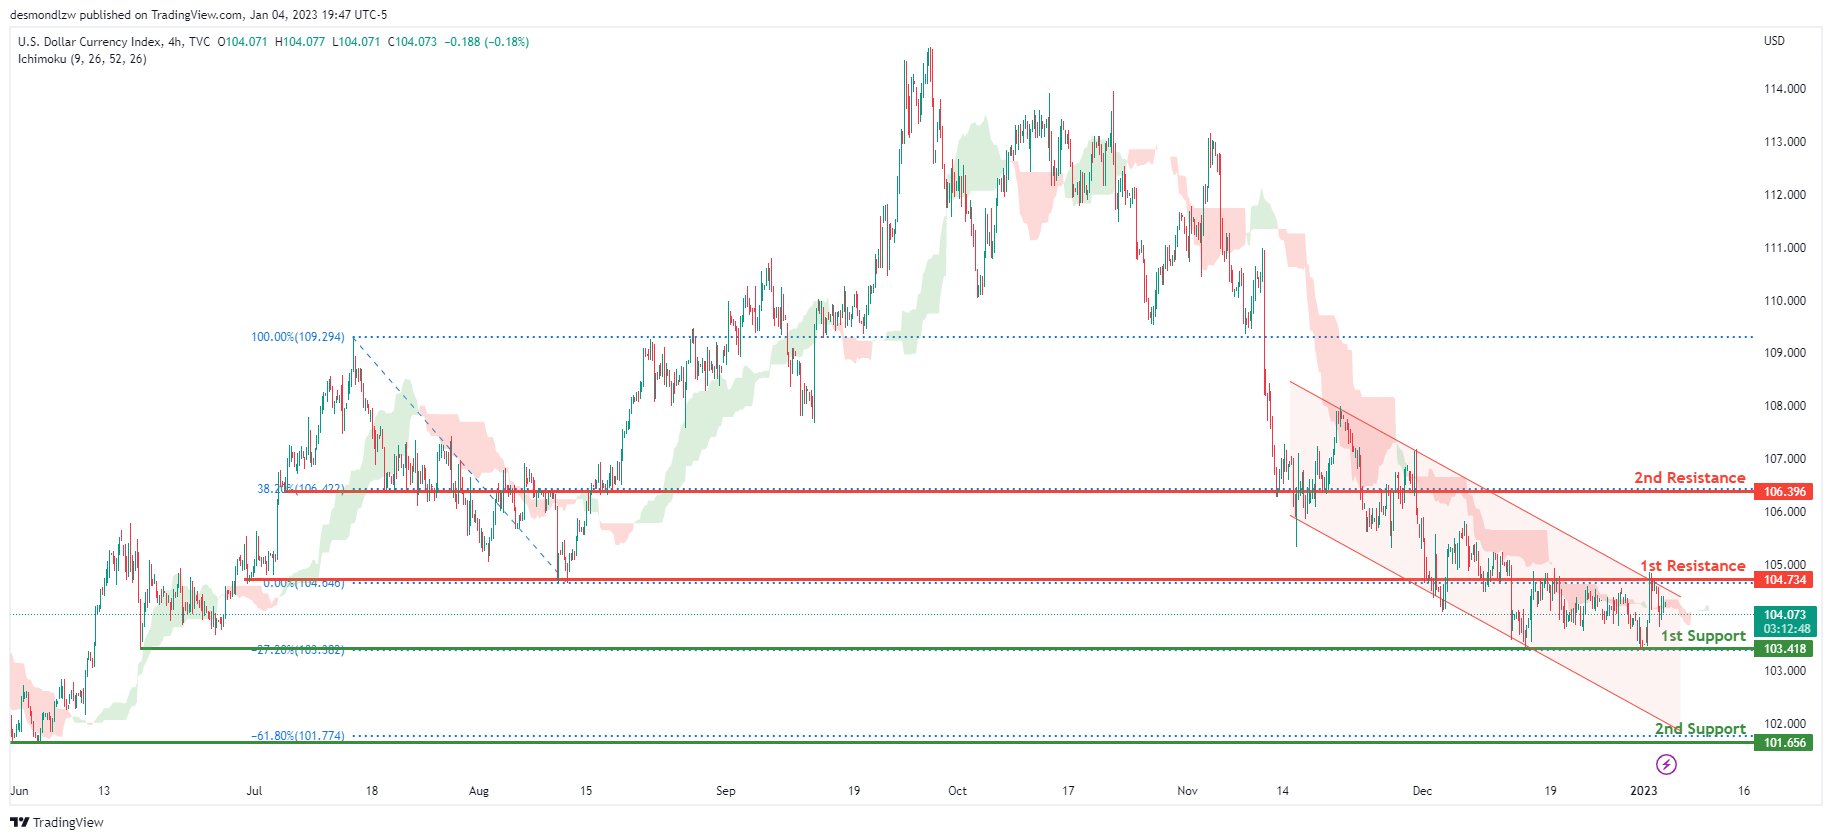
On the H4 chart, the overall bias for DXY is bearish. To add confluence to this, the price is within the descending channel which indicates a bearish market. If this bearish momentum continues, expect the price to possibly break the 1st support line at 103.418, where the -27.2% Fibonacci expansion line is before heading towards the 2nd support at 101.656, where the -61.8% Fibonacci expansion line is. In an alternative scenario, price could head back up and break the 1st resistance line resistance at 104.734, where the previous swing low is before heading towards the 2nd resistance at 106.396, where the 38.2% Fibonacci line is.
Areas of consideration:
- H4 time frame, 1st resistance at 104.734
- H4 time frame, 1st support at 103.418
- H4 time frame, 2nd support at 101.656
EUR/USD:
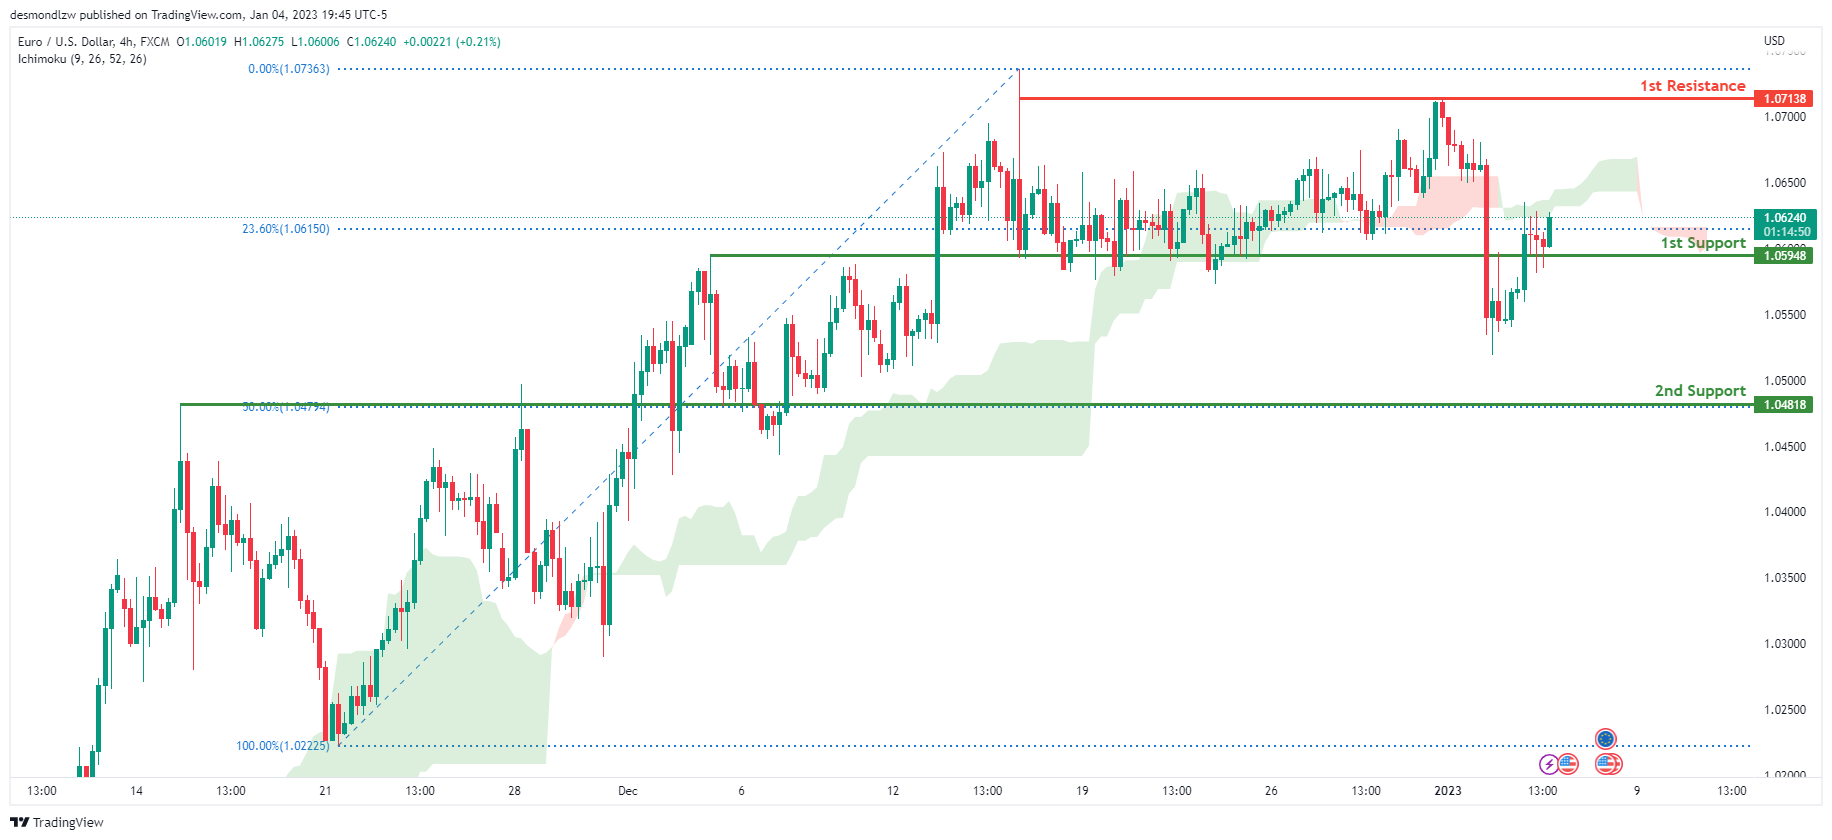
Looking at the H4 chart, my overall bias for EURUSD is bullish due to the current price crossing above the Ichimoku cloud, indicating a bullish market. If this bullish momentum continues, expect the price to possibly head towards the 1st resistance at 1.07138, where the recent highs are. In an alternate scenario, price could possibly head back down towards the 1st support level at 1.05948, where the 23.6% Fibonacci line is.
Areas of consideration :
- H4 1st resistance at 1.05948
- H4 1st support at 1.05948
GBP/USD:
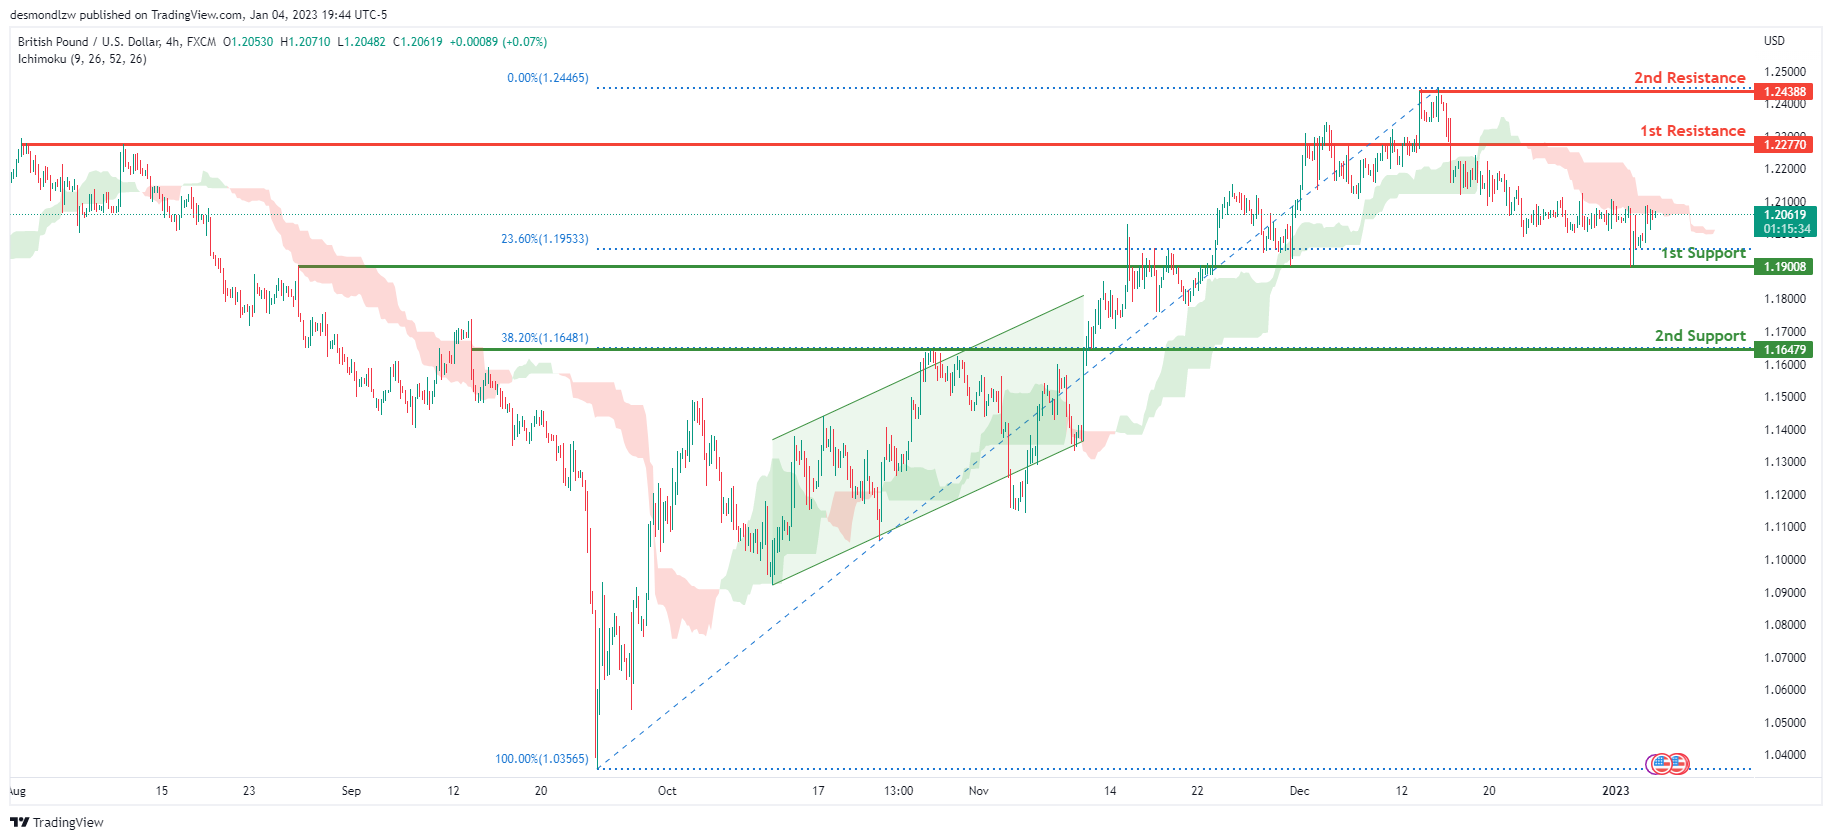
Looking at the H4 chart, my overall bias for GBPUSD is bearish due to the current price being below the Ichimoku cloud, indicating a bearish market. If this bearish momentum continues, expect price to possibly continue heading towards the 1st support at 1.19008, where the 23.6% Fibonacci line is. In an alternate scenario, price could possibly head back up to break the 1st resistance level at 1.22770, where the previous swing high is before heading towards the 2nd support at 1.16479, where the 38.2% Fibonacci line is.
Areas of consideration:
- H4 1st resistance at 1.22770
- H4 1st support at 1.19008
- H4 2nd support at 1.16479
USD/CHF:
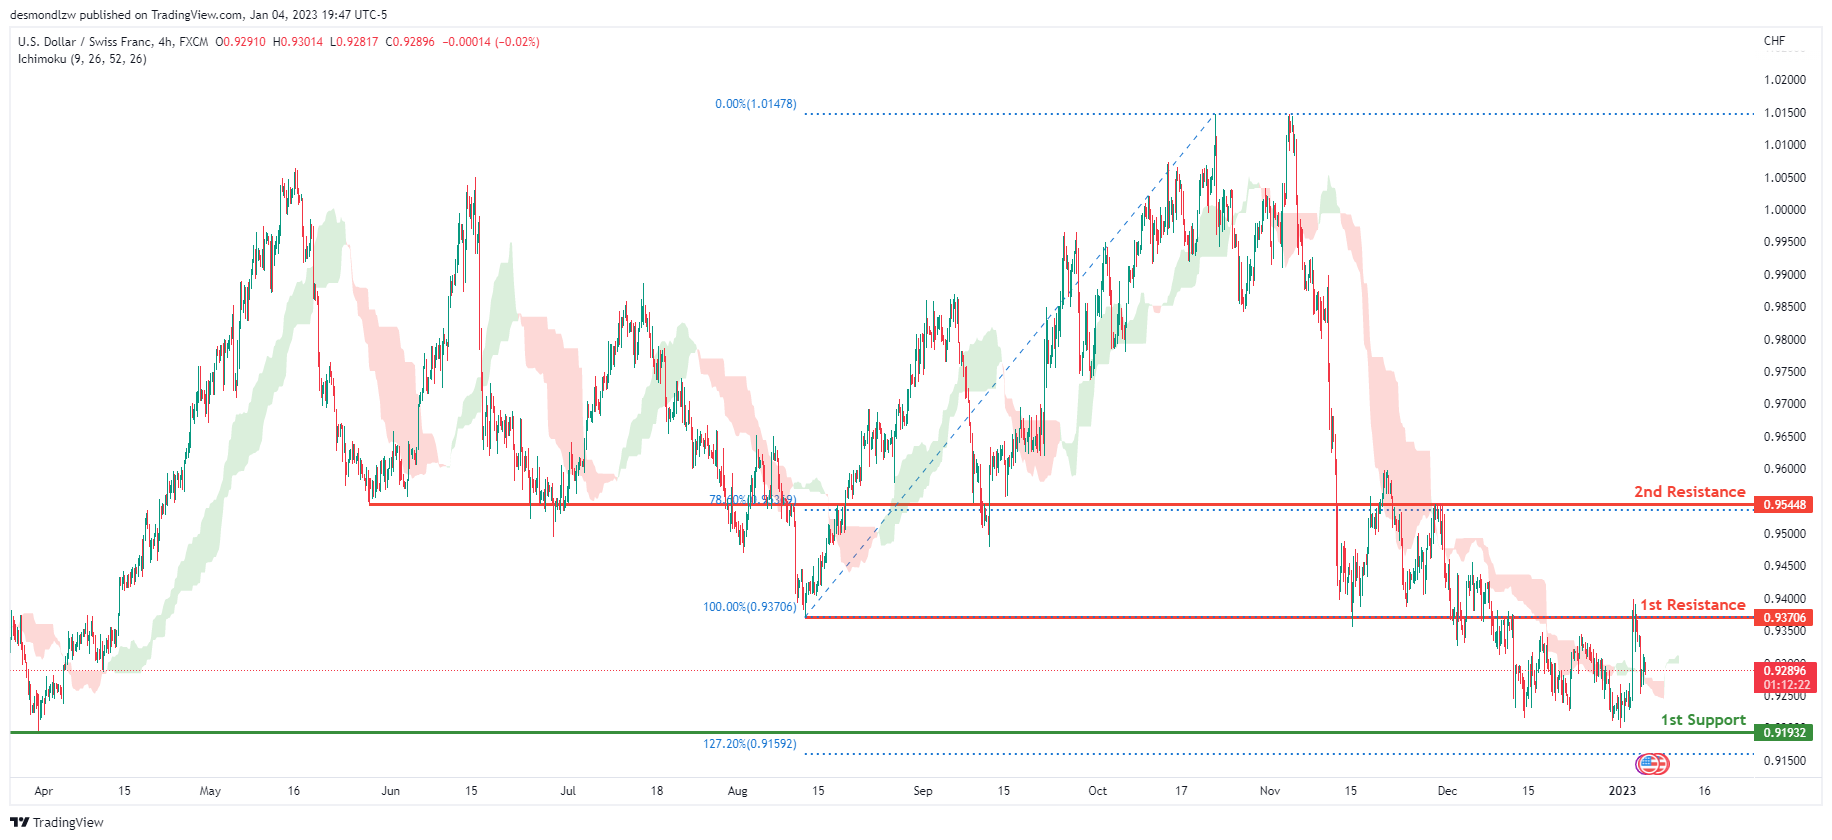
The overall bias for USDCHF on the H4 chart is bearish. In addition, the price is crossing below the Ichimoku cloud, indicating a bearish market. If the current bearish trend continues, expect the price to head back down towards the 1st support line at 0.91932, where the previous swing low and 12.72% Fibonacci extension line is . In an alternative scenario, price could possibly head up breaking the 1st resistance at 0.93706, where the previous swing low is, before heading towards the 2nd resistance at 0.95448, where the 78.6% Fibonacci line is.
Areas of consideration
- H4 1st support at 0.91932
- H4 1st resistance at 0.93706
- H4 2nd resistance at 0.95448
XAU/USD (GOLD):
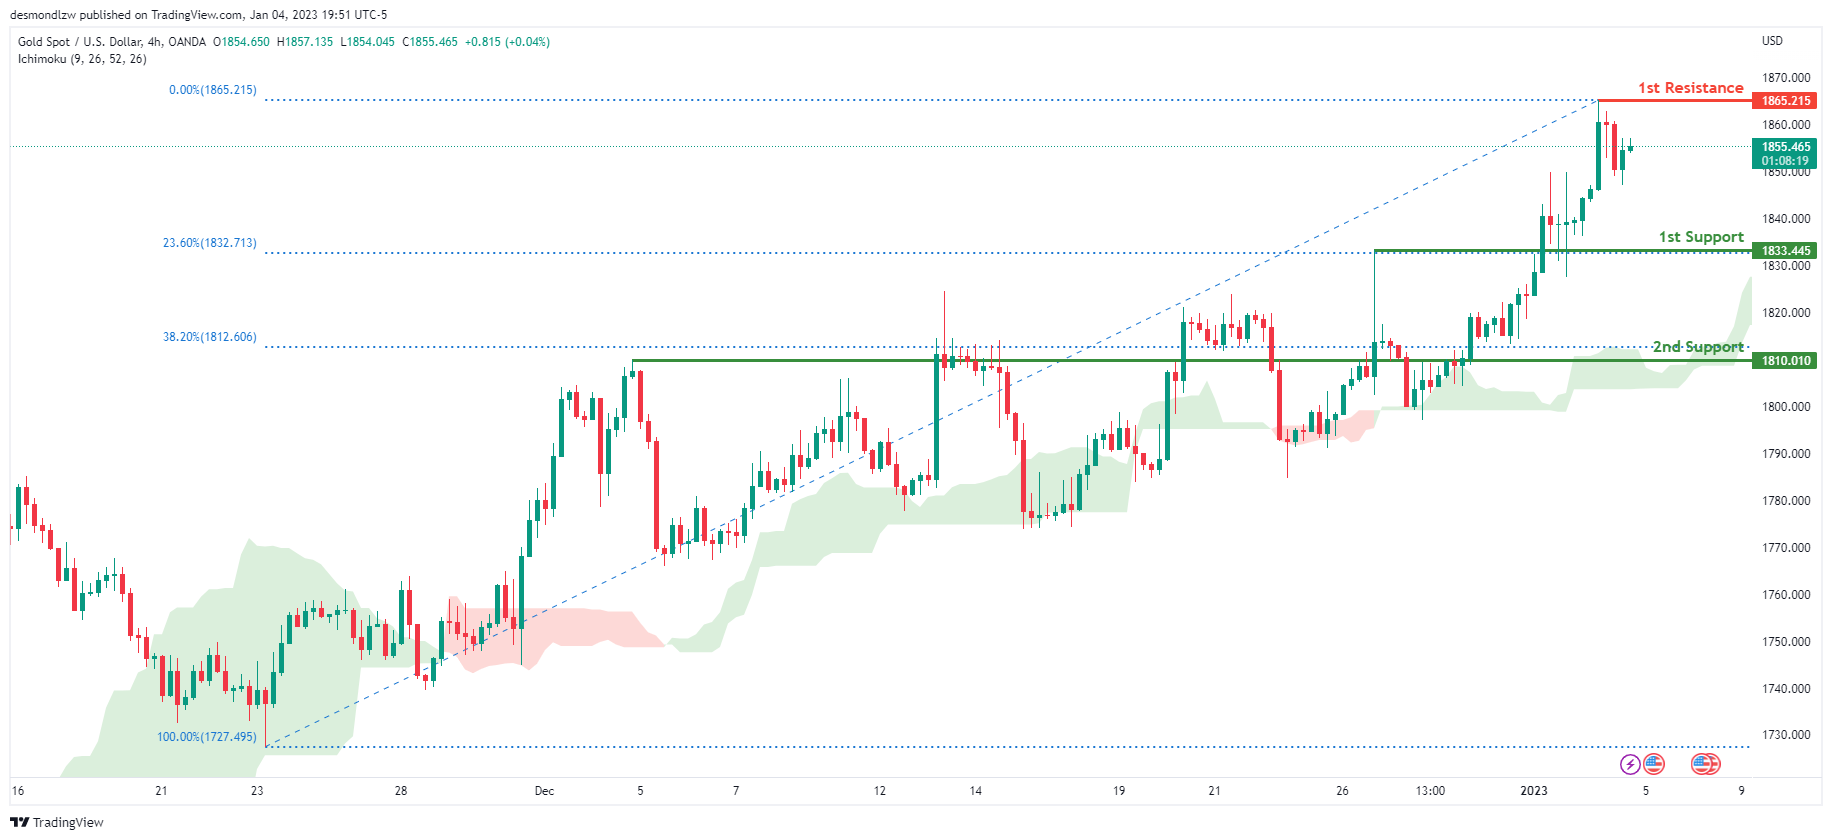
Looking at the H4 chart, my overall bias for XAUUSD is bullish due to the current price crossing above the Ichimoku cloud, indicating a bullish market. If this bullish momentum continues, expect the price to continue heading towards the 1st resistance at 1865.215 where the recent high is. In an alternative scenario, price could possibly head back down towards the 1st support at 1833.445, where the 23.62% Fibonacci line is.
Areas of consideration:
- H4 time frame, 1st resistance at 1865.215
- H4 time frame, 1st support at 1833.445
AUD/USD:
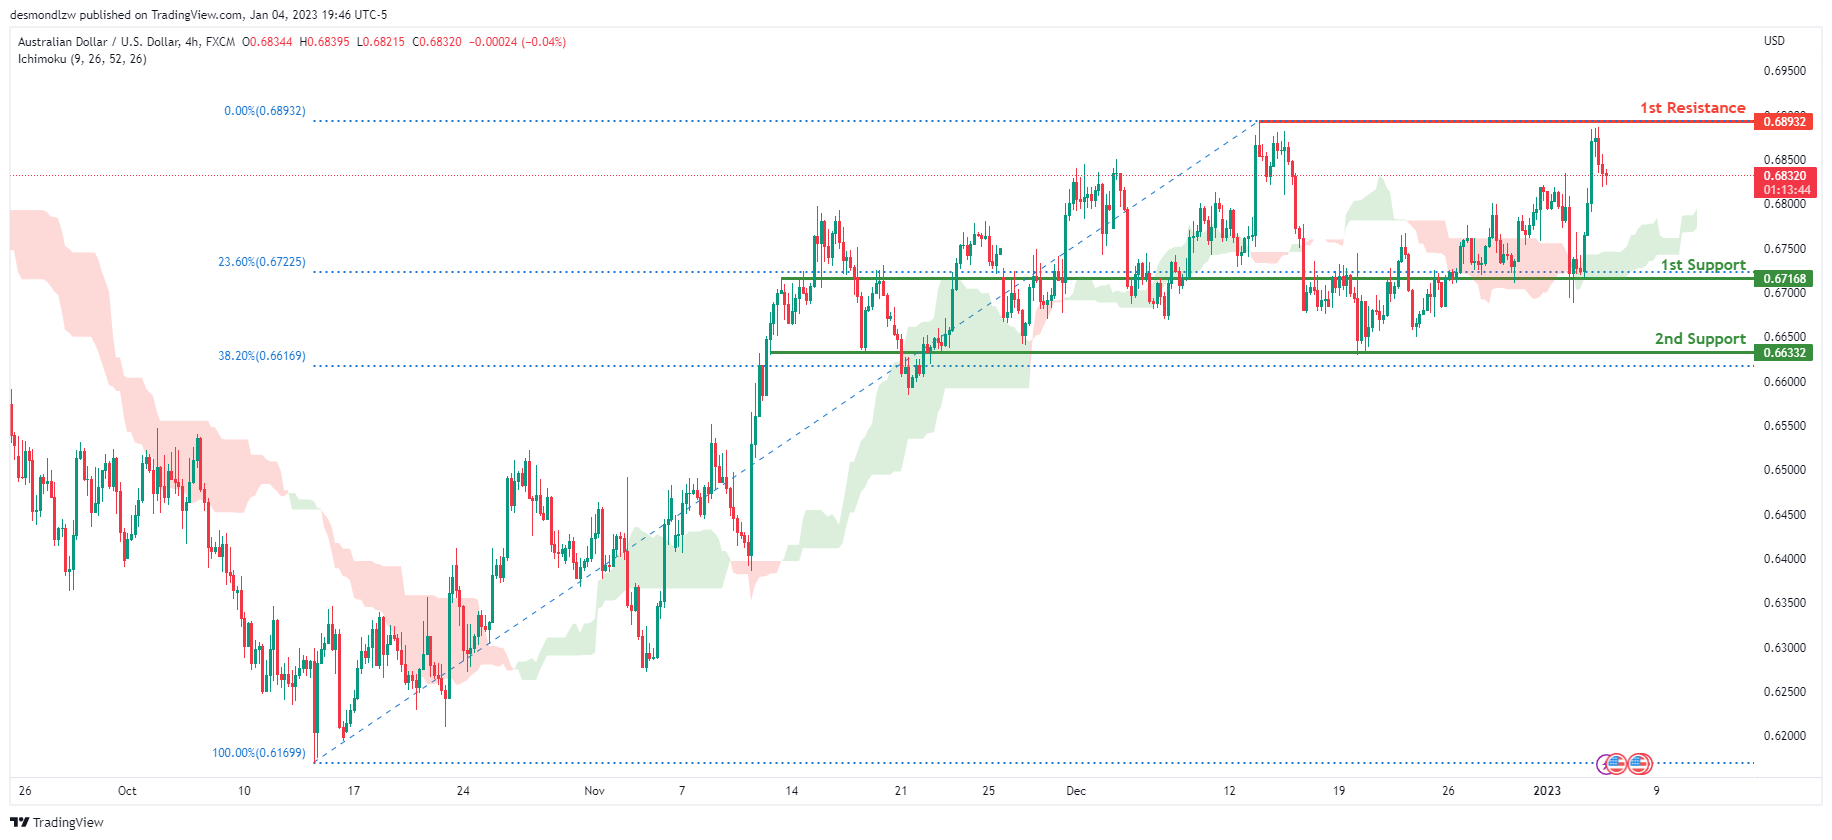
Looking at the H4 chart, my overall bias for AUDUSD is bullish due to the current price being above the Ichimoku cloud, indicating a bullish market. If this bullish momentum continues, expect the price to possibly head back up towards the 1st resistance at 0.68932, where the recent swing high is. In an alternative scenario, price could possibly head back down breaking the 1st support at 0.67168, where the 23.6% Fibonacci line is, before heading towards the 2nd support at 0.66332, where the 38.2% Fibonacci line is.
Areas of consideration
- H4, 1st resistance at 0.68932
- H4, 1st support at 0.67168
- H4, 2nd support at 0.66332
NZD/USD:
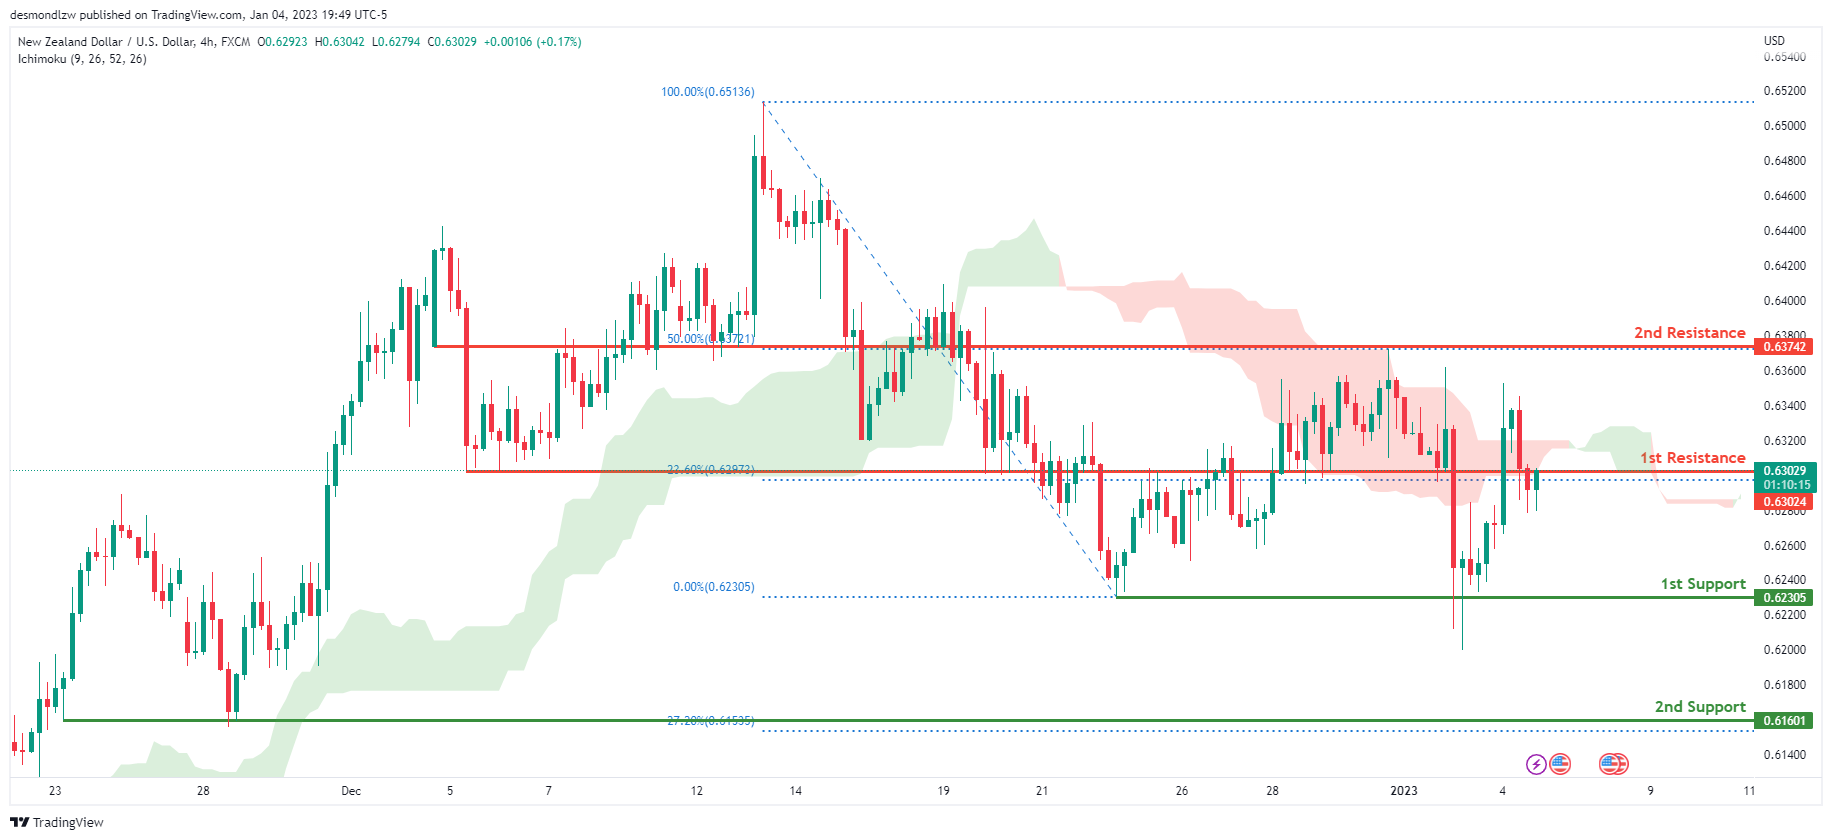
Looking at the H4 chart, my overall bias for NZDUSD is bearish due to the current price crossing below the Ichimoku cloud, indicating a bearish market. If this bearish momentum continues, expect price to possibly break the 1st support at 0.62305, where the previous swing low is, before heading towards the 2nd support at 0.61601, where the -27.2% Fibonacci line is. In an alternate scenario, price could possibly head back up breaking the 1st resistance level at 0.63024, where the 23.6% Fibonacci line is, before heading towards the 2nd resistance at 0.63742, where the 50% Fibonacci line is.
Areas of consideration:
- H4 time frame, 1st resistance at 0.63024
- H4 time frame, 2nd resistance at 0.63742
- H4 time frame, 1st support at 0.62305
- H4 time frame, 2nd support at 0.61601
USD/CAD:
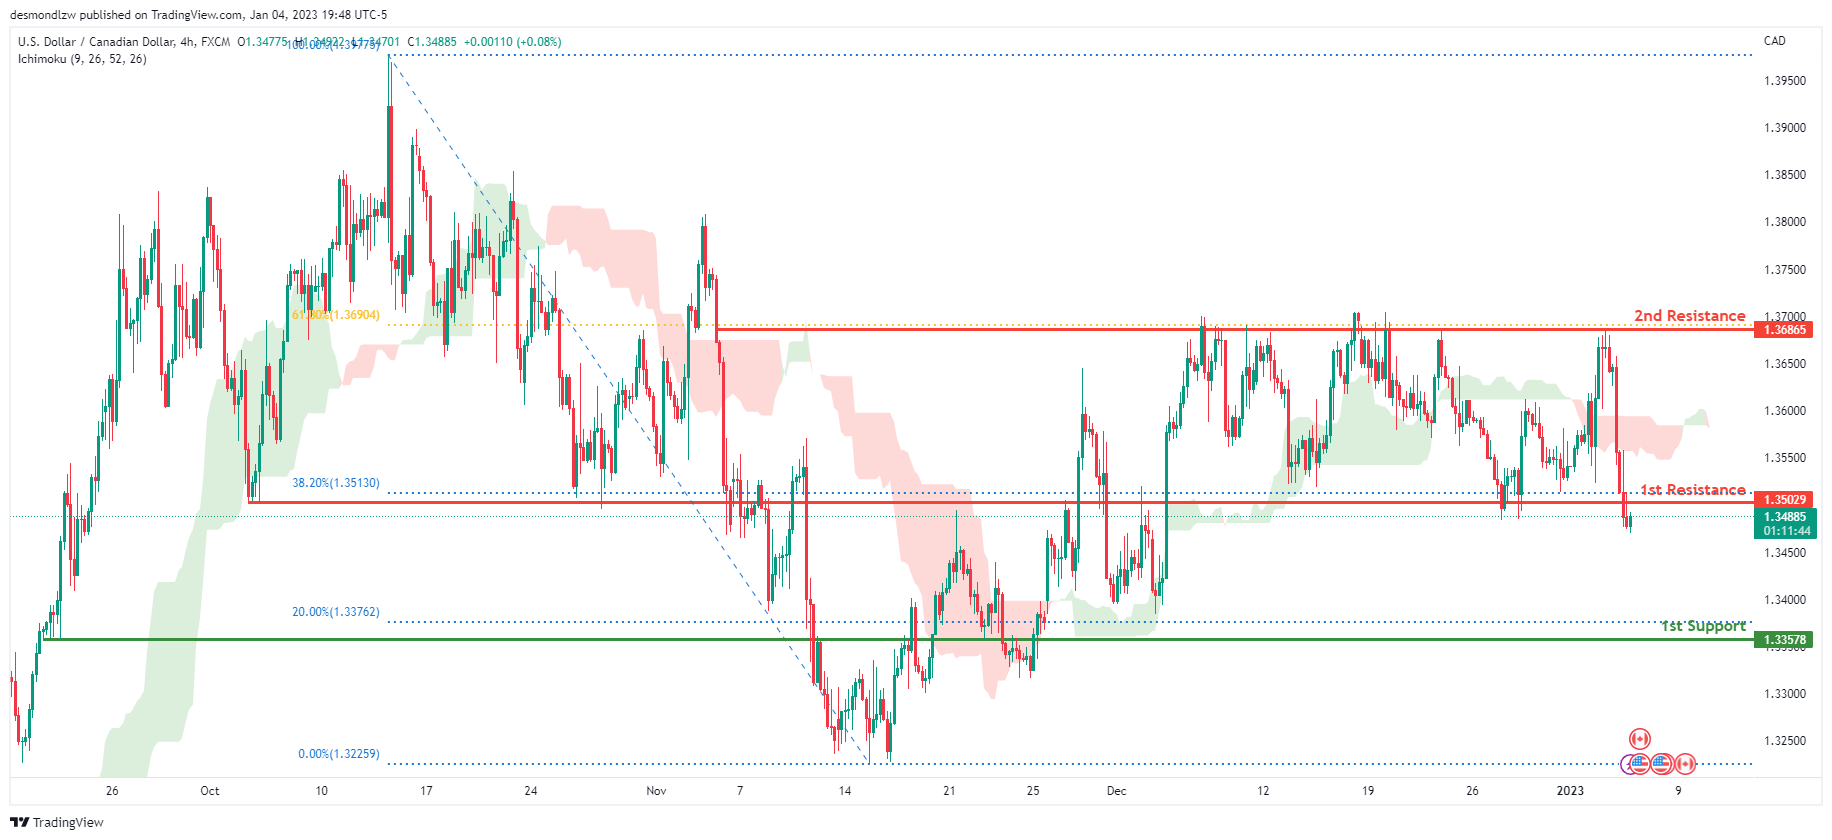
On the H4 chart, the overall bias for USDCAD is bearish . To add confluence to this, the price is under the Ichimoku cloud which indicates a bearish market. If this bearish momentum continues, expect the price to possibly head towards the 1st support at 1.33578, where the 20% Fibonacci line is. In an alternative scenario, price could head back up to break the 1st resistance at 1.35029, where the 38.2% Fibonacci line is, before heading towards the 2nd resistance at 1.36865, where the 61.8% Fibonacci line is
Areas of consideration:
- H4 time frame, 1st resistance at 1.35029
- H4 time frame, 2nd resistance at 1.36865
- H4 time frame, 1st support at 1.33578
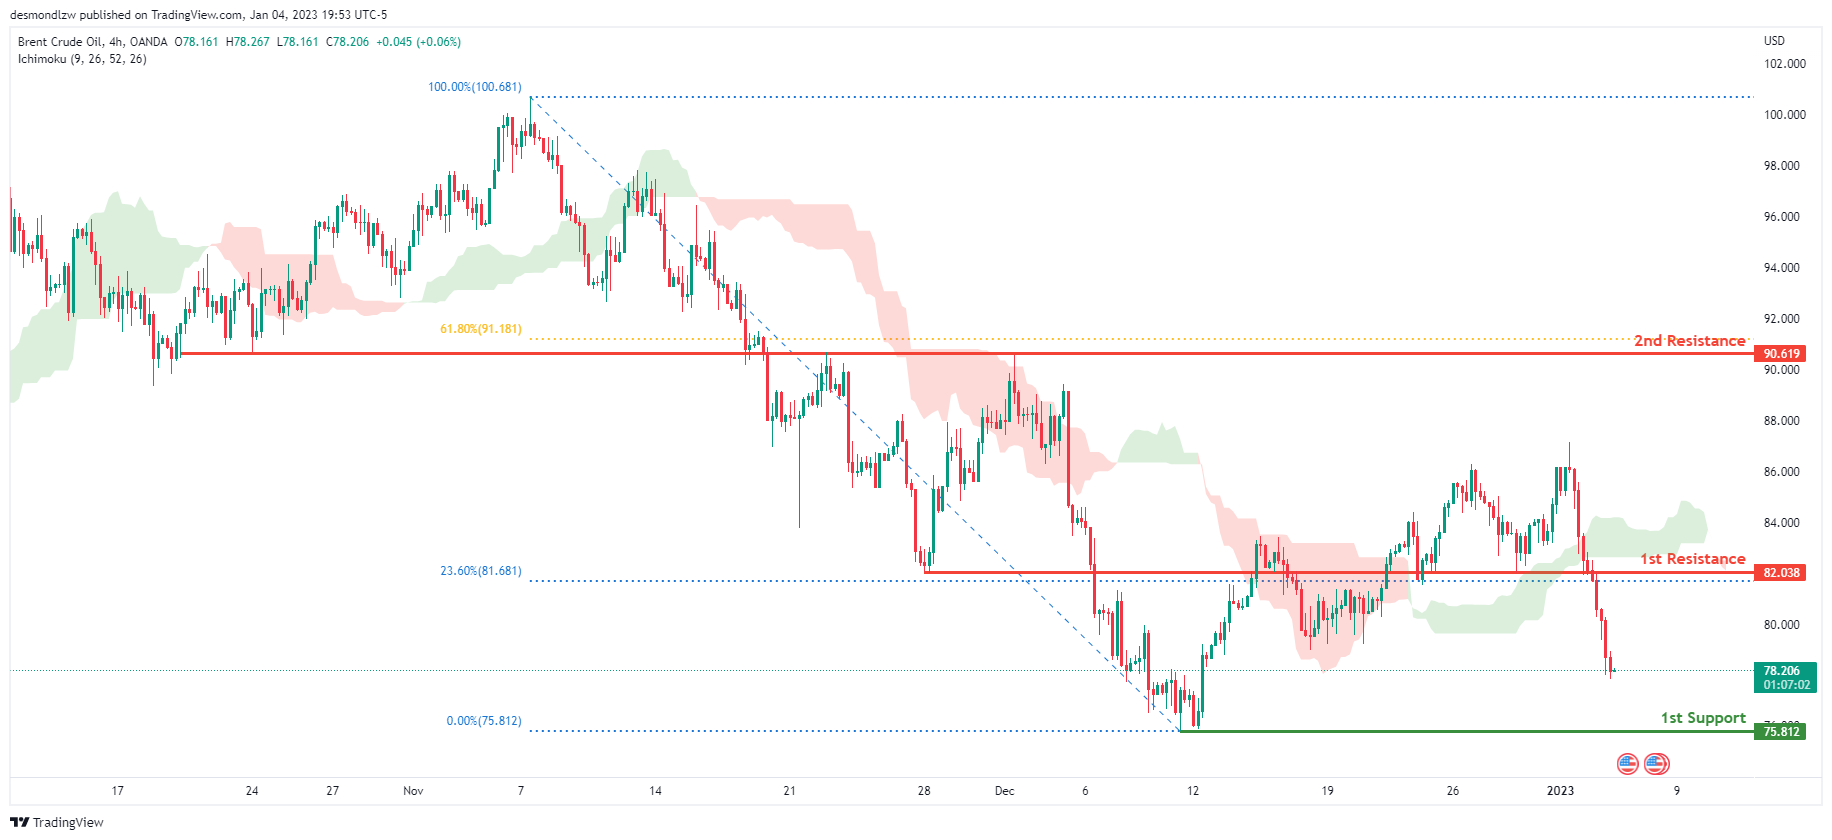
OIL:
Looking at the H4 chart, my overall bias for BCOUSD is bearish due to the current price crossing below the Ichimoku cloud, indicating a bearish market. If this bearish momentum continues, expect the price to possibly head towards the 1st support level at 75.812, where the previous swing low is. In an alternate scenario, price could possibly head back up towards the 1st resistance at 82.038, where the 23.6% Fibonacci line is
Areas of consideration:
- H4 time frame, 1st resistance at 82.038
- H4 time frame, 1st support at 75.812
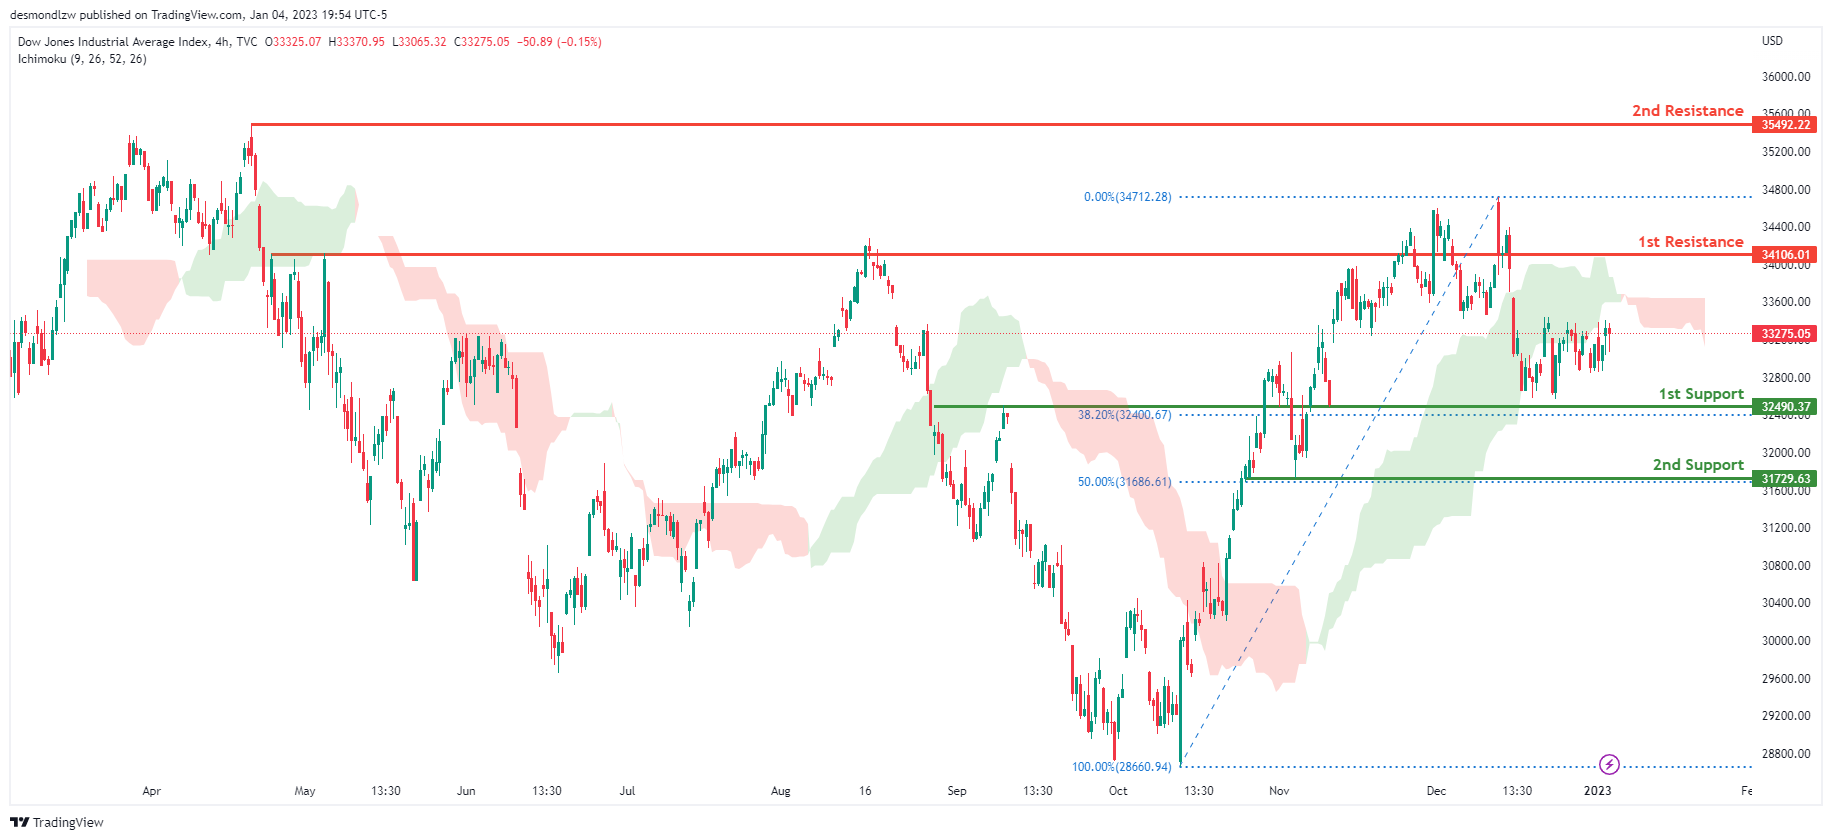
Dow Jones Industrial Average:
On the H4 chart, the overall bias for DJI is bearish. To add confluence to this, the price is below the Ichimoku cloud which indicates a bearish market. If this bearish momentum continues, expect the price to head back down towards the 1st support at 32490.37, where the 61.8% Fibonacci line is. In an alternative scenario, price could possibly break the 1st resistance line at 34106.01, where the previous swing high is before heading towards the 2nd resistance line at 35492.22, where the previous swing high is.
Areas of consideration:
- H4 time frame, 1st support at 32490.37
- H4 time frame, 1st Resistance at 34106.01
- H4 time frame, 2nd Resistance at 35492.22
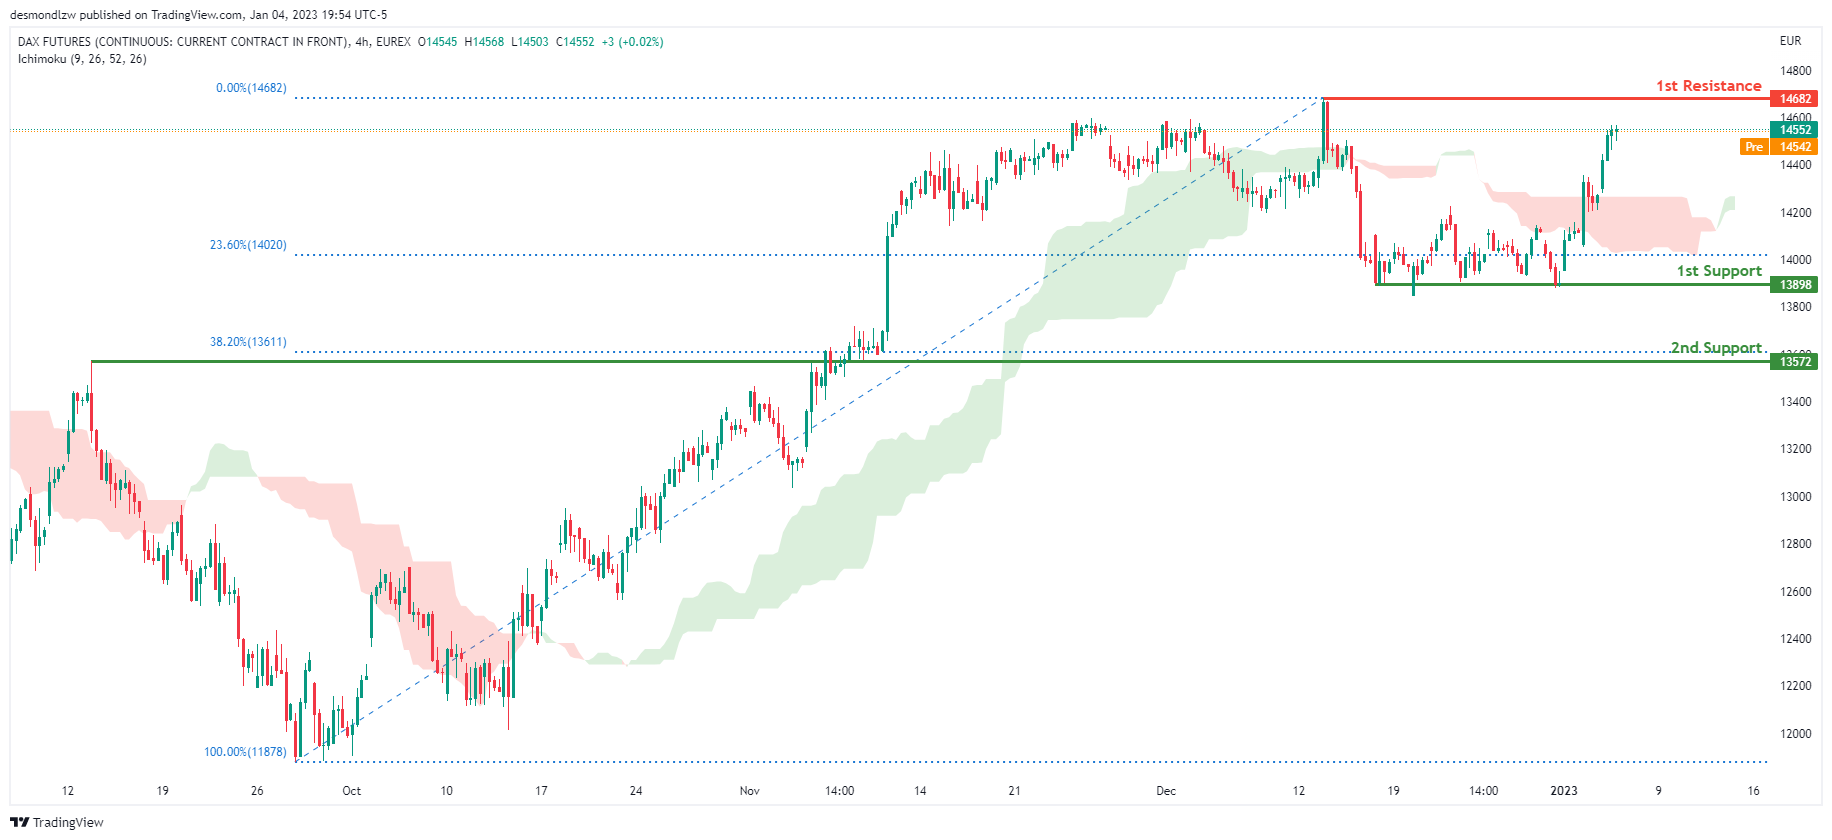
DAX:
Looking at the H4 chart, my overall bias for DAX is bullish due to the current price crossing above the Ichimoku cloud, indicating a bullish market. If this bullish momentum continues, expect the price to possibly head towards the 1st resistance line at 14682, where the previous swing high is. In an alternative scenario, price could possibly head down to retest the 1st support at 13898, where the 23.6% Fibonacci line is.
Areas of consideration:
- H4 time frame, 1st resistance is at 14682
- H4 time frame, 1st support is at 13898
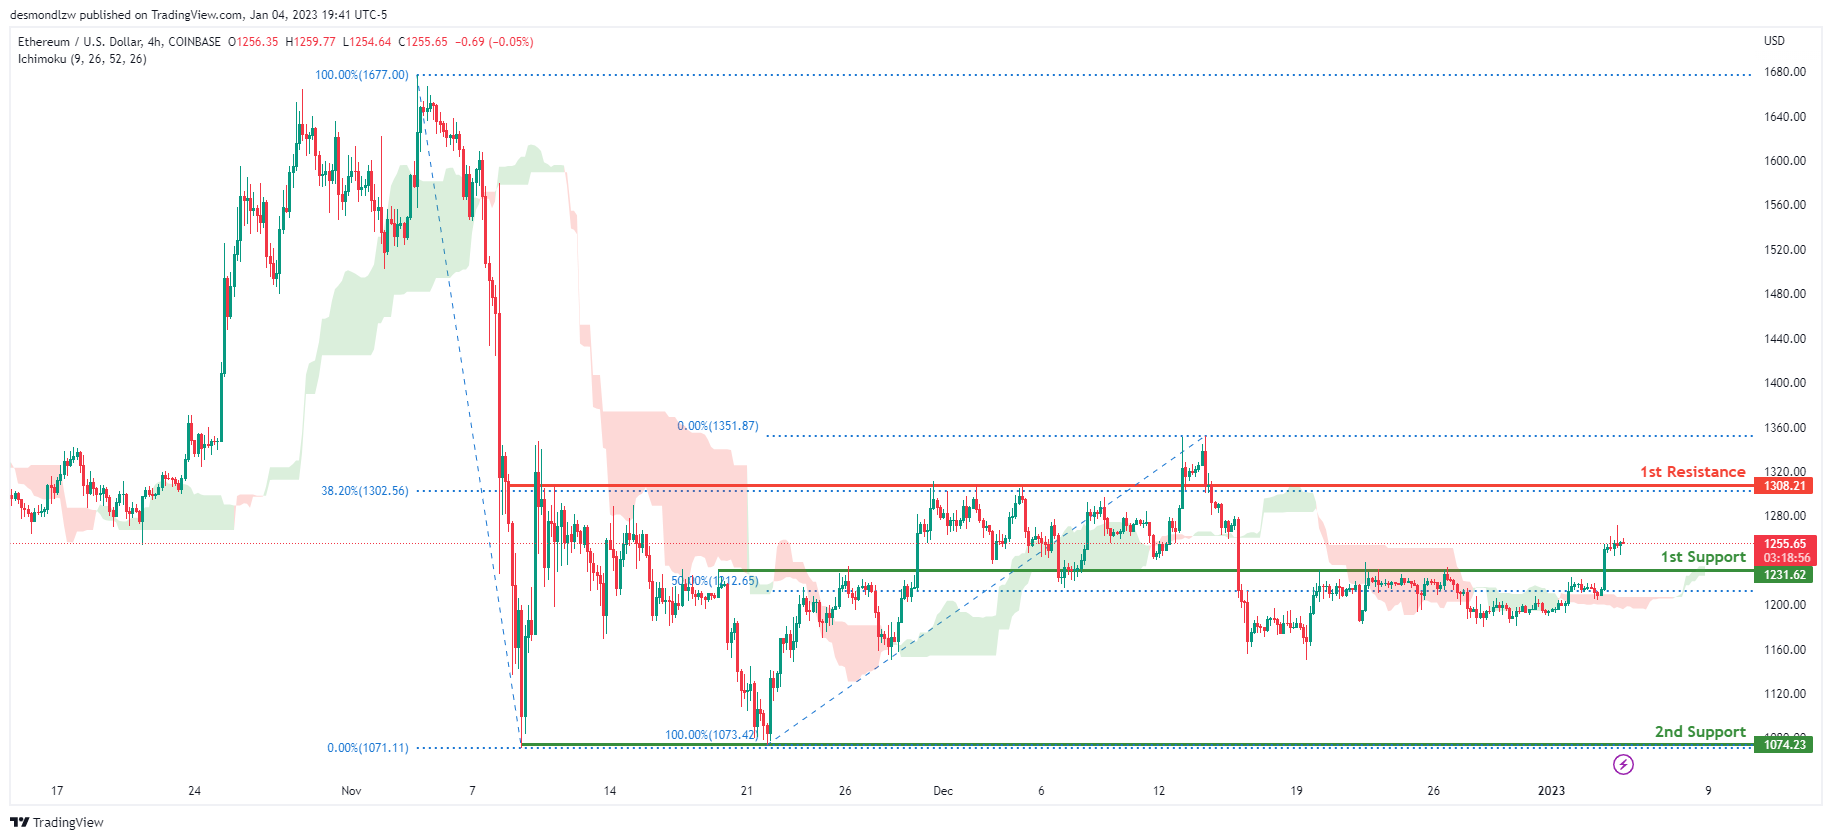
ETHUSD:
Looking at the H4 chart, my overall bias for ETHUSD is bullish due to the current price crossing above the Ichimoku cloud, indicating a bullish market. If this bullish momentum continues, expect the price to head towards the 1st resistance at 1308.21, where the 38.2% Fibonacci line is. In an alternative scenario, price could head back down towards the 1st support at 1231.62, where the 50% Fibonacci line is.
Areas of consideration:
- H4 time frame, 1st resistance of 1308.21
- H4 time frame, 1st support at 1231.62
BTCUSD:
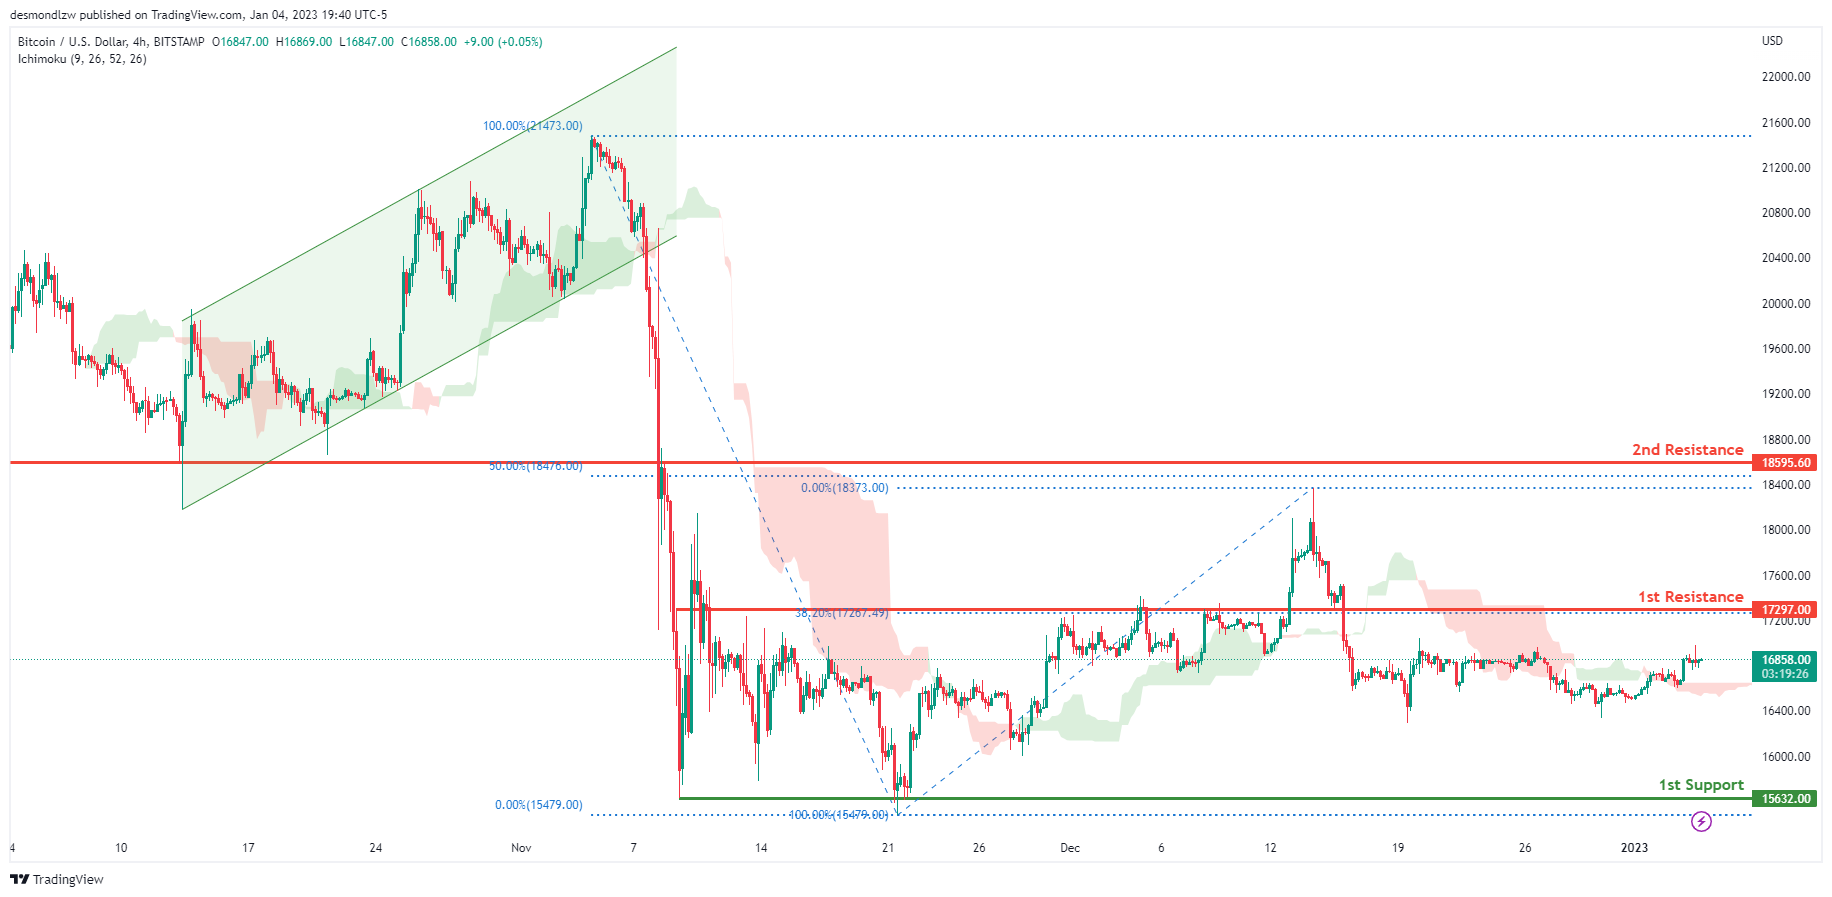
Looking at the H4 chart, my overall bias for BTCUSD is bearish due to the current price crossing below the Ichimoku cloud, indicating a bearish market. To add support to this bias, price has also broken down through the bullish ascending channel. If this bearish momentum continues, expect price to possibly continue heading towards the 1st support at 15632.00, where the previous swing low is. In an alternative scenario, price could possibly head up towards the 1st resistance at 17297.00, where the 38.2% Fibonacci line is.
Areas of consideration:
- H4 time frame, 1st resistance 17297.00
- H4 time frame, 1st support at 15632.00
S&P 500:
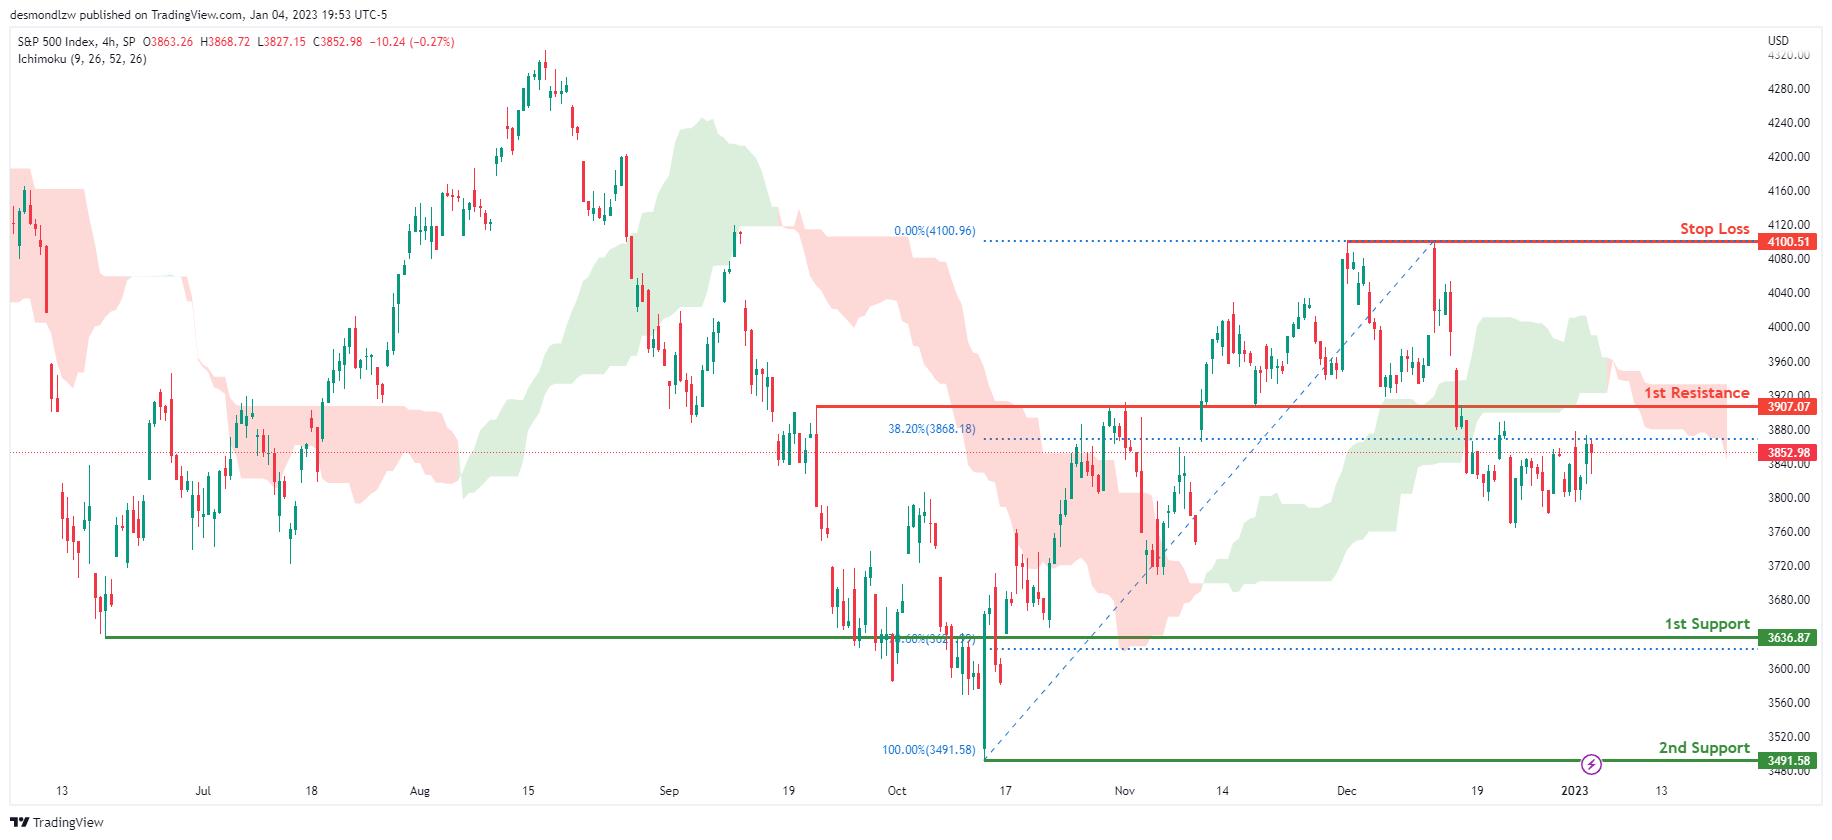
Looking at the H4 chart, my overall bias for S&P500 is bearish due to the current price being below the Ichimoku cloud, indicating a bearish market. If this bearish momentum continues, expect the price to continue heading towards the 1st support at 3636.87, where the 78.6% Fibonacci line is. In an alternative scenario, price could possibly head back up to retest the 1st resistance at 3907.07, where the 38.2% Fibonacci line is.
Areas of consideration:
- H4 time frame, 1st support at 3636.87
- H4 time frame, 1st resistance at 3907.07
China Caixin PMI composite improved to 48.3, continuing contraction
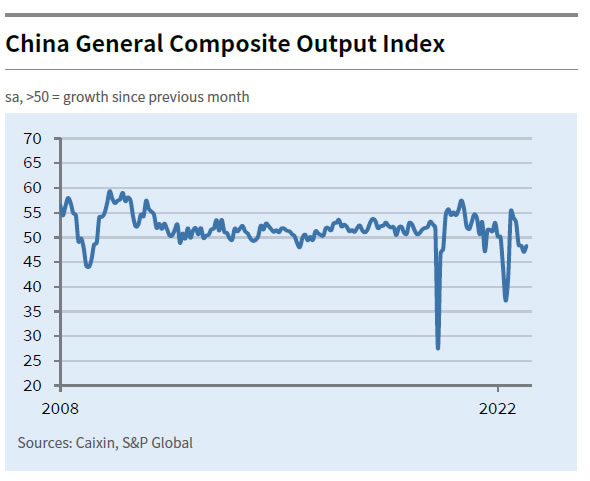
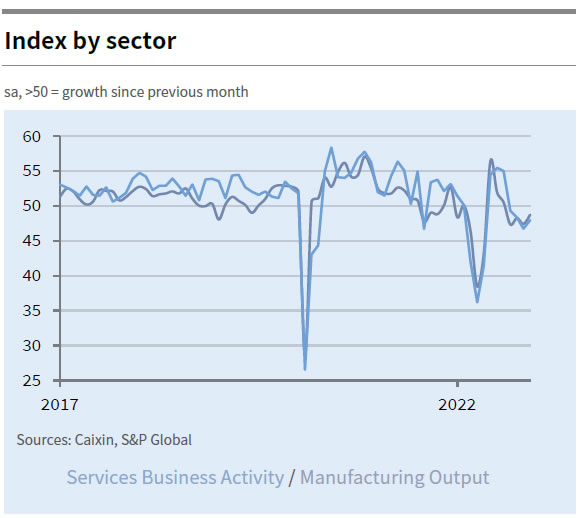
China Caixin PMI Services rose from 46.7 to 48.0 in December, above expectation of 47.5. PMI Composite rose from 47.0 to 48.3, pointing to contraction in business activity for the fourth straight month.
Wang Zhe, Senior Economist at Caixin Insight Group said: "Both manufacturing and services sectors' supply and demand contracted due to the pandemic, with manufacturing demand taking a harder hit than in November. Overseas demand was weak, employment remained sluggish, but inflationary pressure was modest, and optimism among businesses significantly improved.
"Covid outbreaks rapidly spread across China in November, causing a number of macroeconomic indicators to fall sharply. On Dec. 7, China announced 10 new measures to further optimize Covid containment. In the short term, infections are expected to explode, which will disrupt production and everyday life. How to effectively coordinate Covid controls with economic and social development has once again become a crucial question."
FOMC Minutes: Anticipate ongoing rate hikes appropriate
In the minutes of the December FOMC meeting, the participants agreed that inflation was "unacceptably high". They "concurred" that inflation data showed "welcome reductions in the monthly pace of price increases", but "stressed that it would take substantially more evidence of progress to be confident that inflation was on a sustained downward path."
Also, participants noted that risk to inflation outlook remained "tilted to the upside", with possibility of "more persistent than anticipate" price pressures. Meanwhile, risks to economic activity outlook were "weighted to the downside".
Participants continued to anticipate that "ongoing increases in the target range for the federal funds rate would be appropriate". "No participant" anticipated that it's appropriate to start lowering rates in 2023. They generally observed that a "restrictive policy stance would need to be maintained" for some time. Also, "several participants commented that historical experience cautioned against prematurely loosening monetary policy."