Sample Category Title
BTCUSD Fails to Break Above 200-SMA
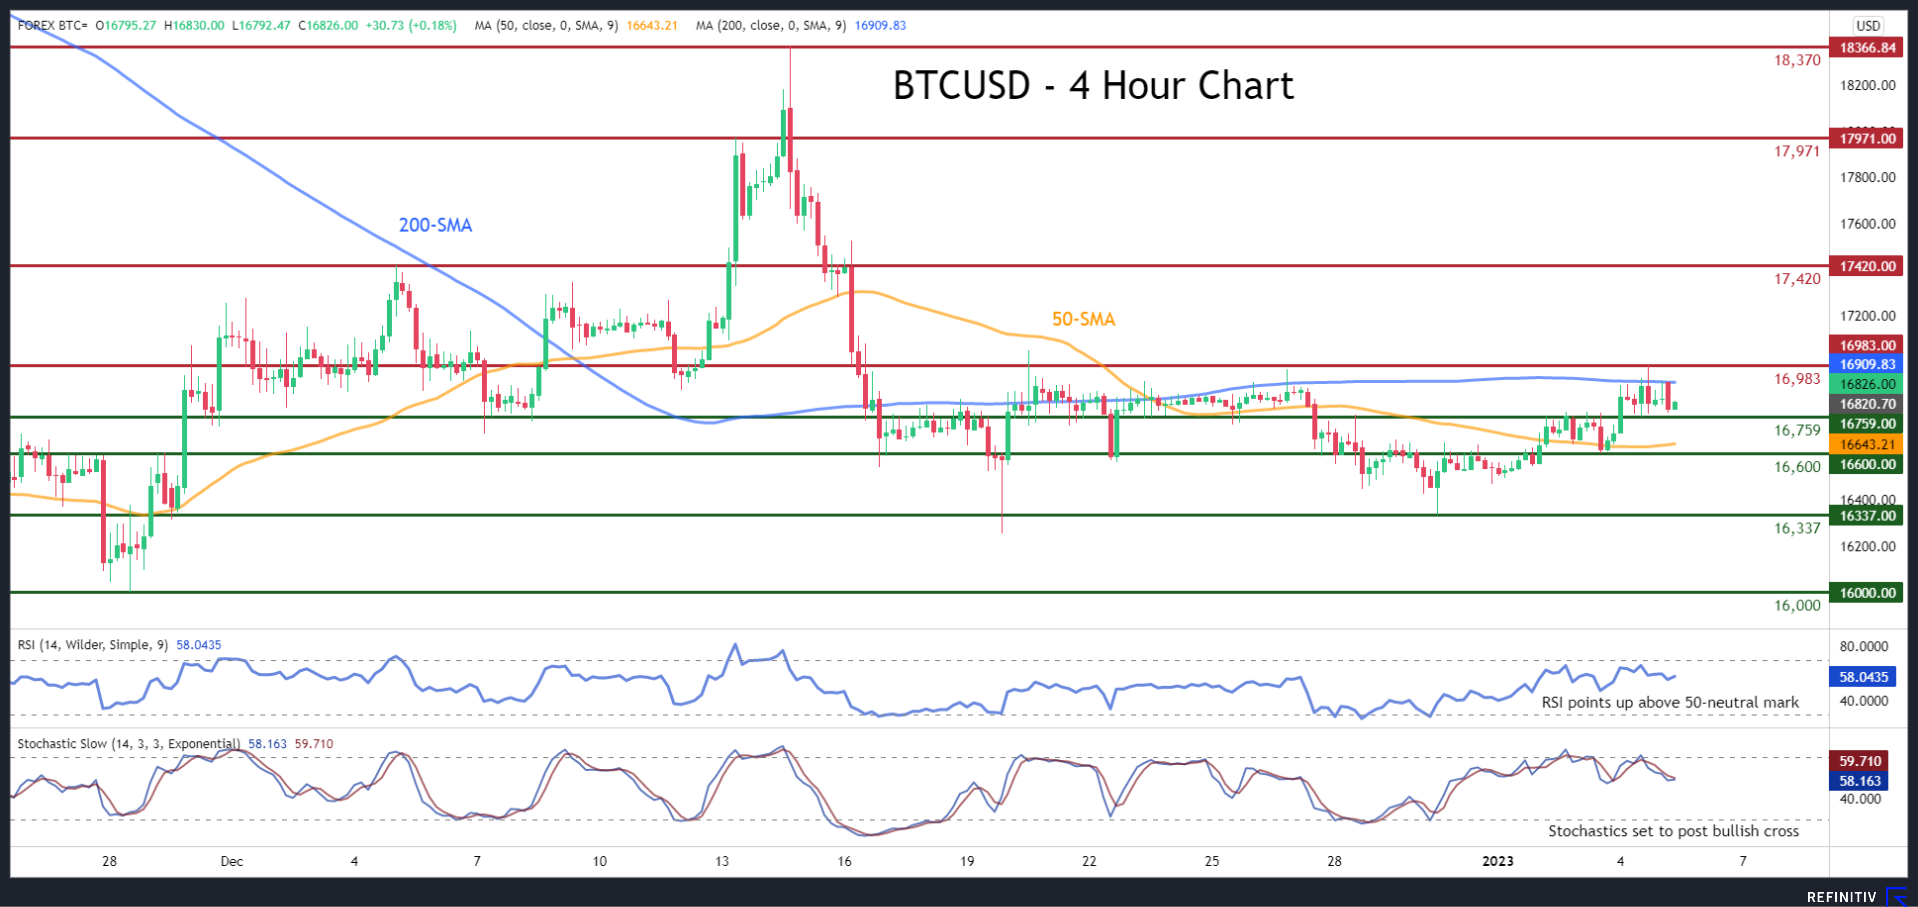
BTCUSD has been experiencing a prolonged period of consolidation in the four-hour chart, with the price failing to escape its narrow range. Since the beginning of 2023, the cryptocurrency has been attempting a rebound, but its advance has been repeatedly held down by the 200-period simple moving average (SMA).
The momentum indicators currently suggest that near term risks are tilted to the upside. Specifically, the RSI is pointing upwards above its 50-neutral mark, while the stochastic oscillator is set to post a bullish cross.
Should bullish forces prevail and push the price above its 200-period SMA, the recent resistance of 16,983 could prove to be the first obstacle. Conquering this barricade, the price could challenge the December resistance of 17,420 before the 17,971 zone comes under examination. Failing to halt there, further advances could turn the spotlight to the December high of 18,370.
On the flipside, bearish actions could encounter initial support at the 16,759 barrier. Violating that zone, the price could descend to challenge the 16,600 support region. A break below that region may then open the door for the December 2022 low of 16,252.
Overall, BTCUSD appears unable to exit its sideways pattern as the 200-period SMA continues to act as a strong ceiling. Hence, a break above that hurdle could lead to some upside for the king of cryptocurrencies.
US ADP jobs rose 245k, strong labor market but fragmented
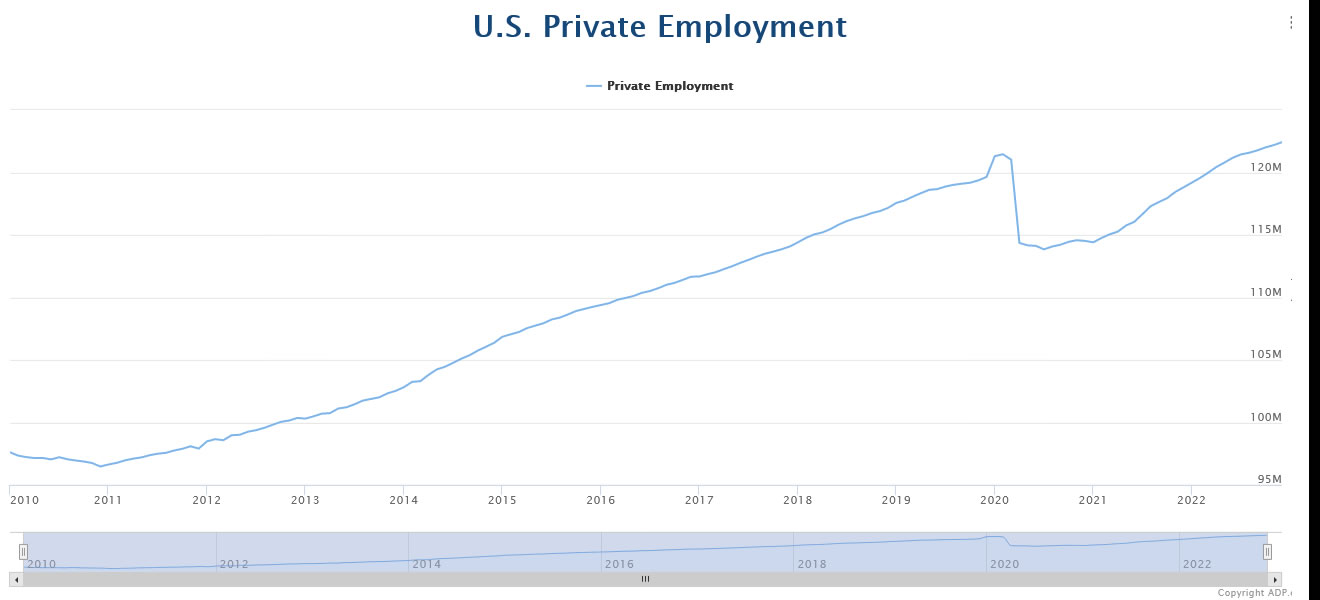
US ADP private employment grew 245k in December, well above expectation of 145k. By sector, goods-producing jobs rose 22k while service-providing jobs rose 213k. By establishment size, small companies added 195k jobs and medium companies added 191k. But large companies cut -151k jobs. Annual pay for job-stays were up 7.3% yoy,
Nela Richardson Chief Economist, ADP, said: "The labor market is strong but fragmented, with hiring varying sharply by industry and establishment size. Business segments that hired aggressively in the first half of 2022 have slowed hiring and in some cases cut jobs in the last month of the year."
AUD/USD: Bulls Remain in Play But Face Headwinds from 200DMA
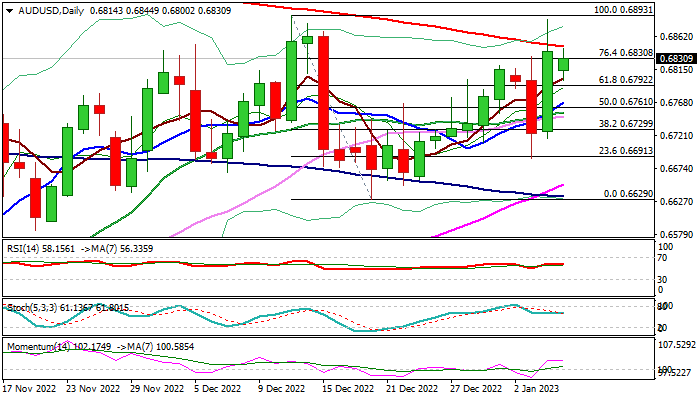
The Australian dollar is keeping traction after Wednesday’s 1.7% advance (the biggest one-day rally since Nov 10) sparked by the news that China would resume coal imports from Australia.
Strong rally on Wednesday came just ticks from Dec 13 three-month peak (0.6893) but bulls failed to sustain break above falling 200DMA (0.6847), which so far provides strong headwinds.
Technical studies on daily chart are overall bullish and support the action, along with Wednesday’s bullish engulfing pattern, but close above 200DMA is required to confirm bullish structure.
Bulls also need to clear pivotal barriers at 0.6871/93 (Fibo 38.2% of 0.8071/0.6170 / Dec 13 high) to signal continuation of recovery rally from 0.6170 (2022 low, posted on Oct 13).
Caution on repeated failure at 200DMA which would keep an action on hold, though bulls are expected to remain in play while above rising 10DMA (0.6768).
Res: 0.6847; 0.6871; 0.6893; 0.6956.
Sup: 0.6800; 0.6768; 0.6747; 0.6716.
EUR/USD: Near-Term Structure Remains Bullishly Aligned But Needs More Signals for confirmation
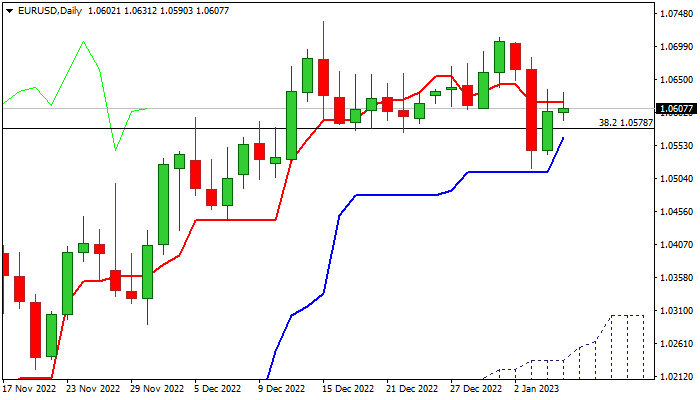
The Euro remains constructive, although moving within a narrow range on Thursday, following previous day’s 0.55% bounce.
The action is still struggling to clearly break above daily Tenkan-sen (1.0616), which is needed to firm near-term structure and open way for further recovery from 1.0519 (Jan 3 low).
Momentum indicator broke into positive territory, though other indicators are still in mixed mode and lack clearer signal.
Broken Fibo resistance at 1.0587 (38.2% of 1.2266/0.9535) reverted to support and should hold to keep fresh bulls in play, while dip and close below daily Kijun-sen (1.0564) would soften near-term tone and signal recovery stall.
Res: 1.0616; 1.0635; 1.0683; 1.0713.
Sup: 1.0590; 1.0578; 1.0564; 1.0519.
AUD/USD Steadies after Banner Day
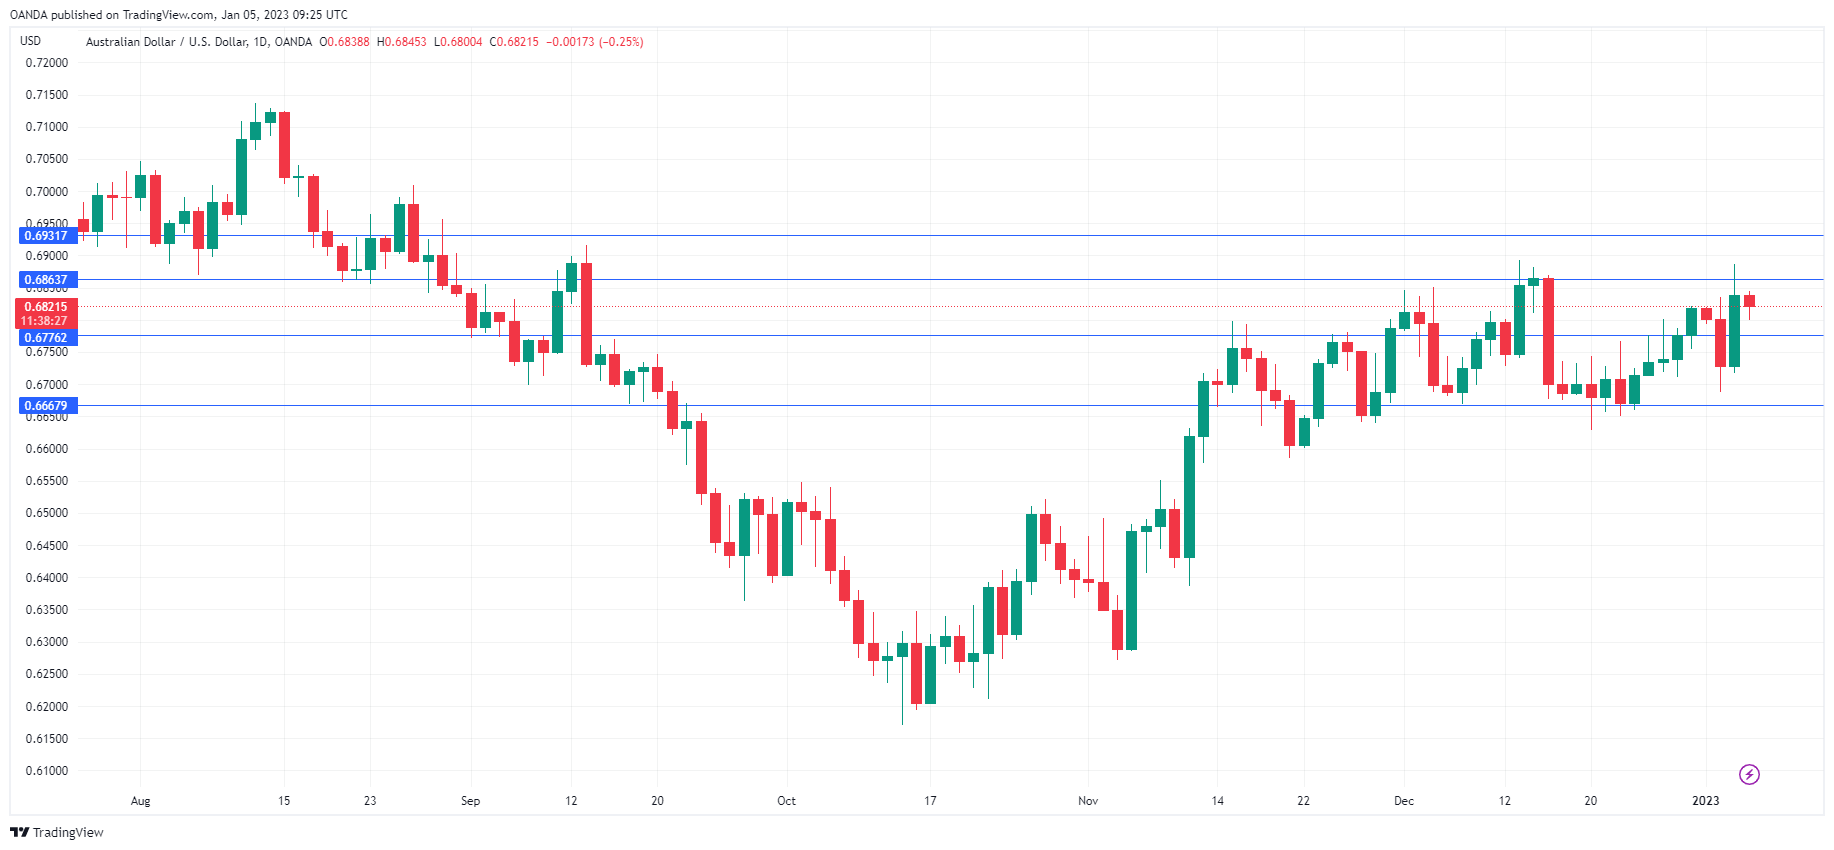
The Australian dollar has posted limited losses on Thursday. In the European session, AUD/USD is trading at 0.6822, down 0.17%.
Australian dollar soars as China mulls coal imports
The Australian dollar rocketed higher on Wednesday, rising 1.6% and hitting a 3-week high. This followed reports that China was considering easing its ban on imports of Australian coal. The ban has been in place since 2020, but relations between Australia and China have improved since the new Australian government took office. The move would bolster the Australian economy, although the Australian government was surprisingly low-key, saying that the coal industry had found alternative markets.
China is Australia’s number one trading partner, which means that developments in China have a significant impact on Australia and the direction of the Australian dollar. The sharp U-turn in China’s covid policy, from zero-covid to easing restrictions should give a boost to the Chinese economy in the long term. However, we can expect China’s economy to slow down and even contract in the first quarter, due to the surge in Covid cases which is dampening demand for services and also lowering production as many workers report in sick. This could pose a major headwind for the Australian dollar early in 2023.
The Federal Reserve minutes reflected the hawkish message that Jerome Powell had for the markets at the December meeting. FOMC members committed to maintaining a restrictive policy while inflation remained unacceptably high, saying that more evidence was needed to show that inflation was on a “sustained downward path to 2 per cent”. The minutes noted that several members warned against “prematurely loosening monetary policy”.
Despite the Fed’s hawkish stance, there is still a dissonance between the Fed’s message and market pricing. The minutes noted that no FOMC members expect any rate cuts this year, while the markets have priced in a possible small reduction by the end of 2023 and have forecast a funds rate peak at 4.5%-4.75%. The Fed, on the other hand, expects rates to hit 5% or higher. Minneapolis Fed President Kashkari said on Wednesday that rates could rise to 5.4% or even higher if inflation doesn’t head lower.
AUD/USD Technical
- AUD/USD has support at 0.6703 and 0.6620
- There is resistance at 0.6841 and 0.6969
GBP/USD: Extended Sideways Mode Looks for Fresh Direction Signals
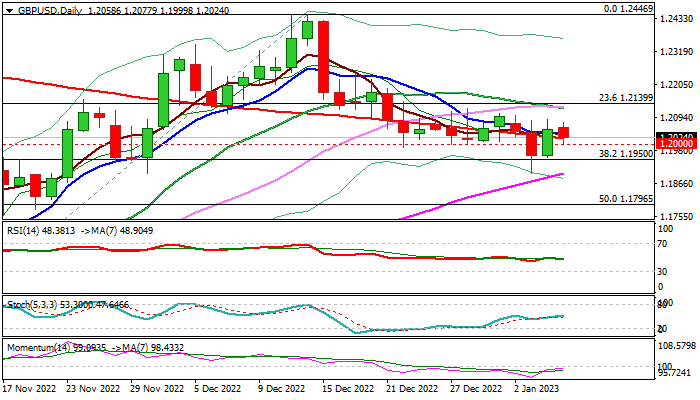
Cable remains in extended sideways mode and moving around 200DMA (1.2023), with psychological 1.20 support still offering solid support and holding the action for the third consecutive week.
Technical studies are mixed on daily chart, as momentum remains in negative territory, while stochastic is heading north and moving averages are in neutral setup.
The action is supported by rising thick daily cloud but continues to lack momentum for eventual break higher.
Weaker than expected UK services PMI added to softer near-term tone, though more signals is required to define near-term direction.
Traders focus on today’s US ADP US private sector labor data, Friday’s release of US Dec non-farm payrolls and Eurozone inflation report, which would provide fresh signals.
Pivotal supports lay at 1.20 / 1.1950 (psychological / Fibo 38.2% of 1.1146/1.2442 rally) and break here would weaken near-term structure and risk test of daily cloud top (1.1886).
Range top (1.2087) marks initial barrier, followed by a first trigger at 1.2109 (Fibo 38.2% of 1.2446/1.1900 bear-leg) , break of which would expose upper pivot at 1.2174 (daily Kijun-sen / 50% retracement).
Res: 1.2087; 1.2109; 1.2147; 1.2174.
Sup: 1.2000; 1.1950; 1.1902; 1.1886.
GBPJPY Rises from 3-month Low But Still Negative
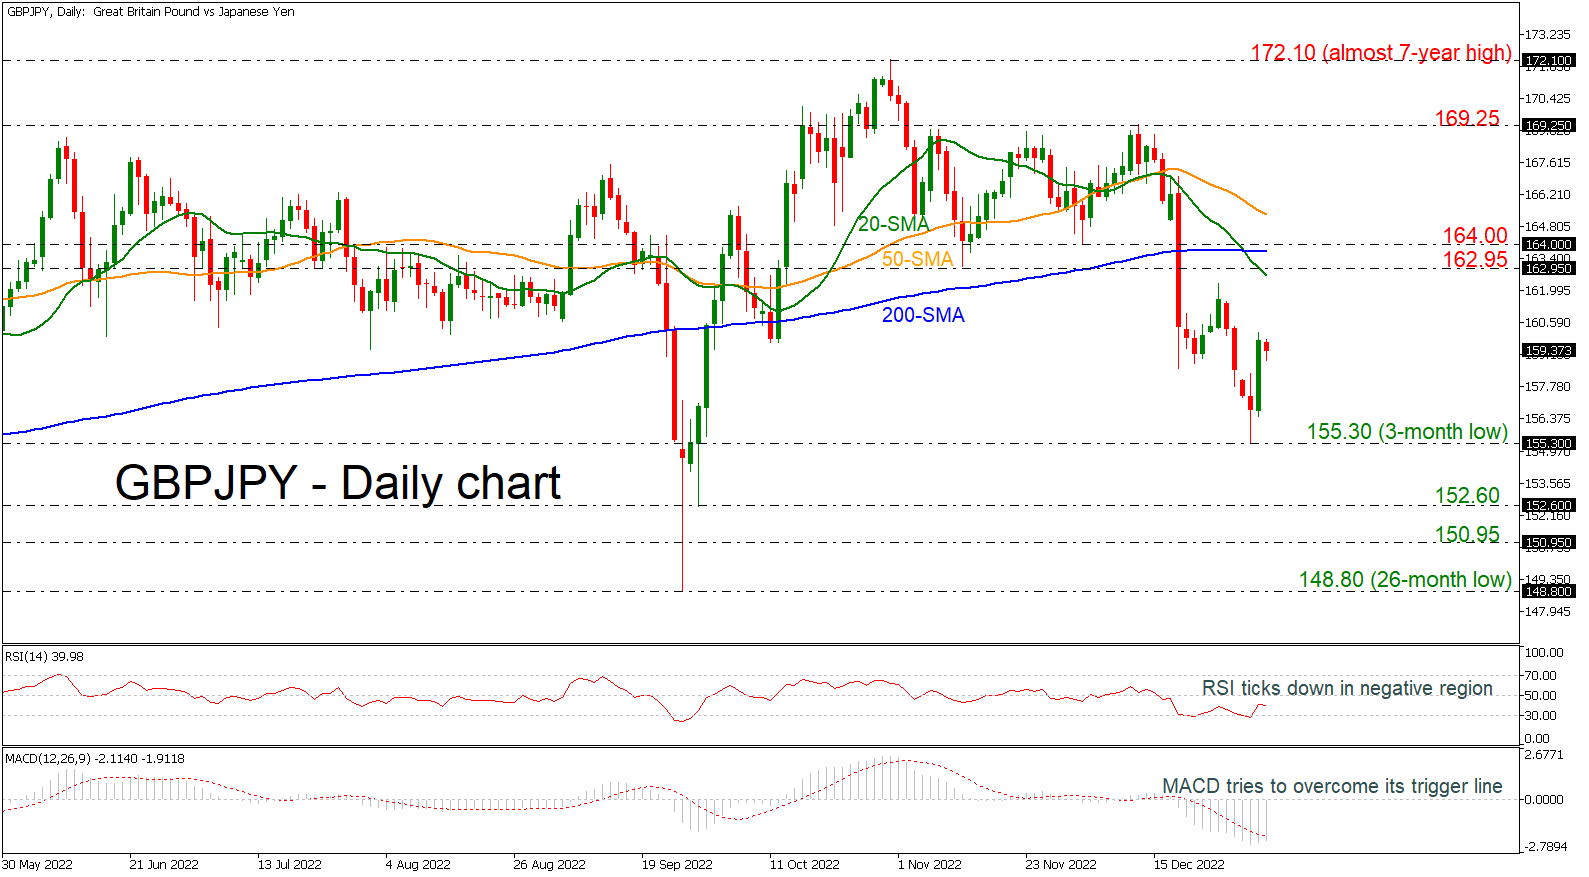
GBPJPY edged higher from the 155.30 support level but remains well below the bearish crossover within the 20- and the 200-day simple moving averages (SMAs). In the short term, the pair is bearish after the selling interest that started from the almost seven-year high of 172.10.
Technically, the RSI indicator is falling beneath the neutral threshold of 50; however, the MACD is trying to overcome its trigger line in the bearish region.
Should the price retreat, the 155.30 level, which the bears were unable to break this week, could provide immediate support. Moving lower, the focus will shift to the 152.60 barrier, while lower still, a violation of the 150.95 mark would increase speculation that the bearish phase is in progress.
In the alternative scenario, traders would eagerly be looking for a break above the 20-day SMA at 162.95 to increase buying orders. If that’s the case, the rally could last until the 200-day SMA near 164.00 ahead of the 50-day SMA at 165.33. If bullish forces appear even stronger, 169.25 should be another resistance to keep in mind.
Overall, GBPJPY is still in negative territory and only moves above the 200-day SMA and the 169.25 resistance may switch the outlook to positive.
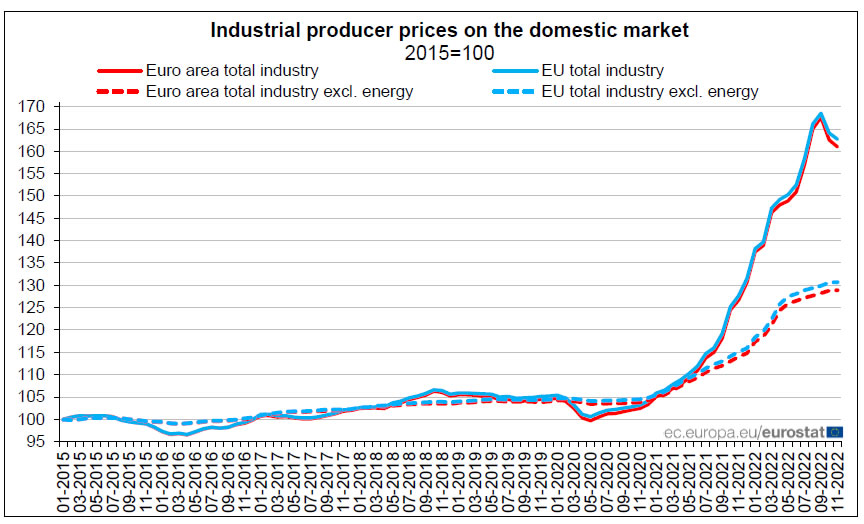
Eurozone PPI at -0.9% mom, 27.1% yoy in Nov
Eurozone PPI came in at -0.9% mom, 27.1% yoy in November, versus expectation of -0.8% mom, 28.2% yoy. For the month, industrial producer prices decreased by -2.2% mom in the energy sector and by -0.4% mom for intermediate goods, while prices increased by 0.2% mom for durable consumer goods, by 0.3% mom for capital goods and by 0.6% mom for non-durable consumer goods. Prices in total industry excluding energy increased by 0.1% mom.
EU PPI was at -0.9% mom, 27.4% yoy. The largest monthly decreases in industrial producer prices were recorded in Bulgaria (-12.6%), Slovakia (-11.6%) and Greece (-6.0%), while the highest increases were observed in Italy (+3.3%), Sweden (+2.7%) and Ireland (+2.4%).
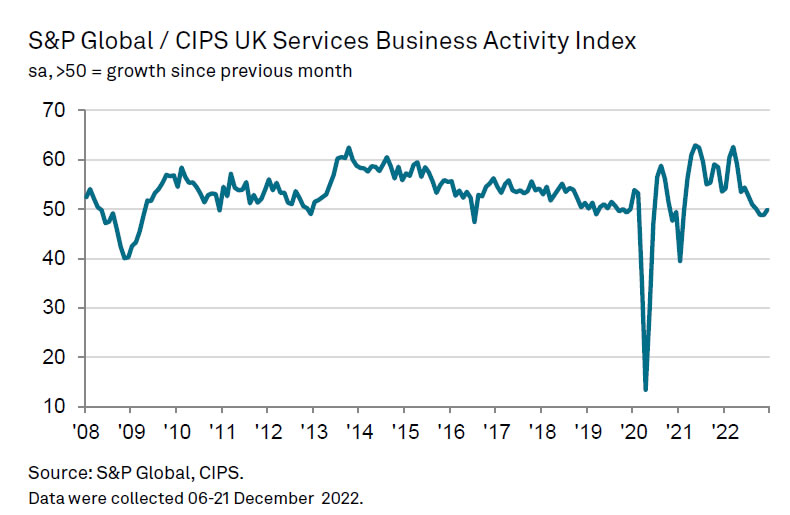
UK PMI services finalized at 49.9 in Dec, fractional fall in activity
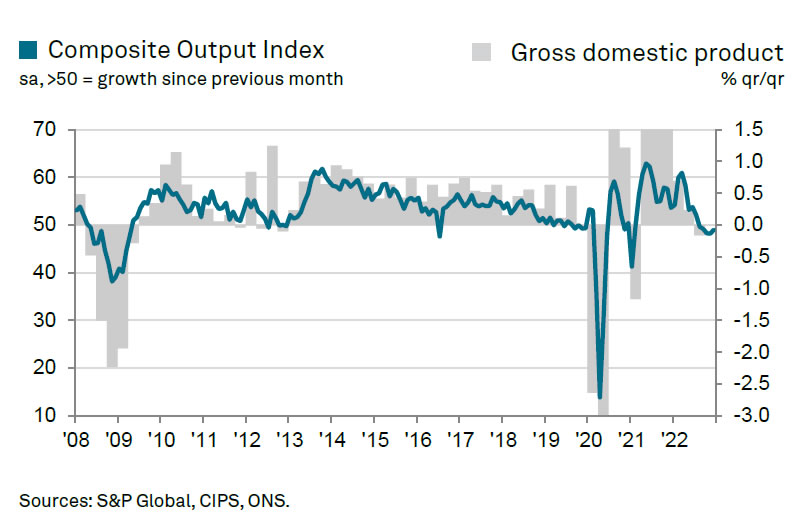
UK PMI Services was finalized at 49.9 in December, up from November's 48.8. S&P Global said fractional fall in activity was recorded at the end of 2022. Inflation rates were down but still high. Employment was unchanged, ending long period of jobs growth. PMI Composite was finalized at 49.0, up from prior month's 48.2.
Tim Moore, Economics Director at S&P Global Market Intelligence:
"Around 40% of the survey panel expect a rise in business activity over the next 12 months, while 16% forecast a decline. Survey respondents commented on squeezed disposable incomes, elevated recession risks and a housing market downturn as key factors likely to constrain demand in the year ahead.
"Although service providers widely noted concerns about global economic headwinds and stubbornly high inflation, there were also many reports citing positivity about factors within their control, including forthcoming product launches, expansion into new markets and planned business investment."
AUDUSD Consolidates After 200-day SMA Curbs Advance
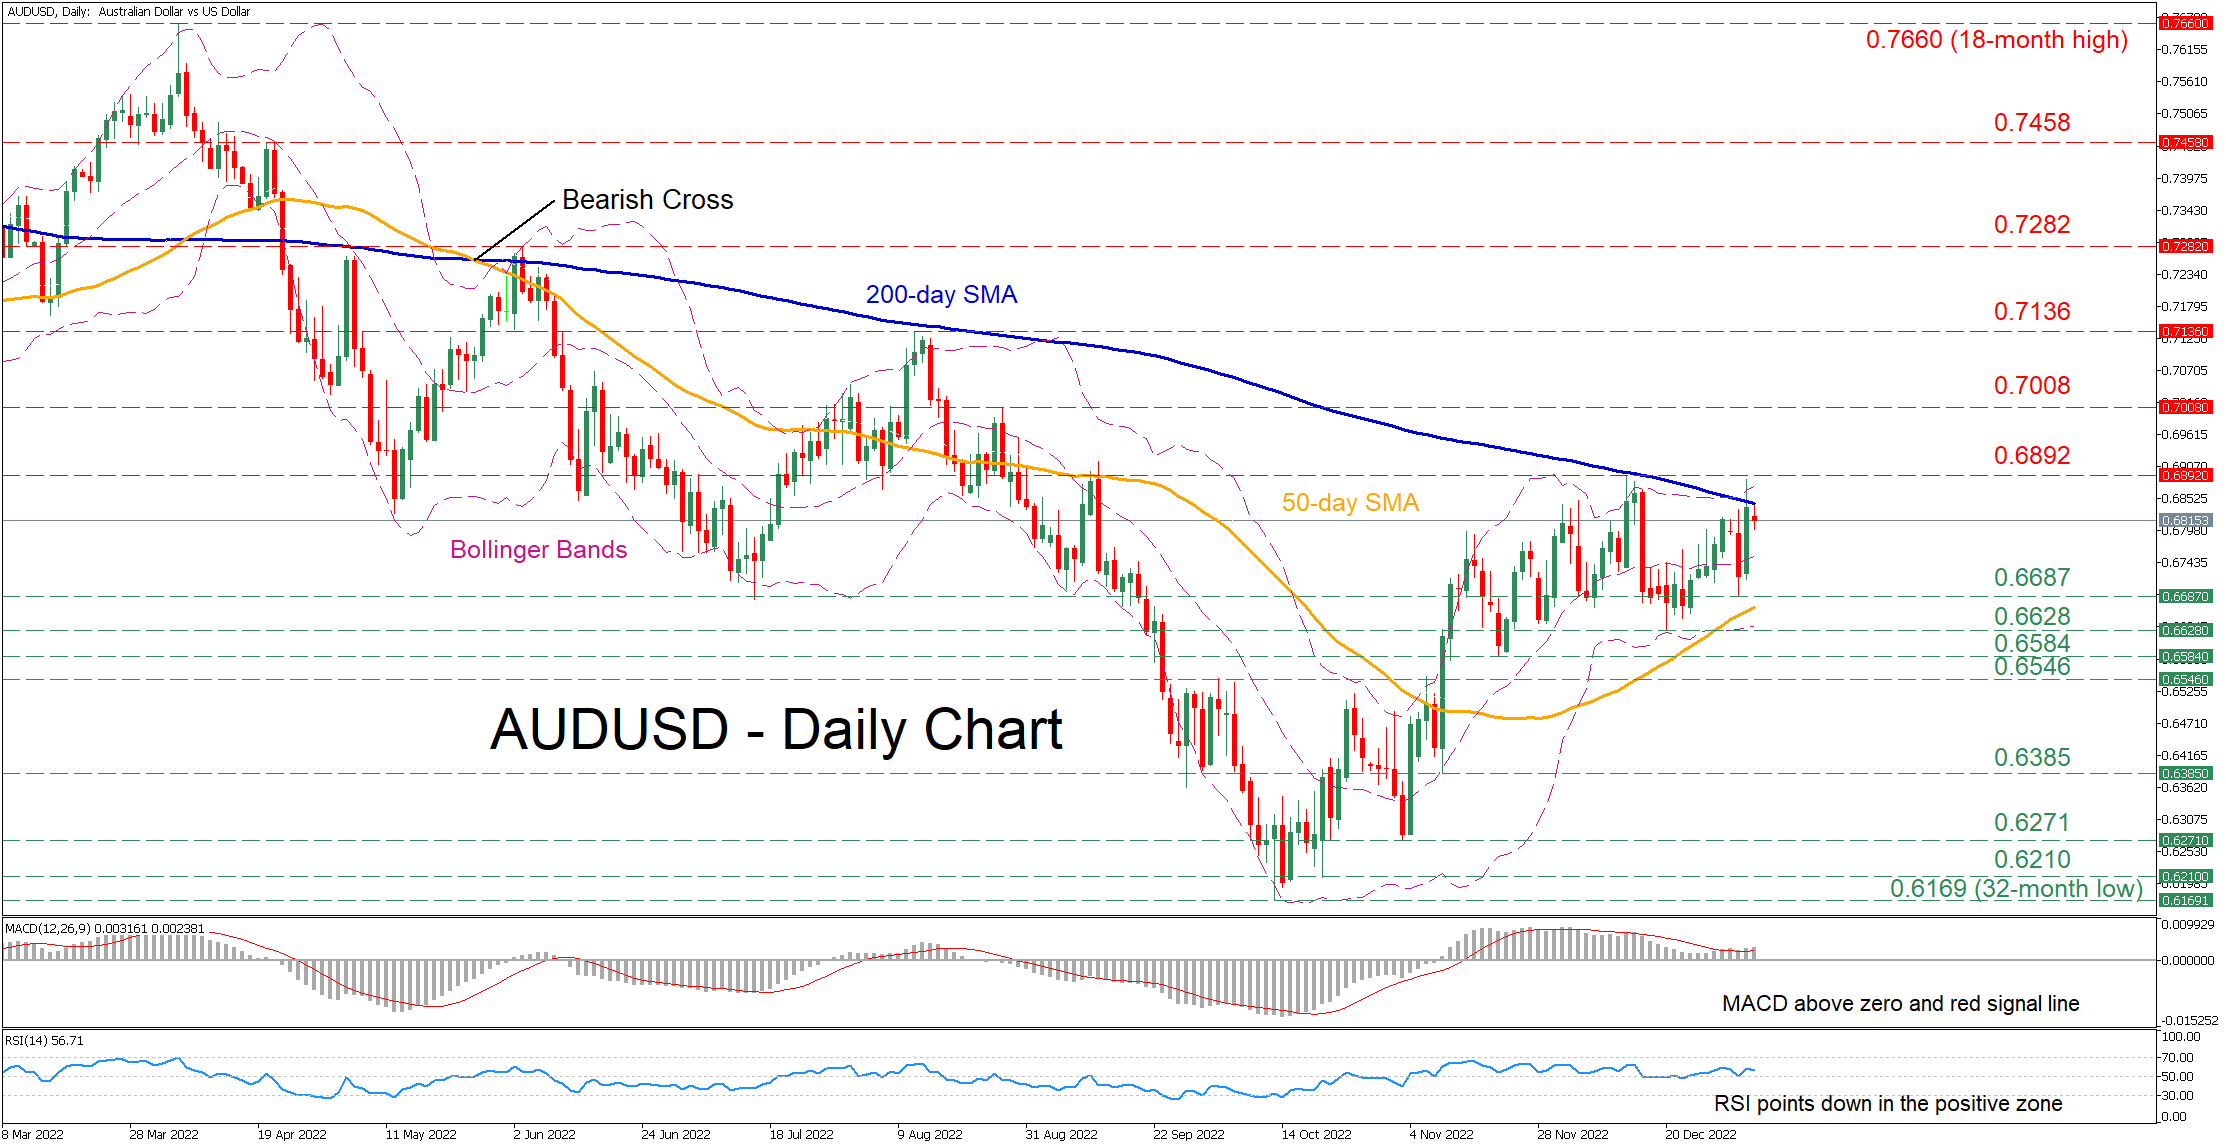
AUDUSD has been in a recovery mode since mid-October when its long-term downtrend hit a bottom at the 32-month low of 0.6169. However, the pair's rebound appears to be fading as the price has been constantly held down by the 200-day simple moving average (SMA).
The momentum indicators currently suggest that bullish forces are subsiding but remain in charge. Specifically, the MACD histogram is holding above both zero and its red signal line, while the RSI is pointing downwards in the positive territory.
If the positive momentum strengthens and the price crosses above the 200-day SMA, the recent high of 0.6892 could prove to be the first resistance point. Piercing through that zone, the bulls might aim for 0.7008 before the spotlight turns to the August peak of 0.7136. Any further advances could then cease at the June high of 0.7282.
Alternatively, should the pair reverse lower, the recent support of 0.6687 could act as the first line of defense. Diving beneath that zone, the price might decline to test the December low of 0.6628. Should that floor collapse, the 0.6584 region may then provide downside protection.
Overall, AUDUSD seems to be in a consolidation mode as the 200-day SMA has repeatedly capped its upside. Therefore, a successful close above that crucial barrier could spark an upside rally.